Article

Time Series Analysis of Land Cover Change Using Remotely Sensed and Multisource Urban Data Based on Machine Learning: A Case Study of Shenzhen, China from 1979 to 2022

1
School of Computer Science and Technology, Dongguan University of Technology, Dongguan 523808, China
2
MNR Key Laboratory for Geo-Environmental Monitoring of Great Bay Area & Guangdong-Hong Kong-Macau Joint Laboratory for Smart Cities & Guangdong Key Laboratory of Urban Informatics & Shenzhen Key Laboratory of Spatial Smart Sensing and Services, Shenzhen University, Shenzhen 518060, China
3
School of Artificial Intelligence, Shenzhen Polytechnic, Shenzhen 518055, China
*
Author to whom correspondence should be addressed.
Remote Sens. 2022, 14(22), 5706; https://doi.org/10.3390/rs14225706
Submission received: 17 October 2022 / Revised: 30 October 2022 / Accepted: 7 November 2022 / Published: 11 November 2022
(This article belongs to the Section Urban Remote Sensing)

Abstract

:
Shenzhen has experienced rapid urbanization since the establishment of the Special Economic Zone in 1978. However, it is rare to witness high-speed urbanization in Shenzhen. It is important to study the LUCC progress in Shenzhen (regarding refusing multisource data), which can provide a reference for governments to solve the problems of land resource shortages and urban expansion spaces. In this paper, nine Landsat images were used to retrieve land cover maps in Shenzhen, China, from 1979 to 2022. The classification method is based on support vector machines with assistance from visual interpretation. The results show that the urban area increased by 756.84 km2, the vegetation area decreased by 546.27 km2, the water area decreased by 132.95 km2, and the bare area decreased by 77.62 km2 in the last 43 years of our research region. Urban sprawl starts from the Luohu district, then propagates to Futian, Nanshan, and Yantian districts, and finally expands to other outlying districts (Baoan, Longgang, Guangming, Dapeng, and Pingshan). The spatial–temporal characteristics and the impact factors of urbanization were further analyzed. The visualization of land cover changes based on a complex network approach reveals that the velocity of urban expansion is growing. The coastline distributions were retrieved from nine observation times from 1979 to 2022; the results show that the west coastline changed more dramatically than the east and most of the east coastline remained stable, except for the parts near Yantian port and Mirs Bay, which experienced some changes. The impact factors of coastline changes are further discussed. Through a correlation analysis using urban data, such as transportation and socioeconomic factors, it was found that elevation and roads have strong constraints on the spatial patterns of a city’s expansion. There is exponential decay in the urban land increase against the distance to the roads, implying that traffic factors greatly determine urban land expansion. The turning point of the exponential decay is a distance of around 150 m. Time and population are highly correlated with land use development, indicating that urban land grows linearly with time and the population, which are important driving forces of urban land development. Compared with secondary and tertiary industries, the primary industry is less related to urban land use in Shenzhen.

Graphical Abstract

1. Introduction

The land is a resource that we rely on for survival in the world. Land use/cover is the result of the interaction between human activities and nature processes [1,2]. Land use/cover change (LUCC) can directly impact biological species diversity [3,4,5,6], climate change [7,8,9,10,11], and the ecological system [12,13,14,15,16], and describe human–environment interactions [17]. Moreover, it influences the social, economic, and political lives of humans [18,19,20,21].
At present, due to the rapid advancement of urbanization, the relative change rate of land use is accelerating under the influence of regional development and urban–rural integration policies [22,23,24,25,26]. Because of rapid land development, human activities have become major factors for LUCC [23,27,28]. Some critical problems, such as global warming, ecological deterioration, and resource shortages have, consequently, been researched [29,30,31,32]. How to improve the sustainable use of land sources has become a critical problem throughout the world [33,34]. The research on LUCC can help us understand the situations and mechanisms of land environments [23,35,36,37]. This research has important implications on the rational use of land resources and the reconciliation of socioeconomic development and ecological systems [38,39,40]. In the 1990s, the International Geosphere-Biosphere Programme (IGBP) and the International Human Dimension Programme IHDP jointly launched a project on LUCC. The implementation of this plan has greatly enhanced the theory and method in this field [41]. Moreover, the technologies in remote sensing and geographic information systems provide abundant data and analysis tools for LUCC research [40,42,43,44,45,46]. There have been many studies in this field, most of which focus on LUCC monitoring [47,48,49,50], mechanisms [51,52], modeling [34,53,54,55,56], and prediction [57,58,59,60]. In order to reveal the evolution of LUCC progress and provide references for future regional urban planning, it is necessary to research long-term LUCC change detection. For example, long-term LUCC monitoring in Czechia (i.e., since the 19th century) was studied using cadastral data, and the results showed a strong trend in the regional differentiation of long-term LUCC changes [61]; long-term (from 1977 to 2007) LUCC monitoring in Daqing city, China, was analyzed using Landsat imagery, and LUCC changes were modeled using system dynamics [54]; long-term (from 1976 to 2014) LUCC monitoring of the modern Yellow River Delta in China was studied using Landsat images, and the results showed the transfer processes of different land types [62]. However, most studies explored LUCC progress from certain angles of land type changes, ignoring the integrality of the land use system and the correlation between land use and other factors scientifically.
Shenzhen is the first Special Economic Zone in China’s reform and opening-up process. Since the establishment of the Special Economic Zone in 1978, Shenzhen has experienced rapid urbanization [63,64,65]. However, the high-speed urbanization of Shenzhen is rare to witness around the world. The corresponding land type change is dramatic, forming an ideal regional case for LUCC research. The development of remote sensing satellites in recent decades has offered good opportunities to capture this process. China is still in a period of rapid urbanization. Studying the spatiotemporal characteristics and mechanisms of Shenzhen’s LUCC has important implications, i.e., supporting the government in making relevant land policies. There are already some studies on LUCC in Shenzhen, including the LUCC character analysis [66,67,68], dynamic modeling [69,70], driver analysis [71,72,73], and prediction [74,75]. Some studies were conducted in the early stages and, therefore, the LUCC of Shenzhen in the 21st century has not been covered [70,71]. Some work focused on the modeling method, such as model improvement and precision validation [69,70]. Some only used two images; the time series of LUCC cannot be captured [66,71].
Therefore, the purpose of this paper is to describe the spatiotemporal characteristics of the LUCC progress in Shenzhen and analyze the correlation between urban land changes and other factors in the past 43 years. Our primary questions are: what are the spatiotemporal characteristics of LUCC progress in Shenzhen (since China’s reform and opening-up began)? Do the land type and spatial configuration in Shenzhen converge toward a certain trend? What were the spatial characteristics of urbanization in Shenzhen during that period? How has coastal Shenzhen changed due to the acceleration of the urbanization process? Are urban data, such as transportation and socioeconomic factors, highly correlated with urban land changes? This present study retrieved Shenzhen land cover maps from nine time points from 1979 to 2022. We took advantage of the complex network approach to analyze land use changes from an overall perspective. A complex network approach was widely used in various fields, such as brain networks, social networks, transportation networks, regional innovation networks, disease transmission networks, social relationship networks, and industrial cluster networks [76,77,78]. In LUCC fields, the complex network approach can be a very appropriate tool for analyzing the LUCC process, such as the structural characteristics of land use and the relationships between the individual land type behaviors [62]. Moreover, a complex network with weights and directions was built to distinguish the key land use types and different conversion relationships of the LUCC progress [79]. Meanwhile, the correlations between urban expansion and some natural and socioeconomic factors were investigated.

2. Data and Methodology

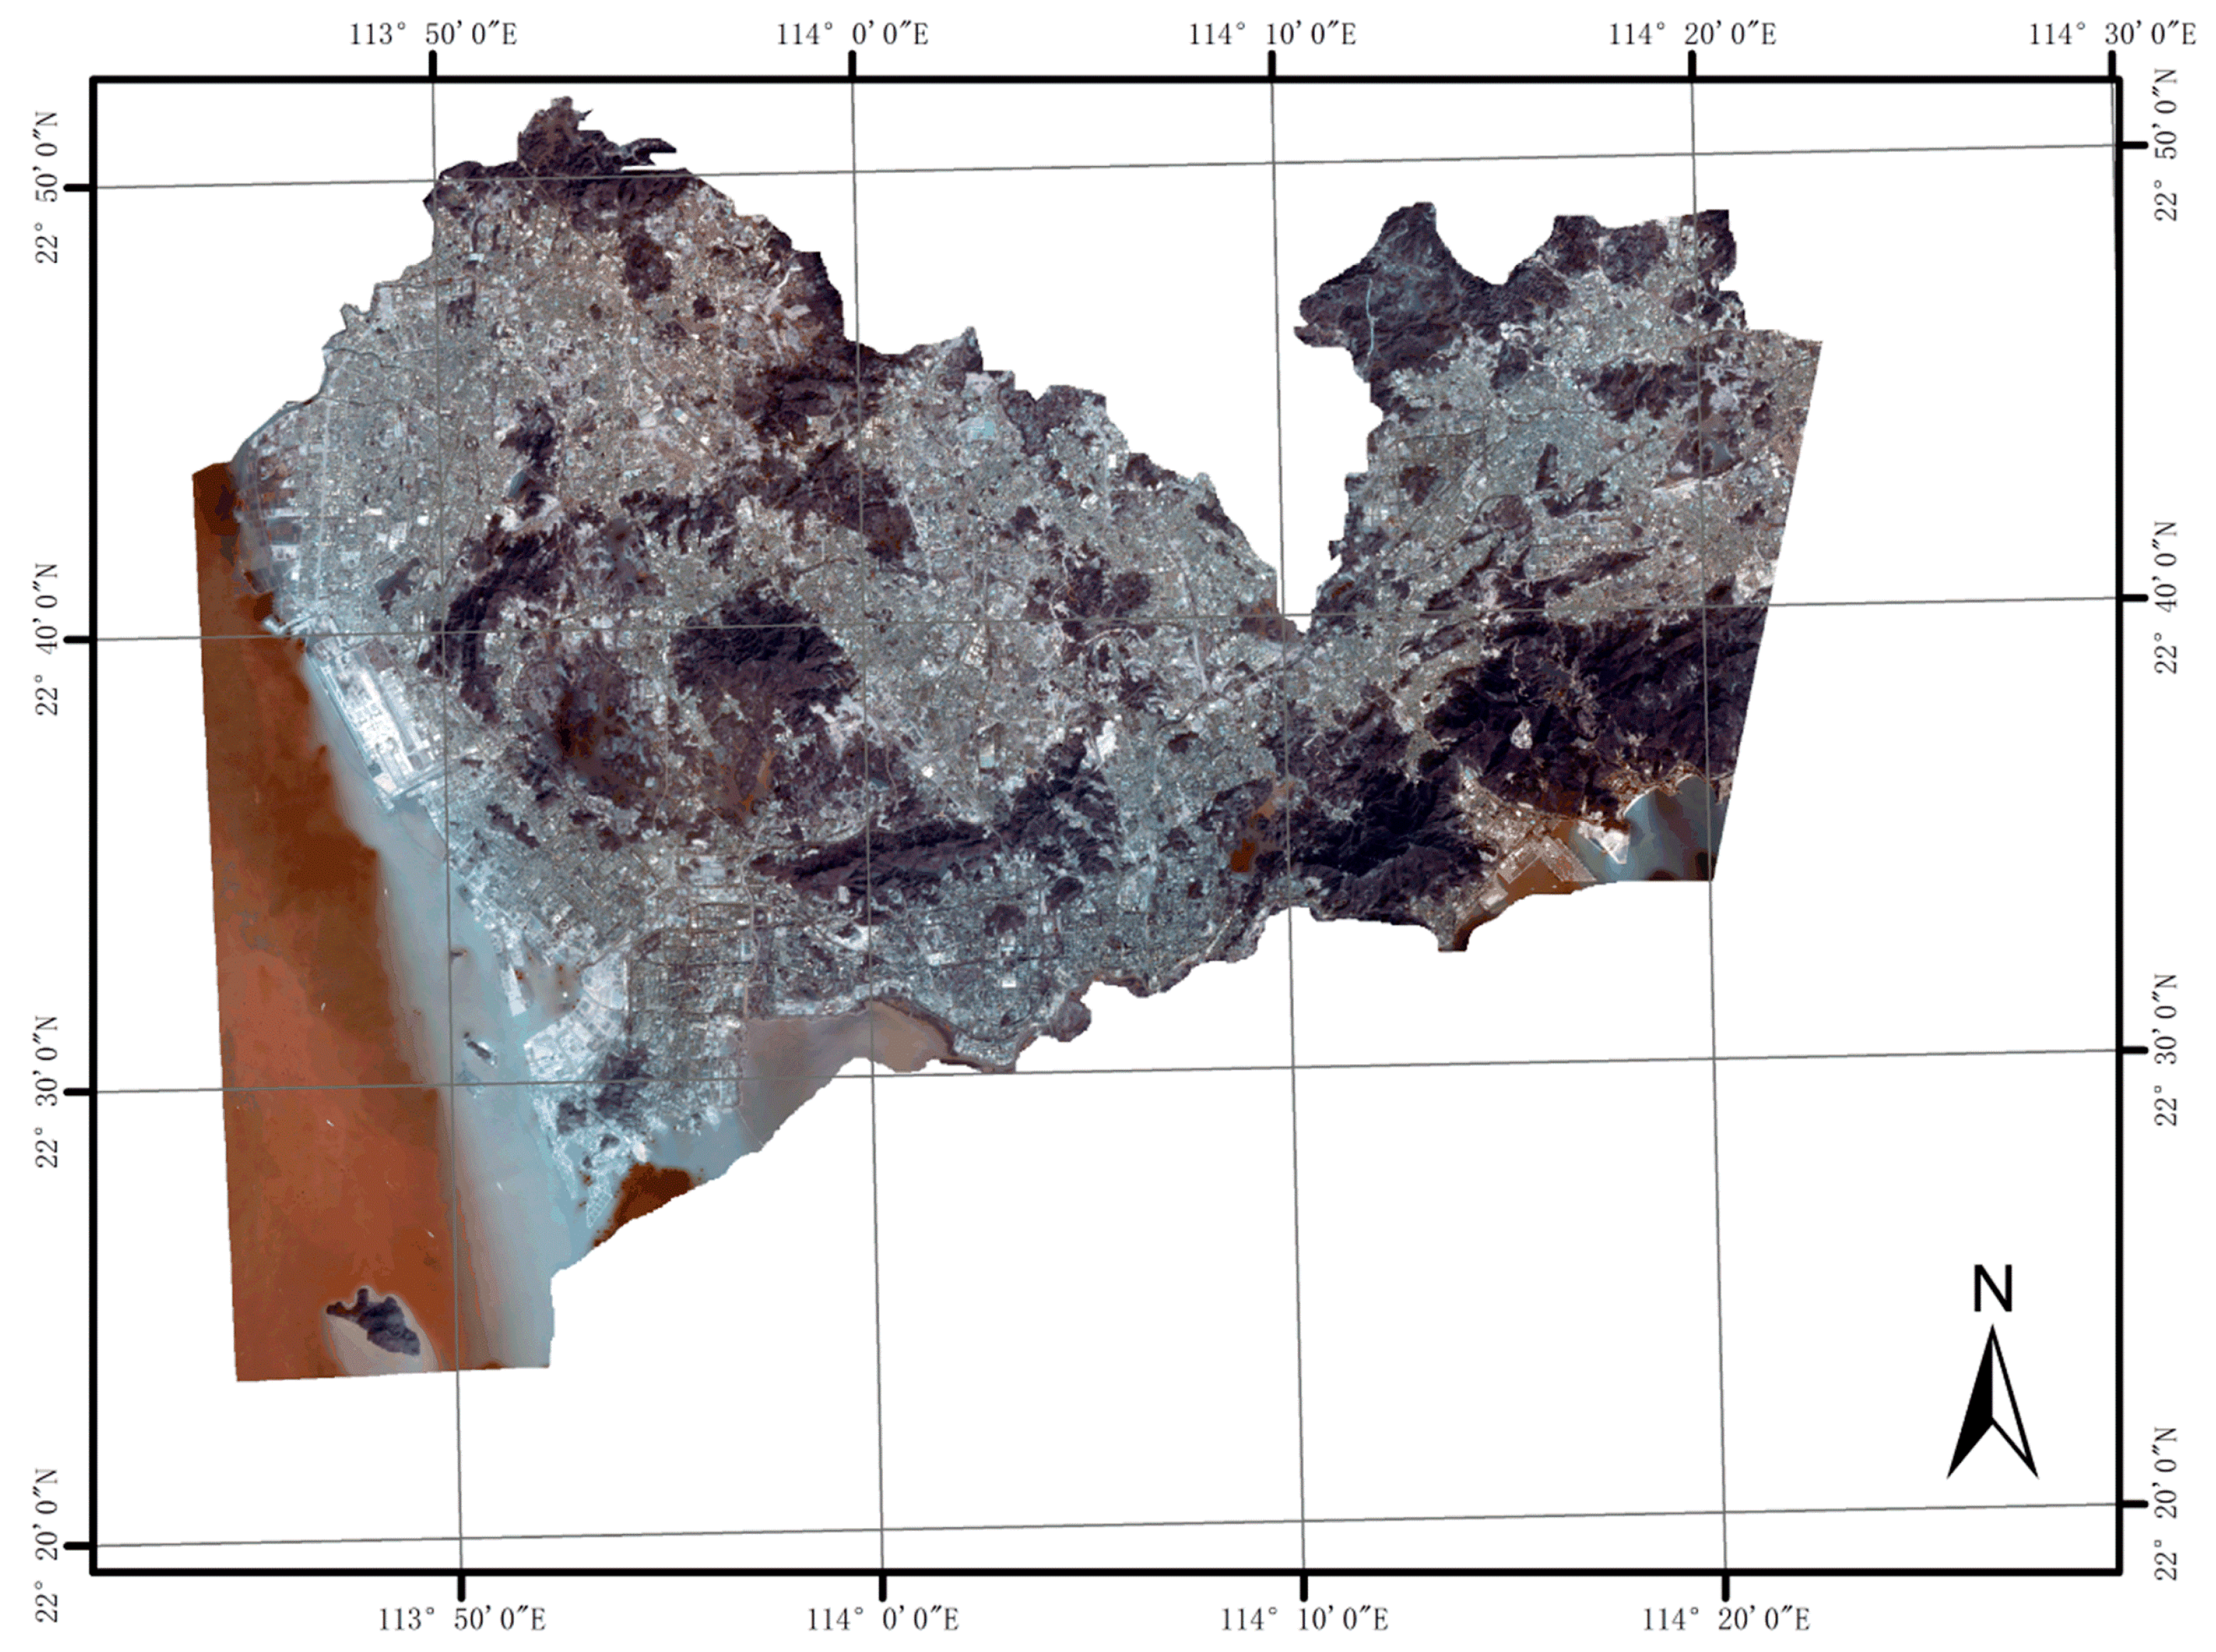
2.1. Study Area and Data

Our study area is Shenzhen city in Guangdong province of southern China (Figure 1), located on the east coast of the Pearl River Delta, bordering Hong Kong to the south, Dongguan to the north, and Huizhou to the northeast. Shenzhen is a global center for research, technology, manufacturing, commerce, finance, tourism, and transportation, and the Port of Shenzhen is the fourth busiest container port in the world [80,81,82]. Shenzhen features a subtropical monsoon climate, and the weather is relatively moderate with an annual average temperature of 23.0 °C. The northwestern terrain is lower than the southeastern part. Most areas are covered by low hills. The coastal areas in Baoan and Nanshan districts compose a part of the Pearl River delta plain. The research region covers most of Shenzhen city and some surrounding waters.
After rapid development in Shenzhen in recent decades, its economic aggregate has increased from 196 million in 1979 to 3066 billion in 2021, ranking third among Chinese cities. During this period, the permanent population has grown rapidly from 314,000 to 17.68 million in 2021 [82], ranking sixth among Chinese cities. However, the land area of Shenzhen ranked 330th among Chinese cities. Shenzhen has the highest population density in China, with 7173 people per square kilometer [82]. The high population density has brought about heavy pressure on the environment.
The data used in our study include the Landsat MSS/TM/ETM/OLI images (Table 1) [83], Shenzhen socioeconomic data [82], and Shenzhen road network data. We used 9 Landsat images, covering 1979 to 2022. In general, the remote sensing images at the start or end of the growing season are optimal, when it is relatively easy to distinguish land type, especially in southern China [84,85]. Therefore, most of the Landsat images without clouds were selected around November of that year. The Landsat images were already preprocessed by geometric correction.

2.2. Classification System

We grouped the land cover in Shenzhen into four classes (vegetation, urban land, water, and bare land). The spectral characteristics of the TM image are shown in Figure 2.
We can see that the four land classes differ greatly from each other in the seven spectra bands. For vegetation, the near-infrared band (band 5) has the largest DN value among all bands. The difference between it and the visible bands (bands 1–4) is very significant. The spectrum of urban land is not dominated by the near-infrared band. Water can absorb electromagnetic waves and, therefore, the values in most bands are lower than other classes, except the values in some bands (bands 1–4) are higher than that of vegetation. Bare land has larger values in most bands than others, except for bands 1–2. In the standard false-color image, vegetation, urban land, water, and bare land appear to be red, celadon, black–blue, and white, respectively. So, they can be distinguished clearly in Landsat images. In some studies, vegetation is further divided into subclasses, such as forest land, wetland, orchard, and grassland [86]. We also compare the spectra of wetland and grassland in the Landsat TM image and find that their characteristics are very close (Figure 2). Additionally, the Landsat MSS sensor only has four bands, which makes it more difficult to distinguish them. In order to ensure the reliability of classification results, we decided to not divide vegetation into subclasses.

2.3. Method

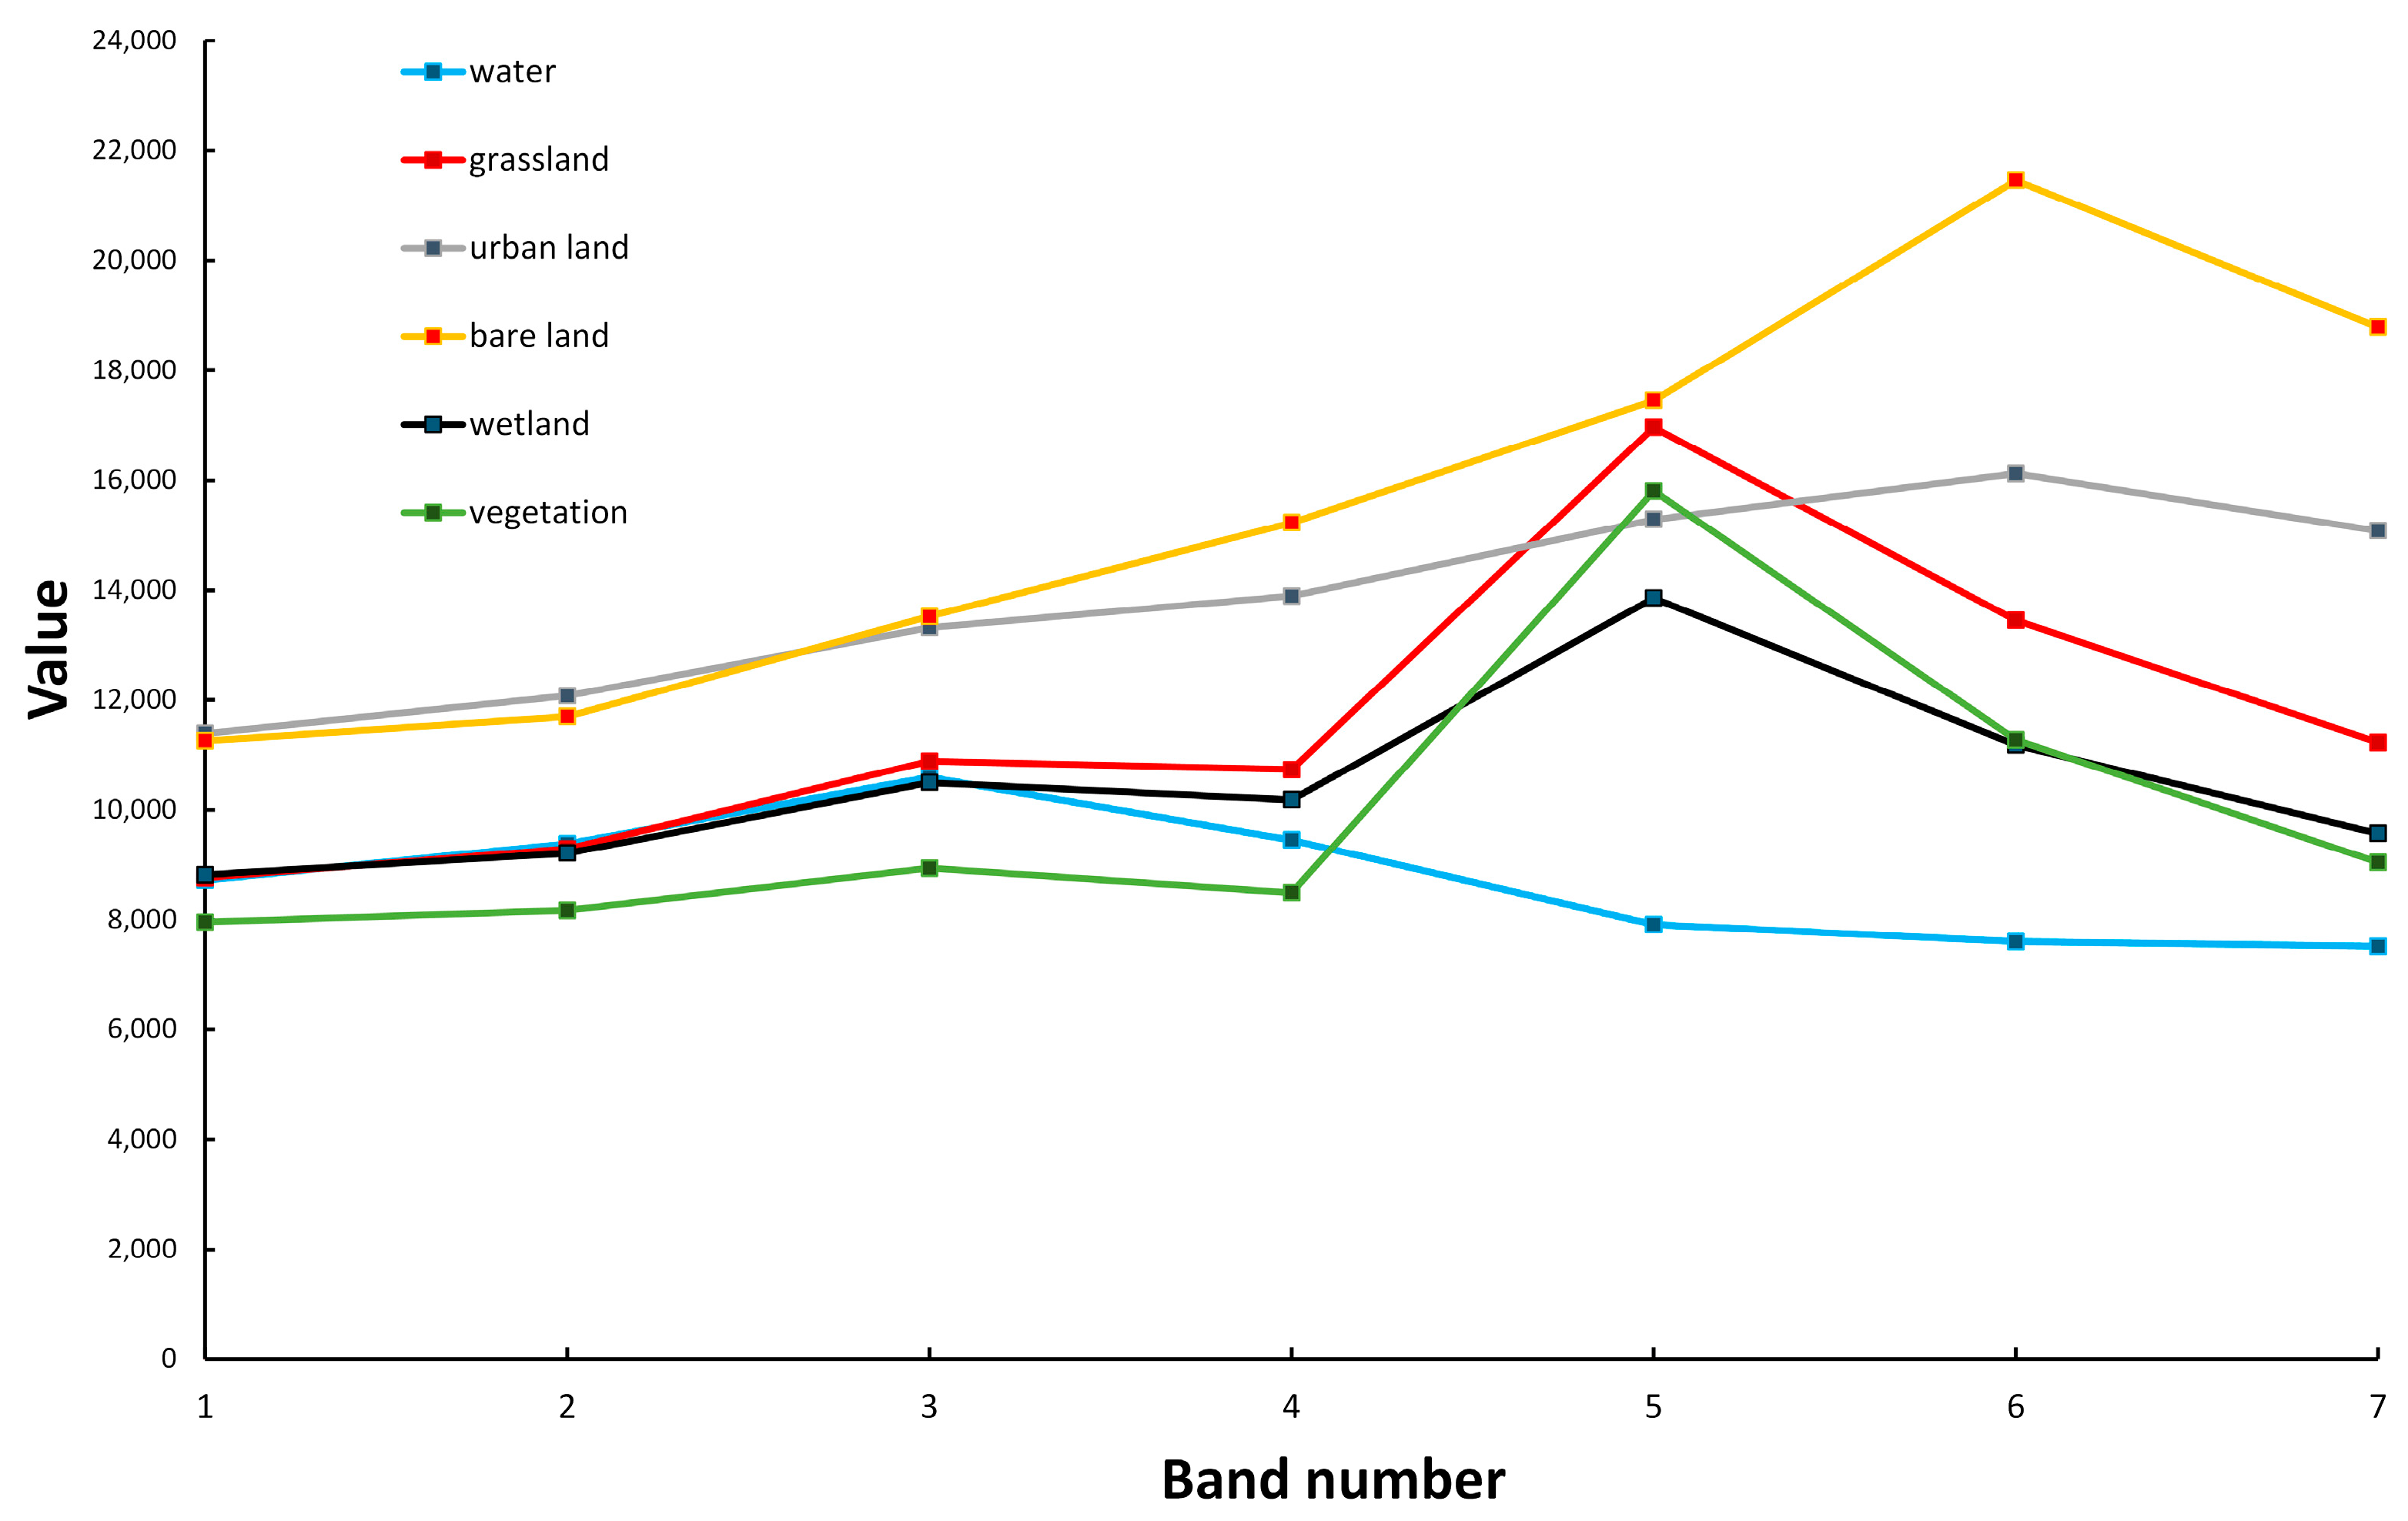
2.3.1. Land Use Classification

With the development of remote sensing techniques, there are already a number of classification methods, such as decision tree [87], k-nearest neighbor [88], maximum likelihood [89], and artificial neural network [90]. Most of these methods are based on pixel-based spectral features and ignore the characteristics of high-scoring remote sensing images (i.e., the rich textures and shapes). A support vector machine (SVM) is a machine learning method based on the statistic studying theory, which has satisfactory performance in a situation with limited training samples. A SVM is a supervised non-parametric statistical learning method, which can solve some classification problems existing in other methods, such as small samples, devilishly-learning, big dimensions, and the local minimum [91].
Previous studies have compared SVMs with maximum likelihood and artificial neural networks in the classification of Landsat ETM+ images [92,93,94]. The results revealed that SVMs outperformed other methods in terms of better land-use classification precision. We also tested other methods in our study. After visual interpretations of their results, we found that SVMs can provide results closer to real situations. So, we adopted the SVM method to classify the Landsat images in our study. SVM algorithms use a set of mathematical functions defined as kernels. The function of the kernel is to take data as input and transform them into the desired forms. Different types of kernel functions are used in different SVM algorithms. Since different kernel functions have different characteristics, the classification effects caused by them will also be different. The common kernel functions include linear, polynomial, sigmoid, and Gaussian.
Linear kernel:
K x i , x j = x i T x j
Polynomial kernel:
K x i , x j = ϒ x i T x j + α d , ϒ > 0
where d is the degree of the polynomial, ϒ is set as the reciprocal of the band number, and α is the offset of the polynomial kernel.
Sigmoid kernel:
K x i , x j = t a n h s x i T x j + α
where s is the slope of the sigmoid kernel, α is the offset of the sigmoid kernel.
Gaussian kernel:
K x i , x j = e ϒ | | x i x j | | 2 , ϒ > 0
Previous studies have compared the different kernel functions used in SVMs [95,96,97]. The results show that the SVM model with the Gaussian kernel function has the highest performance. We also tested these kernel functions in our study. After a visual interpretation of their results, we found that the Gaussian kernel can give results closer to a real situation. Based on the above analysis, we adopted the SVM model with Gaussian kernel to classify the Landsat images in our study.
In the Landsat image series of Shenzhen, the one captured in 1990 was influenced greatly by the clouds over the southern coastal areas. The clouds were often mistakenly classified as rare land even though the land cover under clouds might belong to vegetation, water, or urban land. The automated classification method cannot give a satisfactory solution to such a problem. In order to ensure classification accuracy, manual intervention was implemented on the classification. We corrected the affected areas using visual interpretation, which is based on the assumptions of spatial and temporal continuity for landscapes. The classes for cloud-covered areas were then inferred from their surrounding landscapes or the classes for them at different times.

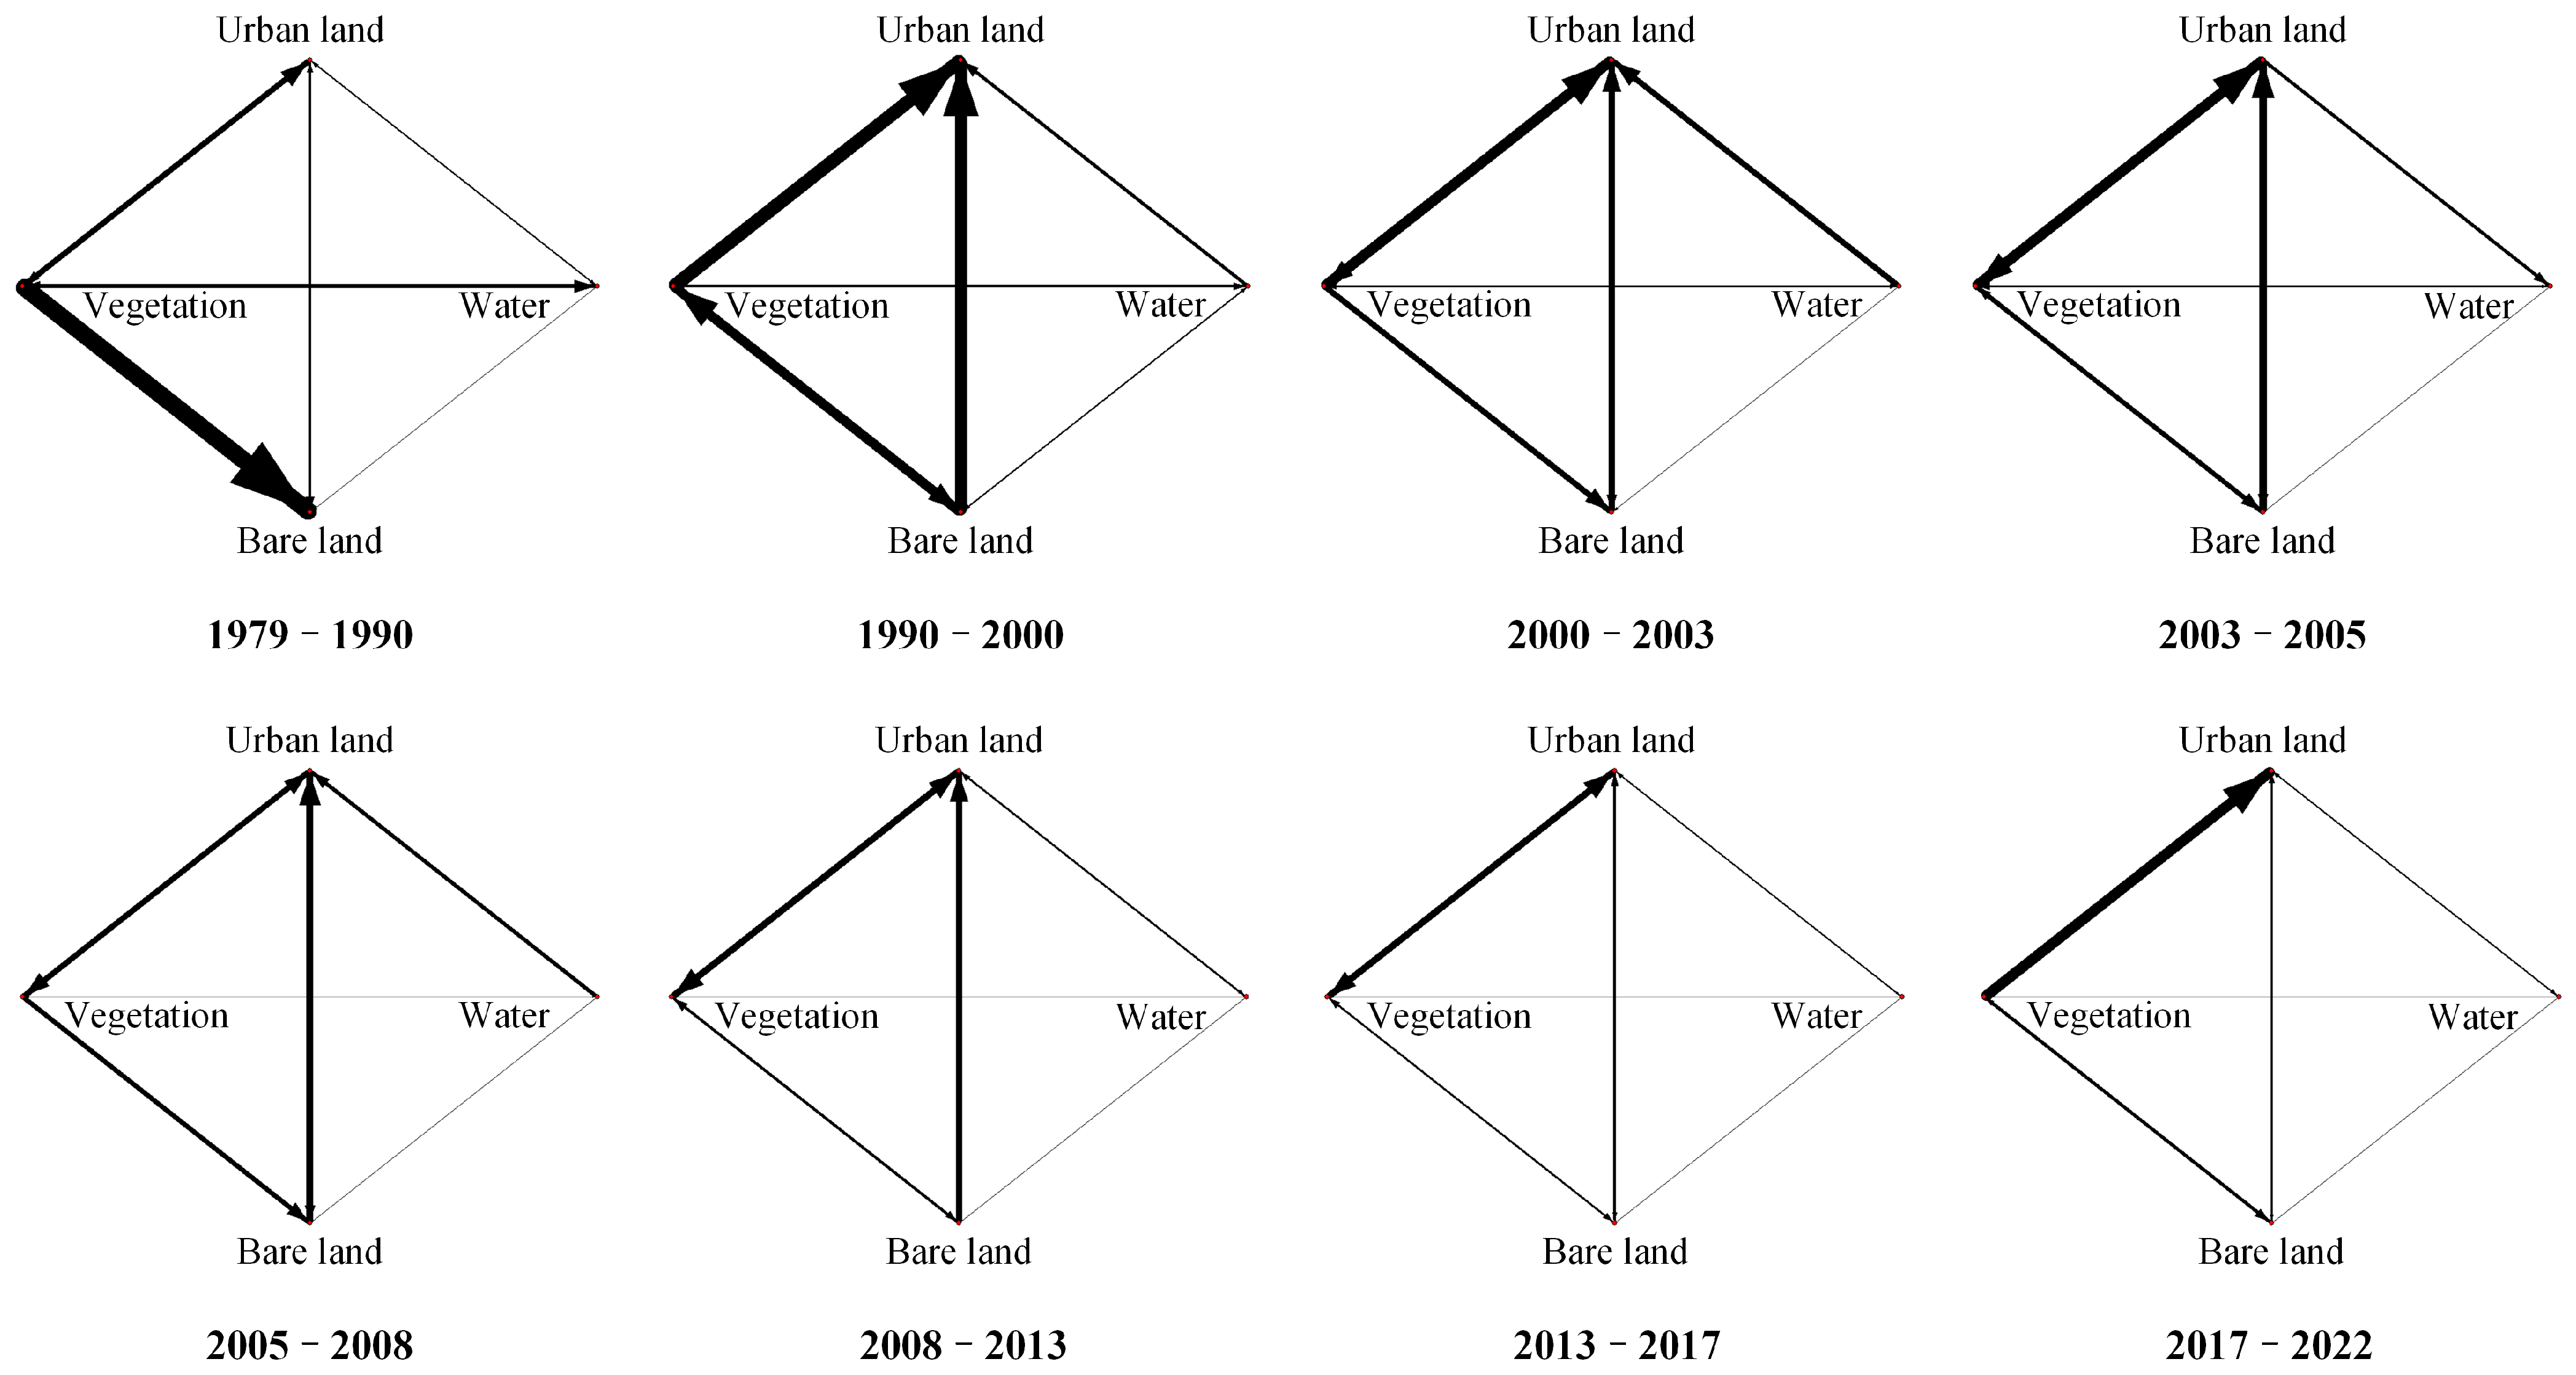
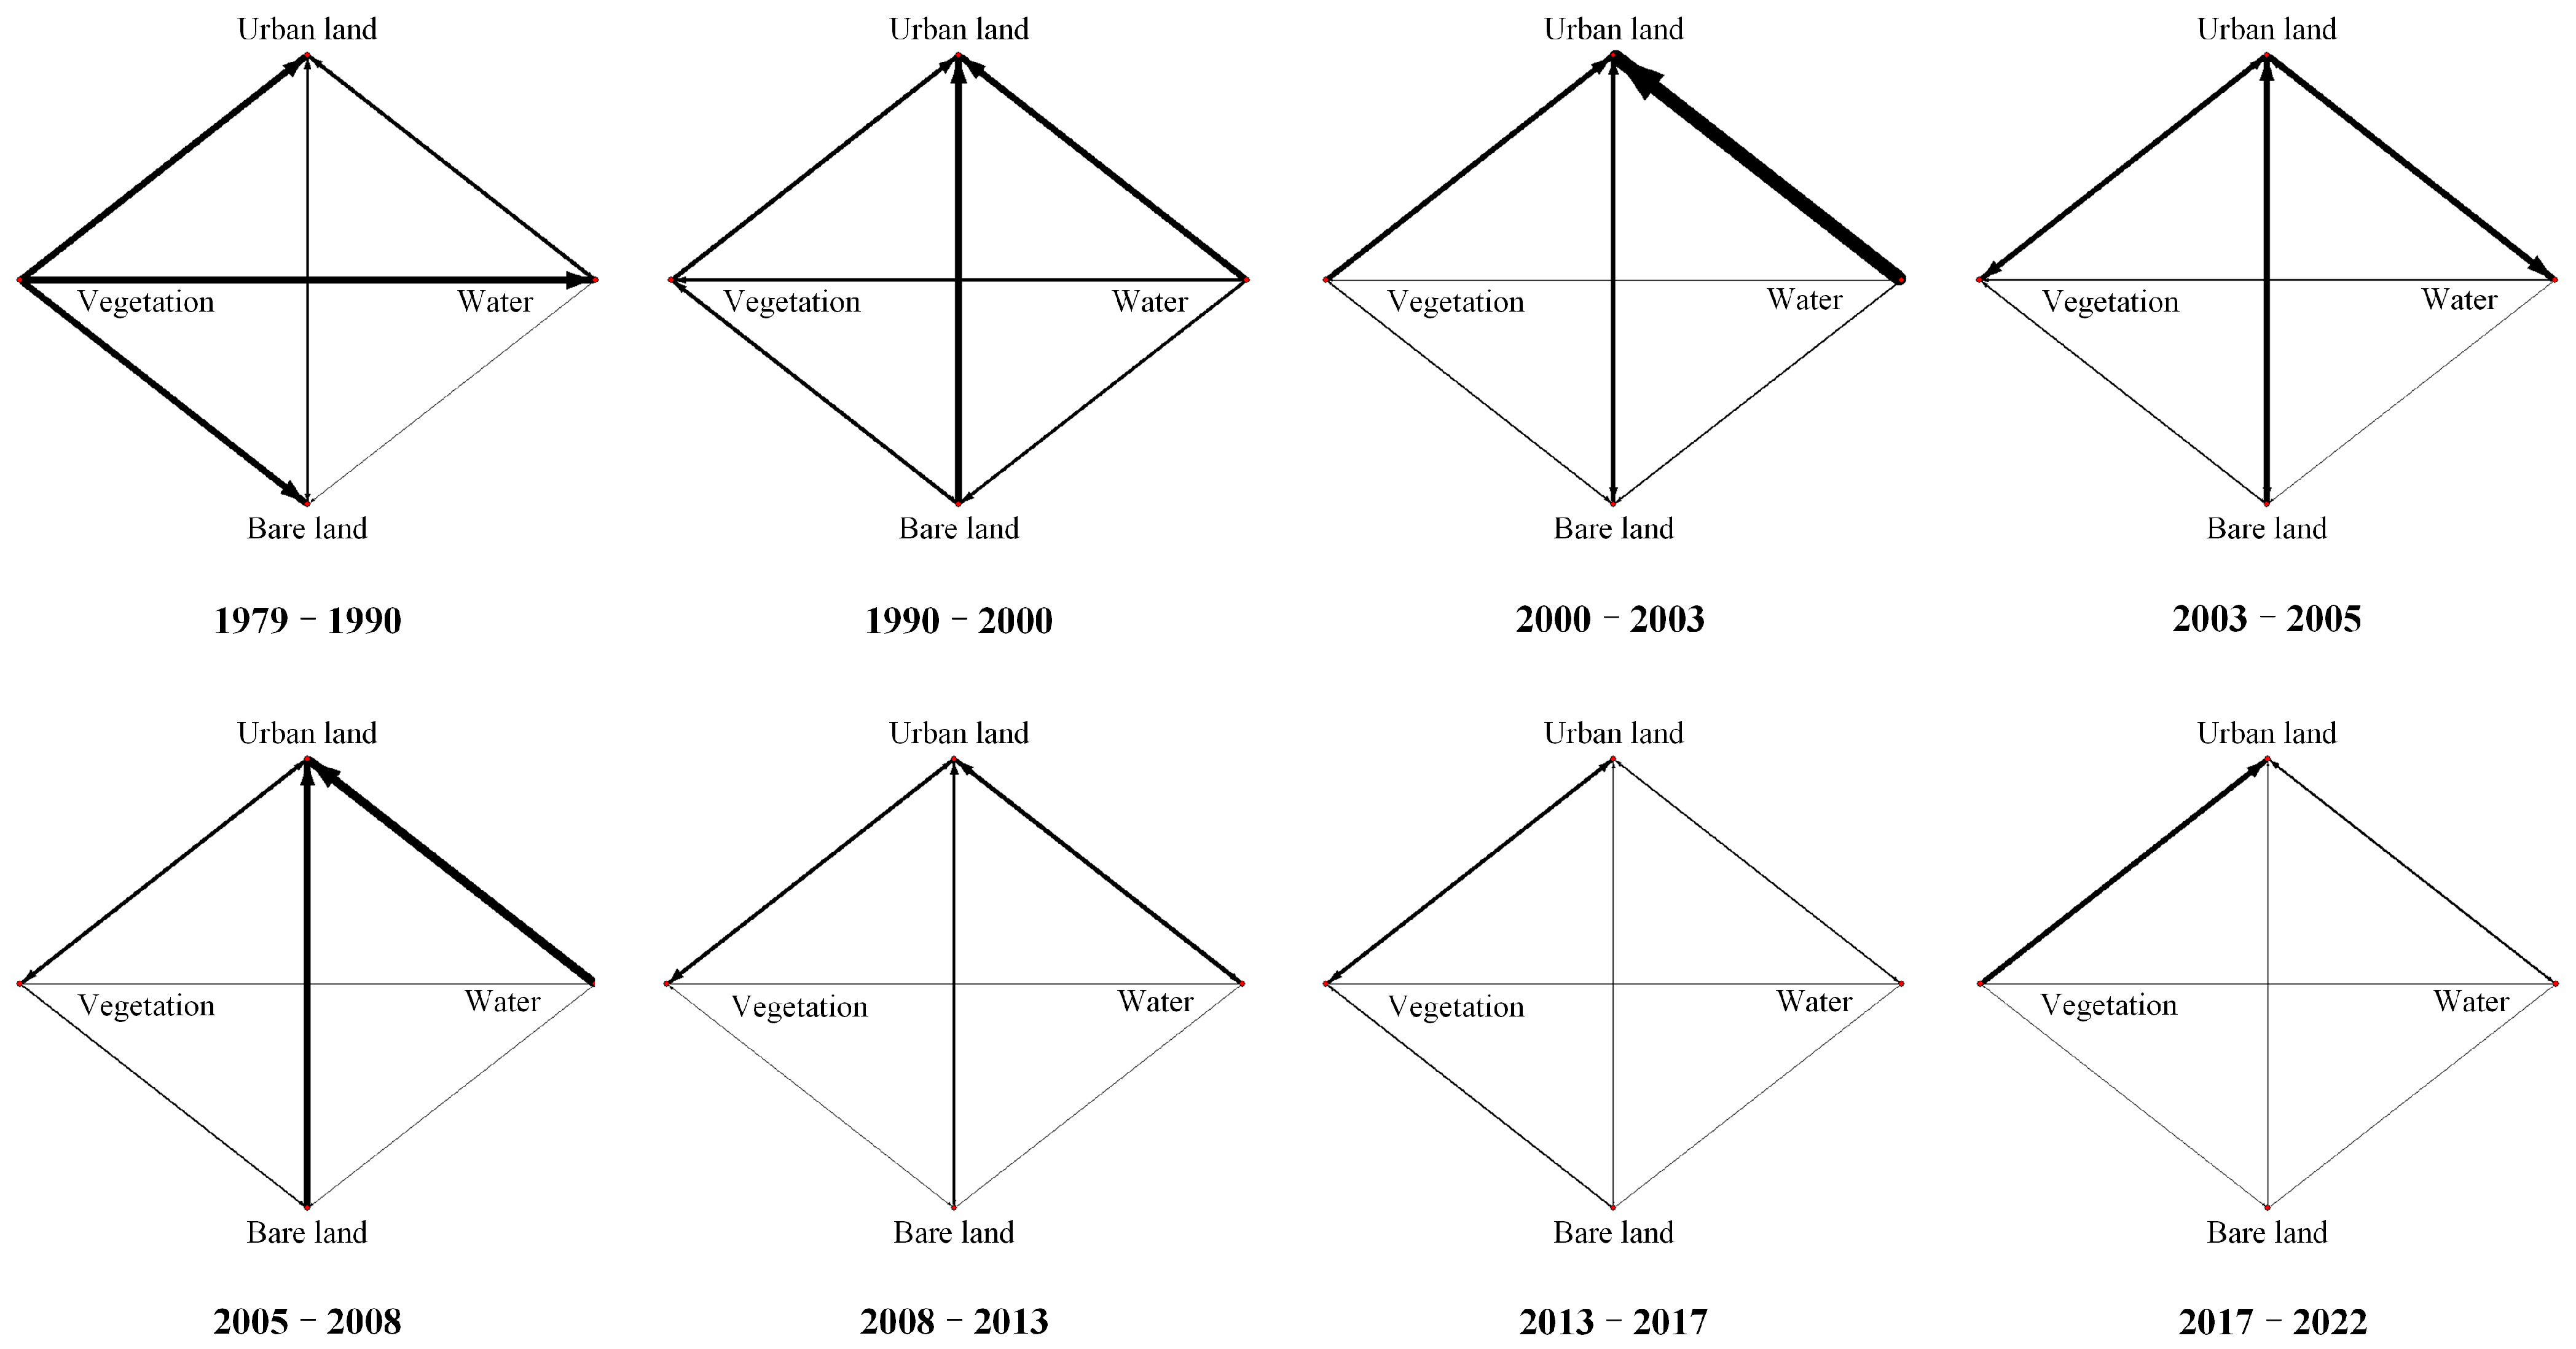
2.3.2. Complex Network of LUCC Progress

A complex network with weights and directions was composed of two parts: nodes and connection edges. The nodes of the network in the LUCC progress were the land use types, and the connection edges of the network were the conversion relationships between land use types. The transfer matrix of the LUCC progress can directly reflect the conversion relationships between land use types in different periods. The transfer matrix of the LUCC progress is shown in Equation (5):
L i j = L 11 L 12 L 1 n L 21 L 22 L 2 n L n 1 L n 2 L n n
where i is the land use type before the transfer, j is the land use type after the transfer, and L i j is the transfer value from land use type i to j . In the transfer matrix, every column reflects the transition values from other land use types to land use type j , and every row reflects the transition values from land use type i to other land use types.

2.3.3. Correlation Analysis Using Multisource Urban Data

Furthermore, we conducted a correlation analysis between urban land data and multisource urban data, such as transportation data and socioeconomic data, respectively. The transportation data mainly included the road network map data of Shenzhen city. The socioeconomic data mainly included population, gross domestic product (GDP), the primary industry, secondary industry, and tertiary industry in nine corresponding years. The socioeconomic data mainly came from Shenzhen’s statistical yearbook [82]. In order to find the relationship between the road network and urban land change, we overlapped the road network map and the urban land expansion map. Meanwhile, through the correlation analysis between urban land and socioeconomic data, we speculated the main impacting factors and driving forces for urbanization in Shenzhen.

3. Results

As described above, we classified the Landsat images based on SVMs with assistance from visual interpretation. We obtained nine land cover maps from 1979 to 2022 (Figure 3). They showed that Shenzhen experienced a rapid urbanization process and that urban land expanded significantly during this period. Then, we conducted a statistical analysis of the land cover change (Table 2). We found that urban land increased by 743.3% from 101.82 km2 in 1979 to 858.66 km2 in 2022, and there was an acceleration in the rate of urban land growth from 1979 to 2003; in particular, the rate of urban land growth averaged 62.95 km2 per year in 2000–2003. However, the growth fell in 2005 and slightly upgraded in 2008. After that, the growth fell again in 2017 and increased in 2022. This reveals that rapid urbanization at the early stage excessively used land resources. When urban land achieves a certain level, the urbanization speed will gradually decrease.
In contrast to the increase in urban land, the vegetation area decreased yearly but at a fluctuant rate. The vegetation area decreased by 48.28% from 1131.36 km2 in 1979 to 585.09 km2 in 2022. We found that there was an acceleration in the rate of the vegetation area decline from 1979 to 2003, in particular, the vegetation dropped by 10.19% from 2000 to 2003 with a loss of 36.49 km2 per year. This shows that urbanization in Shenzhen is implemented at a cost of vegetation reduction.
The water area types in our study region included reservoir, river, and sea. Table 2 shows the water area decreased by 24.44% from 543.88 km2 in 1979 to 410.93 km2 in 2022. The water areas exhibited a decreasing trend for most years in this period, with the exception of 1990, 2005, and 2022. During this period, the water area dropped by 13.52% from 2000 to 2003 with a loss of 30.26 km2 per year. The sea areas decreased due to the reclamation activity, but the reservoir areas increased because of the artificial expansion that supported the increasing population in Shenzhen. This suggests that reclamation activity is the main factor that affects the water area in Shenzhen. In contrast to the other three land types, bare land showed no significant trend at this time. Bare land presented a decreasing trend in this period, with the exception of 1990, 2003, 2008, and 2022. We found that bare land increased by 114.86% from 1979 to 1990 with a gain of 13.57 km2 per year. However, bare land decreased by 52.86% from 1990 to 2000 with a loss of 14.76 km2 per year.
When investigating the spatial characteristics of urbanization based on Figure 3 and Figure 4, we found that most urban expansions from 1979 to 1990 in Shenzhen radiated from the Luohu port (the first border crossing between Shenzhen and Hong Kong), and then gradually propagated outside. Some slight independent expansions can be found around Shenzhen airport, Yantian port, and Shenzhen Bay. This reveals that the early development of Shenzhen was strongly relevant to its interaction with Hong Kong. The facilities construction (e.g., airport and port) related to trade and transit also contributed to the early urbanization characteristics in Shenzhen. Until 2005, urban land expanded to the west of the Luohu district and reached Futian and Nanshan districts.
At the same time, the urban land in coastal areas of Baoan district (Fuyong and Baoan centers), and some inland areas of Longgang district (Longhua and Longgang centers) increased. This suggests that urbanization during the ten years had fully permeated all central districts in Shenzhen, gradually transferring to outlying districts. The Tiegang reservoir and Xili reservoir experienced significant expansion, implying that the requirements for freshwater continued to increase during the Shenzhen development. Until 2013, the increase in urban land mainly occurred in the Baoan and Longgang districts. The land cover changes in the central districts were represented by the transformation from the sea area to urban land on Qianhai Bay and Houhai Bay, implying that urban land use in central districts had reached a critical point. Until 2022, the increase in urban land mainly occurred in Baoan, Longgang, and Pingshan districts; the land use changes of this period are still dominated by urbanization in outlying districts and reclamation in central districts, which can be regarded as a continuation of the previous process.

4. Discussions

4.1. Complex Network Analysis on Land Cover Change

The statistics of land cover change on a single class are not enough to represent the shift between different classes for the whole land cover system. Most studies use the transfer matrix to describe the characteristics of land cover changes among classes, but it is still not intuitive and easily understood. The complex network approach is an important method for the study of sociology and informatics [98], which has also recently been introduced to analyze land cover changes [99]. It can visually reveal the relationship between different land cover classes from an overall perspective. We took advantage of this method to describe the shift between different land cover classes in Shenzhen. Each node in the network represents a land use type. The line denotes the shift between two land types, and the arrow indicates the transforming direction. The transformation is represented by the thickness of the line and arrow. Figure 5 presents the complex network visualization of the land cover transformation between the nine observation time points. It can be clearly seen that the transformation from vegetation to bare land dominates the land cover changes during 1979–1990. Because bare land acts as the medium for turning vegetation into urban land, the urbanization of Shenzhen in this period can be characterized as the preparation for upcoming urban construction.
From 1990 to 2000, the transformation from bare land and vegetation to urban land dominated the land cover change. This suggests that bare land prepared before was transformed into urban land. During the ten years, many areas covered by vegetation quickly experienced two transformations, namely vegetation to bare land and bare land to urban land. This implies that construction velocity was much faster than the decade before. In the two periods (2000–2003 and 2003–2005), the land cover changes were only dominated by that transformation from vegetation to urban. The bare land medium during urban construction could hardly be witnessed, even though the time intervals were shorter than the two periods before. This reveals that the transformation from vegetation to urban became faster.
In the two periods (2005–2008 and 2008–2013), the transformation from bare land and vegetation to urban land dominated the land cover changes. This implies that the construction velocity was slightly slower during the 2008–2013 period than the 2008–2013 period. At the same time, the transformation from vegetation to urban was significantly slower than the decade before, implying that the velocity of urban expansion is decreasing over time with the reduction of available land resources. From 2013 to 2017, the land cover change was only dominated by the transformation from vegetation to urban. During this period, the transformation from bare land to urban land was slower, implying that the bare land prepared before was transformed into urban land. From 2017 to 2022, it can be clearly seen that the transformation from vegetation to bare land dominated the land cover change, and the transformation from vegetation to urban was slightly faster than the 2013–2017 period, implying that the velocity of urban expansion is growing over time.
The rapid urbanization of Shenzhen is also accompanied by the dramatic change in its coastline. After the visual interpretation of the Landsat images, we retrieved the coastline distributions from the nine observation times from 1979 to 2022 (Figure 6). During that period, Shenzhen started its rapid urbanization and industrialization process. With the rapid expansion of the urban construction land scale, the contradiction between man and land became increasingly prominent. Reclamation and land-building projects became the main means to solve the problem of land resource supply exhaustion in coastal zones, resulting in drastic changes in the shoreline in some areas. As shown in Figure 6, the west coastline obviously changed more dramatically than the east coastline, i.e., it kept extending outside during the observing period. However, most of the east coastline remained stable, except for the parts near Yantian port and Mirs Bay, which experienced some changes. Such asymmetry along the coastline resulted from its natural characteristics.
The west coastline is located to the east of the Pearl River Estuary. Most are silty coasts, providing favorable conditions for reclamation engineering. However, the east coastline is mainly composed of rocky coast, which is difficult for construction. The purpose of reclamation on the east coastline mainly involves the Yantian port construction. Conversely, the functions of the west coastline are more complex. On the Shajin–Xinan coastline, the reclamations mainly involve the mariculture zone expansion. On the central Qianhai Bay, the reclaimed lands are planned for various uses, including industry development, public facilities building, and port construction.
The Qianhai Shenzhen–Hong Kong Service Industry Cooperation Zone is located in the reclaimed land of Qianhai Bay. Shenzhen Bay lies on the east of Qianhai Bay. The reclaimed lands here are mainly used for building public facilities. Mangrove Park, Shenzhen Bay Park, and Overseas Chinese Town are all located there.
Based on the above analysis, we created a 3 km buffer zone of the coastlines as shown in Figure 6. The complex network approach was applied to analyze the land cover transformation in the buffer zone (Figure 7). It is shown that an obvious transformation from water to urban land occurred during the periods (2000–2003 and 2005–2008), but the water along the coastline transforming to other land types significantly decreased from 2008 to 2022. It can be clearly seen that the transformation from urban land to water occurred during 2003–2005. This reveals that the reservoir areas increased because of the artificial expansion to support the increasing population during this period. Corresponding to that trend is the water area, which increased from 451.11 km2 in 2003 to 464.13 km2 in 2005, as shown in Table 2.
The vegetation along the coastline transformed into other land types significantly in the early stages of Shenzhen’s development. Such a transformation gradually decreased over time. Meanwhile, the transformation from bare land to urban land became slower, implying that the bare land prepared before was transformed into urban land. The bare land along the coastline transforming to other land types significantly decreased from 2008 to 2022. Increased urban land through reclamation activity played an important role in promoting regional economic development, but this change had negative impacts on the ecological environment. In the 2003–2022 period, other land types changed to vegetation. This reveals that Shenzhen government is paying increasing attention to the protection of the coastal zone ecosystem.

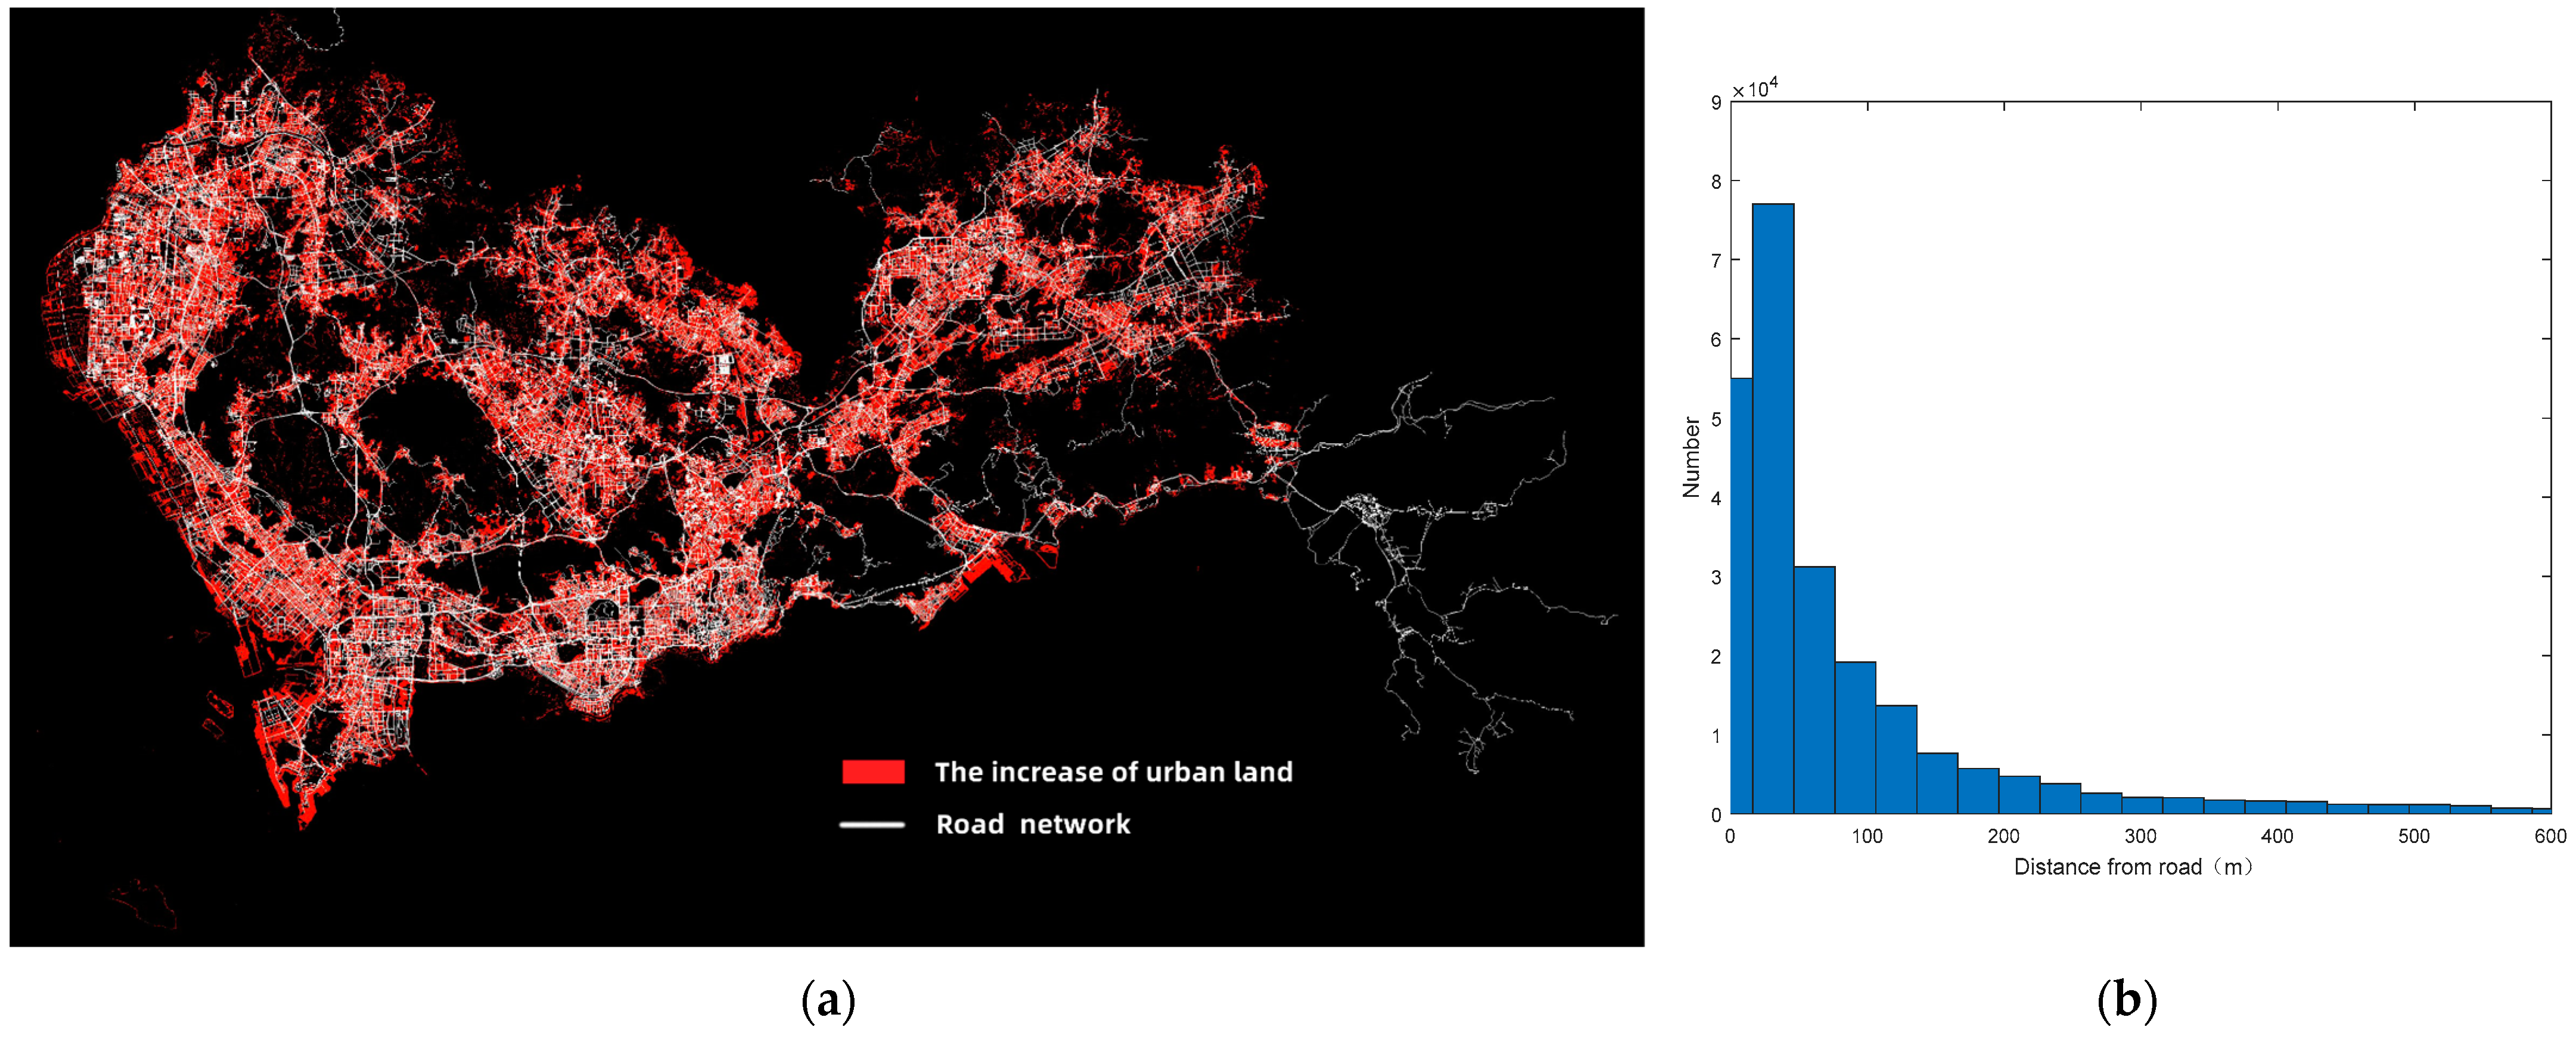
4.2. Subsection Traffic Factors in Urban Land Change

The traffic network exhibits obvious constraints on urban land use. When overlapping the road network map and the urban land expansion map (1979–2022), an obvious coupling can be found (Figure 8a).
The urban land use increase was mainly located around the traffic network. We applied a histogram analysis on the transportation distance (Figure 8b), and found that there was an exponential decay of urban land increase against the distance to the roads, implying that traffic factors greatly determine the urban land expansion. The turning point of the exponential decay was a distance of around 150 m. This suggests that the traffic effects on urban land expansion reduce sharply with a transportation distance beyond 150 m.

4.3. Socioeconomic Factors in Urban Land Change

Urban land use is also affected by socioeconomic factors, such as time, population, gross domestic product (GDP), primary industry, secondary industry, and tertiary industry. We implemented a correlation analysis between these factors and our retrieved urban land areas, respectively. The analysis was based on the socioeconomic data from Shenzhen’s statistical yearbook [82] in the nine corresponding years.
It can be seen from Figure 9 that time and population were highly related to land use development, indicating that urban land grew linearly with time and that the population factor is an important driving force in urban land development. Meanwhile, we can see that the weakest relevance existed in the primary industry. A negative correlation even appeared between 2003 and 2013. This suggests that the land use in Shenzhen became less related to the primary industry. Compared with the primary industry, the secondary and tertiary industries have stronger correlations with urban land use in Shenzhen.

5. Conclusions

The LUCC statistics on a single class are not enough to represent the shift between different classes for the whole land cover system. Most studies explored the LUCC progress from certain land type view changes, ignoring the integrality of the land use system and the correlation between land use and other factors. Moreover, most studies used the transfer matrix to describe the characteristics of land cover changes among classes, but it is still not intuitive or easily understood. In this paper, we studied the land cover and its changes in Shenzhen from 1979 to 2022, using Landsat time series images. The spatial–temporal characteristics and the impact factors of urbanization were further analyzed. The main conclusions are as follows:
First, Shenzhen experienced a rapid urbanization process from 1979 and 2022. In the study area, the cumulative increase in urban land was about 756.84 km2, the reduction of vegetation was about 546.27 km2, the reduction of water was about 132.95 km2, and the reduction of bare land was about 77.62 km2. The urbanization started in the Luohu district, gradually radiated to the urban districts (Futian, Nanshan, and Yantian districts), and finally reached the outlying districts (Baoan, Longgang, Guangming, Dapeng, and Pingshan). Rapid urbanization at an early stage results in excessive use of land resources; however, when urban land achieves a certain level, the urbanization speed will gradually decrease with time.
Second, the complex network visualization reveals that the main changes in land cover are different over time. The transformation from vegetation to bare land is hard to witness in the late stage. As bare land is the medium for transforming vegetation into urban land, it means that the velocity of vegetation–urban land transformation keeps increasing. We can conclude that the urbanization of Shenzhen continuously speeds up with time. Meanwhile, the coastline distributions show that the west coastline changed more dramatically than the east coastline; most of the east coastline remained stable, except for the parts near Yantian port and Mirs Bay, which experienced some changes. This reveals that an obvious transformation from water to urban land occurred during the early period, but the water along the coastline transforming to other land types significantly decreased in recent years.
Finally, the road network greatly impacted the land cover changes from 1979 to 2022. A histogram analysis was applied to the transportation distance, and we found an exponential decay of urban land increase against the distance to the roads. The turning point of the exponential decay was a distance of around 150 m. This suggests that the traffic effect on urban land expansion reduces sharply with a transportation distance beyond 150 m. By investigating the socioeconomic data, we found that urban land grows linearly with time and the population is highly correlated with urban area changes. The primary industry, compared with the secondary and tertiary industries, is less related to urban land use in Shenzhen. These socioeconomic factors can be considered the main driving forces for urbanization in Shenzhen. In the future, under the current economic policies, the population and economy of Shenzhen will continue to increase. However, the increase will be accompanied by a decrease in vegetation and water resources. According to this present study, the LUCC changes in Shenzhen will gradually enter a stable period. Thus, sustainable land use policies should be formulated dynamically according to the socioeconomic realities of Shenzhen. Although each city has a different development stage and faces different problems, the research method of this paper can provide a reference for other cities.

Author Contributions

Conceptualization, K.D., C.W., and Q.L.; methodology, K.D., Y.H., and Q.L.; software, K.D. and Y.H.; validation, Y.H., C.W., and X.F.; formal analysis, M.T., C.Y. and X.F.; investigation, Y.H., R.X., and C.Y.; resources, C.W., Y.H., and X.F.; data curation, K.D., Y.H., and M.D.; writing—original draft preparation, K.D. and C.W.; writing—review and editing, K.D., C.W., and Y.H.; visualization, K.D., Y.H. and C.Y.; supervision, K.D., M.D., and R.X.; project administration, K.D., Q.L., and M.T.; funding acquisition, Q.L. All authors have read and agreed to the published version of the manuscript.

Funding

This research was supported by the Basic and Applied Basic Research Funding Program of Guangdong Province of China (no. 2019A1515110303 and no. 2019A1515110800); the Open Research Fund from Guangdong Laboratory of Artificial Intelligence and Digital Economy (SZ) (no. GML-KF-22-02); the National Natural Science Foundation of China (no. 42201319 and no. 62001113); the China Postdoctoral Science Foundation (no. 2021M702233); the Youth Talent Fund of Guangdong Provincial Department of Education (no. 2022KQNCX226); the Guangdong Key Construction Discipline Research Ability Enhancement Project (no. 2021ZDJS086); the Dongguan Science and Technology of Social Development Program (no. 20221800902472 and no. 20211800904712); the Research Team Project of Dongguan University of Technology (no. TDY-B2019009).

Data Availability Statement

If you are interested in the data used in our research work, you can contact [email protected] for the original dataset.

Acknowledgments

We would like to express our gratitude to all those who helped us during the writing of this paper.

Conflicts of Interest

The authors declare no conflict of interest.

References

  1. Meyer, W.B.; Turner, B.L. Human population growth and global land-use/cover change. Annu. Rev. Ecol. Syst. 1992, 23, 39–61. [Google Scholar] [CrossRef]
  2. Lambin, E.F.; Geist, H.J. Land-Use and Land-Cover Change: Local Processes and Global Impacts; Springer Science & Business Media: Berlin, Germany, 2008. [Google Scholar]
  3. Benning, T.L.; LaPointe, D.; Atkinson, C.T.; Vitousek, P.M. Interactions of climate change with biological invasions and land use in the Hawaiian Islands: Modeling the fate of endemic birds using a geographic information system. Proc. Natl. Acad. Sci. USA 2002, 99, 14246–14249. [Google Scholar] [CrossRef] [PubMed] [Green Version]
  4. Pérez-Vega, A.; Mas, J.-F.; Ligmann-Zielinska, A. Comparing two approaches to land use/cover change modeling and their implications for the assessment of biodiversity loss in a deciduous tropical forest. Environ. Model. Softw. 2012, 29, 11–23. [Google Scholar] [CrossRef]
  5. Maitima, J.M.; Mugatha, S.M.; Reid, R.S.; Gachimbi, L.N.; Majule, A.; Lyaruu, H.; Pomery, D.; Mathai, S.; Mugisha, S. The linkages between land use change, land degradation and biodiversity across East Africa. Afr. J. Environ. Sci. Technol. 2009, 3, 10. [Google Scholar]
  6. Titeux, N.; Henle, K.; Mihoub, J.B.; Regos, A.; Geijzendorffer, I.R.; Cramer, W.; Verburg, P.H.; Brotons, L. Biodiversity scenarios neglect future land-use changes. Glob. Chang. Biol. 2016, 22, 2505–2515. [Google Scholar] [CrossRef] [Green Version]
  7. Reid, R.; Kruska, R.; Muthui, N.; Taye, A.; Wotton, S.; Wilson, C.; Mulatu, W. Land-use and land-cover dynamics in response to changes in climatic, biological and socio-political forces: The case of southwestern Ethiopia. Landsc. Ecol. 2000, 15, 339–355. [Google Scholar] [CrossRef]
  8. Ureta, C.; Ramírez-Barrón, M.; Sánchez-García, E.A.; Cuervo-Robayo, A.P.; Munguía-Carrara, M.; Mendoza-Ponce, A.; Gay, C.; Sánchez-Cordero, V. Species, taxonomic, and functional group diversities of terrestrial mammals at risk under climate change and land-use/cover change scenarios in Mexico. Glob. Chang. Biol. 2022, 28, 6992–7008. [Google Scholar] [CrossRef]
  9. Li, X.; Zou, L.; Xia, J.; Dou, M. Untangling the effects of climate change and land use/cover change on spatiotemporal variation of evapotranspiration over China. J. Hydrol. 2022, 612, 128189. [Google Scholar] [CrossRef]
  10. Riebsame, W.E.; Meyer, W.B.; Turner, B. Modeling land use and cover as part of global environmental change. Clim. Chang. 1994, 28, 45–64. [Google Scholar] [CrossRef]
  11. Liu, Y.; Huang, X.; Yang, H.; Zhong, T. Environmental effects of land-use/cover change caused by urbanization and policies in Southwest China Karst area–A case study of Guiyang. Habitat Int. 2014, 44, 339–348. [Google Scholar] [CrossRef]
  12. Kreuter, U.P.; Harris, H.G.; Matlock, M.D.; Lacey, R.E. Change in ecosystem service values in the San Antonio area, Texas. Ecol. Econ. 2001, 39, 333–346. [Google Scholar] [CrossRef]
  13. Wang, P.; Yu, P.; Lu, J.; Zhang, Y. The mediation effect of land surface temperature in the relationship between land use-cover change and energy consumption under seasonal variations. J. Clean. Prod. 2022, 340, 130804. [Google Scholar] [CrossRef]
  14. Moarrab, Y.; Salehi, E.; Amiri, M.; Hovidi, H. Spatial–temporal assessment and modeling of ecological security based on land-use/cover changes (case study: Lavasanat watershed). Int. J. Environ. Sci. Technol. 2022, 19, 3991–4006. [Google Scholar] [CrossRef]
  15. Duran, E.; Mas, J.-F.; Velázquez, A. Land use/cover change in community-based forest management regions and protected areas in Mexico. In The Community Forests of México; University of Texas Press: Austin, TX, USA, 2021; pp. 215–238. [Google Scholar]
  16. Flamenco-Sandoval, A.; Ramos, M.M.; Masera, O.R. Assessing implications of land-use and land-cover change dynamics for conservation of a highly diverse tropical rain forest. Biol. Conserv. 2007, 138, 131–145. [Google Scholar] [CrossRef]
  17. Geist, H.J. The Land-Use and Cover-Change (LUCC) ProjectGeist. The land-use and cover-change (lucc) project. In Land Use, Land Cover and Soil Sciences-Volume I: Land Cover, Land Use and the Global Change; University of Louvain: Ottignies-Louvain-la-Neuve, Belgium, 2009; p. 209. [Google Scholar]
  18. He, C.; Zhang, J.; Liu, Z.; Huang, Q. Characteristics and progress of land use/cover change research during 1990–2018. J. Geogr. Sci. 2022, 32, 537–559. [Google Scholar] [CrossRef]
  19. Chhabra, A.; Geist, H.; Houghton, R.A.; Haberl, H.; Braimoh, A.K.; Vlek, P.L.; Patz, J.; Xu, J.; Ramankutty, N.; Coomes, O. Multiple impacts of land-use/cover change. In Land-Use and Land-Cover Change; Springer: Berlin/Heidelberg, Germany, 2006; pp. 71–116. [Google Scholar]
  20. Kanianska, R.; Kizeková, M.; Nováček, J.; Zeman, M. Land-use and land-cover changes in rural areas during different political systems: A case study of Slovakia from 1782 to 2006. Land Use Policy 2014, 36, 554–566. [Google Scholar] [CrossRef]
  21. He, X.; Liang, J.; Zeng, G.; Yuan, Y.; Li, X. The effects of interaction between climate change and land-use/cover change on biodiversity-related ecosystem services. Glob. Chall. 2019, 3, 1800095. [Google Scholar] [CrossRef] [Green Version]
  22. Delgado-Artés, R.; Garófano-Gómez, V.; Oliver-Villanueva, J.-V.; Rojas-Briales, E. Land use/cover change analysis in the Mediterranean region: A regional case study of forest evolution in Castelló (Spain) over 50 years. Land Use Policy 2022, 114, 105967. [Google Scholar] [CrossRef]
  23. Geist, H.; McConnell, W.; Lambin, E.F.; Moran, E.; Alves, D.; Rudel, T. Causes and trajectories of land-use/cover change. In Land-Use and Land-Cover Change; Springer: Berlin/Heidelberg, Germany, 2006; pp. 41–70. [Google Scholar]
  24. Li, Y. Urban–rural interaction patterns and dynamic land use: Implications for urban–rural integration in China. Reg. Environ. Chang. 2012, 12, 803–812. [Google Scholar] [CrossRef]
  25. Long, H.; Wu, X.; Wang, W.; Dong, G. Analysis of urban-rural land-use change during 1995-2006 and its policy dimensional driving forces in Chongqing, China. Sensors 2008, 8, 681–699. [Google Scholar] [CrossRef] [Green Version]
  26. König, H.J.; Schuler, J.; Suarma, U.; McNeill, D.; Imbernon, J.; Damayanti, F.; Dalimunthe, S.A.; Uthes, S.; Sartohadi, J.; Helming, K. Assessing the impact of land use policy on urban-rural sustainability using the FoPIA approach in Yogyakarta, Indonesia. Sustainability 2010, 2, 1991–2009. [Google Scholar] [CrossRef]
  27. Verburg, P.H.; Kok, K.; Pontius, R.G.; Veldkamp, A. Modeling land-use and land-cover change. In Land-Use and Land-Cover Change; Springer: Berlin/Heidelberg, Germany, 2006; pp. 117–135. [Google Scholar]
  28. Riebsame, W.; Parton, W.; Galvin, K.; Burke, I.; Bohren, L.; Young, R.; Knop, E. Integrated modeling of land use and cover change. Bioscience 1994, 44, 350–356. [Google Scholar] [CrossRef]
  29. Bao, S.; Yang, F. Spatio-Temporal Dynamic of the Land Use/Cover Change and Scenario Simulation in the Southeast Coastal Shelterbelt System Construction Project Region of China. Sustainability 2022, 14, 8952. [Google Scholar] [CrossRef]
  30. Wang, J.; Li, Y.; Wang, Q.; Cheong, K.C. Urban–rural construction land replacement for more sustainable land use and regional development in China: Policies and practices. Land 2019, 8, 171. [Google Scholar] [CrossRef] [Green Version]
  31. He, H.; Hamdi, R.; Cai, P.; Luo, G.; Ochege, F.U.; Zhang, M.; Termonia, P.; De Maeyer, P.; Li, C. Impacts of historical land use/cover change (1980–2015) on summer climate in the Aral Sea region. J. Geophys. Res. Atmos. 2021, 126, e2020JD032638. [Google Scholar] [CrossRef]
  32. Zhang, B.; Zhou, W. Spatial–temporal characteristics of precipitation and its relationship with land use/cover change on the Qinghai-Tibet Plateau, China. Land 2021, 10, 269. [Google Scholar] [CrossRef]
  33. Castella, J.-C.; Kam, S.P.; Quang, D.D.; Verburg, P.H.; Hoanh, C.T. Combining top-down and bottom-up modelling approaches of land use/cover change to support public policies: Application to sustainable management of natural resources in northern Vietnam. Land Use Policy 2007, 24, 531–545. [Google Scholar] [CrossRef]
  34. Munroe, D.K.; Müller, D. Issues in spatially explicit statistical land-use/cover change (LUCC) models: Examples from western Honduras and the Central Highlands of Vietnam. Land Use Policy 2007, 24, 521–530. [Google Scholar] [CrossRef]
  35. Li, Z.; Ren, Y.; Li, J.; Li, Y.; Rykov, P.; Chen, F.; Zhang, W. Land-use/cover change and driving mechanism on the west bank of lake Baikal from 2005 to 2015—A case study of Irkutsk city. Sustainability 2018, 10, 2904. [Google Scholar] [CrossRef] [Green Version]
  36. Ntukey, L.T.; Munishi, L.K.; Treydte, A.C. Land Use Land/Cover Change Reduces Woody Plant Diversity and Carbon Stocks in a Lowland Coastal Forest Ecosystem, Tanzania. Sustainability 2022, 14, 8551. [Google Scholar] [CrossRef]
  37. Parker, D.C.; Manson, S.M.; Janssen, M.A.; Hoffmann, M.J.; Deadman, P. Multi-agent systems for the simulation of land-use and land-cover change: A review. Ann. Assoc. Am. Geogr. 2003, 93, 314–337. [Google Scholar] [CrossRef]
  38. Moran, E.F. News on the land project. Glob. Chang. Newslett 2003, 54, 19–21. [Google Scholar]
  39. Liu, Y.; Luo, T.; Liu, Z.; Kong, X.; Li, J.; Tan, R. A comparative analysis of urban and rural construction land use change and driving forces: Implications for urban–rural coordination development in Wuhan, Central China. Habitat Int. 2015, 47, 113–125. [Google Scholar] [CrossRef]
  40. Liaqat, M.U.; Mohamed, M.M.; Chowdhury, R.; Elmahdy, S.I.; Khan, Q.; Ansari, R. Impact of land use/land cover changes on groundwater resources in Al Ain region of the United Arab Emirates using remote sensing and GIS techniques. Groundw. Sustain. Dev. 2021, 14, 100587. [Google Scholar] [CrossRef]
  41. Turner, B.L.; Meyer, W.B.; Skole, D.L. Global land-use/land-cover change: Towards an integrated study. AMBIO 1994, 23, 91–95. [Google Scholar]
  42. Kabeja, C.; Li, R.; Rwabuhungu Rwatangabo, D.E.; Duan, J. Monitoring Land Use/Cover Changes by Using Multi-Temporal Remote Sensing for Urban Hydrological Assessment: A Case Study in Beijing, China. Remote Sens. 2022, 14, 4273. [Google Scholar] [CrossRef]
  43. Rawat, J.; Kumar, M. Monitoring land use/cover change using remote sensing and GIS techniques: A case study of Hawalbagh block, district Almora, Uttarakhand, India. Egypt. J. Remote Sens. Space Sci. 2015, 18, 77–84. [Google Scholar] [CrossRef] [Green Version]
  44. Mundia, C.N.; Aniya, M. Analysis of land use/cover changes and urban expansion of Nairobi city using remote sensing and GIS. Int. J. Remote Sens. 2005, 26, 2831–2849. [Google Scholar] [CrossRef]
  45. Guo, L.; Xi, X.; Yang, W.; Liang, L. Monitoring Land Use/Cover Change Using Remotely Sensed Data in Guangzhou of China. Sustainability 2021, 13, 2944. [Google Scholar] [CrossRef]
  46. Liang, J.; Chen, C.; Sun, H.; Zhang, Z. Analysis on Land-Use/Cover Change in Hangzhou Bay, China during 2000–2020 Using the Google Earth Engine. In Proceedings of the 2022 3rd International Conference on Geology, Mapping and Remote Sensing (ICGMRS), Zhoushan, China, 22–24 April 2022; pp. 546–549. [Google Scholar]
  47. Dewan, A.M.; Yamaguchi, Y. Using remote sensing and GIS to detect and monitor land use and land cover change in Dhaka Metropolitan of Bangladesh during 1960–2005. Environ. Monit. Assess. 2009, 150, 237–249. [Google Scholar] [CrossRef]
  48. Yin, J.; Yin, Z.; Zhong, H.; Xu, S.; Hu, X.; Wang, J.; Wu, J. Monitoring urban expansion and land use/land cover changes of Shanghai metropolitan area during the transitional economy (1979–2009) in China. Environ. Monit. Assess. 2011, 177, 609–621. [Google Scholar] [CrossRef] [PubMed]
  49. Zhao, L.; Huang, W.; Chen, J.; Dong, Y.; Ren, B.; Geng, Y. Land use/cover changes in the Oriental migratory locust area of China: Implications for ecological control and monitoring of locust area. Agric. Ecosyst. Environ. 2020, 303, 107110. [Google Scholar] [CrossRef]
  50. Deng, X.; Li, Z. A review on historical trajectories and spatially explicit scenarios of land-use and land-cover changes in China. J. Land Use Sci. 2016, 11, 709–724. [Google Scholar] [CrossRef]
  51. Lambin, E.F.; Turner, B.L.; Geist, H.J.; Agbola, S.B.; Angelsen, A.; Bruce, J.W.; Coomes, O.T.; Dirzo, R.; Fischer, G.; Folke, C. The causes of land-use and land-cover change: Moving beyond the myths. Glob. Environ. Chang. 2001, 11, 261–269. [Google Scholar] [CrossRef]
  52. Yubo, Z.; Zhuoran, Y.; Jiuchun, Y.; Yuanyuan, Y.; Dongyan, W.; Yucong, Z.; Fengqin, Y.; Lingxue, Y.; Liping, C.; Shuwen, Z. A novel model integrating deep learning for land use/cover change reconstruction: A case study of zhenlai county, northeast China. Remote Sens. 2020, 12, 3314. [Google Scholar] [CrossRef]
  53. Schaldach, R.; Alcamo, J.; Koch, J.; Kolking, C.; Lapola, D.M.; Schungel, J.; Priess, J.A. An integrated approach to modelling land-use change on continental and global scales. Environ. Model. Softw. 2011, 26, 1041–1051. [Google Scholar] [CrossRef]
  54. Yu, W.; Zang, S.; Wu, C.; Liu, W.; Na, X. Analyzing and modeling land use land cover change (LUCC) in the Daqing City, China. Appl. Geogr. 2011, 31, 600–608. [Google Scholar] [CrossRef]
  55. Mas, J.-F.; Kolb, M.; Paegelow, M.; Olmedo, M.T.C.; Houet, T. Inductive pattern-based land use/cover change models: A comparison of four software packages. Environ. Model. Softw. 2014, 51, 94–111. [Google Scholar] [CrossRef] [Green Version]
  56. Azizi, P.; Soltani, A.; Bagheri, F.; Sharifi, S.; Mikaeili, M. An Integrated Modelling Approach to Urban Growth and Land Use/Cover Change. Land 2022, 11, 1715. [Google Scholar] [CrossRef]
  57. Seto, K.C.; Kaufmann, R.K. Modeling the drivers of urban land use change in the Pearl River Delta, China: Integrating remote sensing with socioeconomic data. Land Econ. 2003, 79, 106–121. [Google Scholar] [CrossRef] [Green Version]
  58. Edan, M.H.; Maarouf, R.M.; Hasson, J. Predicting the impacts of land use/land cover change on land surface temperature using remote sensing approach in Al Kut, Iraq. Phys. Chem. Earth Parts A/B/C 2021, 123, 103012. [Google Scholar] [CrossRef]
  59. Zhang, Y.; Yang, J.; Wang, D.; Wang, J.; Yu, L.; Yan, F.; Chang, L.; Zhang, S. An Integrated CNN Model for Reconstructing and Predicting Land Use/Cover Change: A Case Study of the Baicheng Area, Northeast China. Remote Sens. 2021, 13, 4846. [Google Scholar] [CrossRef]
  60. Zhang, F.; Yushanjiang, A.; Jing, Y. Assessing and predicting changes of the ecosystem service values based on land use/cover change in Ebinur Lake Wetland National Nature Reserve, Xinjiang, China. Sci. Total Environ. 2019, 656, 1133–1144. [Google Scholar] [CrossRef] [PubMed]
  61. Stych, P.; Kabrda, J.; Bicik, I.; Lastovicka, J. Regional differentiation of long-term land use changes: A case study of Czechia. Land 2019, 8, 165. [Google Scholar] [CrossRef] [Green Version]
  62. Zhang, B.; Yin, L.; Zhang, S.; Feng, C. Assessment on characteristics of LUCC process based on complex network in Modern Yellow River Delta, Shandong Province of China. Earth Sci. Inform. 2016, 9, 83–93. [Google Scholar] [CrossRef]
  63. Qian, J.; Peng, Y.; Luo, C.; Wu, C.; Du, Q. Urban land expansion and sustainable land use policy in Shenzhen: A case study of China’s rapid urbanization. Sustainability 2015, 8, 16. [Google Scholar] [CrossRef] [Green Version]
  64. Shi, P.; Yu, D. Assessing urban environmental resources and services of Shenzhen, China: A landscape-based approach for urban planning and sustainability. Landsc. Urban Plan. 2014, 125, 290–297. [Google Scholar] [CrossRef]
  65. Peng, Y.; Yang, F.; Zhu, L.; Li, R.; Wu, C.; Chen, D. Comparative Analysis of the Factors Influencing Land Use Change for Emerging Industry and Traditional Industry: A Case Study of Shenzhen City, China. Land 2021, 10, 575. [Google Scholar] [CrossRef]
  66. Seto, K.C.; Fragkias, M. Quantifying spatiotemporal patterns of urban land-use change in four cities of China with time series landscape metrics. Landsc. Ecol. 2005, 20, 871–888. [Google Scholar] [CrossRef]
  67. Ding, K.; Wang, C.; Tao, M.; Xiao, H.; Yang, C.; Huang, P. A Classification Method of Land Cover Based on Support Vector Machines. In Proceedings of the International Conference on Machine Learning for Cyber Security, Guangzhou, China, 8–10 October 2020; pp. 48–54. [Google Scholar]
  68. Liu, W.; Meng, Q.; Allam, M.; Zhang, L.; Hu, D.; Menenti, M. Driving factors of land surface temperature in urban agglomerations: A case study in the pearl river delta, china. Remote Sens. 2021, 13, 2858. [Google Scholar] [CrossRef]
  69. Li, T.; Li, W. Multiple land use change simulation with Monte Carlo approach and CA-ANN model, a case study in Shenzhen, China. Environ. Syst. Res. 2015, 4, 1. [Google Scholar] [CrossRef] [Green Version]
  70. Sui, D.Z.; Zeng, H. Modeling the dynamics of landscape structure in Asia’s emerging desakota regions: A case study in Shenzhen. Landsc. Urban Plan. 2001, 53, 37–52. [Google Scholar] [CrossRef]
  71. Li, X.; Yeh, A.G.-O. Analyzing spatial restructuring of land use patterns in a fast growing region using remote sensing and GIS. Landsc. Urban Plan. 2004, 69, 335–354. [Google Scholar] [CrossRef]
  72. Wang, H.; Li, B.; Yi, T.; Wu, J. Heterogeneous Urban Thermal Contribution of Functional Construction Land Zones: A Case Study in Shenzhen, China. Remote Sens. 2022, 14, 1851. [Google Scholar] [CrossRef]
  73. YANG, M.; GUO, R.; LI, Q. Construction Land Change Driving Forces in Rapid Urbanization Area: A Case Study of Longgang District of Shenzhen City. Geomat. Inf. Sci. Wuhan Univ. 2009, 34, 170–173. [Google Scholar]
  74. Sun, S.; Mu, L.; Feng, R.; Wang, L.; He, J. GAN-Based LUCC Prediction via the Combination of Prior City Planning Information and Land-Use Probability. IEEE J. Sel. Top. Appl. Earth Obs. Remote Sens. 2021, 14, 10189–10198. [Google Scholar] [CrossRef]
  75. Yang, Q.; Li, X.; Shi, X. Cellular automata for simulating land use changes based on support vector machines. Comput. Geosci. 2008, 34, 592–602. [Google Scholar] [CrossRef]
  76. Fan, W.; Fong, D.K.C.; Li, G.; Law, R. Understanding clusters of tourist behavior associations using network analysis. Int. J. Hosp. Tour. Adm. 2021, 22, 502–523. [Google Scholar] [CrossRef]
  77. Wang, Z.; Li, T.; Yang, S.; Zhong, D. Spatio-Temporal Dynamic and Structural Characteristics of Land Use/Cover Change Based on a Complex Network: A Case Study of the Middle Reaches of Yangtze River Urban Agglomeration. Sustainability 2022, 14, 6941. [Google Scholar] [CrossRef]
  78. Klerkx, L.; Aarts, N.; Leeuwis, C. Adaptive management in agricultural innovation systems: The interactions between innovation networks and their environment. Agric. Syst. 2010, 103, 390–400. [Google Scholar] [CrossRef]
  79. Zhang, M.; Wang, J.; Feng, Y. Temporal and spatial change of land use in a large-scale opencast coal mine area: A complex network approach. Land Use Policy 2019, 86, 375–386. [Google Scholar] [CrossRef]
  80. Pan, W.; Du, J. Towards sustainable urban transition: A critical review of strategies and policies of urban village renewal in Shenzhen, China. Land Use Policy 2021, 111, 105744. [Google Scholar] [CrossRef]
  81. Yu, W.; Zhang, Y.; Zhou, W.; Wang, W.; Tang, R. Urban expansion in Shenzhen since 1970s: A retrospect of change from a village to a megacity from the space. Phys. Chem. Earth Parts A/B/C 2019, 110, 21–30. [Google Scholar] [CrossRef]
  82. Shenzhen Statistical Yearbook Data from Statistics Bureau of Shenzhen Municipality Website. Available online: Tjj.sz.gov.cn/zwgk/zfxxgkml/tjsj/tjnj/index.html (accessed on 16 September 2022).
  83. USGS. Available online: Earthexplorer.usgs.gov (accessed on 6 October 2022).
  84. Zhang, Z.; Wang, X.; Zhao, X.; Liu, B.; Yi, L.; Zuo, L.; Wen, Q.; Liu, F.; Xu, J.; Hu, S. A 2010 update of National Land Use/Cover Database of China at 1: 100000 scale using medium spatial resolution satellite images. Remote Sens. Environ. 2014, 149, 142–154. [Google Scholar] [CrossRef]
  85. Wu, B.-L.; Sun, H.; Shi, J.-N.; Zhang, Y.-T.; Shi, L.-J. Dynamic change and prediction of vegetation cover in Shenzhen, China from 2000 to 2018. J. Appl. Ecol. 2020, 31, 3777–3785. [Google Scholar]
  86. Nordkvist, K.; Granholm, A.-H.; Holmgren, J.; Olsson, H.; Nilsson, M. Combining optical satellite data and airborne laser scanner data for vegetation classification. Remote Sens. Lett. 2011, 3, 393–401. [Google Scholar] [CrossRef] [Green Version]
  87. Friedl, M.A.; Brodley, C.E. Decision tree classification of land cover from remotely sensed data. Remote Sens. Environ. 1997, 61, 399–409. [Google Scholar] [CrossRef]
  88. Franco-Lopez, H.; Ek, A.R.; Bauer, M.E. Estimation and mapping of forest stand density, volume, and cover type using the k-nearest neighbors method. Remote Sens. Environ. 2001, 77, 251–274. [Google Scholar] [CrossRef]
  89. Wang, C.; Wang, X.-S.; Xu, Y.; Zhang, B.; Jiang, M.; Xiong, S.; Zhang, Q.; Li, W.; Li, Q. A new likelihood function for consistent phase series estimation in distributed scatterer interferometry. IEEE Trans. Geosci. Remote Sens. 2022, 60, 1–14. [Google Scholar] [CrossRef]
  90. Yanfei, Z.; Liangpei, Z. An Adaptive Artificial Immune Network for Supervised Classification of Multi-/Hyperspectral Remote Sensing Imagery. Geosci. Remote Sens. IEEE Trans. 2012, 50, 894–909. [Google Scholar] [CrossRef]
  91. Mountrakis, G.; Im, J.; Ogole, C. Support vector machines in remote sensing: A review. ISPRS J. Photogramm. Remote Sens. 2011, 66, 247–259. [Google Scholar] [CrossRef]
  92. Pal, M.; Mather, P. Support vector machines for classification in remote sensing. Int. J. Remote Sens. 2005, 26, 1007–1011. [Google Scholar] [CrossRef]
  93. Kavzoglu, T.; Colkesen, I. A kernel functions analysis for support vector machines for land cover classification. Int. J. Appl. Earth Obs. Geoinf. 2009, 11, 352–359. [Google Scholar] [CrossRef]
  94. Karan, S.K.; Samadder, S.R. A comparison of different land-use classification techniques for accurate monitoring of degraded coal-mining areas. Environ. Earth Sci. 2018, 77, 713. [Google Scholar] [CrossRef]
  95. Hong, H.; Pradhan, B.; Bui, D.T.; Xu, C.; Youssef, A.M.; Chen, W. Comparison of four kernel functions used in support vector machines for landslide susceptibility mapping: A case study at Suichuan area (China). Geomat. Nat. Hazards Risk 2017, 8, 544–569. [Google Scholar] [CrossRef]
  96. Che, J.; Wang, J. Short-term load forecasting using a kernel-based support vector regression combination model. Appl. Energy 2014, 132, 602–609. [Google Scholar] [CrossRef]
  97. Hamad, S.I. Data Classification with Support Vector Machine Kernel Function. Eurasian J. Eng. Technol. 2022, 4, 89–95. [Google Scholar]
  98. Boccaletti, S.; Latora, V.; Moreno, Y.; Chavez, M.; Hwang, D.-U. Complex networks: Structure and dynamics. Phys. Rep. 2006, 424, 175–308. [Google Scholar] [CrossRef]
  99. Pengfei, W.; Huili, G.; Demin, Z. Land Use and Land Cover Change in Watershed of Guanting Reservoir Based on Complex Network. Acta Geogr. Sin. 2012, 67, 113–121. [Google Scholar] [CrossRef]
Figure 1. The TM false color image in the research region.
Remotesensing 14 05706 g001
Figure 2. Spectral characteristics of the Landsat TM image for different land types.
Remotesensing 14 05706 g002
Figure 3. The land cover maps in Shenzhen from 1979 to 2022.
Remotesensing 14 05706 g003
Figure 4. The administrative map of Shenzhen city.
Remotesensing 14 05706 g004
Figure 5. The complex network visualization of the land cover transformation in Shenzhen from 1979 to 2022.
Remotesensing 14 05706 g005
Figure 6. The coastline changes in Shenzhen from 1979 to 2022. The shadow area denotes the 3 km buffer zone of the coastline.
Remotesensing 14 05706 g006
Figure 7. The complex network visualization of the land cover transformation in the 3 km buffer zone of the Shenzhen coastline from 1979 to 2022.
Remotesensing 14 05706 g007
Figure 8. The relationship between transportation and urban land increase from 1979 to 2022. (a) The road network overlaid on the map of urban land expansion. (b) The transportation distance histograms for urban land increase.
Remotesensing 14 05706 g008
Figure 9. The correlation analysis between socioeconomic factors and the urban land area.
Remotesensing 14 05706 g009
Table 1. Parameters of the used Landsat images.
DateImage TypeResolutionBandsWavelengthOrbitFrame
1979-10-13MSS60 m40.5–1.1 μm131044
1990-10-13TM30 m70.45–2.35 μm122044
2000-09-14ETM+30 m80.45–2.35 μm122044
2003-01-10ETM+30 m80.45–2.35 μm122044
2005-11-23TM30 m70.45–2.35 μm122044
2008-12-17TM30 m70.45–2.35 μm122044
2013-12-31OLI30 m110.42–12.51 μm122044
2017-10-23OLI30 m110.42–12.51 μm122044
2022-01-06OLI30 m110.42–12.51 μm122044
Table 2. Statistics on the land cover of Shenzhen at different times.
TimeVegetationUrban LandWaterBare Land
Total
(km2)
Rate
(km2/Year)
Rate
(%)
Total
(km2)
Rate
(km2/Year)
Rate
(%)
Total
(km2)
Rate
(km2/Year)
Rate
(%)
Total
(km2)
Rate
(km2/Year)
Rate
(%)
19791131.36 101.82 543.88 129.91
1990956.04−15.94−15.50124.712.0822.49547.090.290.59279.1313.57114.86
2000834.54−12.15−12.71419.2429.45236.16521.62−2.55−4.66131.57−14.76−52.86
2003749.50−36.50−10.19565.9162.9534.99451.11−30.26−13.52140.453.816.75
2005716.50−11.66−4.40608.3414.997.50464.134.602.89118.00−7.93−15.98
2008681.08−11.81−4.94684.6225.4312.54421.41−14.24−9.20119.850.621.57
2013692.642.311.70744.0711.898.68410.88−2.11−2.5059.38−12.09−50.45
2017686.80−1.54−0.84767.096.063.09407.71−0.83−0.7745.37−3.69−23.61
2022585.09−24.22−14.81858.6621.8011.94410.930.770.7952.291.6515.27
Publisher’s Note: MDPI stays neutral with regard to jurisdictional claims in published maps and institutional affiliations.

