
Accelerating Effect of Vegetation on the Instability of Rainfall-Induced Shallow Landslides


 ,
,
Abstract
:1. Introduction
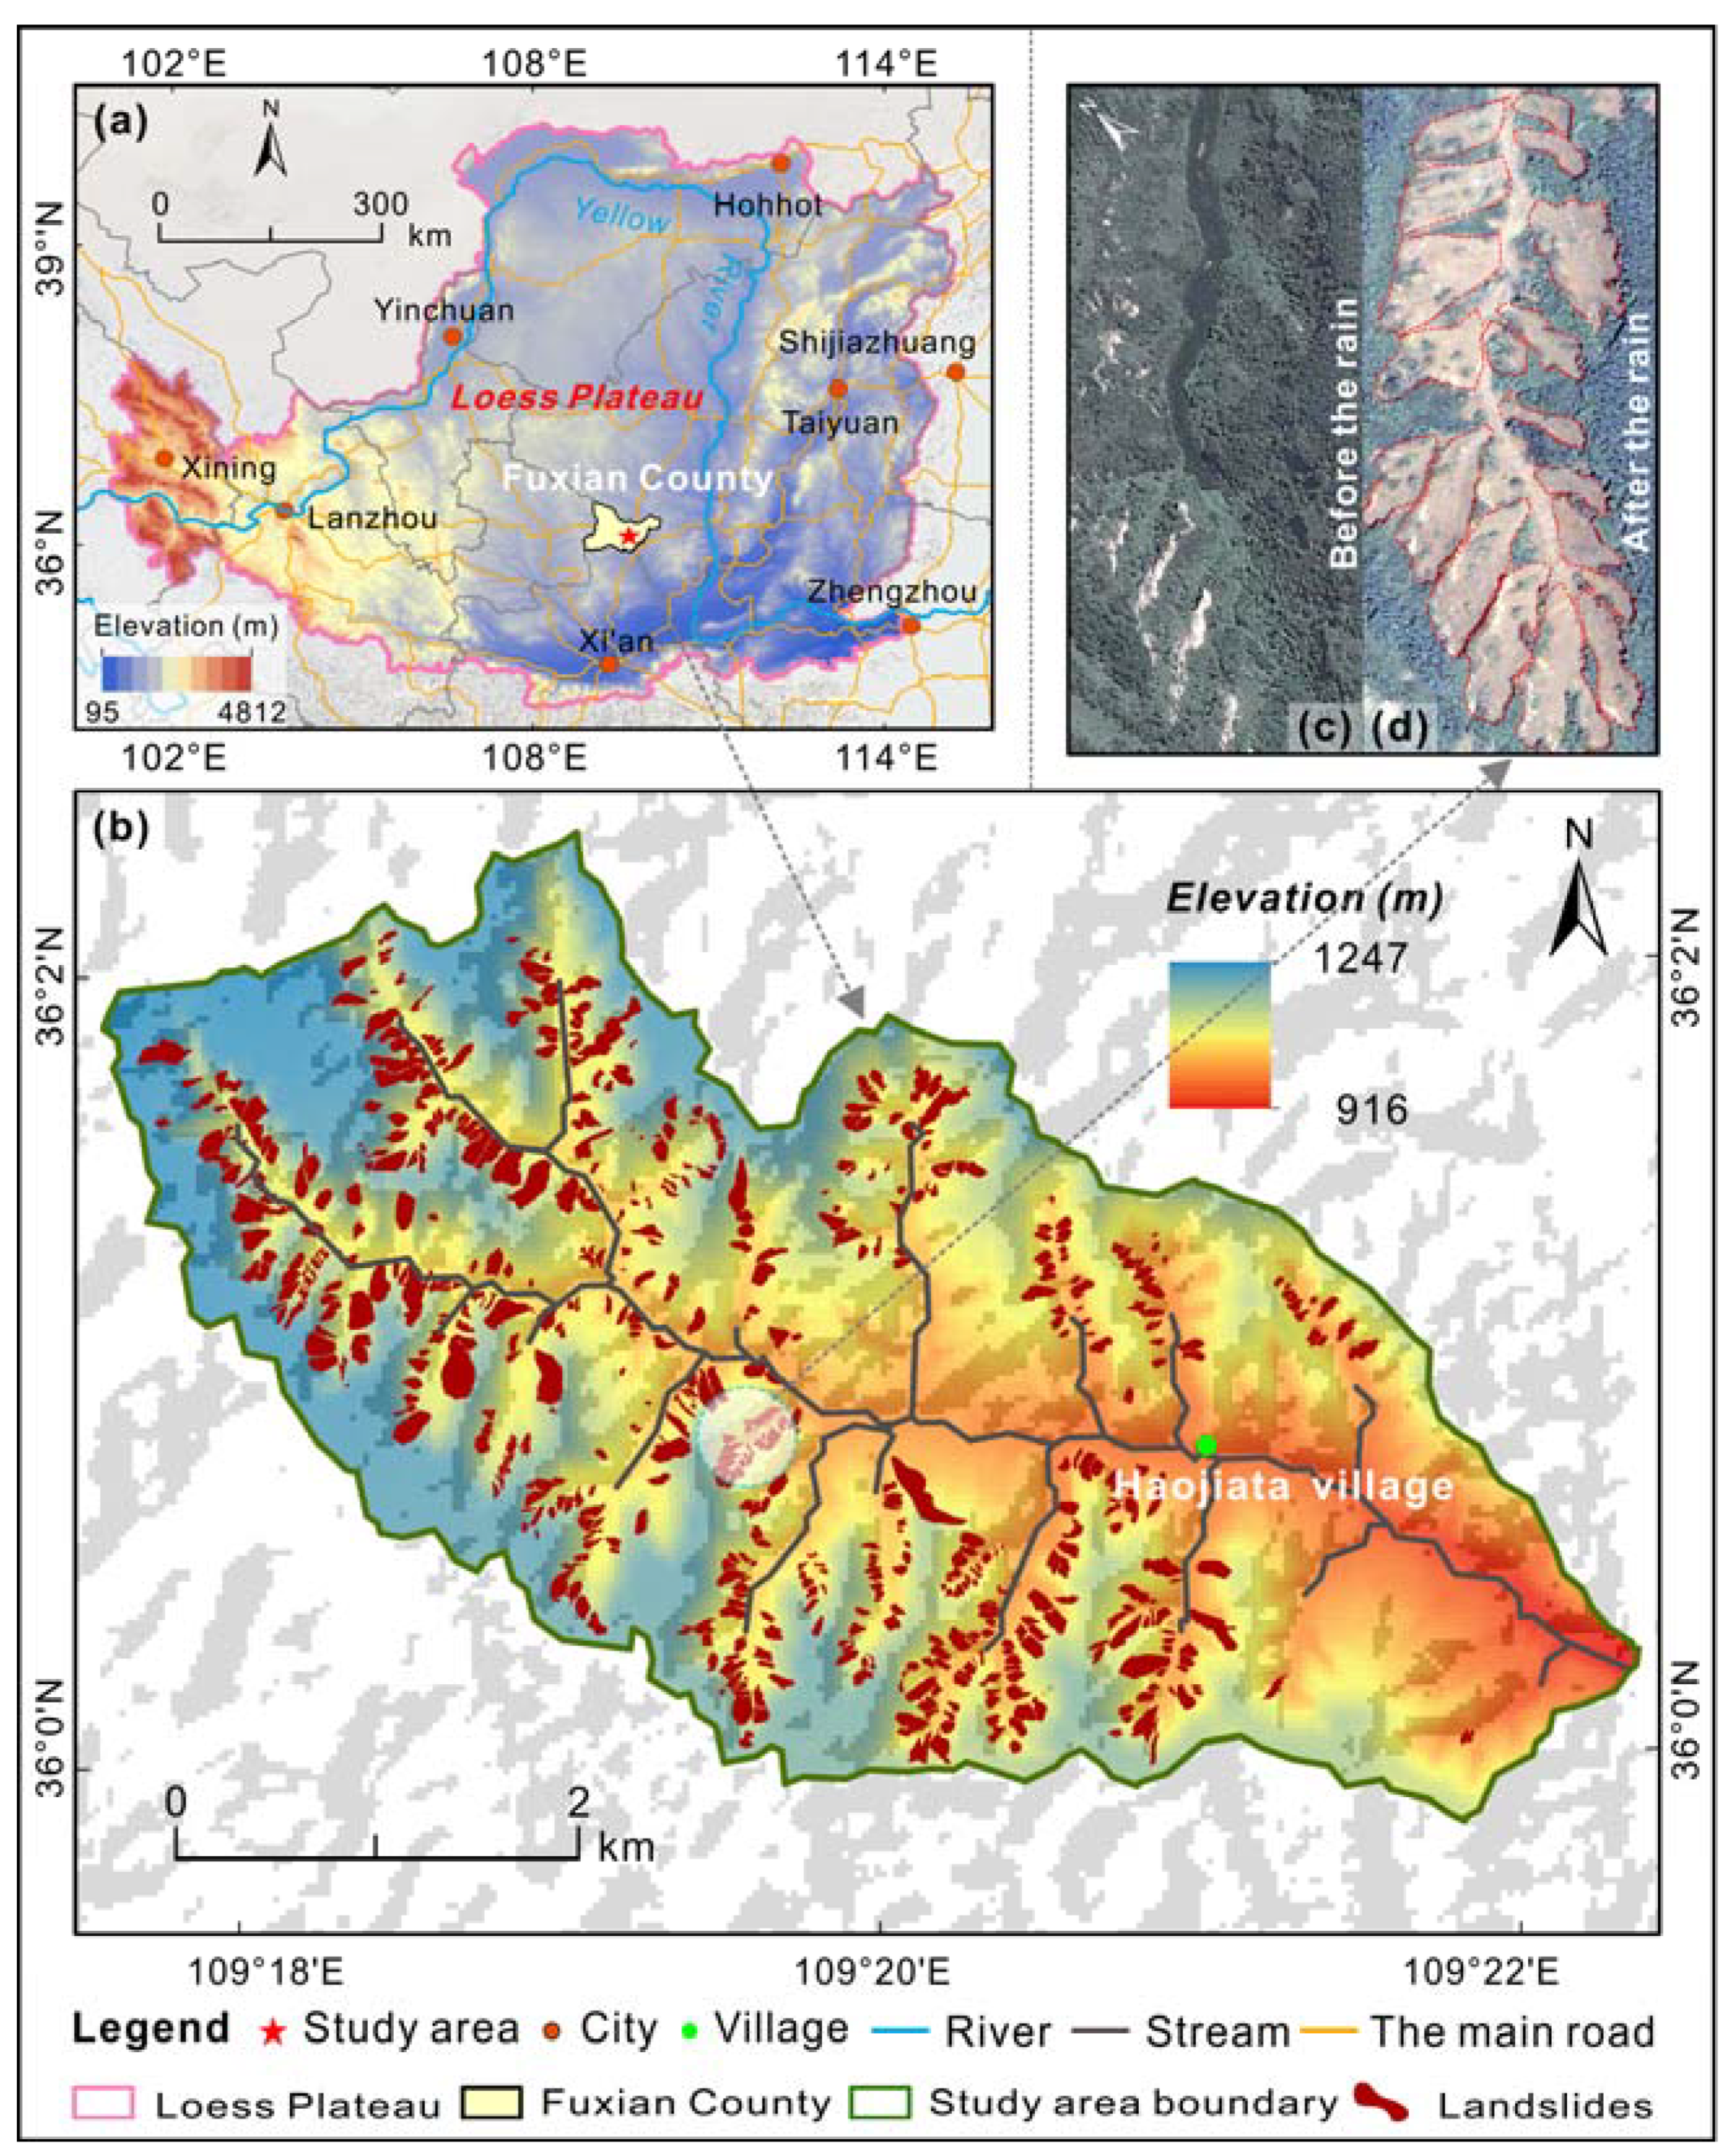
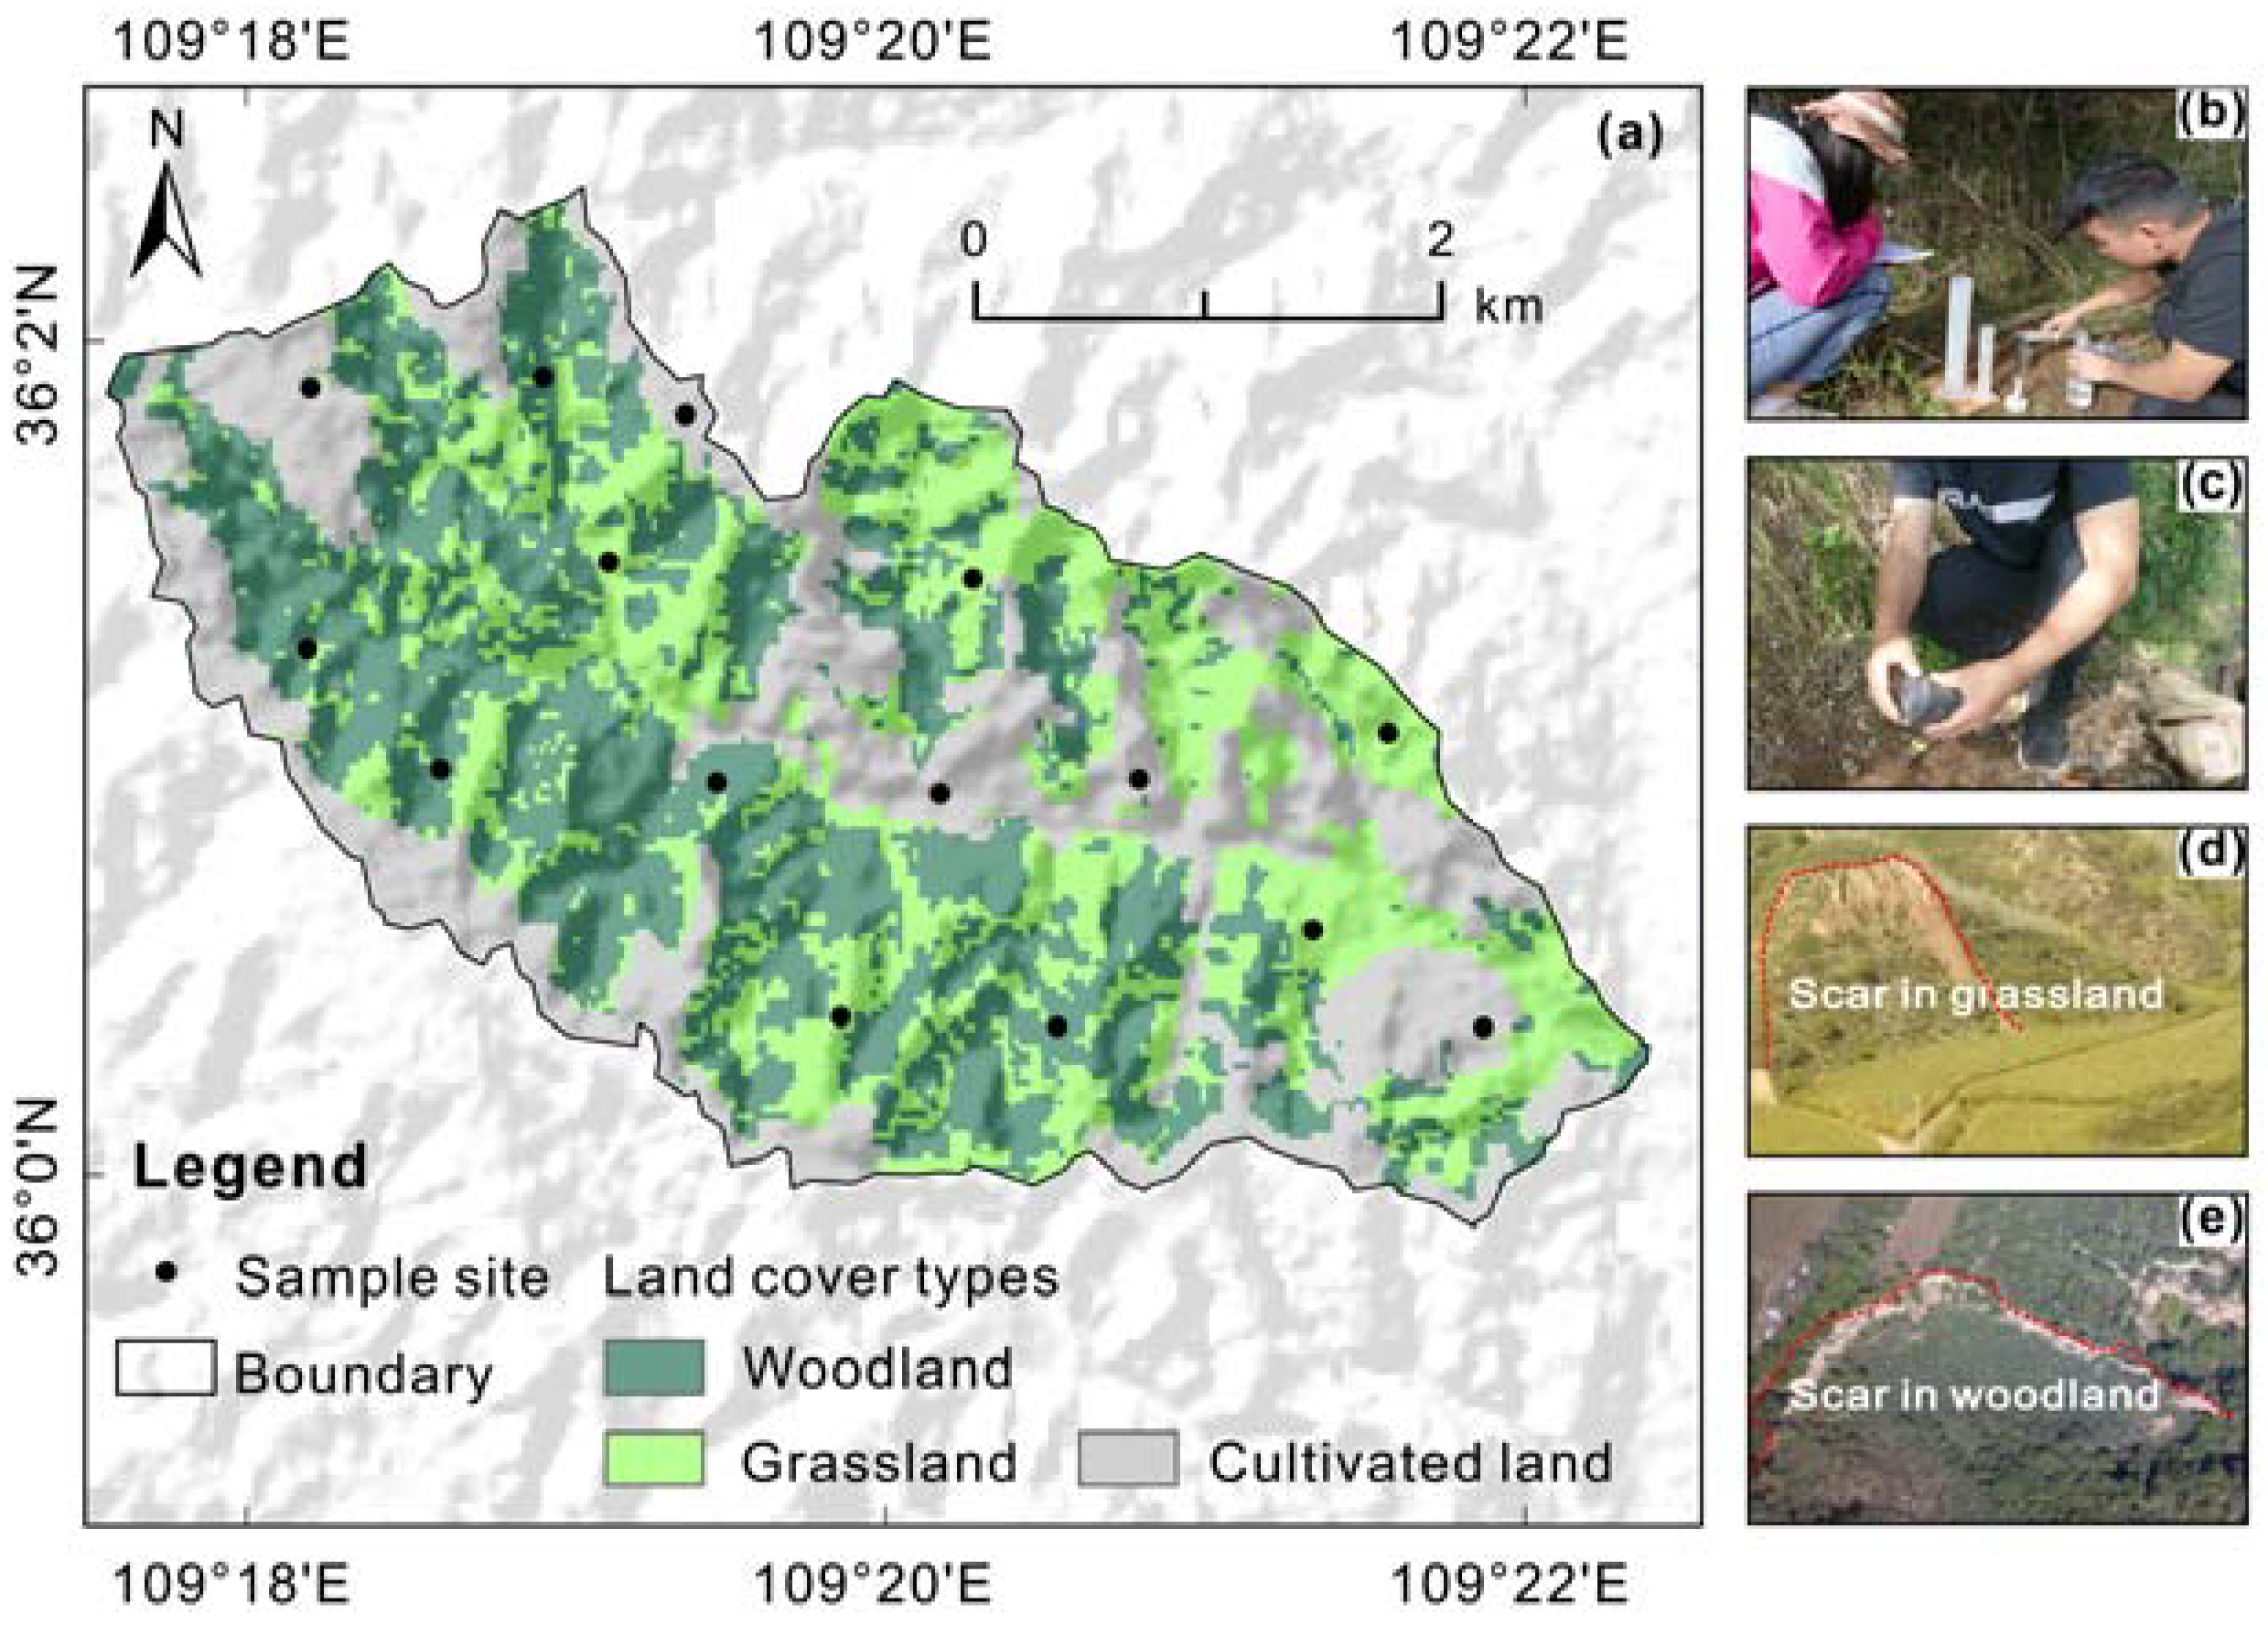
2. Study Area and Data
3. Methodology
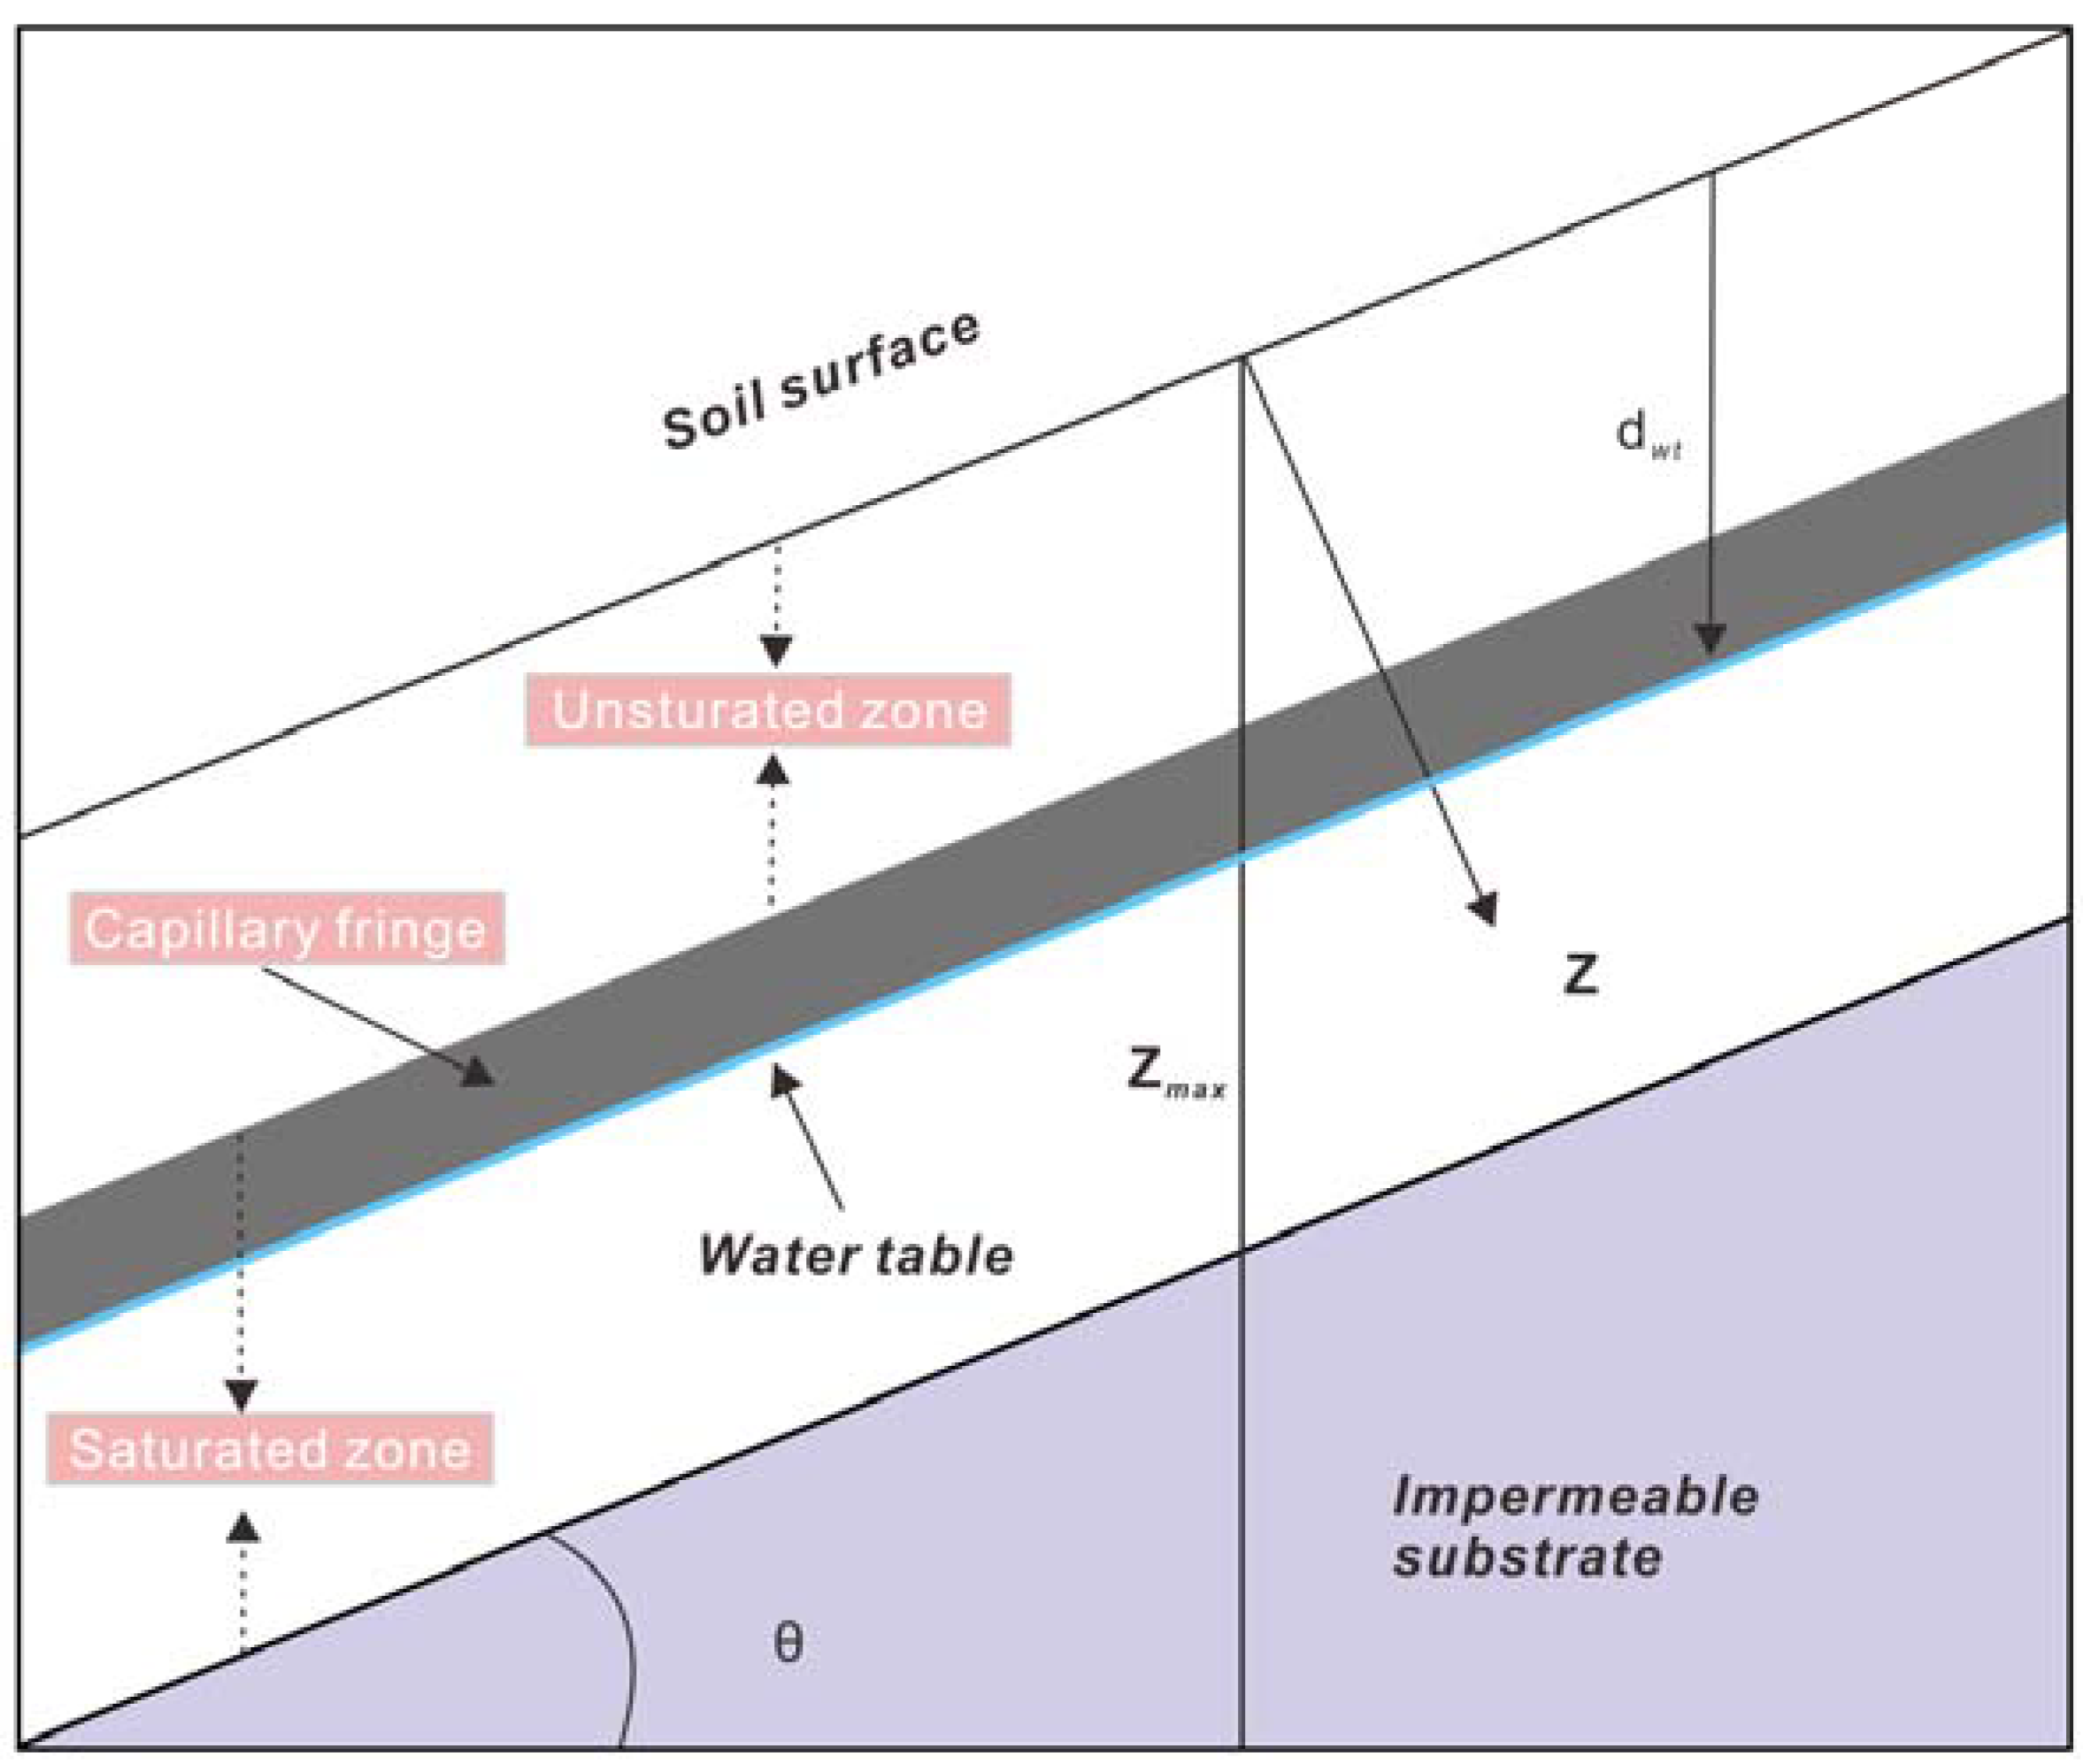
3.1. TRIGRS Model
3.2. Parameters
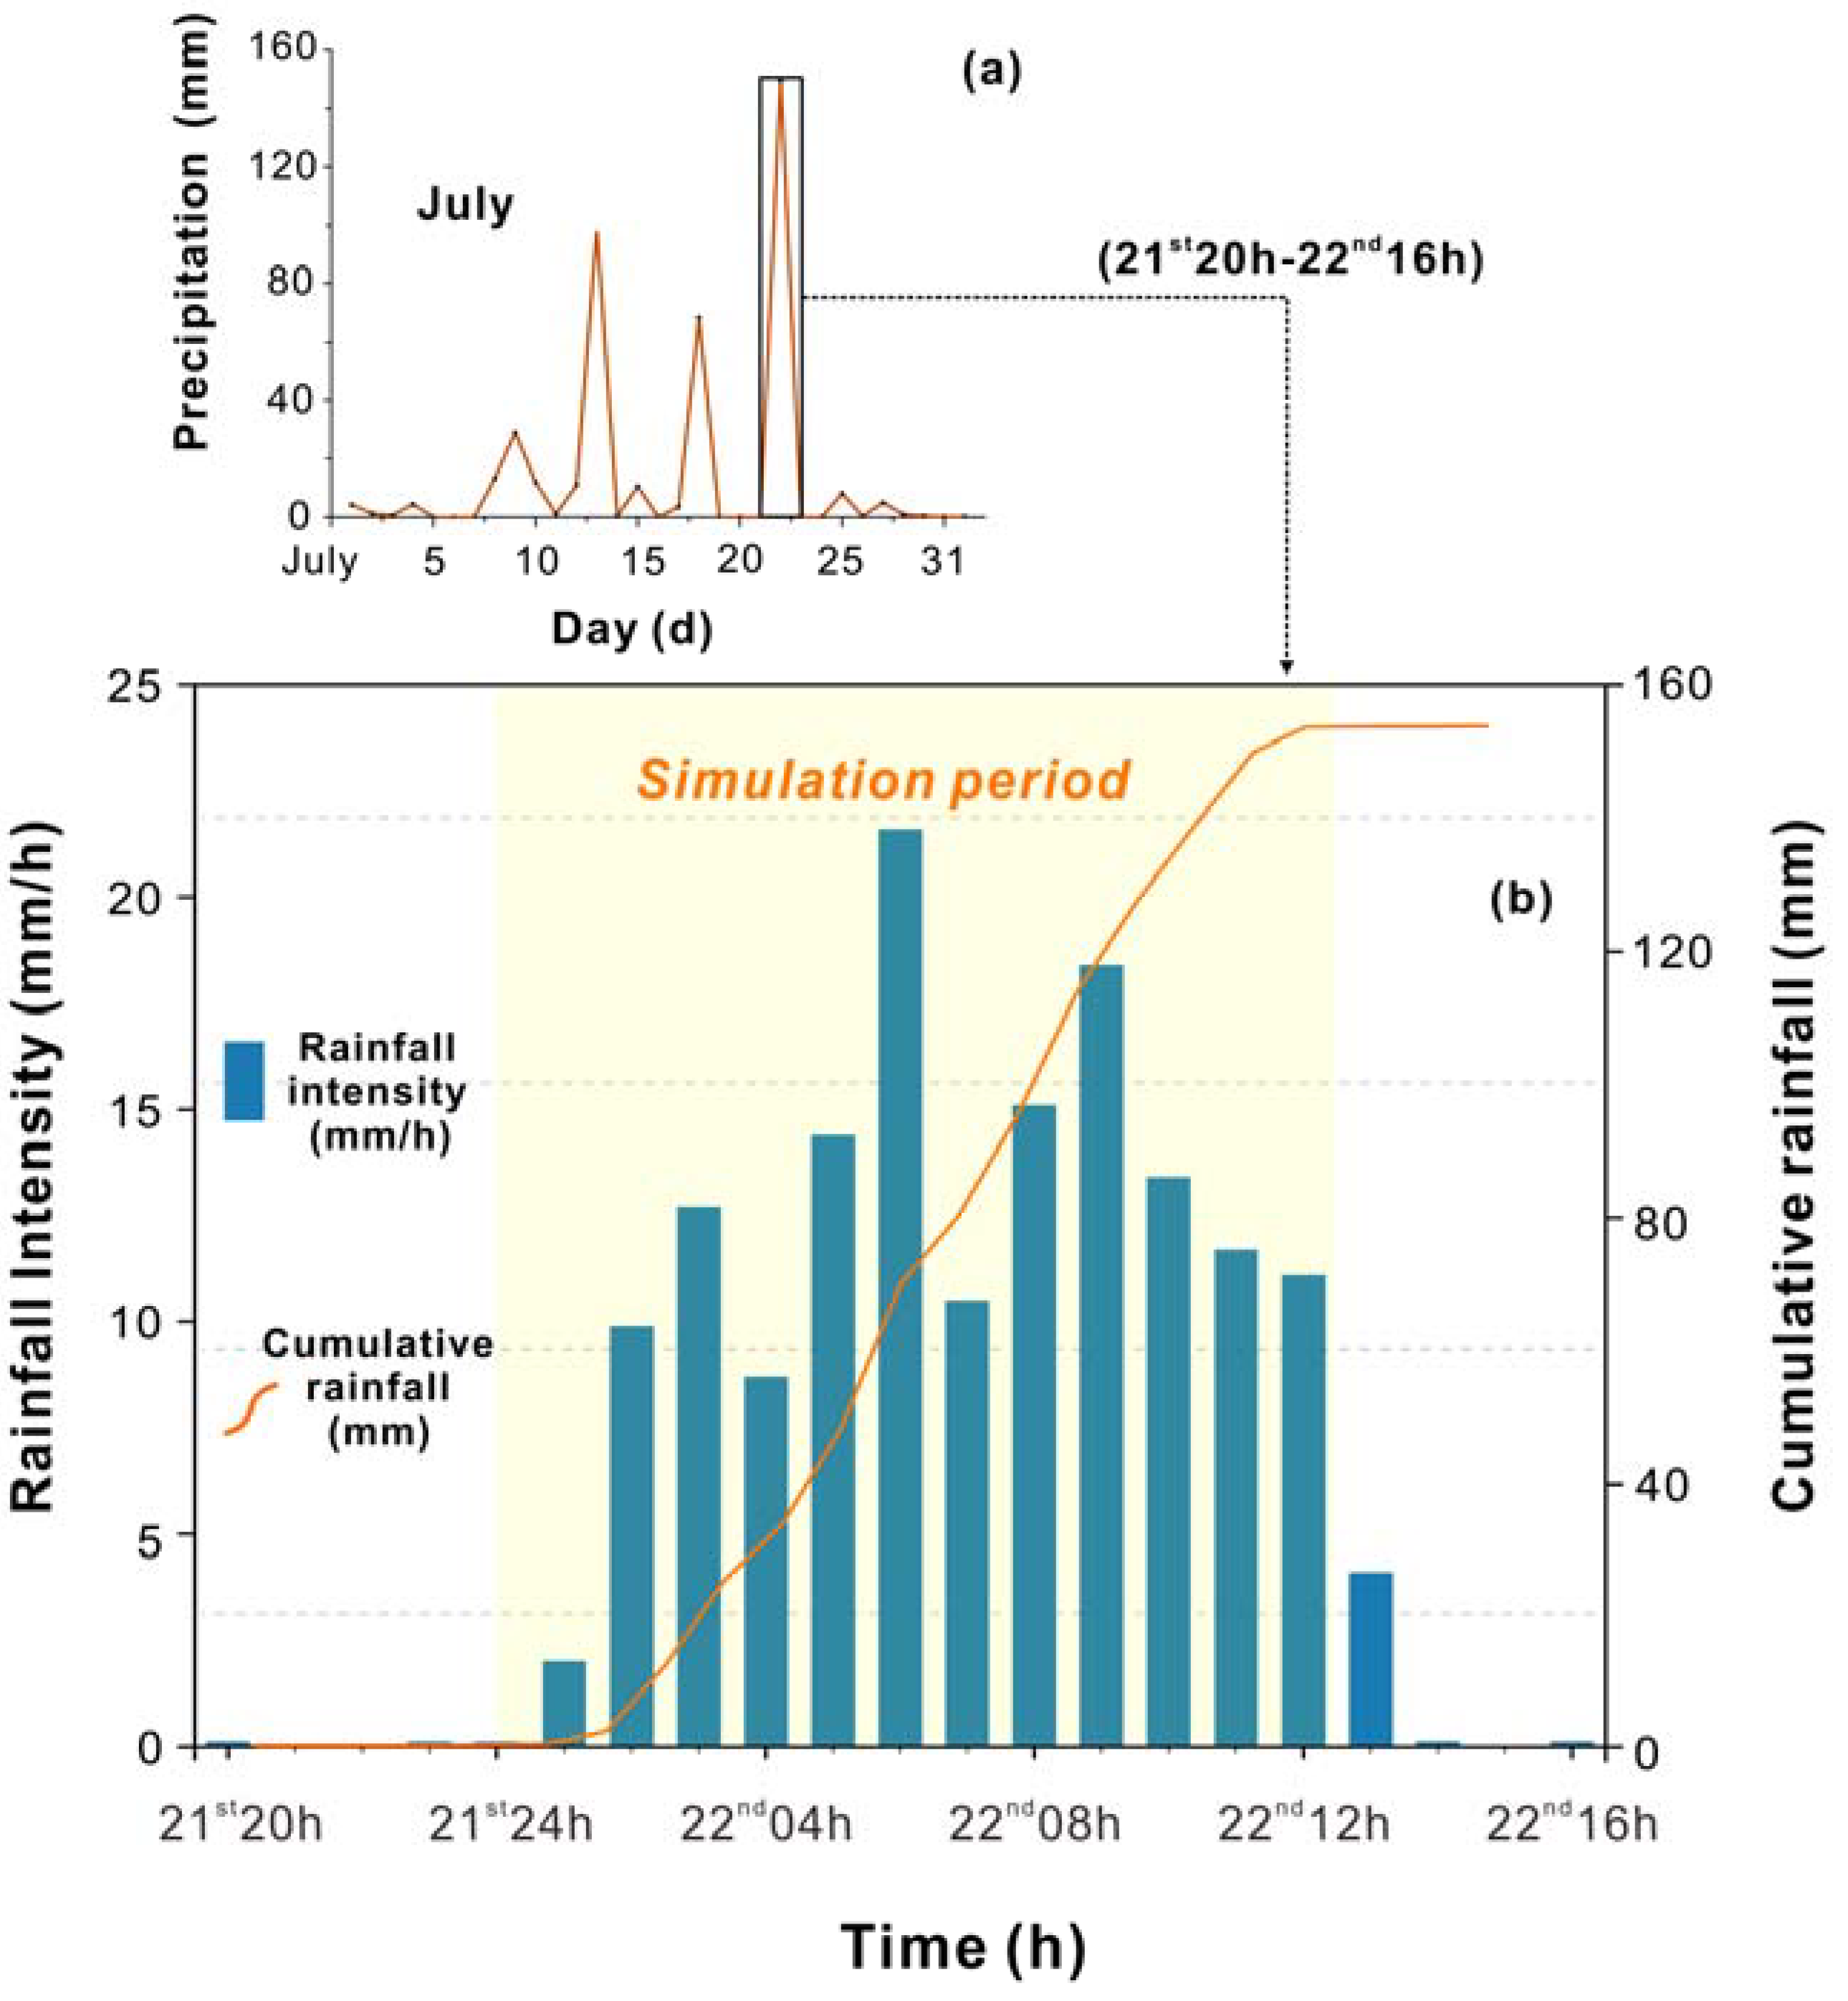
3.3. Rainfall Data
3.4. Evaluation of Model Accuracy
4. Results
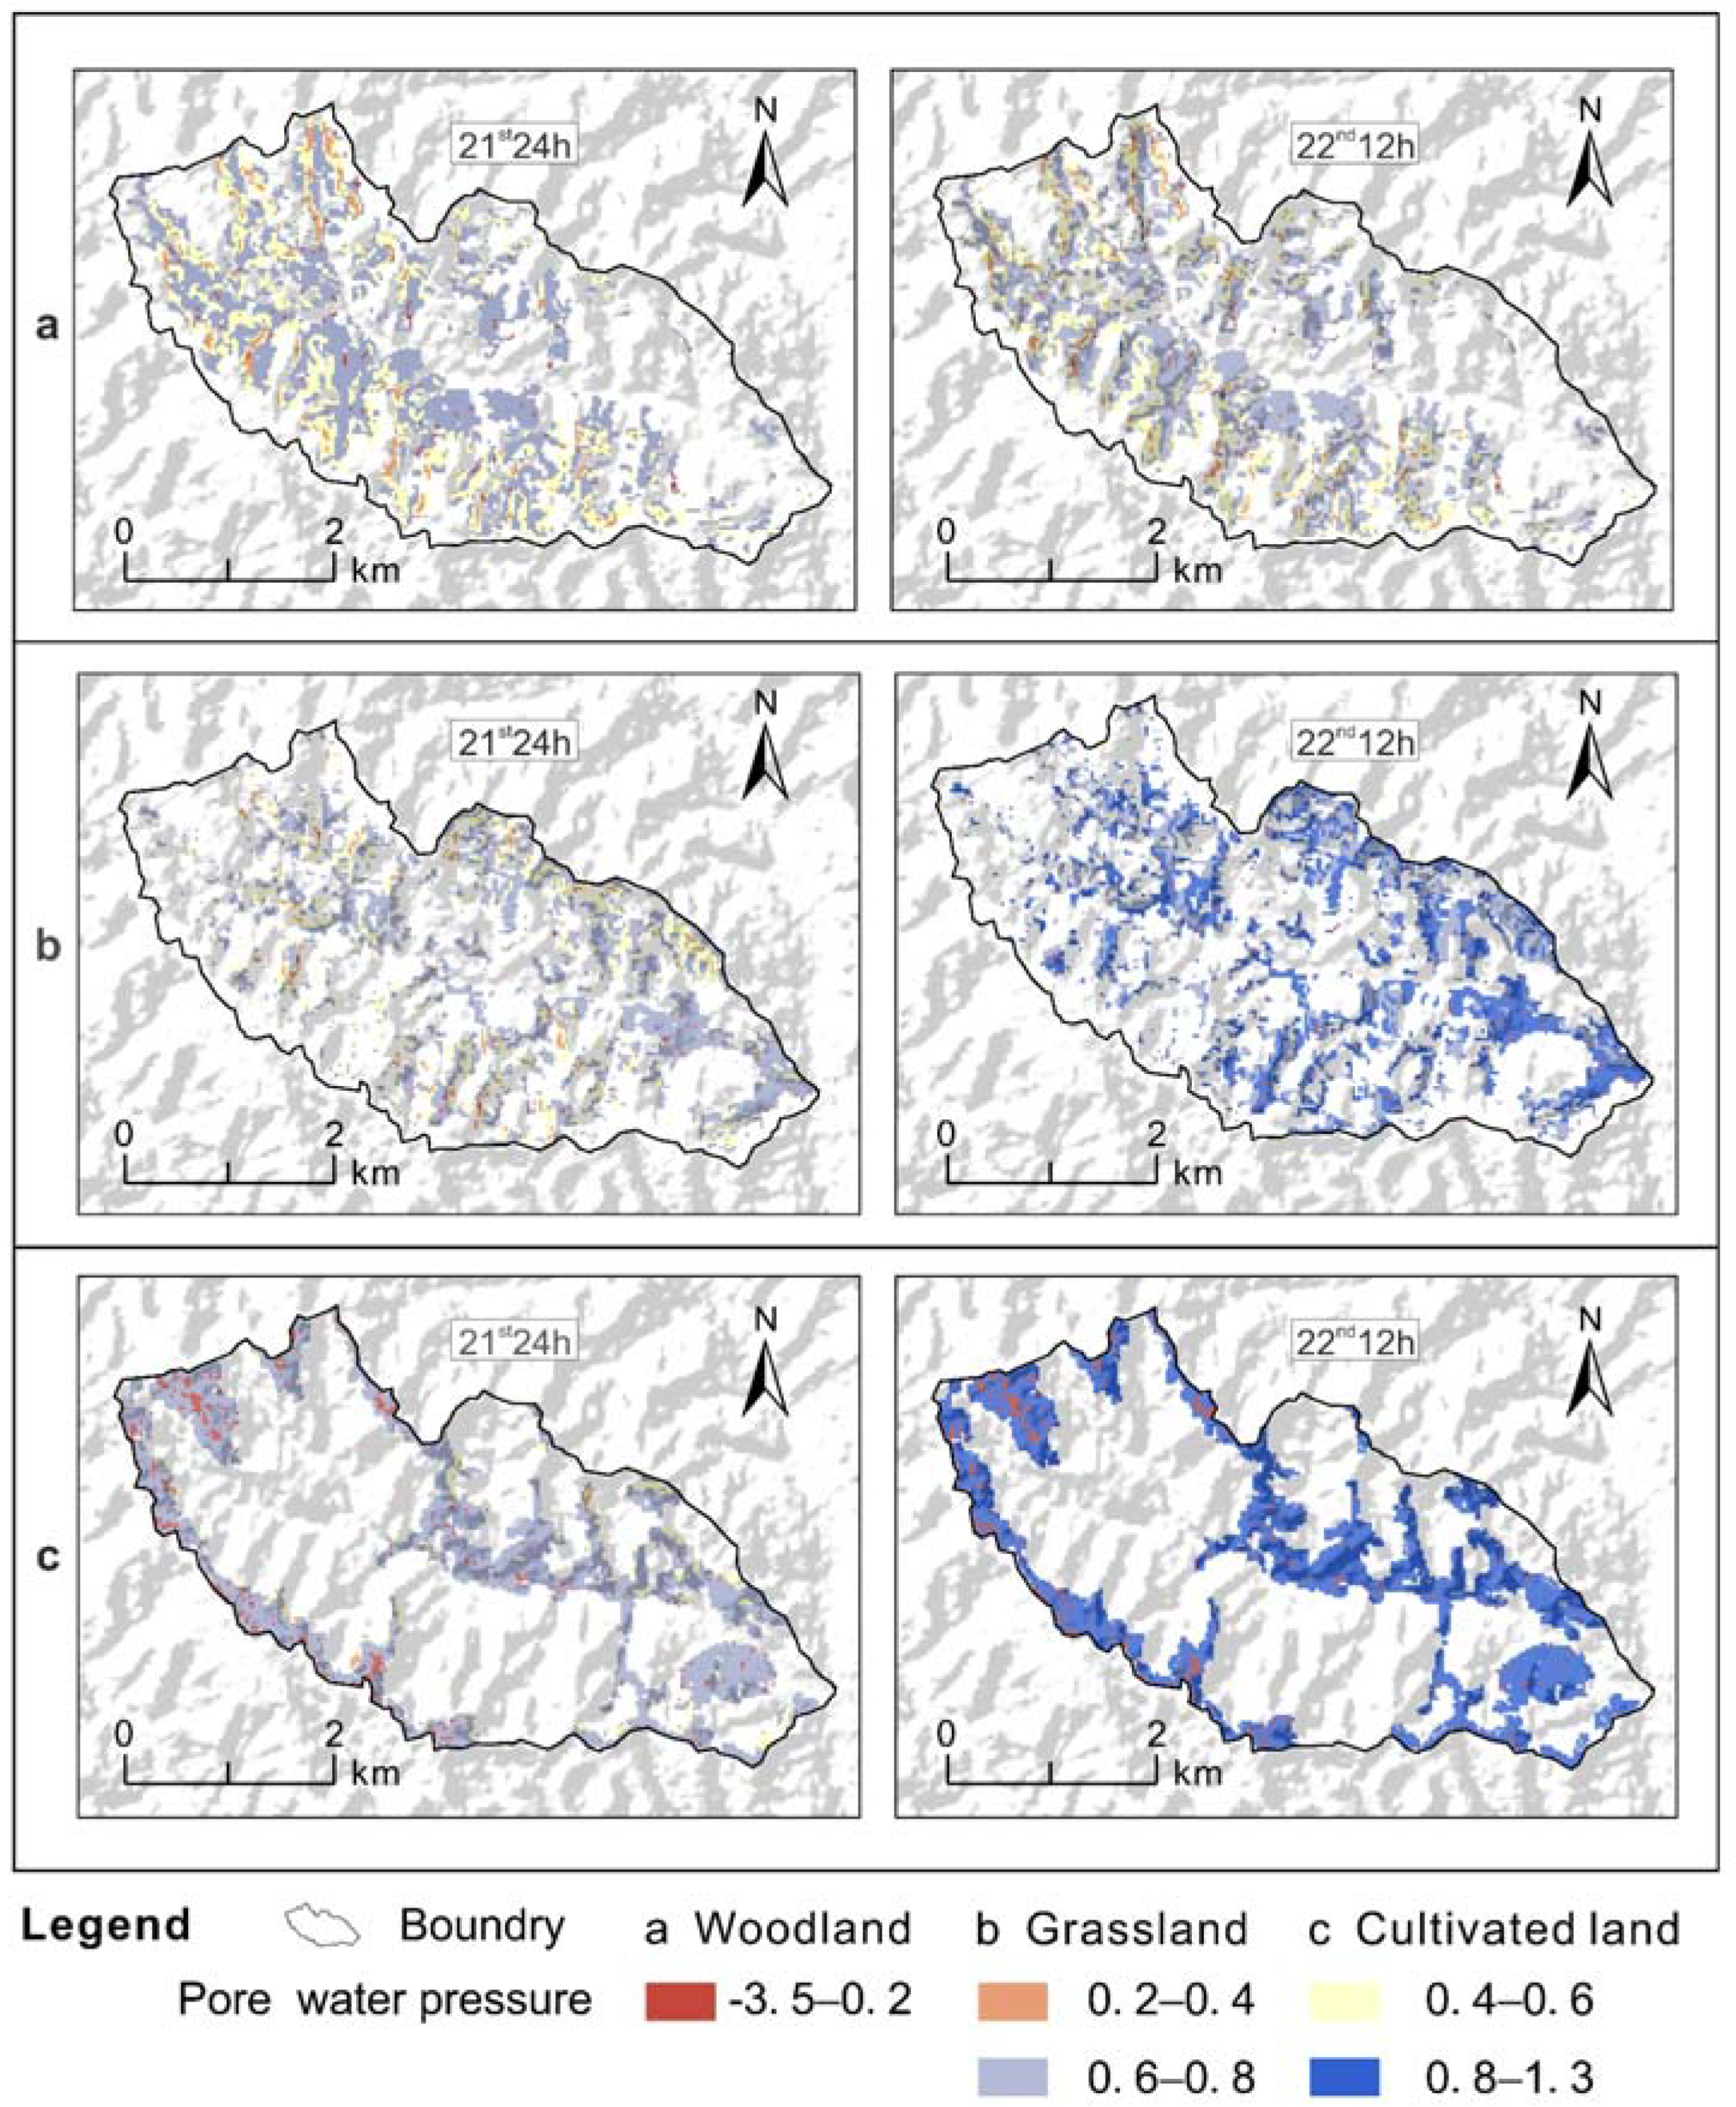
4.1. Evaluation of Pore Water Pressure in the Slopes Covered with Vegetation
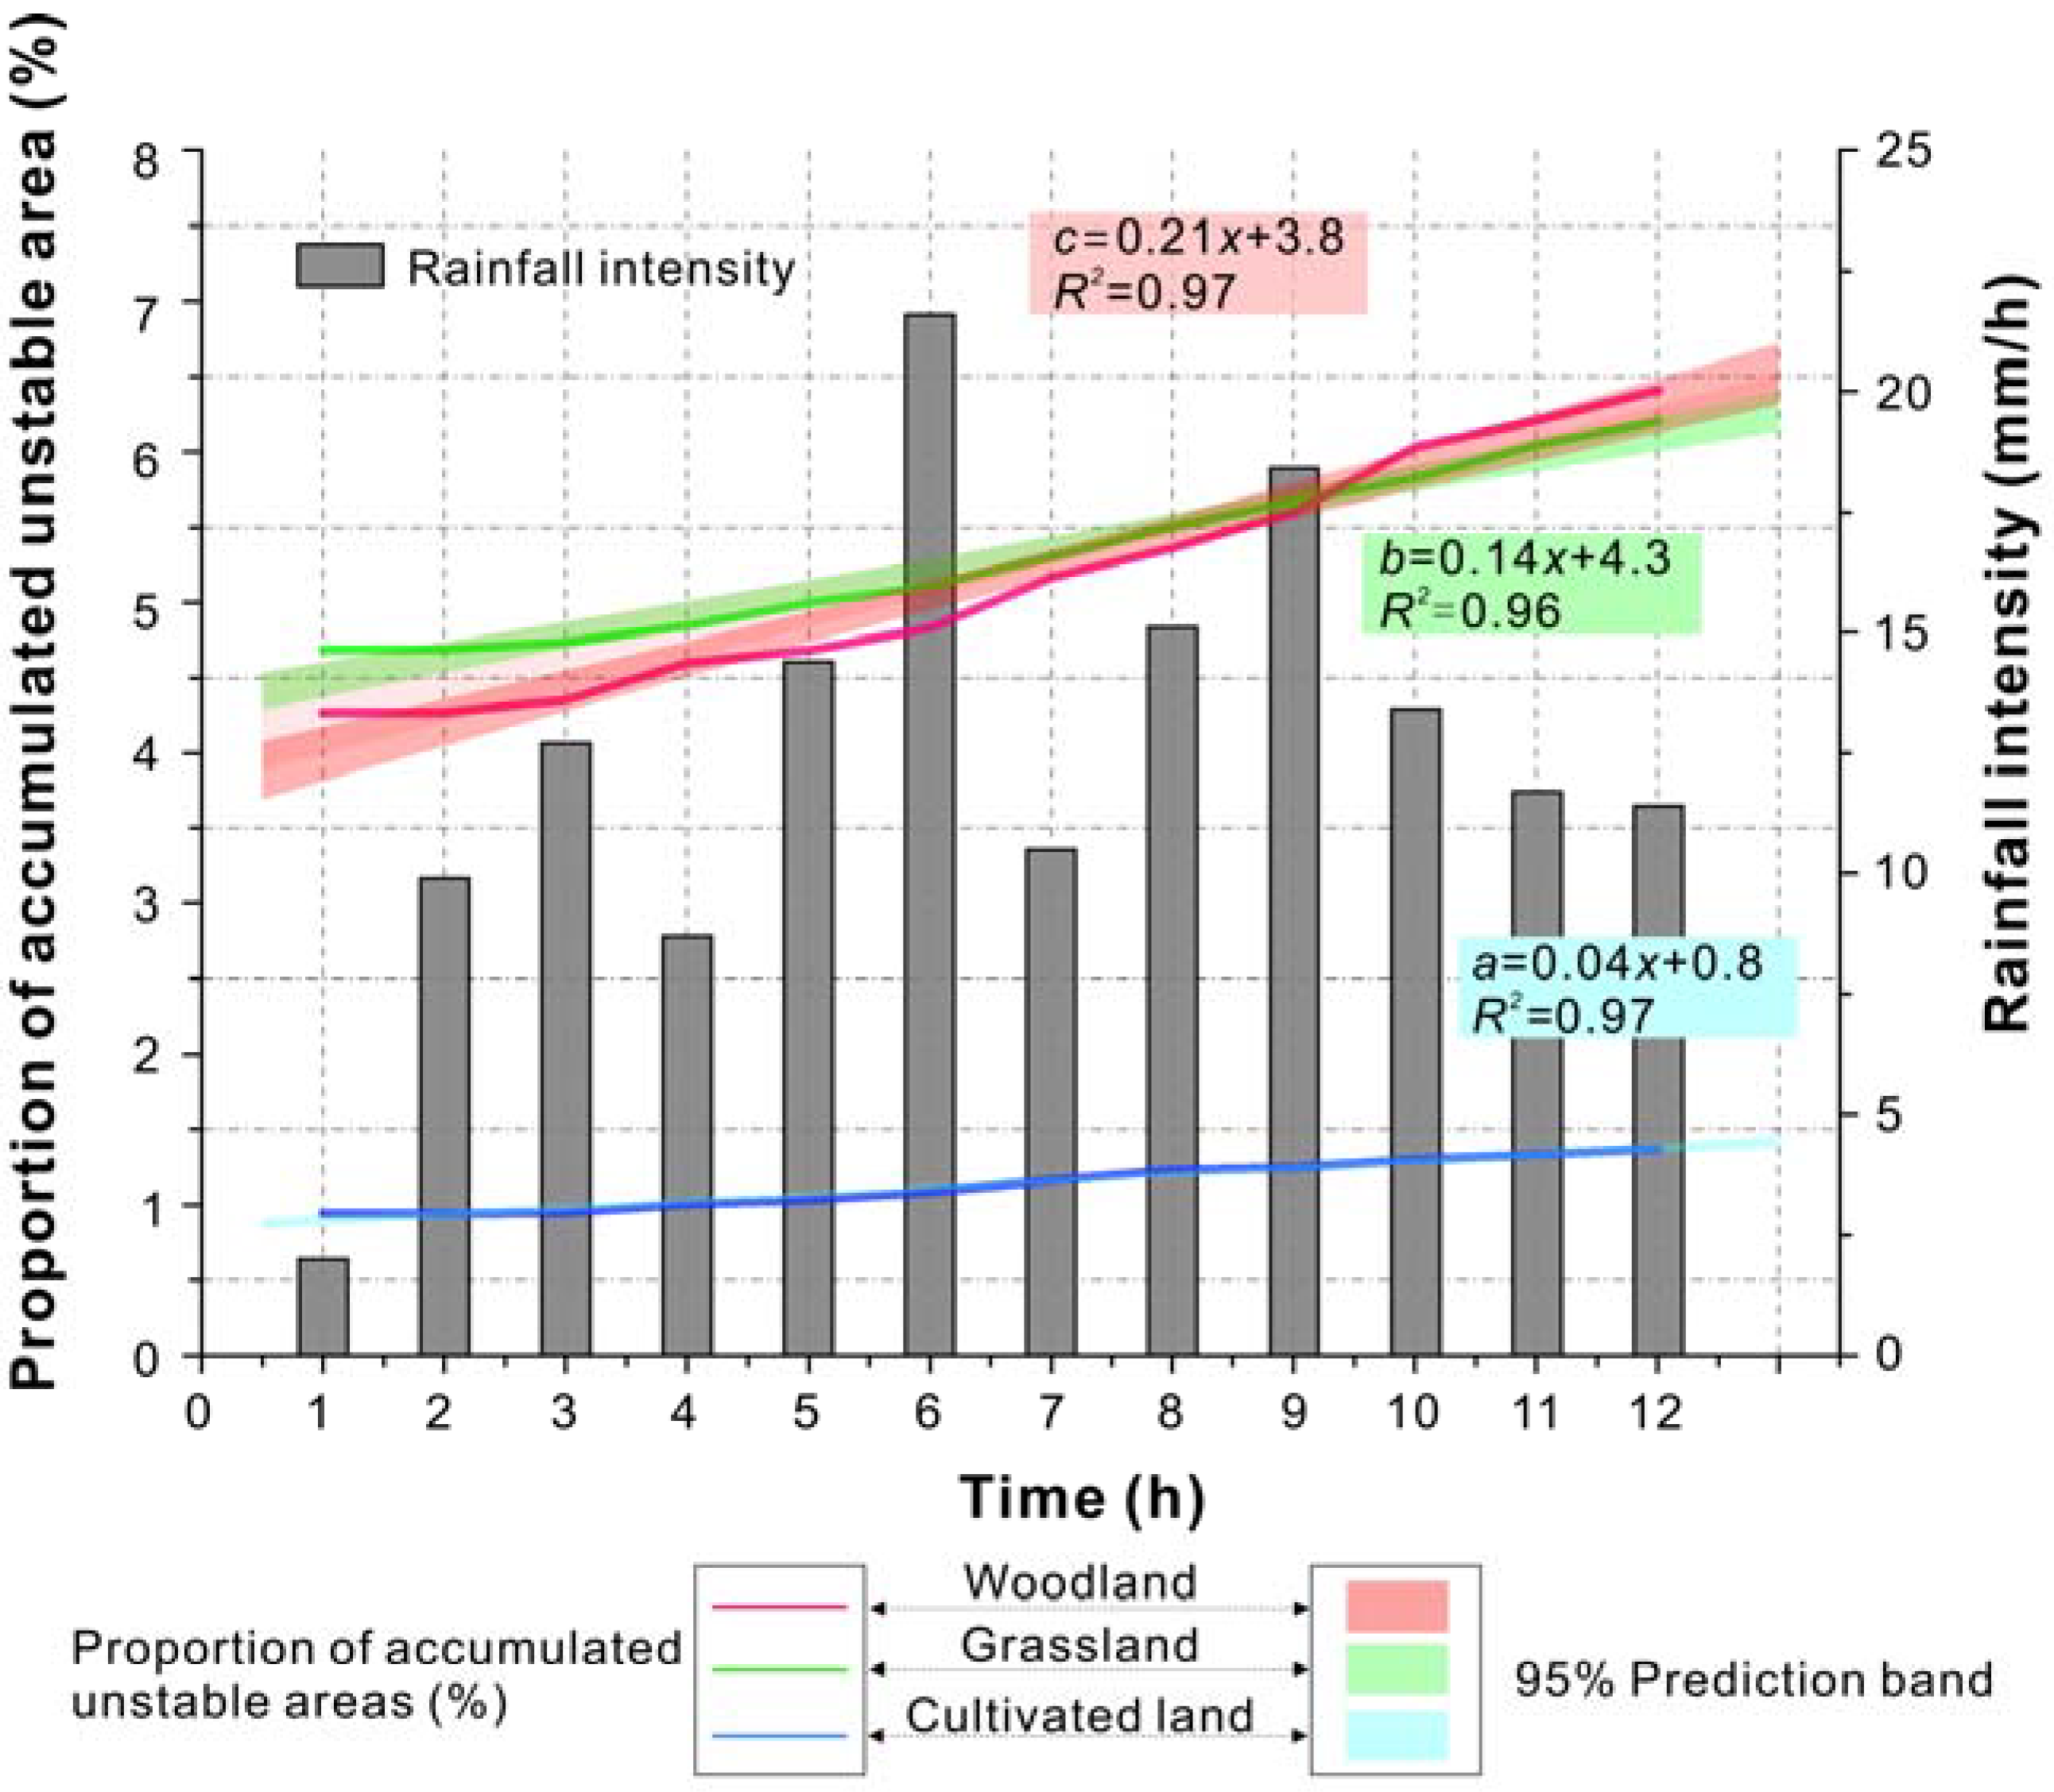
4.2. Cumulative Changes in Slope Instability on the Rainfall Time Scale
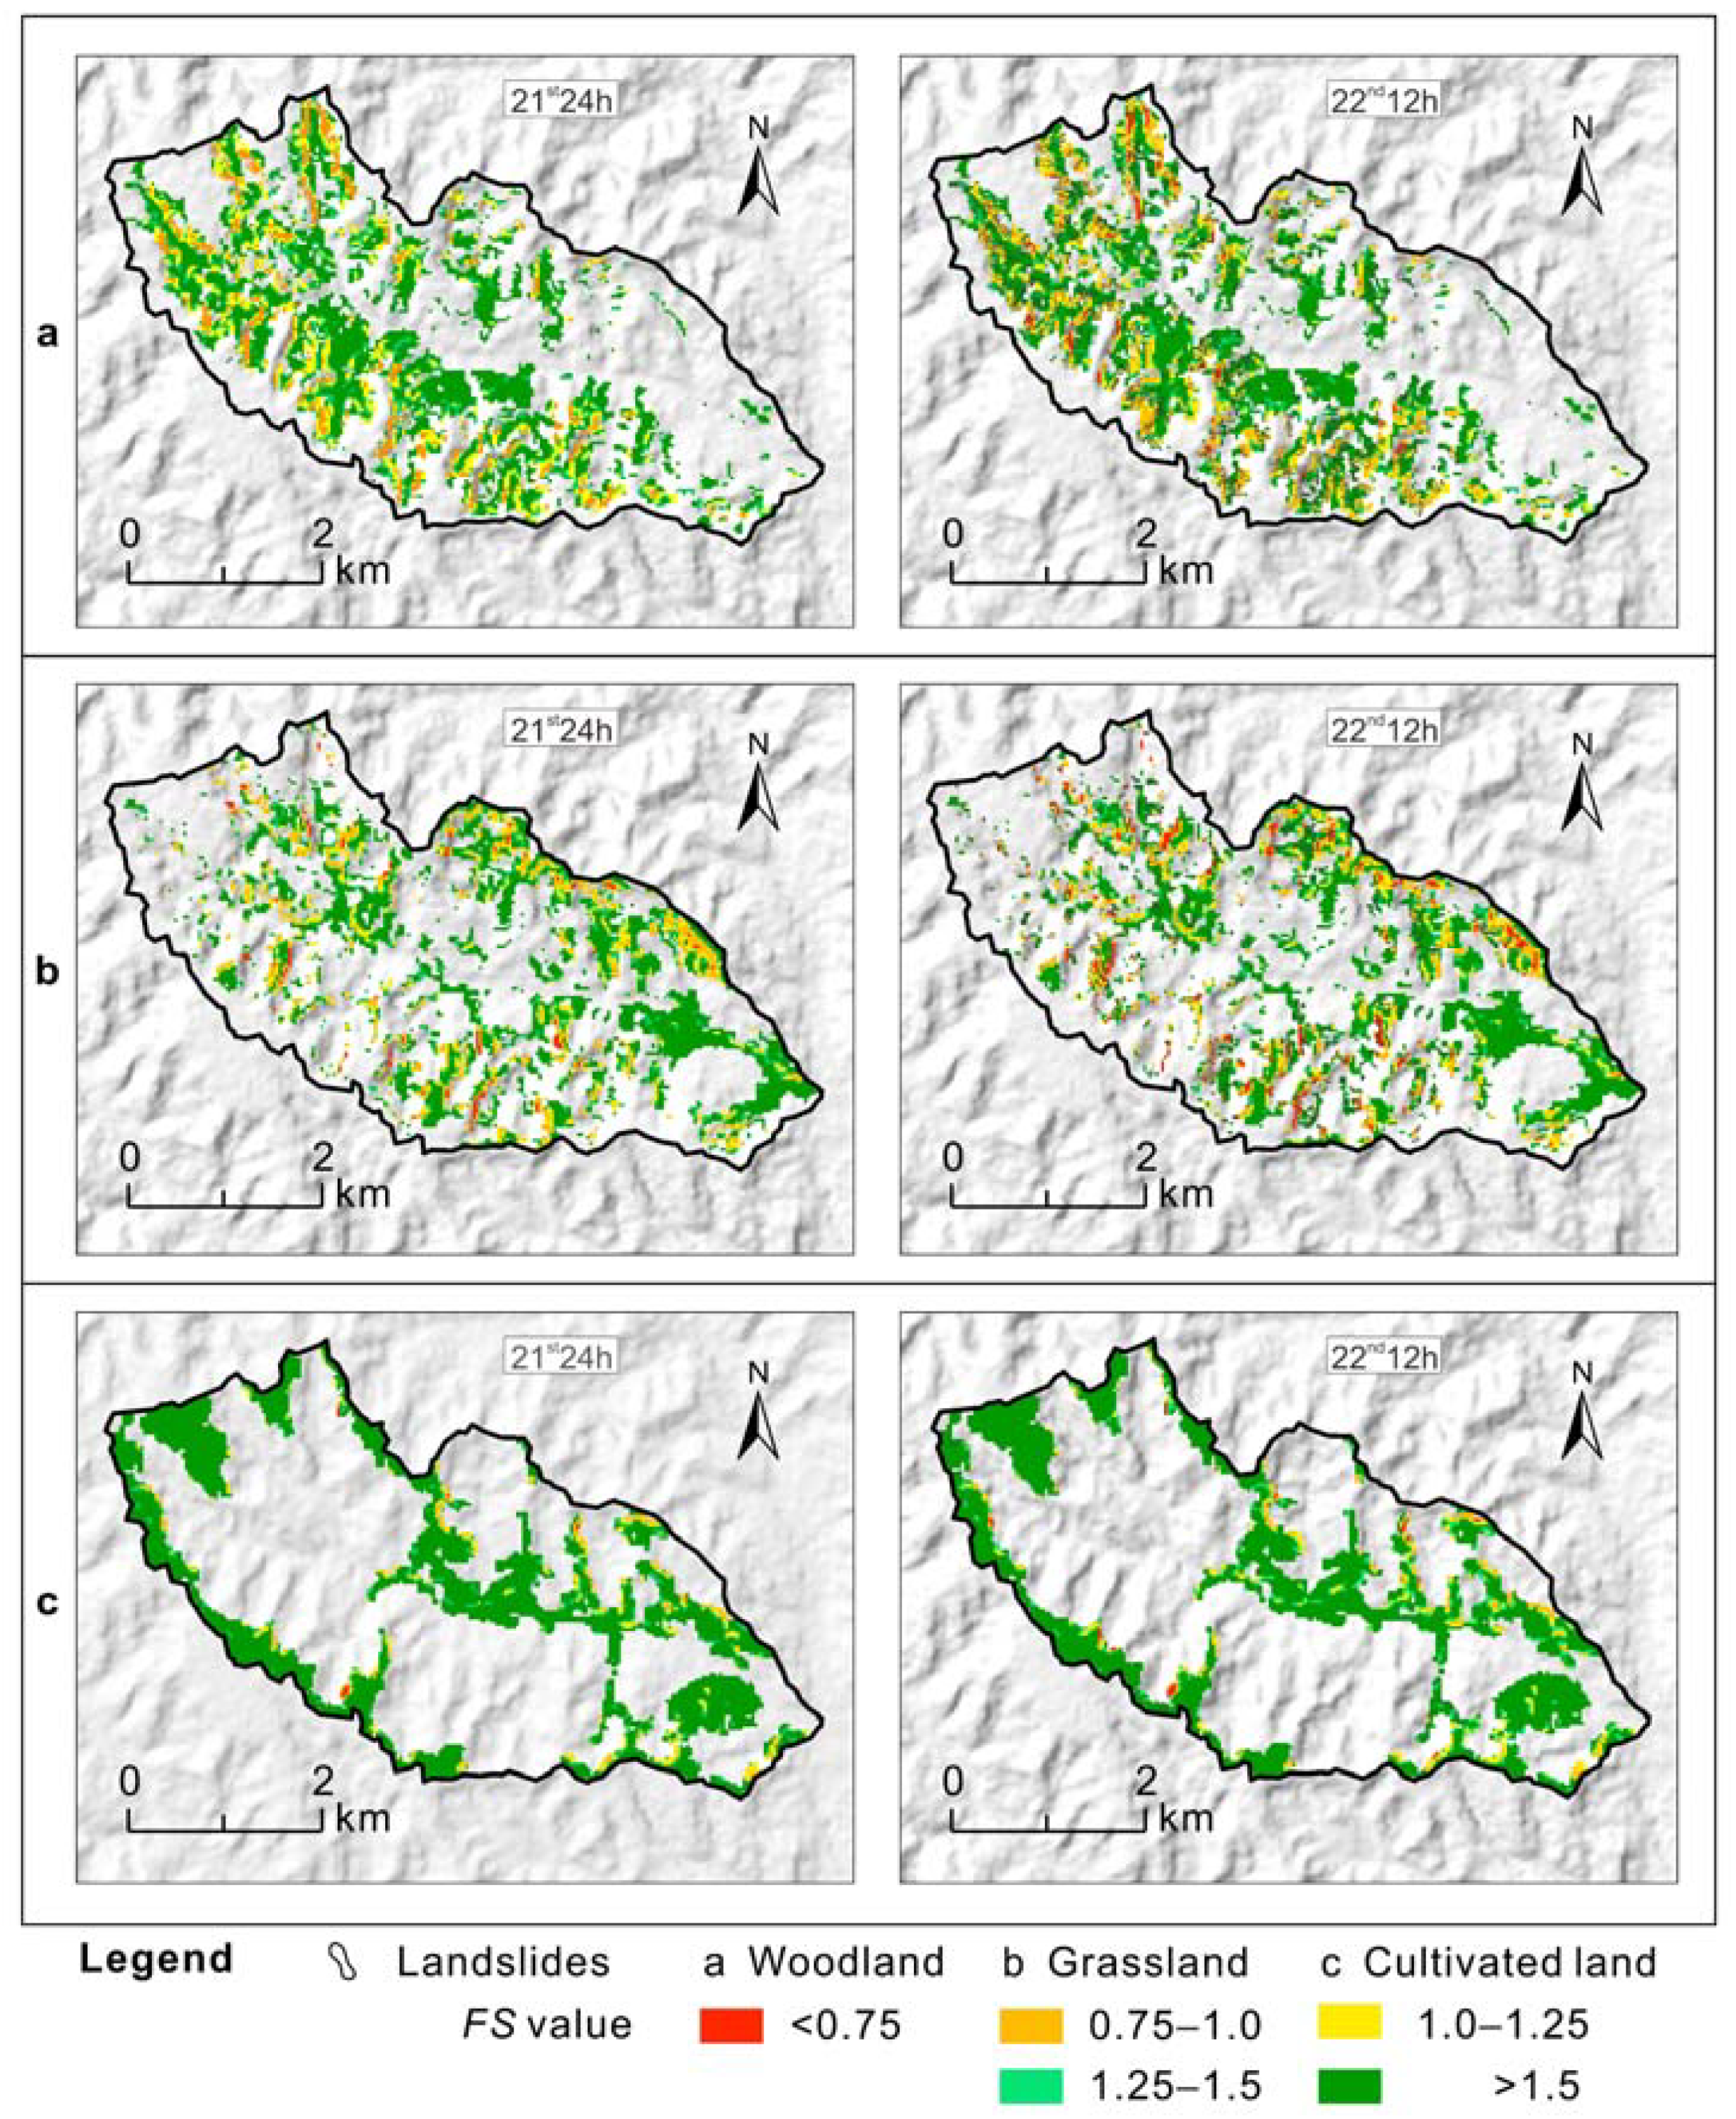
4.3. Spatial and Temporal Evolution of Landslide Hazards
4.4. Verification
5. Discussion
6. Conclusions
Author Contributions
Funding
Institutional Review Board Statement
Informed Consent Statement
Data Availability Statement
Acknowledgments
Conflicts of Interest
References
- Alvioli, M.; Baum, R.L. Parallelization of the TRIGRS model for rainfall-induced landslides using the message passing interface. Environ. Model. Softw. 2016, 81, 22–135. [Google Scholar] [CrossRef]
- Liu, Z.; Qiu, H.; Zhu, Y.; Liu, Y.; Yang, D.; Ma, S.; Zhang, J.; Wang, Y.; Wang, L.; Tang, B. Efficient Identification and Monitoring of Landslides by Time-Series InSAR Combining Single- and Multi-Look Phases. Remote Sens. 2022, 14, 1026. [Google Scholar] [CrossRef]
- Wang, L.; Qiu, H.; Zhou, W.; Zhu, Y.; Liu, Z.; Ma, S.; Yang, D.; Tang, B. The post-failure spatiotemporal deformation of certain translational landslides may follow the pre-failure pattern. Remote Sens. 2022, 14, 2333. [Google Scholar] [CrossRef]
- Qiu, H.; Zhu, Y.; Zhou, W.; Sun, H.; He, J.; Liu, Z. Influence of DEM resolution on landslide simulation performance based on the Scoops3D model. Geomat. Nat. Hazards Risk 2022, 13, 1663–1681. [Google Scholar] [CrossRef]
- Gonzalez-Ollauri, A.; Mickovski, S.B. Hydrological effect of vegetation against rainfall-induced landslides. J. Hydrol. 2017, 549, 374–387. [Google Scholar] [CrossRef] [Green Version]
- Lin, Q.; Wang, Y. Spatial and temporal analysis of a fatal landslide inventory in China from 1950 to 2016. Landslides 2018, 15, 2357–2372. [Google Scholar] [CrossRef]
- Qiu, H.; Cui, Y.; Pei, Y.; Yang, D.; Ma, S. Temporal patterns of nonseismically triggered landslides in Shaanxi province, China. Catena 2020, 187, 104356. [Google Scholar] [CrossRef]
- Chae, B.-G.; Park, H.-J.; Catani, F.; Simoni, A.; Berti, M. Landslide prediction, monitoring and early warning: A concise review of state-of-the-art. Geosci. J. 2017, 21, 1033–1070. [Google Scholar] [CrossRef]
- Kjekstad, O.; Highland, L. Economic and Social Impacts of Landslides. In Landslides—Disaster Risk Reduction; Sassa, K., Canuti, P., Eds.; Springer: Berlin/Heidelberg, Germany, 2009; Volume 30, pp. 573–587. [Google Scholar] [CrossRef]
- Stähli, M.; Sättele, M.; Huggel, C.; McArdell, B.W.; Lehmann, P.; Van Herwijnen, A.; Berne, A.; Schleiss, M.; Ferrari, A.; Kos, A. Monitoring and prediction in early warning systems for rapid mass movements. Nat. Hazards Earth Syst. Sci. 2015, 15, 905–917. [Google Scholar] [CrossRef]
- Cui, Y.; Zhou, X.; Guo, C. Experimental study on the moving characteristics of fine grains in wide grading unconsolidated soil under heavy rainfall. J. Mt. Sci. 2017, 14, 417–431. [Google Scholar] [CrossRef]
- Fan, W.; Lv, J.; Cao, Y.; Shen, M.; Deng, L.; Wei, Y. Characteristics and block kinematics of a fault-related landslide in the Qinba mountains, western China. Eng. Geol. 2018, 249, 162–171. [Google Scholar] [CrossRef]
- Bui, D.T.; Tsangaratos, P.; Nguyen, V.-T.; Liem, N.V.; Trinh, P.T. Comparing the prediction performance of a Deep Learning Neural Network model with conventional machine learning models in landslide susceptibility assessment. Catena 2020, 188, 104426. [Google Scholar] [CrossRef]
- Crozier, M.J. Deciphering the effect of climate change on landslide activity: A review. Geomorphology 2010, 124, 260–267. [Google Scholar] [CrossRef]
- Gariano, S.L.; Guzzetti, F. Landslides in a changing climate. Earth-Sci. Rev. 2016, 162, 227–252. [Google Scholar] [CrossRef] [Green Version]
- Conforti, M.; Pascale, S.; Robustelli, G.; Sdao, F. Evaluation of prediction capability of the artificial neural networks for mapping landslide susceptibility in the turbolo river catchment (northern calabria, italy). Catena 2014, 113, 236–250. [Google Scholar] [CrossRef]
- Liu, Y.; Qiu, H.; Yang, D.; Liu, Z.; Ma, S.; Pei, Y.; Zhang, J.; Tang, B. Deformation responses of landslides to seasonal rainfall based on insar and wavelet analysis. Landslides 2021, 19, 199–210. [Google Scholar] [CrossRef]
- Lan, H.; Peng, J.; Zhu, Y.; Li, L.; Pan, B.; Huang, Q.; Li, J.; Zhang, Q. Study and prospect of geological surface processes and major disaster effects in the Yellow River Basin. Sci. Sin. Terrae 2021, 52, 199–221. (In Chinese) [Google Scholar]
- Fan, L.; Lehmann, P.; Zheng, C.; Or, D. Rainfall Intensity Temporal Patterns Affect Shallow Landslide Triggering and Hazard Evolution. Geophys. Res. Lett. 2020, 47, 1–9. [Google Scholar] [CrossRef]
- Sorbino, G.; Nicotera, M.V. Unsaturated soil mechanics in rainfall-induced flow landslides. Eng. Geol. 2013, 165, 105–132. [Google Scholar] [CrossRef]
- Garcia-Rodriguez, M.J.; Malpica, J.A.; Benito, B.; Diaz, M. Susceptibility assessment of earthquake-triggered landslides in EI Salvador using logistic regression. Geomorphology 2008, 95, 172–191. [Google Scholar] [CrossRef]
- Van Den Eeckhaut, M.; Hervás, J.; Jaedicke, C.; Malet, J.P.; Montanarella, L.; Nadim, F. Statistical modelling of Europe-wide landslide susceptibility using limited landslide inventory data. Landslides 2011, 9, 357–369. [Google Scholar] [CrossRef]
- Samia, J.; Temme, A.; Bregt, A.; Wallinga, J.; Guzzetti, F.; Ardizzone, F.; Rossi, M. Characterization and quantification of path dependency in landslide susceptibility. Geomorphology 2017, 292, 16–24. [Google Scholar] [CrossRef]
- Bordoloi, S.; Ng, C.W.W. The effects of vegetation traits and their stability functions in bio-engineered slopes: A perspective review. Eng. Geol. 2020, 275, 105742. [Google Scholar] [CrossRef]
- Tagarelli, V.; Cotecchia, F. Coupled hydro-mechanical analysis of the effects of medium depth drainage trenches mitigating deep landslide activity. Eng. Geol. 2022, 297, 106510. [Google Scholar] [CrossRef]
- Saito, H.; Uchiyama, S.; Teshirogi, K. Rapid vegetation recovery at landslide scars detected by multitemporal high-resolution satellite imagery at Aso volcano, Japan. Geomorphology 2022, 398, 107989. [Google Scholar] [CrossRef]
- Wilkinson, P.L.; Anderson, M.G.; Lloyd, D.M. An integrated hydrological model for rain-induced landslide prediction. Earth Surf. Process. Landf. 2002, 27, 1275–1297. [Google Scholar] [CrossRef]
- Keim, R.F.; Skaugset, A.E. Modelling effects of woodland canopies on slope stability. Hydrol. Process. 2003, 17, 1457–1467. [Google Scholar] [CrossRef]
- McGuire, L.A.; Rengers, F.K.; Kean, J.W.; Coe, J.A.; Mirus, B.B.; Baum, R.L.; Godt, J.W. Elucidating the role of vegetation in the initiation of rainfall-induced shallow landslides: Insights from an extreme rainfall event in the Colorado Front Range. Geophys. Res. Lett. 2016, 43, 9074–9092. [Google Scholar] [CrossRef] [Green Version]
- Zheng, H.; Miao, C.; Zhang, G.; Li, X.; Wang, S.; Wu, J.; Gou, J. Is the runoff coefficient increasing or decreasing after ecological restoration on China’s Loess plateau? Int. Soil Water Conserv. Res. 2021, 9, 333–343. [Google Scholar] [CrossRef]
- Feng, X.; Fu, B.; Lu, N.; Zeng, Y.; Wu, B. How ecological restoration alters ecosystem services: An analysis of carbon sequestration in China’s Loess plateau. Sci. Rep. 2013, 3, 2846. [Google Scholar] [CrossRef] [Green Version]
- Wang, S.; Fu, B.; Piao, S.; Lü, Y.; Ciais, P.; Feng, X.; Wang, Y. Reduced sediment transport in the Yellow River due to anthropogenic changes. Nat. Geosci. 2015, 9, 37–41. [Google Scholar] [CrossRef]
- Zhao, C.; Gao, J.; Huang, Y.; Wang, G.; Xu, Z. The Contribution of Astragalus adsurgens Roots and Canopy to Water Erosion Control in the Water–Wind Crisscrossed Erosion Region of the Loess Plateau, China. Land Degrad. Dev. 2016, 27, 265–273. [Google Scholar] [CrossRef]
- Guo, W.; Chen, Z.; Wang, W.; Gao, W.; Guo, M.; Kang, H.; Li, P.; Wang, W.; Zhao, M. Telling a different story: The promote role of vegetation in the initiation of shallow landslides during rainfall on the Chinese Loess Plateau. Geomorphology 2020, 350, 106879. [Google Scholar] [CrossRef]
- Ghestem, M.; Veylon, G.; Bernard, A.; Vanel, Q.; Stokes, A. Influence of plant root system morphology and architectural traits on soil shear resistance. Plant Soil 2013, 377, 43–61. [Google Scholar] [CrossRef]
- Arce-Mojica, T.; Nehren, U.; Sudmeier-Rieux, K.; Miranda, P.J.; Anhuf, D. Nature-based solutions (NbS) for reducing the risk of shallow landslides: Where do we stand? Int. J. Disaster Risk Reduct. 2019, 41, 101293. [Google Scholar] [CrossRef]
- Constantine, J.A.; Schelhaas, M.J.; Gabet, E.; Mudd, S.M. Limits of windthrow-driven hillslope sediment flux due to varying storm frequency and intensity. Geomorphology 2012, 175–176, 66–73. [Google Scholar] [CrossRef]
- Wiegand, C.; Kringer, K.; Geitner, C.; Rutzinger, M. Regolith structure analysis—A contribution to understanding the local occurrence of shallow landslides (austrian tyrol). Geomorphology 2013, 183, 5–13. [Google Scholar] [CrossRef]
- Kobayashi, Y.; Mori, A.S. The Potential Role of Tree Diversity in Reducing Shallow Landslide Risk. Environ. Manag. 2017, 59, 707–715. [Google Scholar] [CrossRef]
- Falaschi, F.; Giacomelli, F.; Federici, P.R.; Puccinelli, A.; Avanzi, G.D.; Pochini, A.; Ribolini, A. Logistic regression versus artificial neural networks: Landslide susceptibility evaluation in a sample area of the Serchio River valley, Italy. Nat. Hazards 2009, 50, 551–569. [Google Scholar] [CrossRef]
- Abedini, M.; Tulabi, S. Assessing INRF, FR, and AHP models in landslide susceptibility mapping index: A comparative study of Nojian watershed in Lorestan province, iran. Environ. Earth Sci. 2017, 77, 405. [Google Scholar] [CrossRef]
- He, J.; Qiu, H.; Qu, F.; Hu, S.; Yang, D.; Shen, Y.; Zhang, Y.; Sun, H.; Cao, M. Prediction of spatiotemporal stability and rainfall threshold of shallow landslides using the TRIGRS and Scoops3D models. Catena 2021, 197, 104999. [Google Scholar] [CrossRef]
- Corominas, J.; van Westen, C.; Frattini, P.; Cascini, L.; Malet, J.P.; Fotopoulou, S.; Catani, F.; Van Den Eeckhaut, M.; Mavrouli, O.; Agliardi, F.; et al. Recommendations for the quantitative analysis of landslide risk. B Eng. Geol. Environ. 2014, 73, 209–263. [Google Scholar] [CrossRef] [Green Version]
- Van, Z.F.B.; Albaba, A.; Cohen, D.; Phillips, C.; Schaefli, B.; Dorren, L.; Schwarz, M. Introducing SlideforMAP: A probabilistic finite slope approach for modelling shallow-landslide probability in forested situations. Nat. Hazards Earth Syst. Sci. 2022, 22, 2611–2635. [Google Scholar] [CrossRef]
- Torres, R.; Dietrich, W.E.; Montgomery, D.R.; Anderson, S.P.; Loague, K. Unsaturated zone processes and the hydrologic response of a steep, unchanneled catchment. Water Resour. Res. 1998, 34, 1865–1879. [Google Scholar] [CrossRef]
- Montrasio, L.; Valentino, R.; Losi, G.L. Towards a real-time susceptibility assessment of rainfall-induced shallow landslides on a regional scale. Nat. Hazards Earth Syst. Sci. 2011, 11, 1927–1947. [Google Scholar] [CrossRef] [Green Version]
- Baum, R.L.; Savage, W.Z.; Godt, J.W. TRIGRS-A Fortran Program for Transient Rainfall Infiltration and Grid-Based Regional Slope-Stability Analysis, Version 2.0 (No. 2008-1159); Geological Survey: Washington, DC, USA, 2008. [Google Scholar]
- Cervi, F.; Berti, M.; Borgatti, L.; Ronchetti, F.; Manenti, F.; Corsini, A. Comparing predictive capability of statistical and deterministic methods for landslide susceptibility mapping: A case study in the northern Apennines (Reggio Emilia Province, Italy). Landslides 2010, 7, 433–444. [Google Scholar] [CrossRef]
- Baeza, C.; Corominas, J. Assessment of shallow landslide susceptibility by means of multivariate statistical techniques. EarthSurf. Process. 2001, 26, 1251–1263. [Google Scholar] [CrossRef]
- Salvatici, T.; Tofani, V.; Rossi, G.; D’Ambrosio, M.; Tacconi, S.C.; Masi, E.B.; Rosi, A.; Pazzi, V.; Vannocci, P.; Petrolo, M.; et al. Application of a physically based model to forecast shallow landslides at a regional scale. Nat. Hazards Earth Syst. Sci. 2018, 18, 1919–1935. [Google Scholar] [CrossRef] [Green Version]
- Alvioli, M.; Melillo, M.; Guzzetti, F.; Rossi, M.; Palazzi, E.; von Hardenberg, J.; Brunetti, M.; Peruccacci, S. Implications of climate change on landslide hazard in Central Italy. Sci. Total Environ. 2017, 630, 1527–1543. [Google Scholar] [CrossRef]
- Kim, S.; Kim, M.; An, H.; Chun, K.; Oh, H.J.; Onda, Y. Influence of subsurface flow by Lidar DEMs and physical soil strength considering a simple hydrologic concept for shallow landslide instability mapping. Catena 2019, 182, 104137. [Google Scholar] [CrossRef]
- Zhou, W.; Qiu, H.; Wang, L.; Pei, Y.; Tang, B.; Ma, S.; Yang, D.; Cao, M. Combining rainfall-induced shallow landslides and subsequent debris flows for hazard chain prediction. Catena 2022, 213, 106199. [Google Scholar] [CrossRef]
- Marin, R.J.; Velásquez, M.F. Influence of hydraulic properties on physically modelling slope stability and the definition of rainfall thresholds for shallow landslides. Geomorphology 2020, 351, 106976. [Google Scholar] [CrossRef]
- Ahmed, F.S.; Bryson, L.S.; Crawford, M.M. Prediction of seasonal variation of in-situ hydrologic behavior using an analytical transient infiltration model. Eng. Geol. 2021, 294, 106383. [Google Scholar] [CrossRef]
- Spiekermann, R.I.; Smith, H.G.; McColl, S.; Burkitt, L.; Fuller, I.C. Quantifying effectiveness of trees for landslide erosion control. Geomorphology 2022, 396, 107993. [Google Scholar] [CrossRef]
- Zhang, X.N.; Feng, J.; Shao, W. Effects of vegetation on runoff production, confluence and solute transport in sloping land under different rainfall intensification. J. Hohai Univ. (Nat. Sci.) 2010, 3, 246–251. [Google Scholar] [CrossRef]
- Kim, D.; Im, S.; Lee, C.; Woo, C. Modeling the contribution of trees to shallow landslide development in a steep, forested watershed. Ecol. Eng. 2013, 61, 658–668. [Google Scholar] [CrossRef]
- Huang, Y.; Feng, W.; Li, Z. Analysis on the characteristics of “7.3” rainstorm and the disaster mode of geological disaster in Yan’an area of northern Shaanxi province in 2013. J. Catastrophology 2014, 29, 54–59. (In Chinese) [Google Scholar]
- Chu, D. Simulation of Mud Flow Susceptibility in Fuxian County, Yan’an City, Shaanxi Province Based on TRIGRS Model. Master’s Dissertation, Northwestern University, Shaanxi, China, 2019. [Google Scholar]
- Sang, G. The Evolutionary Process of the Landform and Soil Erosion during Historical Period in Loess Platea. Ph.D. Thesis, Shaanxi Normal University, Shaanxi, China, 2003. [Google Scholar]
- Kou, Q. The Strategic Adjustment of RuralIndustrial Structure on the Loess Plateau. Ph.D. Thesis, Northwest Sci-Tech University of Agricultureand Forestry, Shaanxi, China, 2001. [Google Scholar]
- Wang, G.; Li, T.; Xing, X.; Zou, Y. Research on loess flow-slides induced by rainfall in July 2013 in Yan’an City, NW China. Environ. Earth Sci. 2015, 73, 7933–7944. [Google Scholar] [CrossRef]
- Richards, L.A. Capillary conduction of liquids through porous mediums. J. Appl. Phys. 1931, 1, 318–333. [Google Scholar] [CrossRef]
- Srivastava, R.; Yeh, T.-C.J. Analytical solutions for one-dimensional, transient infiltration toward the water table in homogeneous and layered soils. Water Resour. Res. 1991, 27, 753–762. [Google Scholar] [CrossRef]
- Sun, T.; Deng, Z.; Xu, Z.; Wang, X. Volume Estimation of Landslide Affected Soil Moisture Using TRIGRS: A Case Study of Longxi River Small Watershed in Wenchuan Earthquake Zone, China. Water 2020, 13, 71. [Google Scholar] [CrossRef]
- Seefelder, C.D.L.N.; Koide, S.; Mergili, M. Does parameterization influence the performance of slope stability model results? a case study in rio de janeiro, brazil. Landslides 2017, 14, 1379–1401. [Google Scholar] [CrossRef] [Green Version]
- Zhuang, J.; Peng, J.; Wang, G.; Iqbal, J.; Wang, Y.; Li, W.; Xu, Q.; Zhu, X. Prediction of rainfall-induced shallow landslides in the Loess Plateau, Yan’an, China, using the TRIGRS model. Earth Surf. Processes Landf. 2017, 42, 915–927. [Google Scholar] [CrossRef]
- Tran, T.; Alvioli, M.; Lee, G.; An, H.U. Three-dimensional, time-dependent modeling of rainfall-induced landslides over a digital landscape: A case study. Landslides 2017, 15, 1071–1074. [Google Scholar] [CrossRef]
- Xin, X.; Zhang, F.; Liang, C.; Li, Z. Application of a 3D deterministic model for predicting shallow loess landslide stability. Chin. J. Eng. 2018, 40, 397–406, (In Chinese with English abstract). [Google Scholar]
- Tesfa, T.K.; Tarboton, D.G.; Chandler, D.G.; McNamara, J.P. Modeling soil depth from topographic and land cover attributes. Water Resour. Res. 2009, 45, 10438. [Google Scholar] [CrossRef]
- Marin, R.J.; García, E.F.; Aristizábal, E. Assessing the Effectiveness of TRIGRS for Predicting Unstable Areas in a Tropical Mountain Basin (Colombian Andes). Geotech. Geol. Eng. 2020, 39, 2329–2346. [Google Scholar] [CrossRef]
- Saulniera, G.M.; Bevenb, K.; Obleda, C. Including spatially variable effective soil depths in TOPMODEL. J. Hydrol. 1997, 202, 157–172. [Google Scholar] [CrossRef]
- Park, D.W.; Nikhil, N.V.; Lee, S.R. Landslide and debris flow susceptibility zonation using TRIGRS for the 2011 Seoul landslide event. Nat. Hazards Earth Syst. Sci. 2013, 13, 2833–2849. [Google Scholar] [CrossRef] [Green Version]
- Marin, R.J.; García, E.F.; Aristizábal, E. Effect of basin morphometric parameters on physically-based rainfall thresholds for shallow landslides. Eng. Geol. 2020, 278, 105855. [Google Scholar] [CrossRef]
- Sarma, C.P.; Dey, A.; Krishna, A.M. Influence of digital elevation models on the simulation of rainfall-induced landslides in the hillslopes of Guwahati, India. Eng. Geol. 2020, 268, 105523. [Google Scholar] [CrossRef]
- Iverson, R.M.; Reid, M.E. Acute sensitivity of landslide rates to initial soil porosity. Science 2000, 290, 513–516. [Google Scholar] [CrossRef] [PubMed]
- Hilley, G.E.; Burgmann, R.; Ferretti, A.; Novali, F.; Rocca, F. Dynamics of slow-moving landslides from permanent scatterer analysis. Science 2004, 304, 1952–1955. [Google Scholar] [CrossRef] [PubMed] [Green Version]
- Li, Z.; Zhang, M. Study on transient safety factor of unsaturated soil slope considering rainfall infiltration. Chin. Civ. Eng. J. 2001, 34, 5. (In Chinese) [Google Scholar]
- Wang, Y.; Lin, Q.; Shi, P. Spatial pattern and influencing factors of landslide casualty events. J. Geogr. Sci. 2017, 27, 259–274. [Google Scholar] [CrossRef] [Green Version]
- Panahi, M.; Rahmati, O.; Rezaie, F.; Lee, S.; Mohammadi, F.; Conoscenti, C. Application of the group method of data handling (gmdh) approach for landslide susceptibility zonation using readily available spatial covariates. Catena 2022, 208, 105779. [Google Scholar] [CrossRef]
- Sarkar, S.; Roy, A.K.; Raha, P. Deterministic approach for susceptibility assessment of shallow debris slide in the Darjeeling Himalayas, India. Catena 2016, 142, 36–46. [Google Scholar] [CrossRef]
- Mao, Z.; Saint-André, L.; Genet, M.; Mine, F.X.; Jourdan, C.; Rey, H.; Courbaud, B.; Stokes, A. Engineering ecological protection against landslides in diverse mountain for ests: Choosing cohesion models. Ecol. Eng. 2012, 45, 55–69. [Google Scholar] [CrossRef]
- Meisina, C.; Scarabelli, S. A comparative analysis of terrain stability models for predicting shallow landslides in colluvial soils. Geomorphology 2007, 87, 207–223. [Google Scholar] [CrossRef]
- Wang, X.; Ma, C.; Wang, Y.; Wang, Y.; Li, T.; Dai, Z.; Li, M. Effect of root architecture on rainfall threshold for slope stability: Variabilities in saturated hydraulic conductivity and strength of root-soil composite. Landslides 2020, 17, 1–13. [Google Scholar] [CrossRef]
- Nilaweera, N.S.; Nutalaya, P. Role of tree roots in slope stabilisation. Bull. Eng. Geol. Environ. 1999, 57, 337–342. [Google Scholar] [CrossRef]
- Keijsers, J.; Schoorl, J.; Chang, K.; Chiang, S.; Claessens, L.; Veldkamp, A. Calibration and resolution effects on model performance for predicting shallow landslide locations in Taiwan. Geomorphology 2011, 133, 168–177. [Google Scholar] [CrossRef]
- Medina, V.; Hürlimann, M.; Guo, Z.; Lloret, A.; Vaunat, J. Fast physically-based model for rainfall-induced landslide susceptibility assessment at regional scale. Catena 2021, 201, 105213. [Google Scholar] [CrossRef]
- Li, M.; Ma, C.; Du, C.; Yang, W.; Wang, X. Landslide response to vegetation by example of July 25–26, 2013, extreme rainstorm, Tianshui City, Gansu province, China. Bull. Eng. Geol. Environ. 2021, 80, 751–764. [Google Scholar] [CrossRef]
- Gou, J.; Miao, C.; Duan, Q.; Tang, Q.; Di, Z.; Liao, W.; Wu, J.; Zhou, R. Sensitivity Analysis-Based Automatic Parameter Calibration of the VIC Model for Streamflow Simulations Over China. Water Resour. Res. 2020, 56, 1–19. [Google Scholar] [CrossRef] [Green Version]
- Simon, A.; Collison, A.J.C. Quantifying the mechanical and hydrologic effects of riparian vegetation on streambank stability. Earth Surf. Process. Landf. 2002, 27, 527–546. [Google Scholar] [CrossRef]
- Han, Y.; Zheng, F.; Xu, X.; Sheng, H. Relationship between shallow landslide erosion and vegetation in the Ziwuling forest area: A case study of the “7·21” disaster in Fuxian County. Acta Ecol. Sin. 2016, 36, 4635–4643. (In Chinese) [Google Scholar]
- Johnson, A.C.; Wilcock, P. Association between cedar decline and hillslope stability in mountainous regions of southeast Alaska. Geomorphology 2002, 46, 129–142. [Google Scholar] [CrossRef]
- Selby, M.J. Hillslope Materials and Processes, 2nd ed.; Oxford University Press: Oxford, UK, 1993; p. 451 S. [Google Scholar]
- Burroughs, E.R.; Thomas, B.R. Declining Root Strength in Douglas-Fir after Felling as a Factor in Slope Stability, Intermountain Forest and Range Experiment Station, Forest Service, U.S. Dept. of Agriculture: Ogden, UT, USA, 1977.
- Sidle, R.C. A theoretical model of the effects of timber harvesting on slope stability. Water Resour. Res. 1992, 28, 1897–1910. [Google Scholar] [CrossRef]
- Sidle, R.C.; Ochiai, H. Landslides: Processes, Prediction, and Land Use. Water Resour Res. 2011, 47, 864. [Google Scholar] [CrossRef]
- Ammann, M.; Böll, A.; Rickli, C.; Speck, T.; Holdenrieder, O. Significance of tree root decomposition for shallow landslides. For. Snow Landsc. Res. 2009, 82, 79. [Google Scholar]
- Preti, F. Forest protection and protection woodland: Tree root degradation over hydrological shallow landslides triggering. Ecol. Eng. 2013, 61, 633–645. [Google Scholar] [CrossRef]
- Pollen, N. Temporal and spatial variability in root reinforcement of streambanks: Accounting for soil shear strength and moisture. Catena 2007, 69, 197–205. [Google Scholar] [CrossRef]


| Parameters | Symbol | Woodland | Grassland | Cultivated Land |
|---|---|---|---|---|
| Soil cohesion | c′ (kPa) | 14.35 | 5.77 | 7.77 |
| Soil friction angle | ϕ′ (°) | 3.72 | 3.09 | 2.05 |
| Hydraulic conductivity | KS (m/s) | 6.4 × 10⁻⁴ | 4.7 × 10⁻⁵ | 4.6 × 10⁻⁵ |
| Hydraulic diffusivity | D0 (m/s) | 6.4 × 10⁻³ | 4.7 × 10⁻⁴ | 4.6 × 10⁻⁴ |
| Unit weight of soil | γs (kN/m3) | 25.5 | 21.5 | 23.2 |
| Saturated volumetric water content | θs (m3/m3) | 0.12 | 0.11 | 0.12 |
| Residual volumetric water content | θr (m3/m3) | 0.07 | 0.09 | 0.07 |
Publisher’s Note: MDPI stays neutral with regard to jurisdictional claims in published maps and institutional affiliations. |
© 2022 by the authors. Licensee MDPI, Basel, Switzerland. This article is an open access article distributed under the terms and conditions of the Creative Commons Attribution (CC BY) license (https://creativecommons.org/licenses/by/4.0/).
Share and Cite
Zhang, J.; Qiu, H.; Tang, B.; Yang, D.; Liu, Y.; Liu, Z.; Ye, B.; Zhou, W.; Zhu, Y. Accelerating Effect of Vegetation on the Instability of Rainfall-Induced Shallow Landslides. Remote Sens. 2022, 14, 5743. https://doi.org/10.3390/rs14225743
Zhang J, Qiu H, Tang B, Yang D, Liu Y, Liu Z, Ye B, Zhou W, Zhu Y. Accelerating Effect of Vegetation on the Instability of Rainfall-Induced Shallow Landslides. Remote Sensing. 2022; 14(22):5743. https://doi.org/10.3390/rs14225743
Chicago/Turabian StyleZhang, Juanjuan, Haijun Qiu, Bingzhe Tang, Dongdong Yang, Ya Liu, Zijing Liu, Bingfeng Ye, Wenqi Zhou, and Yaru Zhu. 2022. "Accelerating Effect of Vegetation on the Instability of Rainfall-Induced Shallow Landslides" Remote Sensing 14, no. 22: 5743. https://doi.org/10.3390/rs14225743
APA StyleZhang, J., Qiu, H., Tang, B., Yang, D., Liu, Y., Liu, Z., Ye, B., Zhou, W., & Zhu, Y. (2022). Accelerating Effect of Vegetation on the Instability of Rainfall-Induced Shallow Landslides. Remote Sensing, 14(22), 5743. https://doi.org/10.3390/rs14225743