Abstract
On 20 July 2021, an extraordinary rainfall event occurred in Henan Province, China, resulting in heavy waterlogging, flooding, and hundreds of fatalities and causing considerable property damage. Because the damaged region was a major grain-producing region of China, assessing crop food production losses following this event is very important. Because the crop rotation production system is utilized in the region to accommodate two crops per year, it is very valuable to accurately identify the types of crops affected by the event and to assess the crop production losses separately; however, the results obtained using these methods are still inadequate. In this study, we used China’s first commercial synthetic aperture radar (SAR) data source, named Hisea-1, together with other open-source and widely used remote sensing data (Sentinel-1 and Sentinel 2), to monitor this catastrophic flood. Both the modified normalized difference water index (MNDWI) and Sentinel-1 dual-polarized water index (SDWI) were calculated, and an unsupervised classification (k-means) method was adopted for rapid water body extraction. Based on time-series datasets synthesized from multiple sources, we obtained four flooding characteristics, including the flooded area, flood duration, and start and end times of flooding. Then, according to these characteristics, we conducted a more precise analysis of the damages to flooded farmlands. We used the Google Earth Engine (GEE) platform to obtain normalized difference vegetation index (NDVI) time-series data for the disaster year and normal years and overlaid the flooded areas to extract the effects of flooding on crop species. According to the statistics from previous years, we calculated the areas and types of damaged crops and the yield reduction amounts. Our results showed that (1) the study area endured two floods in July and September of 2021; (2) the maximum areas affected by these two flooding events were 380.2 km2 and 215.6 km2, respectively; (3) the floods significantly affected winter wheat and summer grain (maize or soybean), affecting areas of 106.4 km2 and 263.3 km2, respectively; and (4) the crop production reductions in the affected area were 18,708 t for winter wheat and 160,000 t for maize or soybean. These findings indicate that the temporal-dimension information, as opposed to the traditional use of the affected area and the yield per unit area when estimating food losses, is very important for accurately estimating damaged crop types and yield reductions. Time-series remote sensing data, especially SAR remote sensing data, which have the advantage of penetrating clouds and rain, play an important role in remotely sensed disaster monitoring. Hisea-1 data, with a high spatial resolution and first flood-monitoring capabilities, show their value in this study and have the potential for increased usage in further studies, such as urban flooding research. As such, the approach proposed herein is worth expanding to other applications, such as studies of water resource management and lake/wetland hydrological changes.
1. Introduction
Extreme precipitation and floods are becoming more frequent under global warming. Continuously rising temperatures increase the amount of rain that the atmosphere can hold and cause more water in the air to fall in extraordinary amounts, resulting in natural disasters, such as floods, droughts, and mudslides; these disasters have become serious problems for humanity [1,2]. The United Nations Intergovernmental Panel on Climate Change (IPCC) Fifth Assessment Report on Climate Change states that global warming will exacerbate the risks associated with extreme events [3]; specifically, the intensity and frequency of extreme heavy precipitation will increase in midlatitude and humid tropical regions [4]. Currently, with the increase in extreme precipitation events, floods have almost equaled earthquakes and hurricanes in terms of economic losses [5]. In China, floods are one of the most frequent meteorological disasters among different types [1,6]. From 1991 to 2020, the average annual number of people killed or missing due to floods in China totaled more than 60,000 deaths, and the annual average direct economic loss from floods was 160.4 billion RMB, totaling approximately 4.81 trillion RMB [7]. Rapid flood monitoring and flood area and duration mapping are thus important initiatives for disaster prevention and mitigation.
Remote sensing technology is an important tool for monitoring floods due to its many advantages; for example, these technologies can provide data rapidly and periodically at large scales [8,9,10,11,12]. There is no doubt that optical remote sensing provides abundant spectral band information [13,14] and has good applications in classification and water body extraction tasks [15,16,17]. However, affected by clouds and rain, these data have limited application potential for flood monitoring in disasters. However, synthetic aperture radar (SAR) systems offer additional benefits; for example, they are independent of extreme weather due to their long wavelength and ability to penetrate cloud and rain particles [18,19]. Moreover, water bodies can be well defined from their backscattering signatures [20,21]. Thus, SAR systems have become a suitable tool for flood mapping and are now widely used [22,23,24,25].
A single SAR dataset can be used to detect flooded areas because water bodies, whose surfaces are smooth and typically produce specular reflections (reflecting the radar signal in the specular direction away from the antenna), obtain very low reflection signals and appear as dark areas in SAR images [26]. However, to capture dynamic flood information, a single image is not enough. A large amount of remote sensing image data is required to make multiple, repeated observations of the flooded area. Currently, several international Earth observation (EO) initiatives have been set up to provide data and services for flood response and mitigation [26]. In addition, an optimal satellite constellation design can also increase the acquisition speed, frequency, and flexibility of data, such as those of the COSMO-SkyMed [27], TerraSAR-X [28], and Sentinel-1. In China, Hisea-1, as the world’s first miniaturized commercial C-band SAR satellite, for which the formation of a satellite constellation is also planned, was launched on 22 December 2020 [29]. Although small in weight and size, this satellite can produce images at a high spatial resolution of 1 m and a large observation width of 100 km [29]. Because of these advantages, Hisea-1 has some initial applications for ocean, land, and emergency event monitoring. For example, after the Hunga Tonga-Hunga Ha’apai volcano erupted on 15 January 2022, images collected by Hisea-1 showed that a length of ~3 km2 along Hong’ahaapai Island was almost completely submerged by seawater [30].
In this paper, we chose the flood caused by the extraordinary rainfall event that occurred on 20 July 2021 in Henan, China as the study case. This event was the worst devastating flood in China in recent years; it killed 398 people and affected more than 14.78 million people in 150 county-level areas [31]. According to the “Investigation report on the ‘720’ exceptionally heavy rainstorm disaster in Zhengzhou, Henan Province”, more than 1.09 million hectares of crops were damaged, more than 30,600 houses collapsed, and the cumulative economic losses exceeded CNY 120 billion [32,33]. This extraordinary rainfall event had the characteristics of a long duration, large coverage, large total rainfall amount, and short-term extremely heavy rainfall. To respond to the disaster, eight flood-storage areas were activated across the province, leading to urban areas in Weihui being flooded for 7 days. Because Henan Province is one of China’s major grain-producing provinces, devastating disasters such as floods also have a profound impact on agricultural production in this region [34].
In response to the 2021 flood disaster, we tested the flood-detection capability of multisource satellite data, in particular the potential of identifying flooded crop types and estimating their yield reductions using these data. By choosing Hisea-1 data, which were first used for flooding monitoring, and other open remote sensing data (Sentinel-1/2), we synthesized a dataset to identify four characteristics of floods, namely flood duration, area, start time, and end time. Then, considering a crop rotation system is in use in the study area, we used normalized difference vegetation index (NDVI) time-series products from the Google Earth Engine (GEE) platform to extract the crop species and areas damaged by the flood. According to the crop production statistics, we estimated the crop reduction of each crop species. The paper is organized as follows: Section 2 describes the study area, flood information, data adopted, and proposed methodology. Section 3 presents the results and discussion. Finally, Section 4 provides the conclusions.
2. Study Area and Data
2.1. Study Area
Henan Province, located in the middle and lower reaches of the Yellow River in central China, is situated from 110°21′ to 116°39′E and from 31°23′ to 36°22′N [35]. This province is located in the transition area from the subtropical to warm temperate zone; the average annual temperature is 15.9 °C and the average annual precipitation is 1133.3 mm in 2021. The province has a total area of 167,000 km2, of which 107,720 km2 is the grain-cropping area, making it an important grain-producing province in China [36].
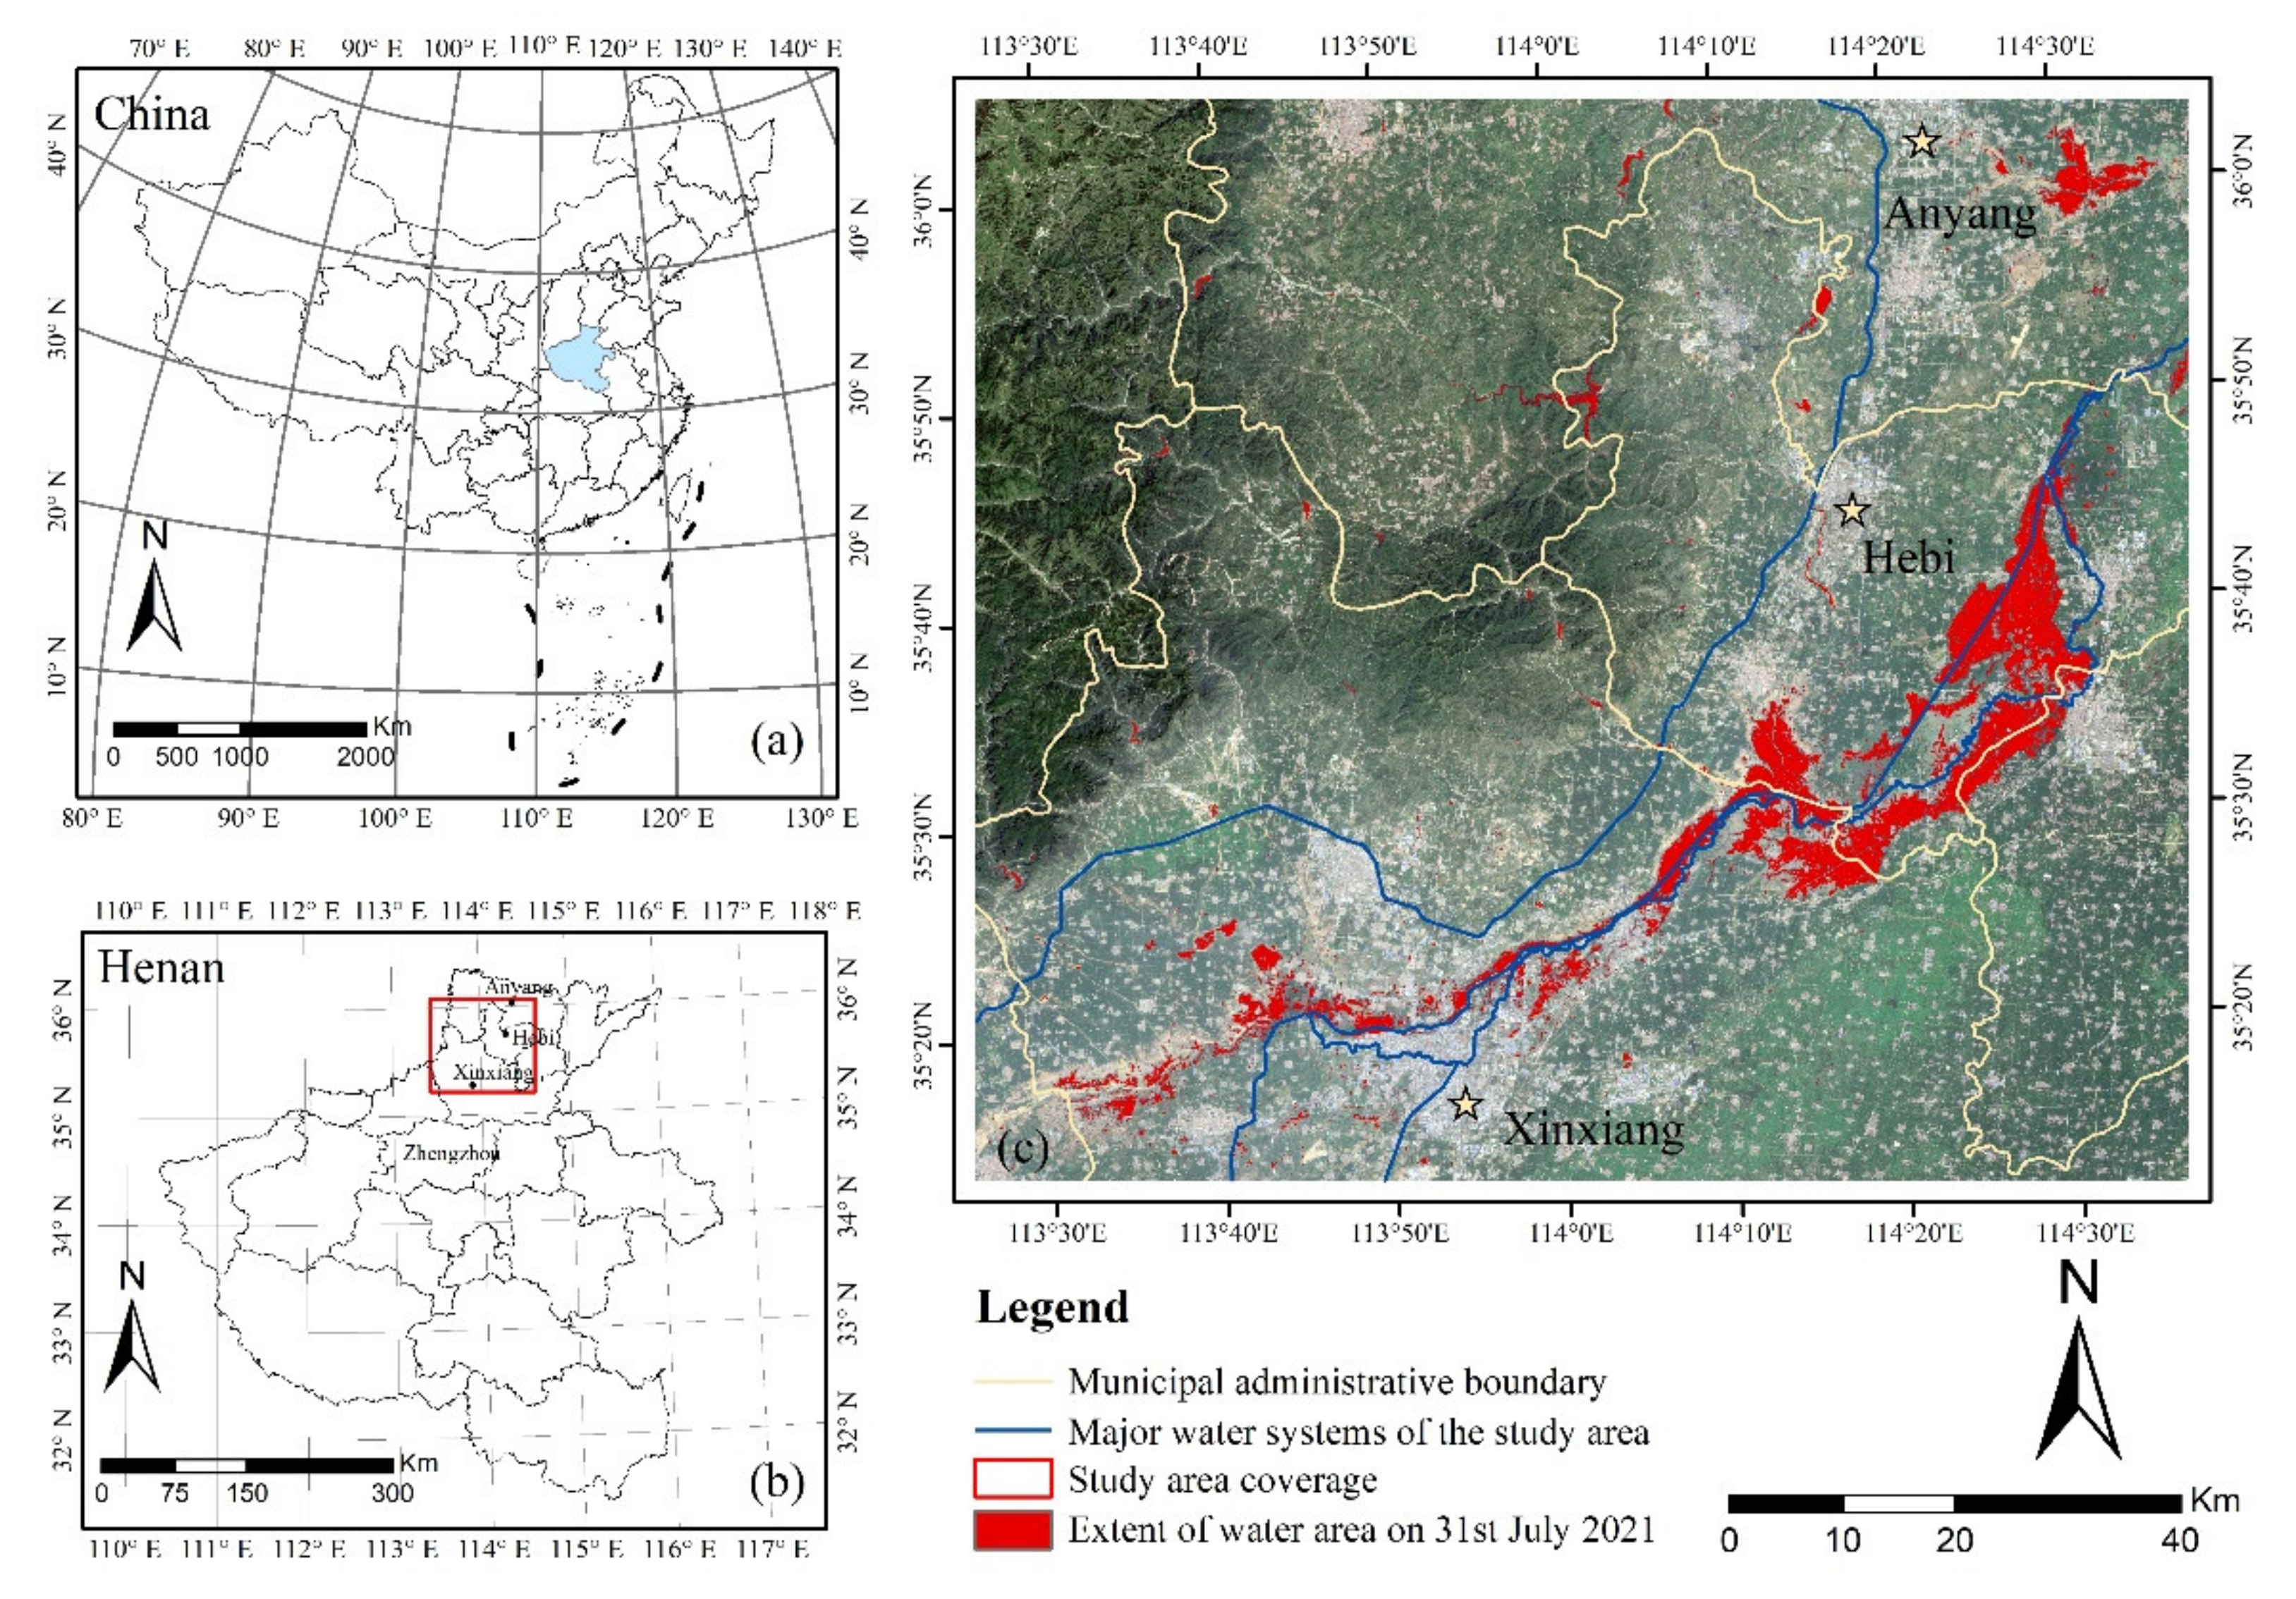
In 2021, from 17 to 23 July, Henan Province was hit by historically rare extremely heavy rainfall. From 17–18 July, rainfall occurred mainly in northern Henan Province (Jiaozuo, Xinxiang, Hebi, and Anyang); from 19 to 20 July, the center of the rainstorm moved south to Zhengzhou, where a very heavy, long-duration rainstorm occurred; from 21 to 22 July, the rainfall center continued to move north again and gradually weakened before ending on 23 July. Over 24 h (from 08:00 on 19 July to 08:00 on 20 July), the precipitation values recorded at more than 794 meteorological observation sites exceeded 100 mm across Henan Province [37]. Especially in Zhengzhou and Pingdingshan, five national meteorological observation sites broke the extreme daily rainfall records collected since these sites were established, with daily rainfall values of 250 to 401 mm [38]. In Zhengzhou, the peak hourly precipitation rate reached 201.9 mm/h at 9:00 on 20 July, exceeding the strongest hourly precipitation recorded at all observation sites in mainland China [39,40]. Short-term heavy precipitation led to urban flooding. For disaster-mitigation purposes, the government activated eight flood storage areas, including Anyang, Tangyin, Neihuang County, and Wenfeng District in Anyang City, Jun and Qi County in Hebi City, and Weihui and Hua County in Xinxiang City [33]. Among these storage areas, some are key grain-producing areas. From remote sensing images and reports, the most severely affected area, mainly including parts of Xinxiang, Hebi, and Anyang, was selected as the study area (Figure 1).
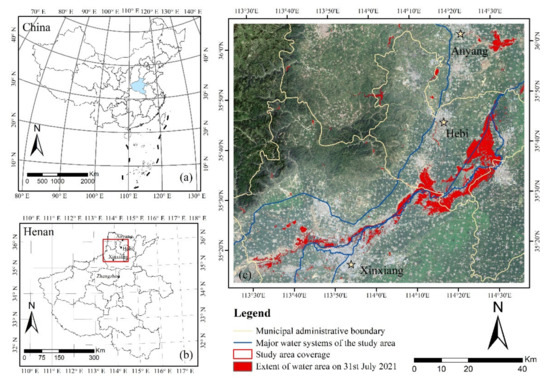
Figure 1.
Location of the study area, (a) in China, (b) in Henan Province and (c) the Sentinel-2 imagery representing 31 July 2021 over the study area. The figure was plotted by Arcmap10.2 software. (Projection: WGS84-based Universal Transverse Mercator Zone 49N).
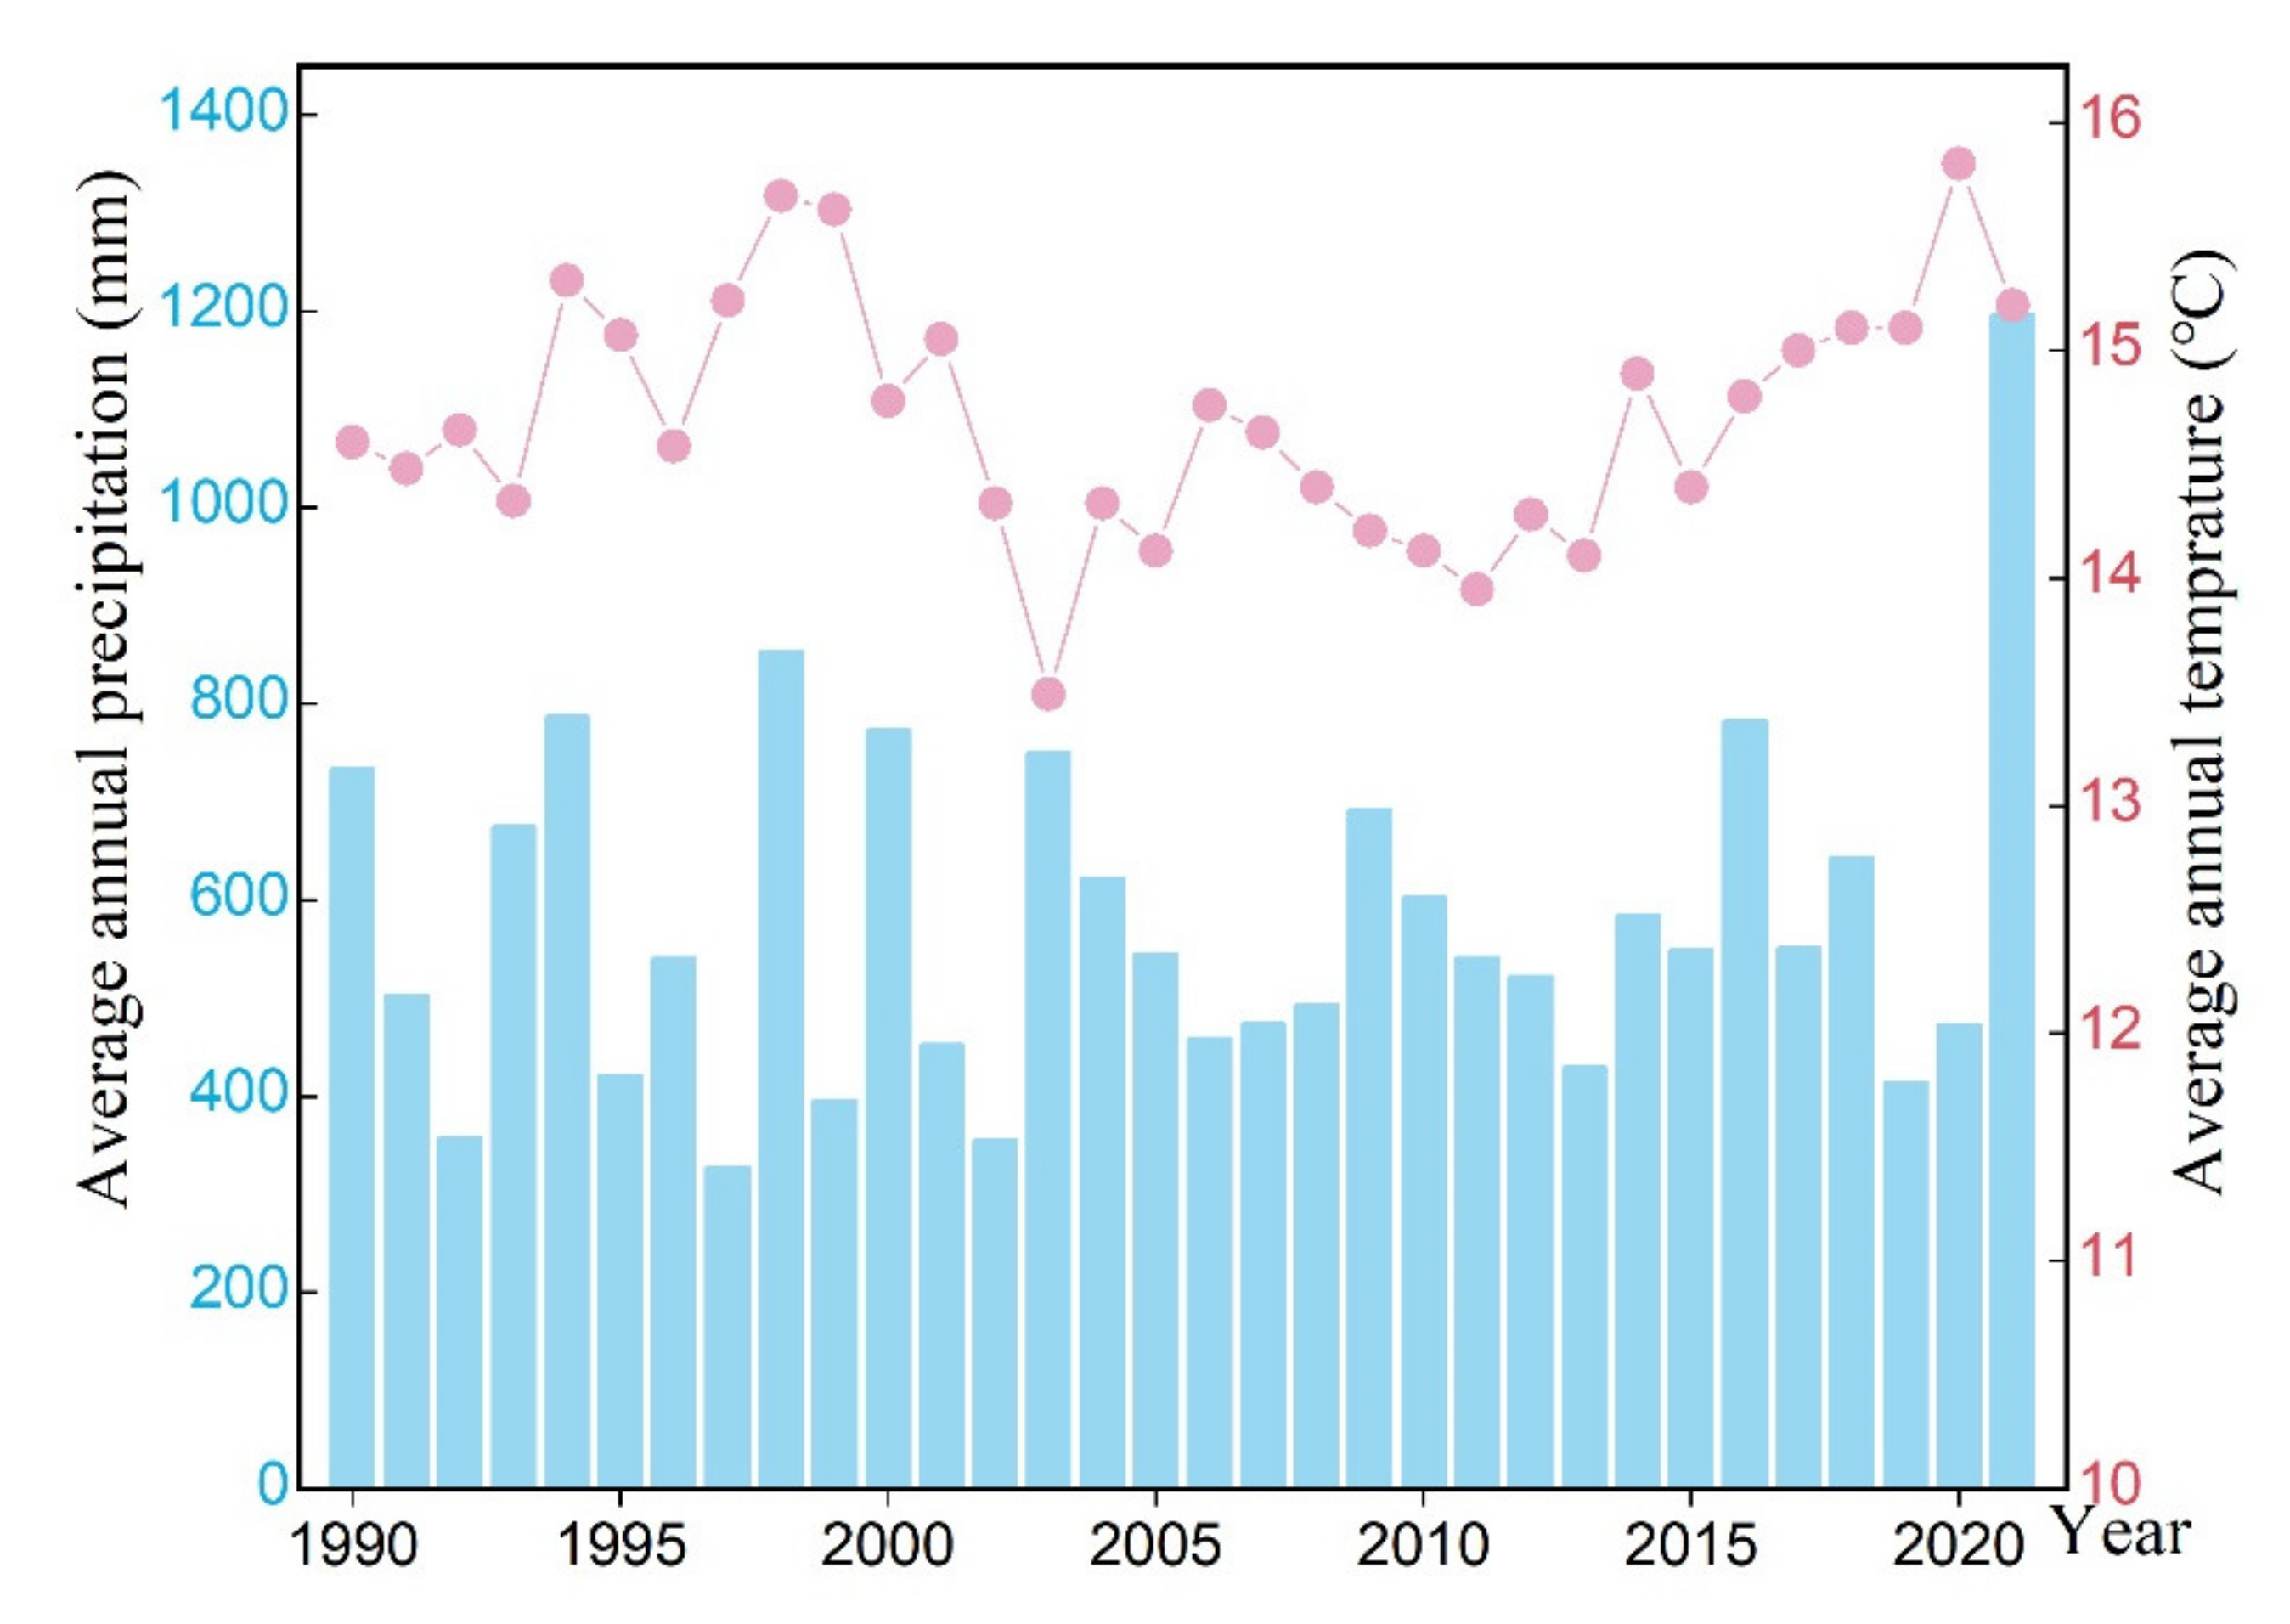
In addition, as shown in Figure 2, the average annual temperature in the study area fluctuated between 13.5 and 15.9 °C during 1990–2021. However, the annual precipitation varied from 350 to 850 mm during 1990–2020 and reached 1197 mm in 2021, which was unusual and a direct factor of this flood.
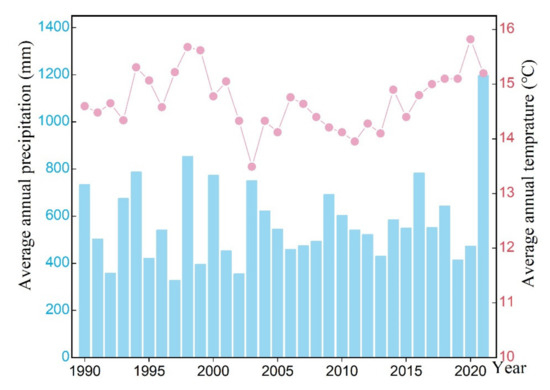
Figure 2.
Average annual precipitation and average annual temperature in the study area from 1990 to 2021. The figure was plotted by Origin2022 software.
2.2. Data
Six basic categories of data are used in this study, including multisource remote sensing data, NDVI data from GEE, land use/land cover (LULC) data, winter wheat-cropping distribution data in China, digital elevation model (DEM) data, and statistical data.
- i.
- Remote sensing data
To obtain accurate information regarding the dynamics of flooding, a dataset consisting of 13 images was constructed, including Sentinel-1 (S1) SAR images, Sentinel-2 (S2) optical multispectral images, and Hisea-1 SAR images. Table 1 lists the detailed information of all images used in this study. The S1 and S2 images were obtained from the European Space Agency (ESA) (https://scihub.copernicus.eu/dhus/#/home (accessed on 23 December 2021)). S1 is a space mission funded by the European Union and carried out by the ESA within the Copernicus Programme; S1 is in a near-polar, sun-synchronous orbit with a 12-day revisit cycle. It collects C-band SAR imagery at a variety of polarizations (single polarization, including VV and HH; dual polarization, including HH + HV and VV + VH), modes (StripMap, SM; interferometric wide swath, IW; extra-wide swath, EW; wave mode, WV) and resolutions (https://sentinel.esa.int/web/sentinel/missions/sentinel-1/instrument-payload (accessed on 23 December 2021)). Here, we collected 9 ground-range-detected (GRD) SAR images taken from 15 July to 19 October 2021 in IW mode and with a width of 250 km and a spatial resolution of 5 m × 20 m. The data were preprocessed with ESA SNAP software. First, orbit correction was used to automatically update the orbit status information; then, thermal noise removal was used to remove the effect of thermal noise in the images; third, radiometric calibration was used to eliminate radiometric errors [41]; fourth, multilooking and filtering was used to remove speckle noise and improve image interpretability [42]; finally, geometric correction was performed to eliminate geometric errors.

Table 1.
Information on the remote sensing data used in this study.
In addition, two cloud-free S2 images taken on 31 July and 9 September 2021 were selected. These S2 satellites were obtained on a sun-synchronous orbit with a 10-day revisit time and a swath width of 290 km (https://sentinel.esa.int/web/sentinel/missions/sentinel-2 (accessed on 23 December 2021)). The multispectral instrument (MSI) carried on the satellite can obtain optical images with a spatial resolution of 10–60 m and 13 spectral bands ranging from the visible (VNIR) and near infra-red (NIR) bands to the short wave infra-red (SWIR) band. Two images were preprocessed for radiometric calibration and atmospheric correction in ESA’s Sen2cor (v2.10) plug-in.
Emphatically, two SAR images from the Hisea-1 satellite, the first commercial SAR satellite in China, were collected. The Hisea-1 satellite has a sun-synchronous circular orbit with an altitude of 512 km and an inclination angle of 97.43°, with four modes: the spotlight (SP), sliding spotlight (SSP), StripMap (SM), and ScanSAR (NS/ES) modes. In this paper, we selected SM-mode GRD images taken on 25 July and 13 August 2021 with a ground resolution of 3 m and then preprocessed the data with ENVI software (version 5.6), performing multilooking, filtering, geocoding, and registration steps.
All remote sensing images were coregistered (we coregistered the S1 and Hisea-1 images and ensured that the overall positional error was less than 0.5 pixels for the S2 images). The images from S1 and Hisea-1 were resampled to a 10 m resolution.
- ii.
- NDVI data from GEE
The normalized difference vegetation index (NDVI) is one of the widely used vegetation indices, which can reflect the vegetation growth status and cover [43]. To analyze the crop growth characteristics before and after the flood, we calculated and averaged monthly NDVI values for each pixel from July 2020 to June 2022. S2 optical image datasets with less than 20% cloudiness taken within the study area were selected on the GEE platform (Equation (1)):
where BNIR is the NIR band (band 8) and Bred is the red band (band 4) in the S2 multispectral imagery.
- iii.
- LULC data
To extract information regarding the cropland impacted by flooding and analyze the yield losses, LULC data were adopted and overlaid with flooding inundation information. In this study, the 2020 World Cover product from ESA was used (Available from https://ceos.org/gst/worldcover.html (accessed on 23 December 2021)), with a 10 m spatial resolution and 11 land cover classes, including trees, shrublands, grasslands, croplands, built-up lands, barren vegetation, snow and ice, herbaceous wetlands, moss and lichen, open water, and mangroves. The overall accuracy of the product is 75%.
- iv.
- DEM data
To remove speckle noise arising due to topography from the SAR images, DEM data named the Terra Advanced Spaceborne Thermal Emission and Reflection Radiometer (ASTER) Global Digital Elevation Model (GDEM) Version-3 (ASTGTM) were used; these data have a spatial resolution of 1 arc second (corresponding to an approximately 30 m horizontal span at the equator) (https://lpdaac.usgs.gov/products/astgtmv003/ (accessed on 23 December 2021)).
- v.
- Winter wheat cropping distribution data in China
To extract the areas in which grain crops are grown in the flooded farmland areas, a 30-meter-resolution dataset comprising the planting distribution of winter wheat in China in 2020 was obtained from the National Ecosystem Science Data Center (website: http://www.nesdc.org.cn/ (accessed on 23 December 2021)). This dataset covers the cropping distribution of winter wheat in 11 provinces of China from 2016 to 2020, with an overall identification accuracy of 89.88% [44].
- vi.
- Statistical data
To analyze the multi-year temperature and precipitation trends in the study area, we collected annual precipitation and annual average temperature data from NOAA for the Anyang station from 1990 to 2021 (available at https://www.ncei.noaa.gov/maps/annual/ (accessed on 23 December 2021)).
Similarly, to analyze the crop production reductions, regional statistical crop type and average annual production data were collected from the Henan Provincial Bureau of Statistics (available at https://tjj.henan.gov.cn/ (accessed on 23 December 2021)) and Henan Provincial Department of Agriculture and Rural Affairs (available at https://nynct.henan.gov.cn/ (accessed on 23 December 2021)).
2.3. Methods
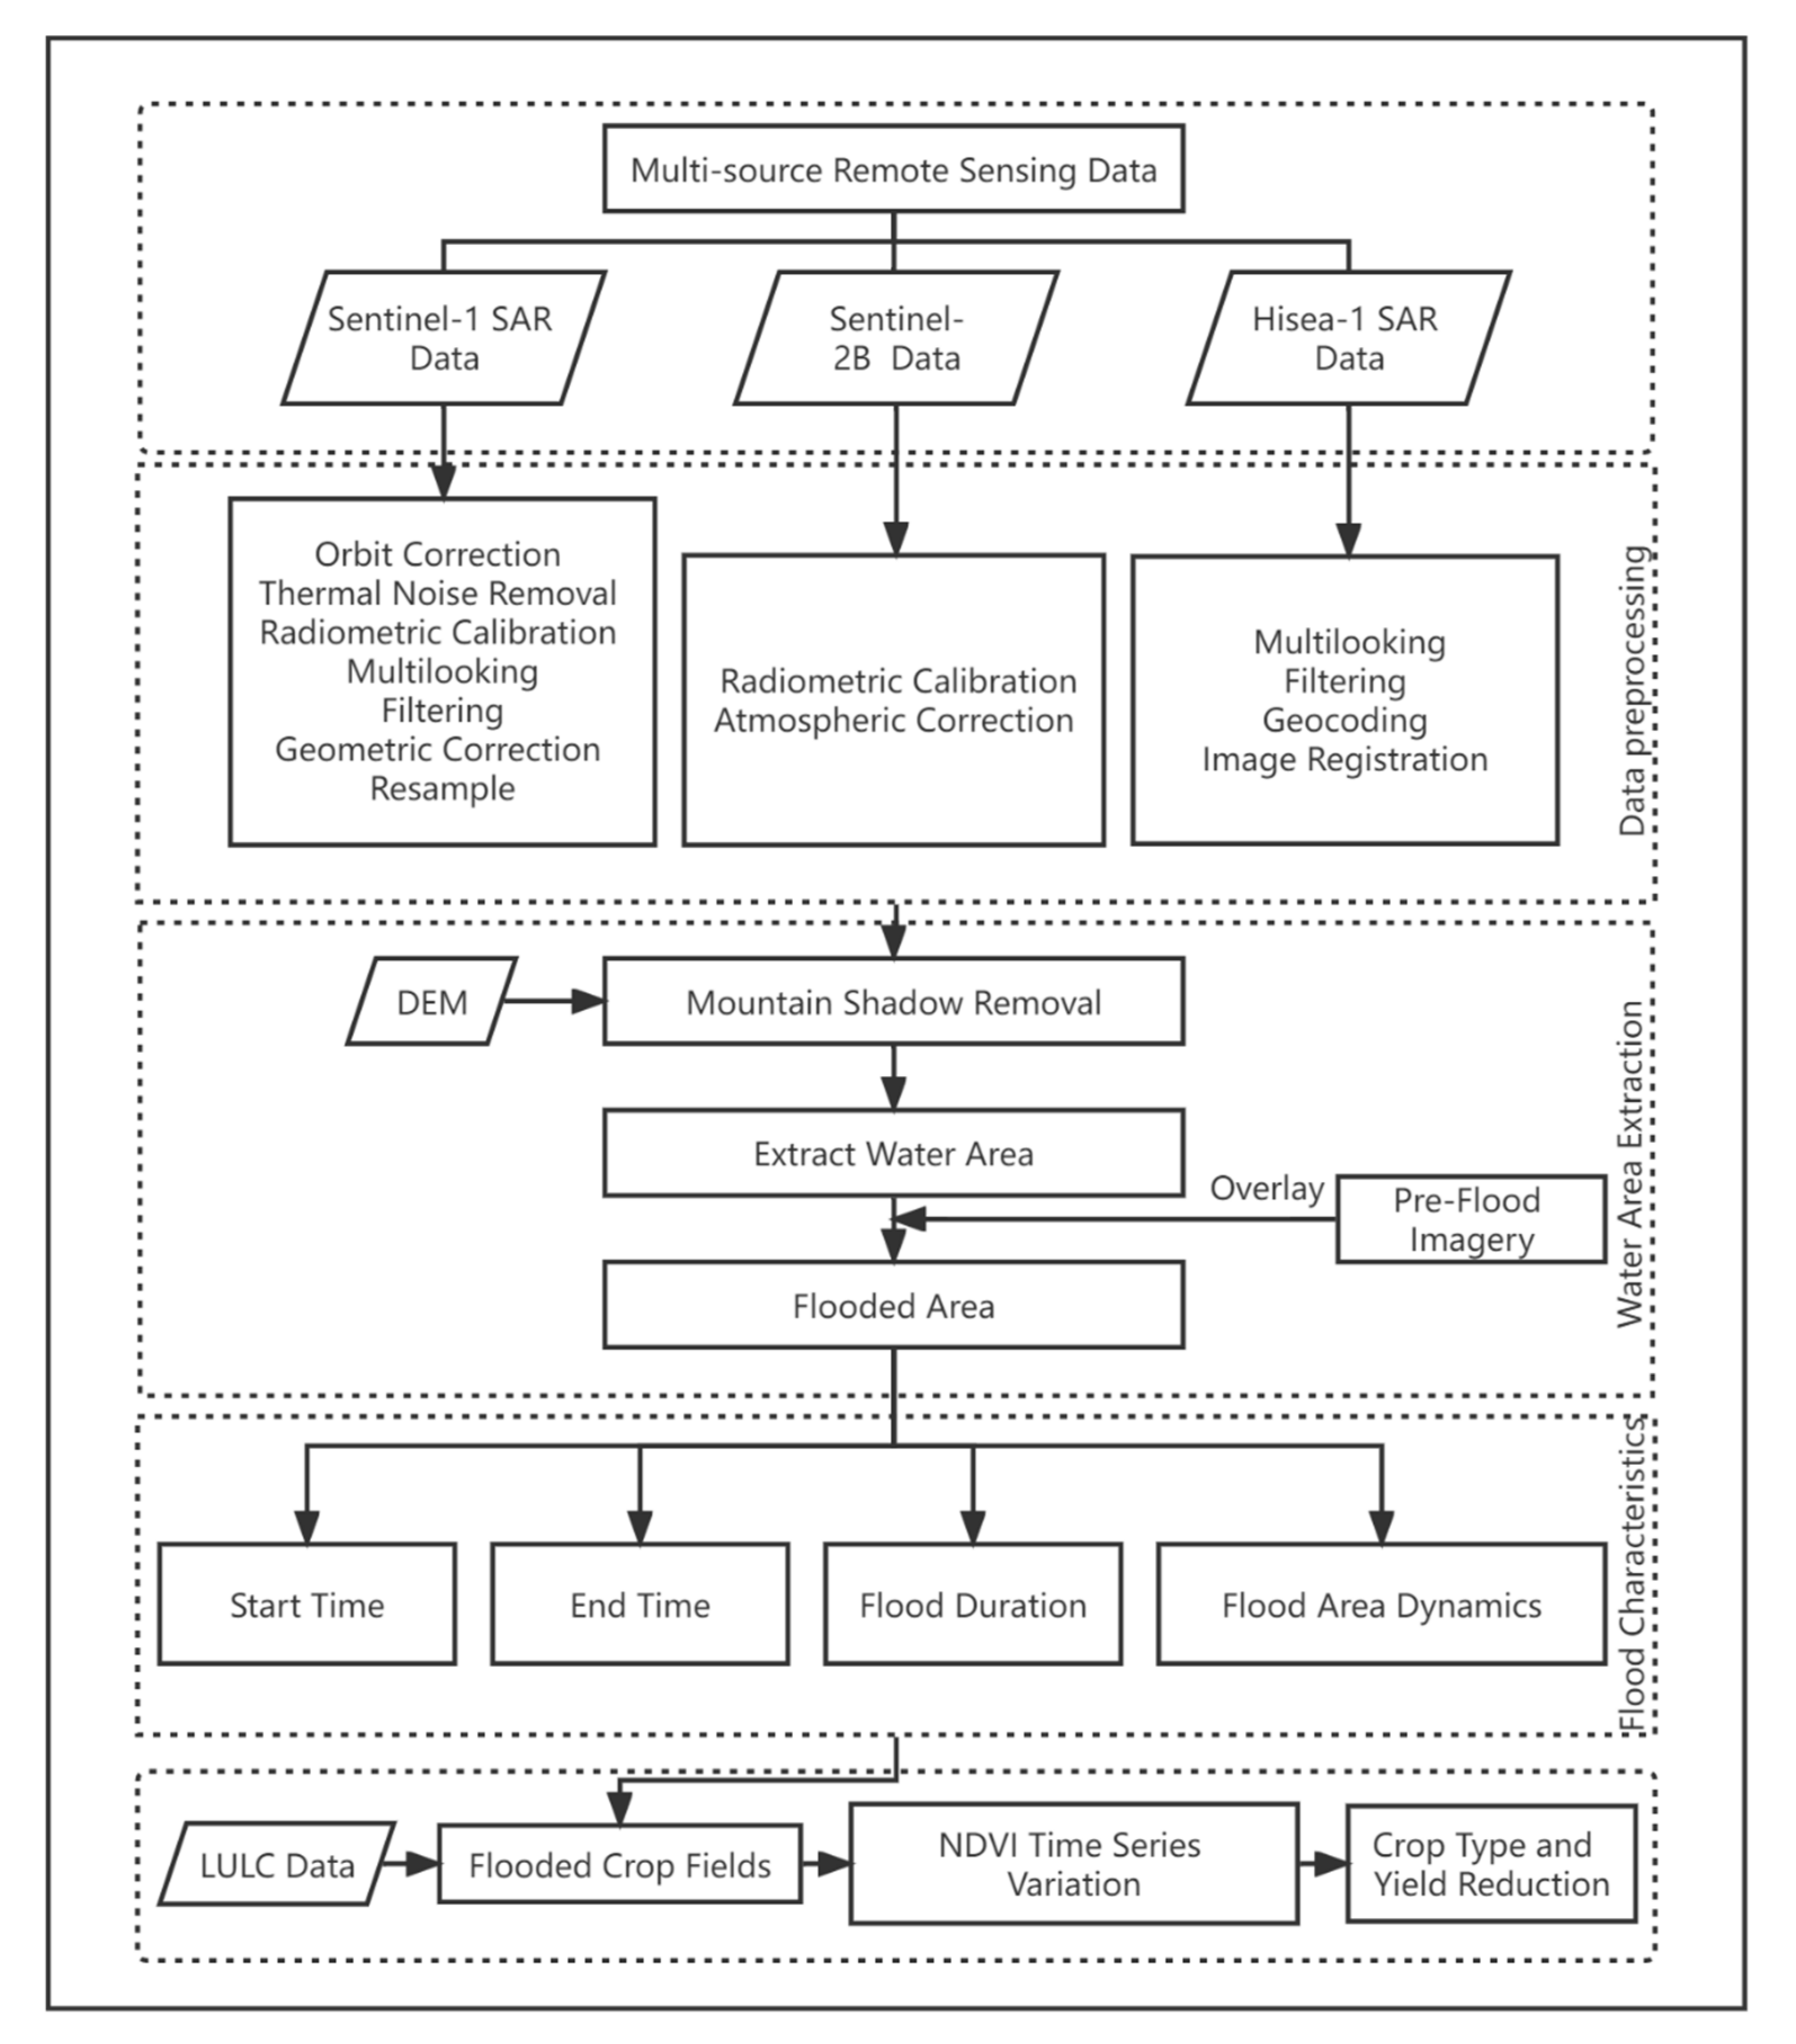
In this study, we intended to use multisource remote sensing data to monitor the extraordinary rainfall event that occurred on 20 July 2021 in Henan by extracting the flood inundation extent, performing an integrated analysis of the flood dynamics, and identifying the crop types and yield losses influenced by flood inundation using NDVI time-series data. The entire integrated process of the whole study, shown in Figure 3, was constructed by a few basic steps: (1) data collection and preprocessing (described in Section 2.2); (2) water area extraction; (3) flood characteristic detection; and (4) crop damage information analysis.
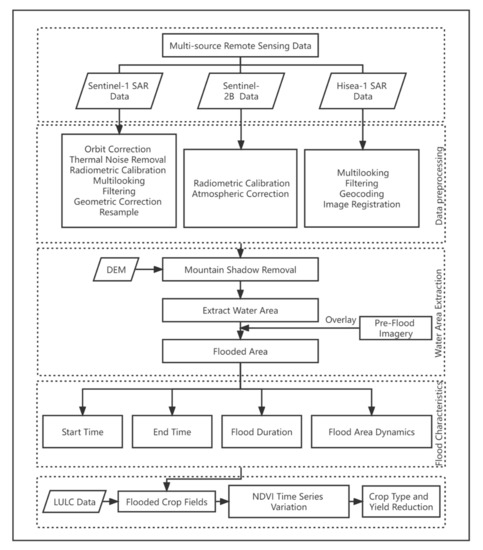
Figure 3.
Flowchart of the flood feature extraction and crop loss analysis methods performed for the 20 July 2021 extraordinary rainfall event in Henan, China.
- ■
- Water area extraction
When extracting the area of a water body, the first task to be considered is elimination of the impacts of mountain shadows and terrain undulations in SAR images because hill shadow regions generate dark areas in SAR images that can easily be confused with water surfaces [45]. In this study, based on DEM data, we used a decision tree classification method supported by ENVI (version 5.3) software to conduct hill shadow removal. It is known that a high gradient can cause flood waters to wash straight away and thus does not cause flood water storage. Therefore, based on the slope classes stated in the International Geographical Union Commission on Geomorphological Survey and Mapping, the areas with slopes greater than 15° were identified as steep-slope areas and were removed. Conversely, areas in which the slope was lower than 15° were reserved for the water area extraction [46].
Second, three different approaches were utilized to extract the water areas from the three types of remote sensing data. For the S1 SAR images, the Sentinel-1 dual-polarized water index (SDWI) proposed by Jia et al. was calculated to extract the water body by increasing the difference between the water areas and background using Equation (2) [47]:
where is the SDWI value, VV is the pixel value from the VV polarization mode, and VH is the pixel value from the VH polarization mode.
For the S2 optical images, the modified normalized difference water index (MNDWI) was calculated to extract the water area, as described in Equation (3) below [48]:
where BGreen is the green light band (band 3) and BSWIR is the SWIR band (band 11) in S2 multispectral images.
Then, the threshold segmentation method was adopted to extract water bodies based on different water indexes. To set suitable threshold values, sample areas of water bodies and non-water bodies were selected; then, frequency distribution histograms of the sample pixels were plotted. By using histogram bimodal methods [49], the suitable threshold of each image was calculated; the thresholds were then used to obtain the water body area by segmenting the SDWI water body index images and MNDWI water body index images.
Since Hisea-1 is a single-polarized C-band SAR satellite, it is not applicable for calculating SDWI. Therefore, an unsupervised classification approach was used to extract the water bodies from the Hisea-1 images. This is because unsupervised classification methods can use only information from the image pixel and cannot consider prior knowledge. Among these unsupervised classification approaches, the k-means clustering technique was adopted in this study to extract the water area; this method is the most well-known and effective self-organization clustering algorithm and was proposed by Hartigan and Wong [50]. It uses distance as a similarity indicator and the sum of squares of errors from sample points of category centers as the evaluation indicator of the clustering quality and minimizes the sum of squares function of the overall classification by an iterative method [51].
- ■
- Flood characteristics detection
After obtaining water areas from 13 remote sensing images, we integrated the results on a temporal scale. For each pixel, we calculated the first and last times the pixel was covered by flood waters to identify the flood start time, end time, and duration and to map the flood dynamic.
- ■
- Crop damage identification
As previously mentioned, there is a large amount of agricultural land in the flood-affected area. At the same time, crop rotation has been used in these regions, meaning that maize is planted in summer (July–September) and wheat is planted in autumn (from October to June of the following year). Due to the long duration of the studied flood, it was important to determine exactly which kinds of crops were affected and the extent to which production was reduced. With the help of the GEE platform, we extracted NDVI time-series variation for each pixel within the flooded farmland areas (based on the LULC data) from the NDVI time-series datasets from July 2020 to June 2022. We analyzed the NDVI time-series curve during the crop growth process before and after flooding to identify the areas affected by flooding containing maize, wheat, or both. After the areas and types of crops damaged by the flood were extracted, the statistical data were used to estimate the crop production losses in the study area.
3. Results and Discussion
3.1. Spatial and Temporal Changes in the Flooded Area
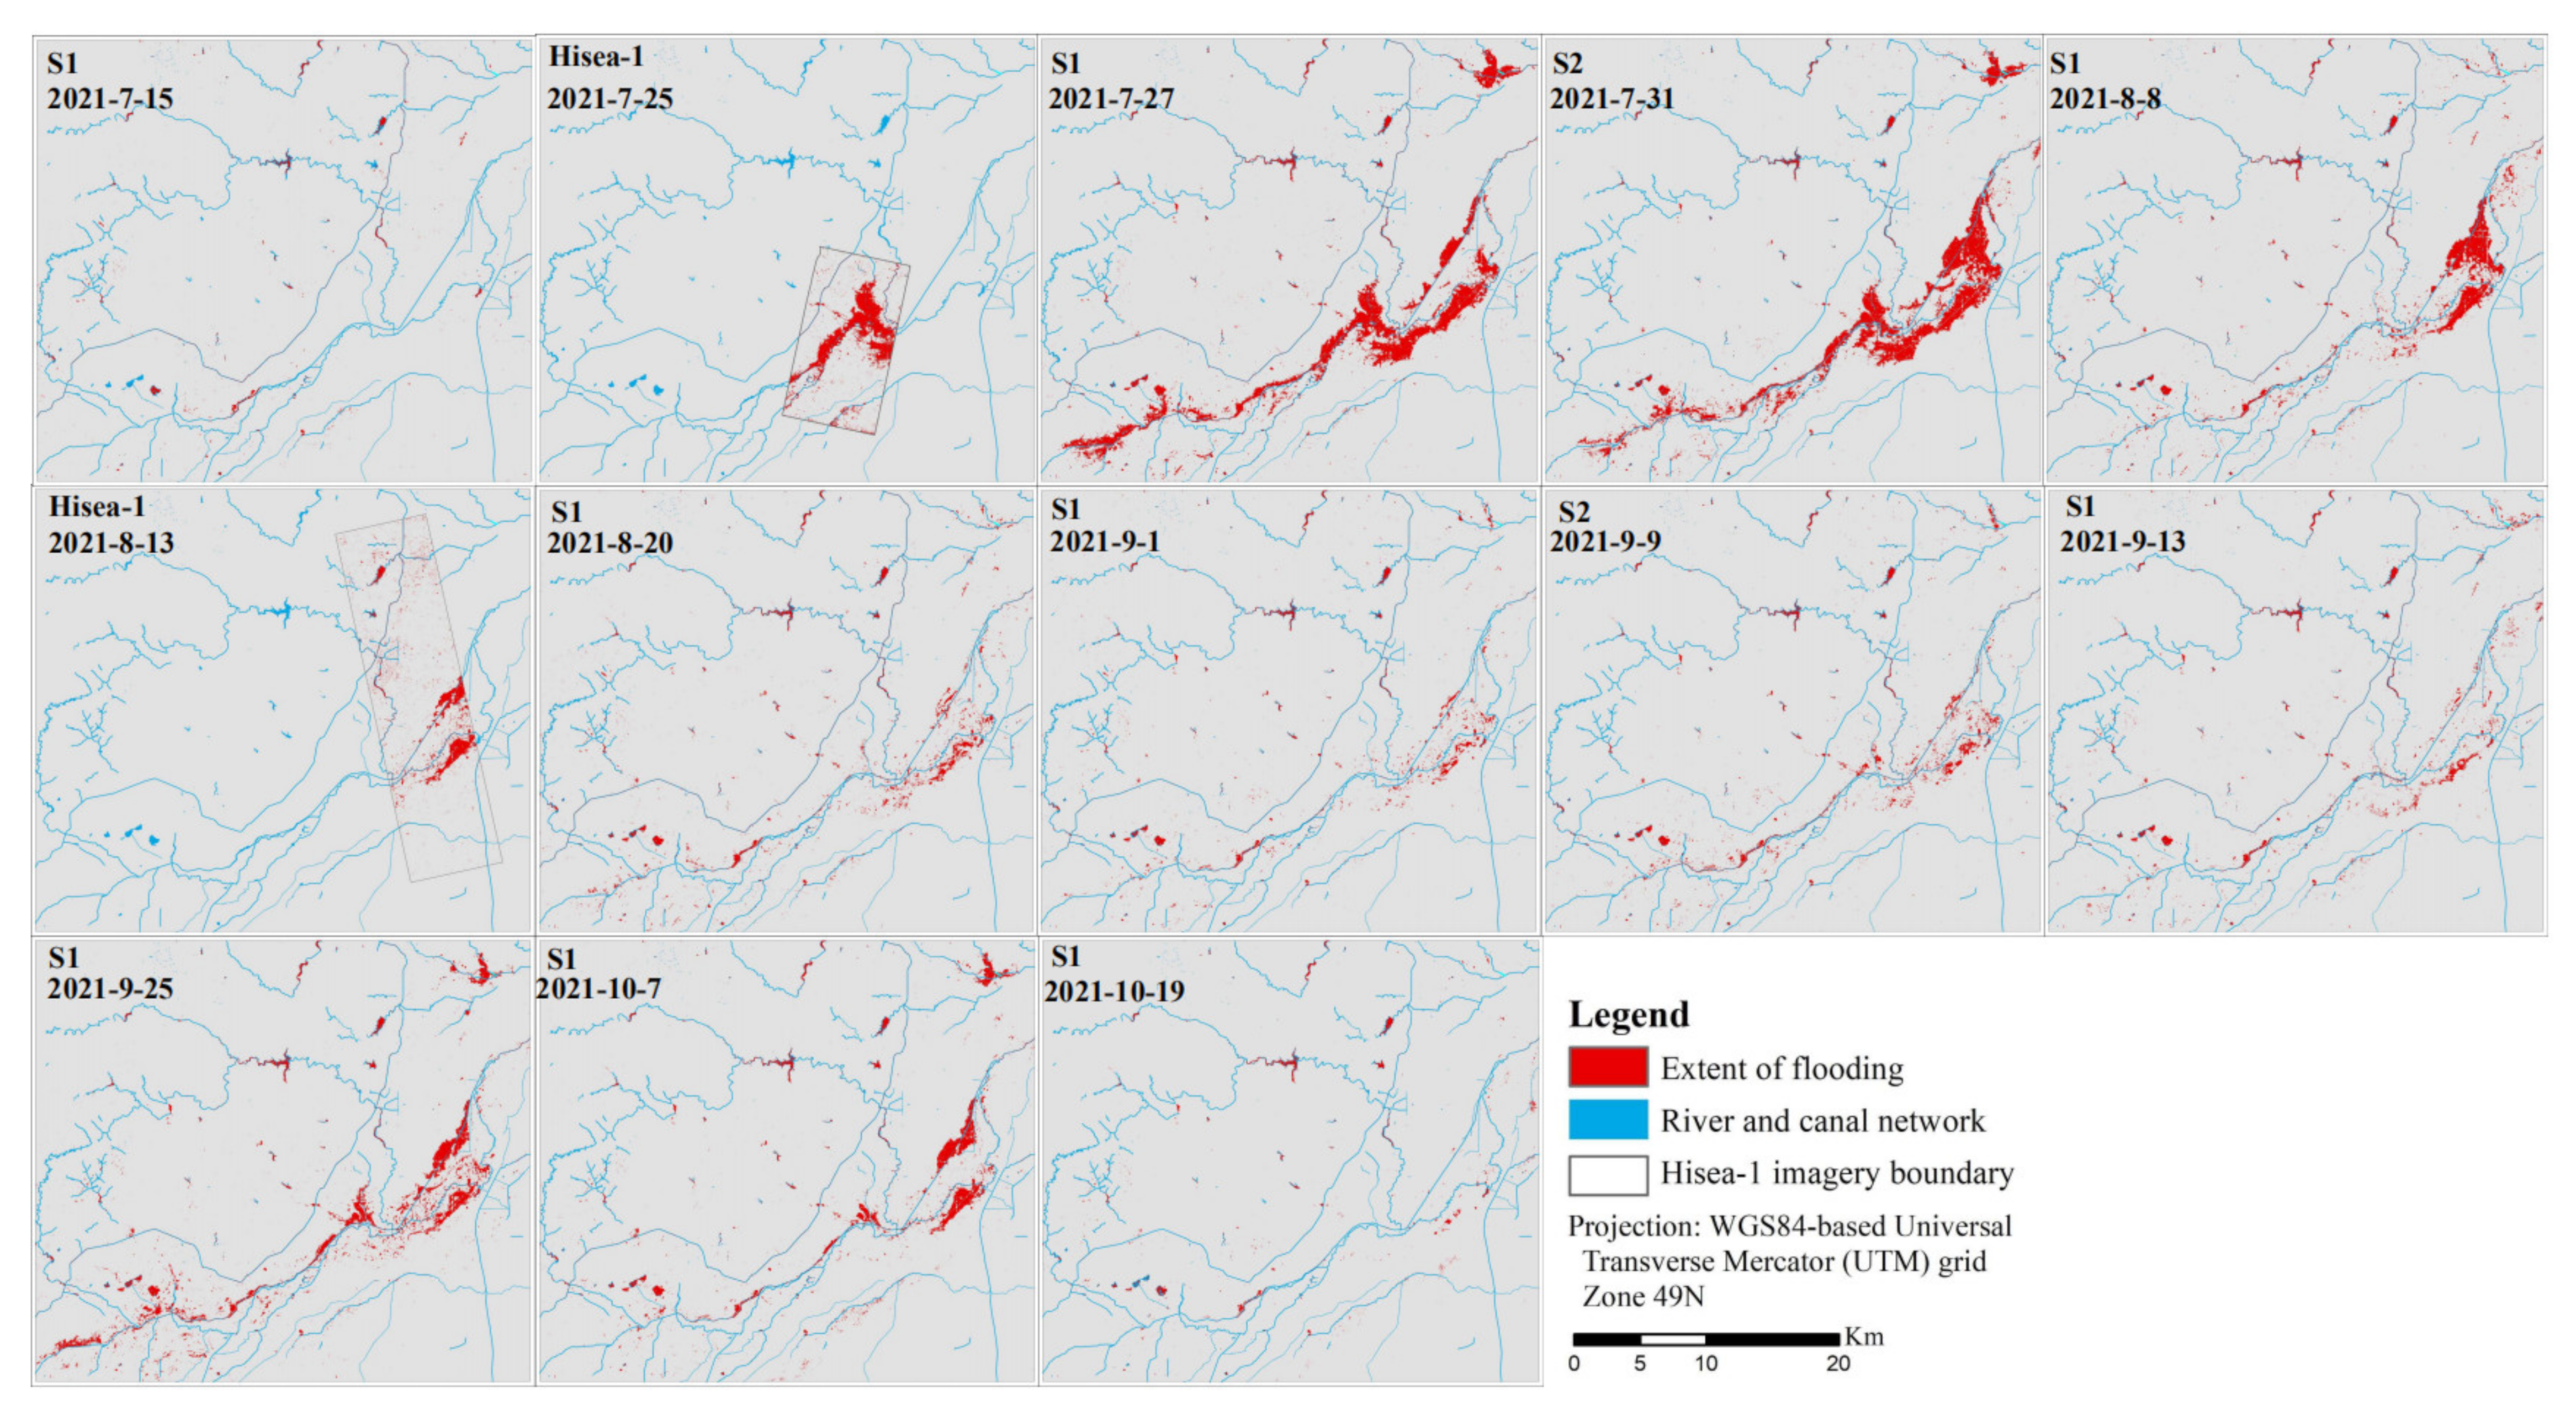
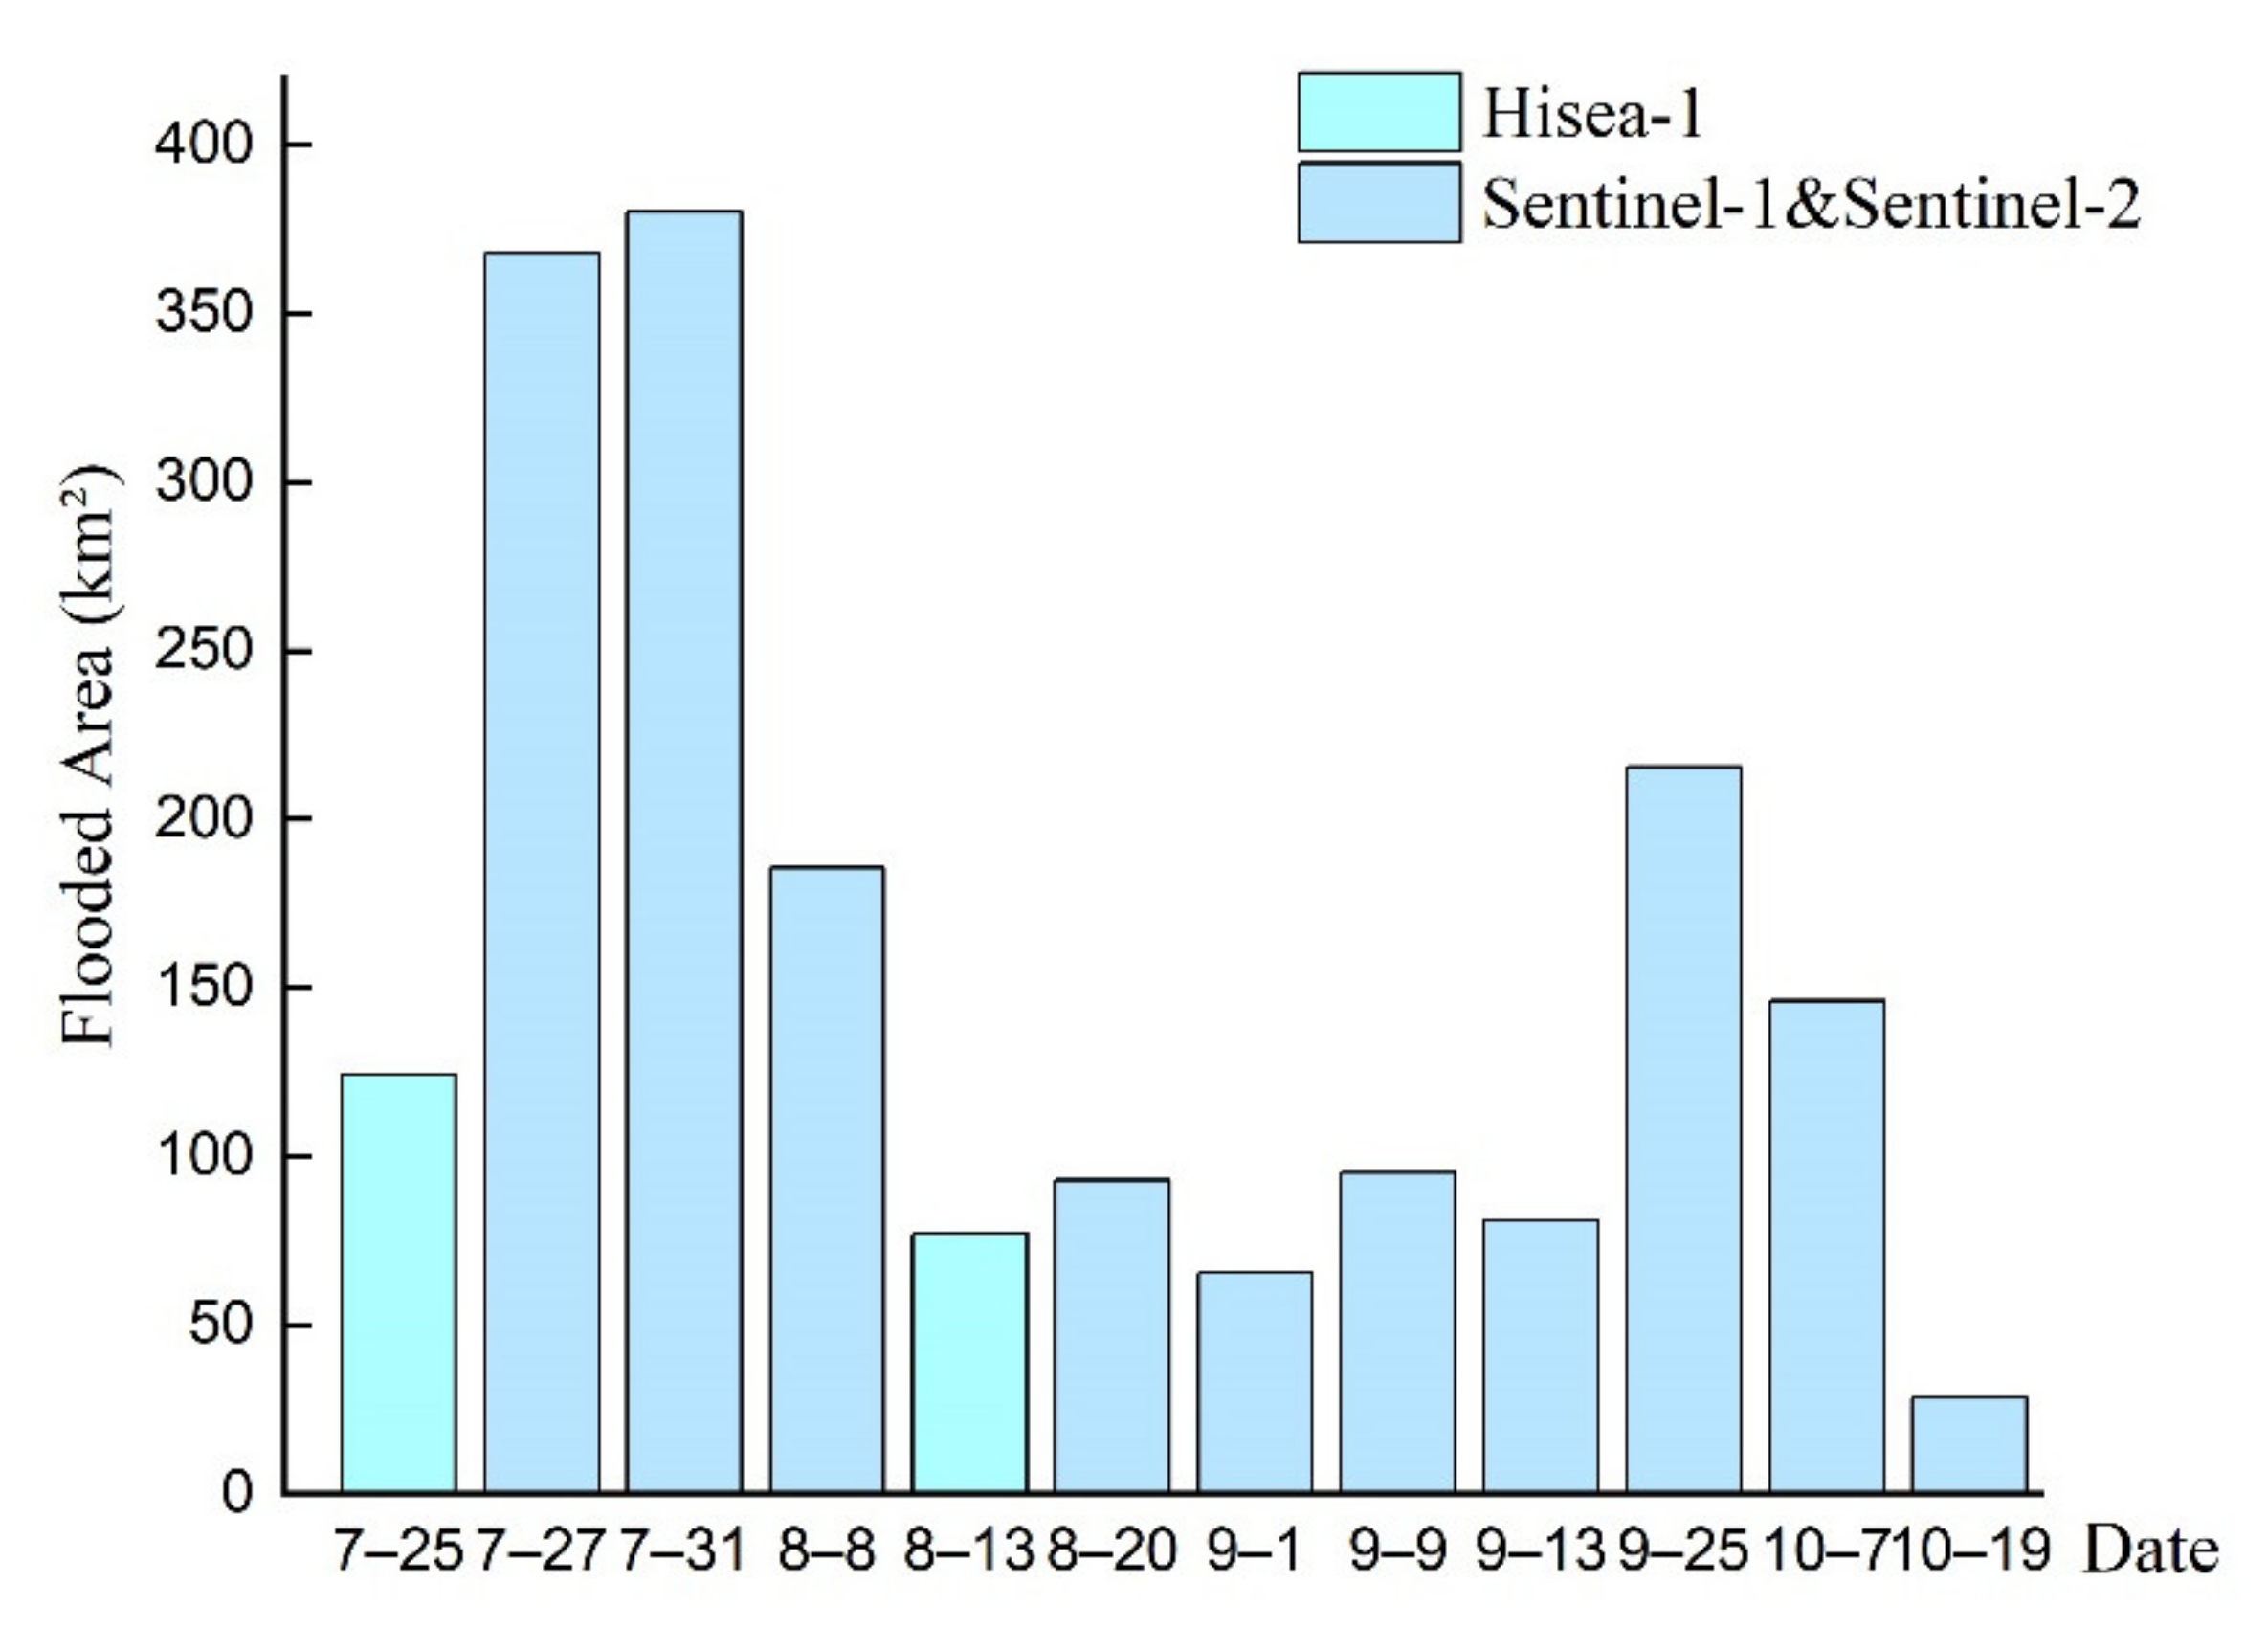
Using the method described above, we obtained dynamic information on the flood caused by the 20 July 2021 extraordinary rainfall event in Henan, China. Figure 4 illustrates the spatial distribution of the flooded area over time, and Figure 5 provides statistics on the extent of the flooded area. From these two figures, we found that the study area suffered a total of two major flooding events during the disaster. The first flood began at least by 25 July (meaning that the images from Hisea-1 had observed the flood by this date; due to coverage limitations, these images did not cover the whole study area, so the observed flood area may be incomplete), which then gradually expanded and reached a maximum on 31 July, with an area of 380.2 km2. After 31 July, the flood began to recede rapidly, reaching a minimum area of 65.4 km2 by 1 September. However, the area of flooding was small at this time, and the flood had not completely subsided. By 13 September, an 81.0 km2 area was still flooded. Then, the second flood followed, causing the flooded area to rapidly increase and reach a maximum area of 215.6 km2 on 25 September. Thereafter, the flood receded rapidly; the flooded area was 146.0 km2 on 7 October and had largely receded by 19 October.
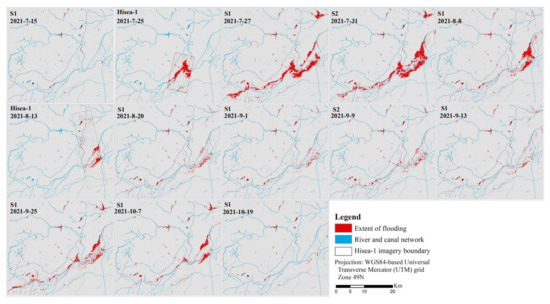
Figure 4.
Flood spatial distribution maps caused by the 20 July 2021 extraordinary rainfall event in Henan, China. The figure was plotted by Arcmap10.2 software. (S1: Sentinel-1 SAR data; S2: Sentinel-2 optical data).
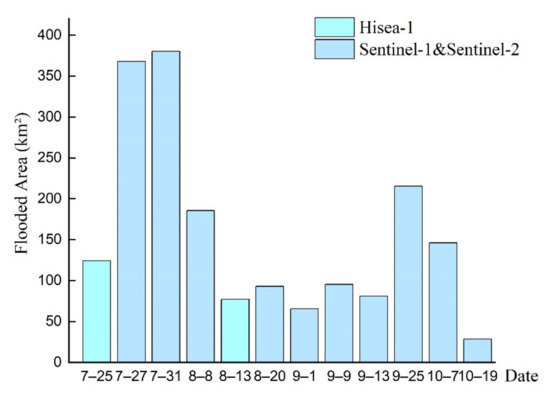
Figure 5.
Flooding area statistics based on Sentinel1, Sentinel-2, and Hisea-1 remote sensing data for monitoring the extent of flooding caused by “the 20 July 2021 extraordinary rainfall” event in Henan, China. The figure was plotted by Origin2022 software.
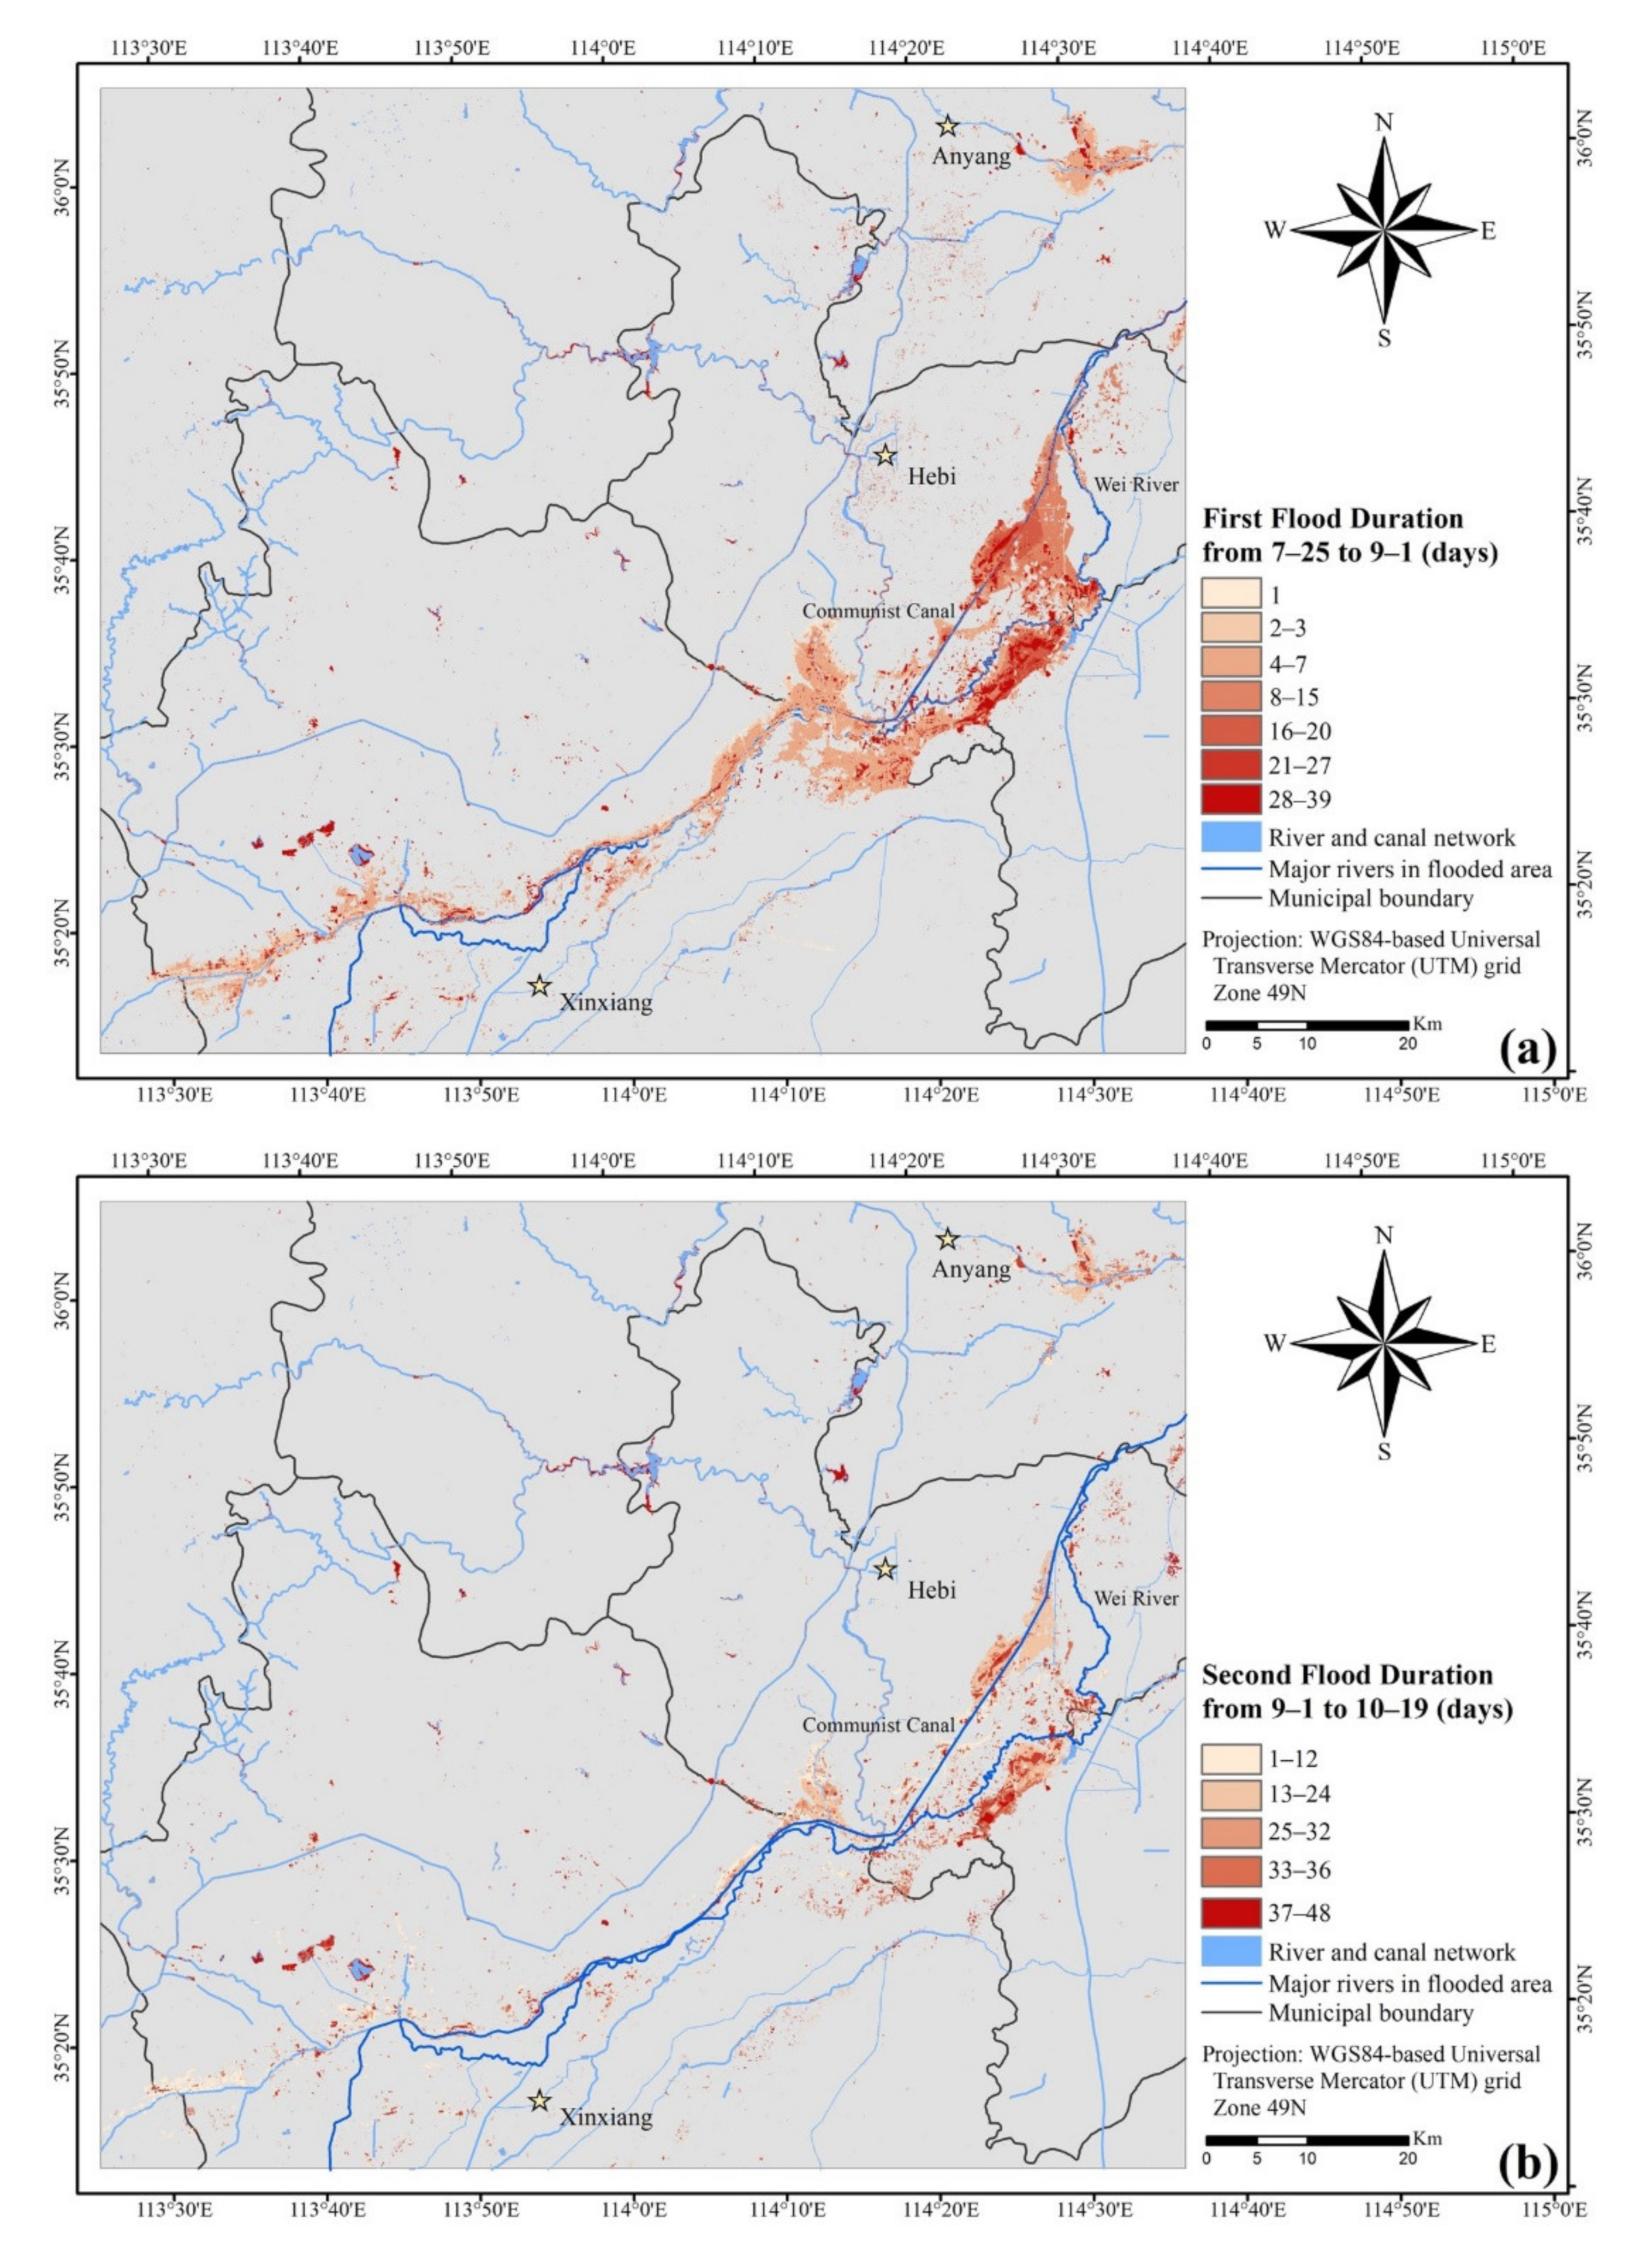
Figure 6 illustrates a superimposed map of the surface water extraction results obtained for two floods; the map indicates the flood inundation duration for each pixel. According to Figure 6, the more severely affected areas were mainly located on the banks of the Wei River and the Communist Canal, which are also the main flood storage areas. Taking the first flood as an example (Figure 6a), the flood durations within the Xinxiang City boundary on both sides of the Wei River were relatively short, lasting approximately 12 days. However, the flood durations in areas within the Hebi City boundary on both sides of the Wei River were longer, with most lasting more than 15 days and the flooding in some areas lasting up to 45 days. The main reason for this was that the Wei River basin within the Hebi section was affected by several dike breaches caused by heavy rainfall and flood diversions [52]. During the second flood, the flooding in areas located in Hebi City around the Wei River still lasted a relatively long duration (approximately 13 days); however, only a few regions flooded for longer periods (more than 30 days).
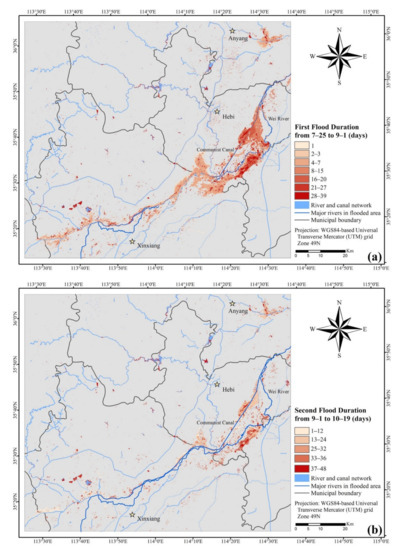
Figure 6.
Spatial distribution and duration of inundation of the first flood (from 26 July to 1 September) (a) and for the second flood (from 1 September to 19 October) (b). The figure was plotted by Arcmap10.2 software.
3.2. Assessment of Crop Production Losses in Flooded Areas
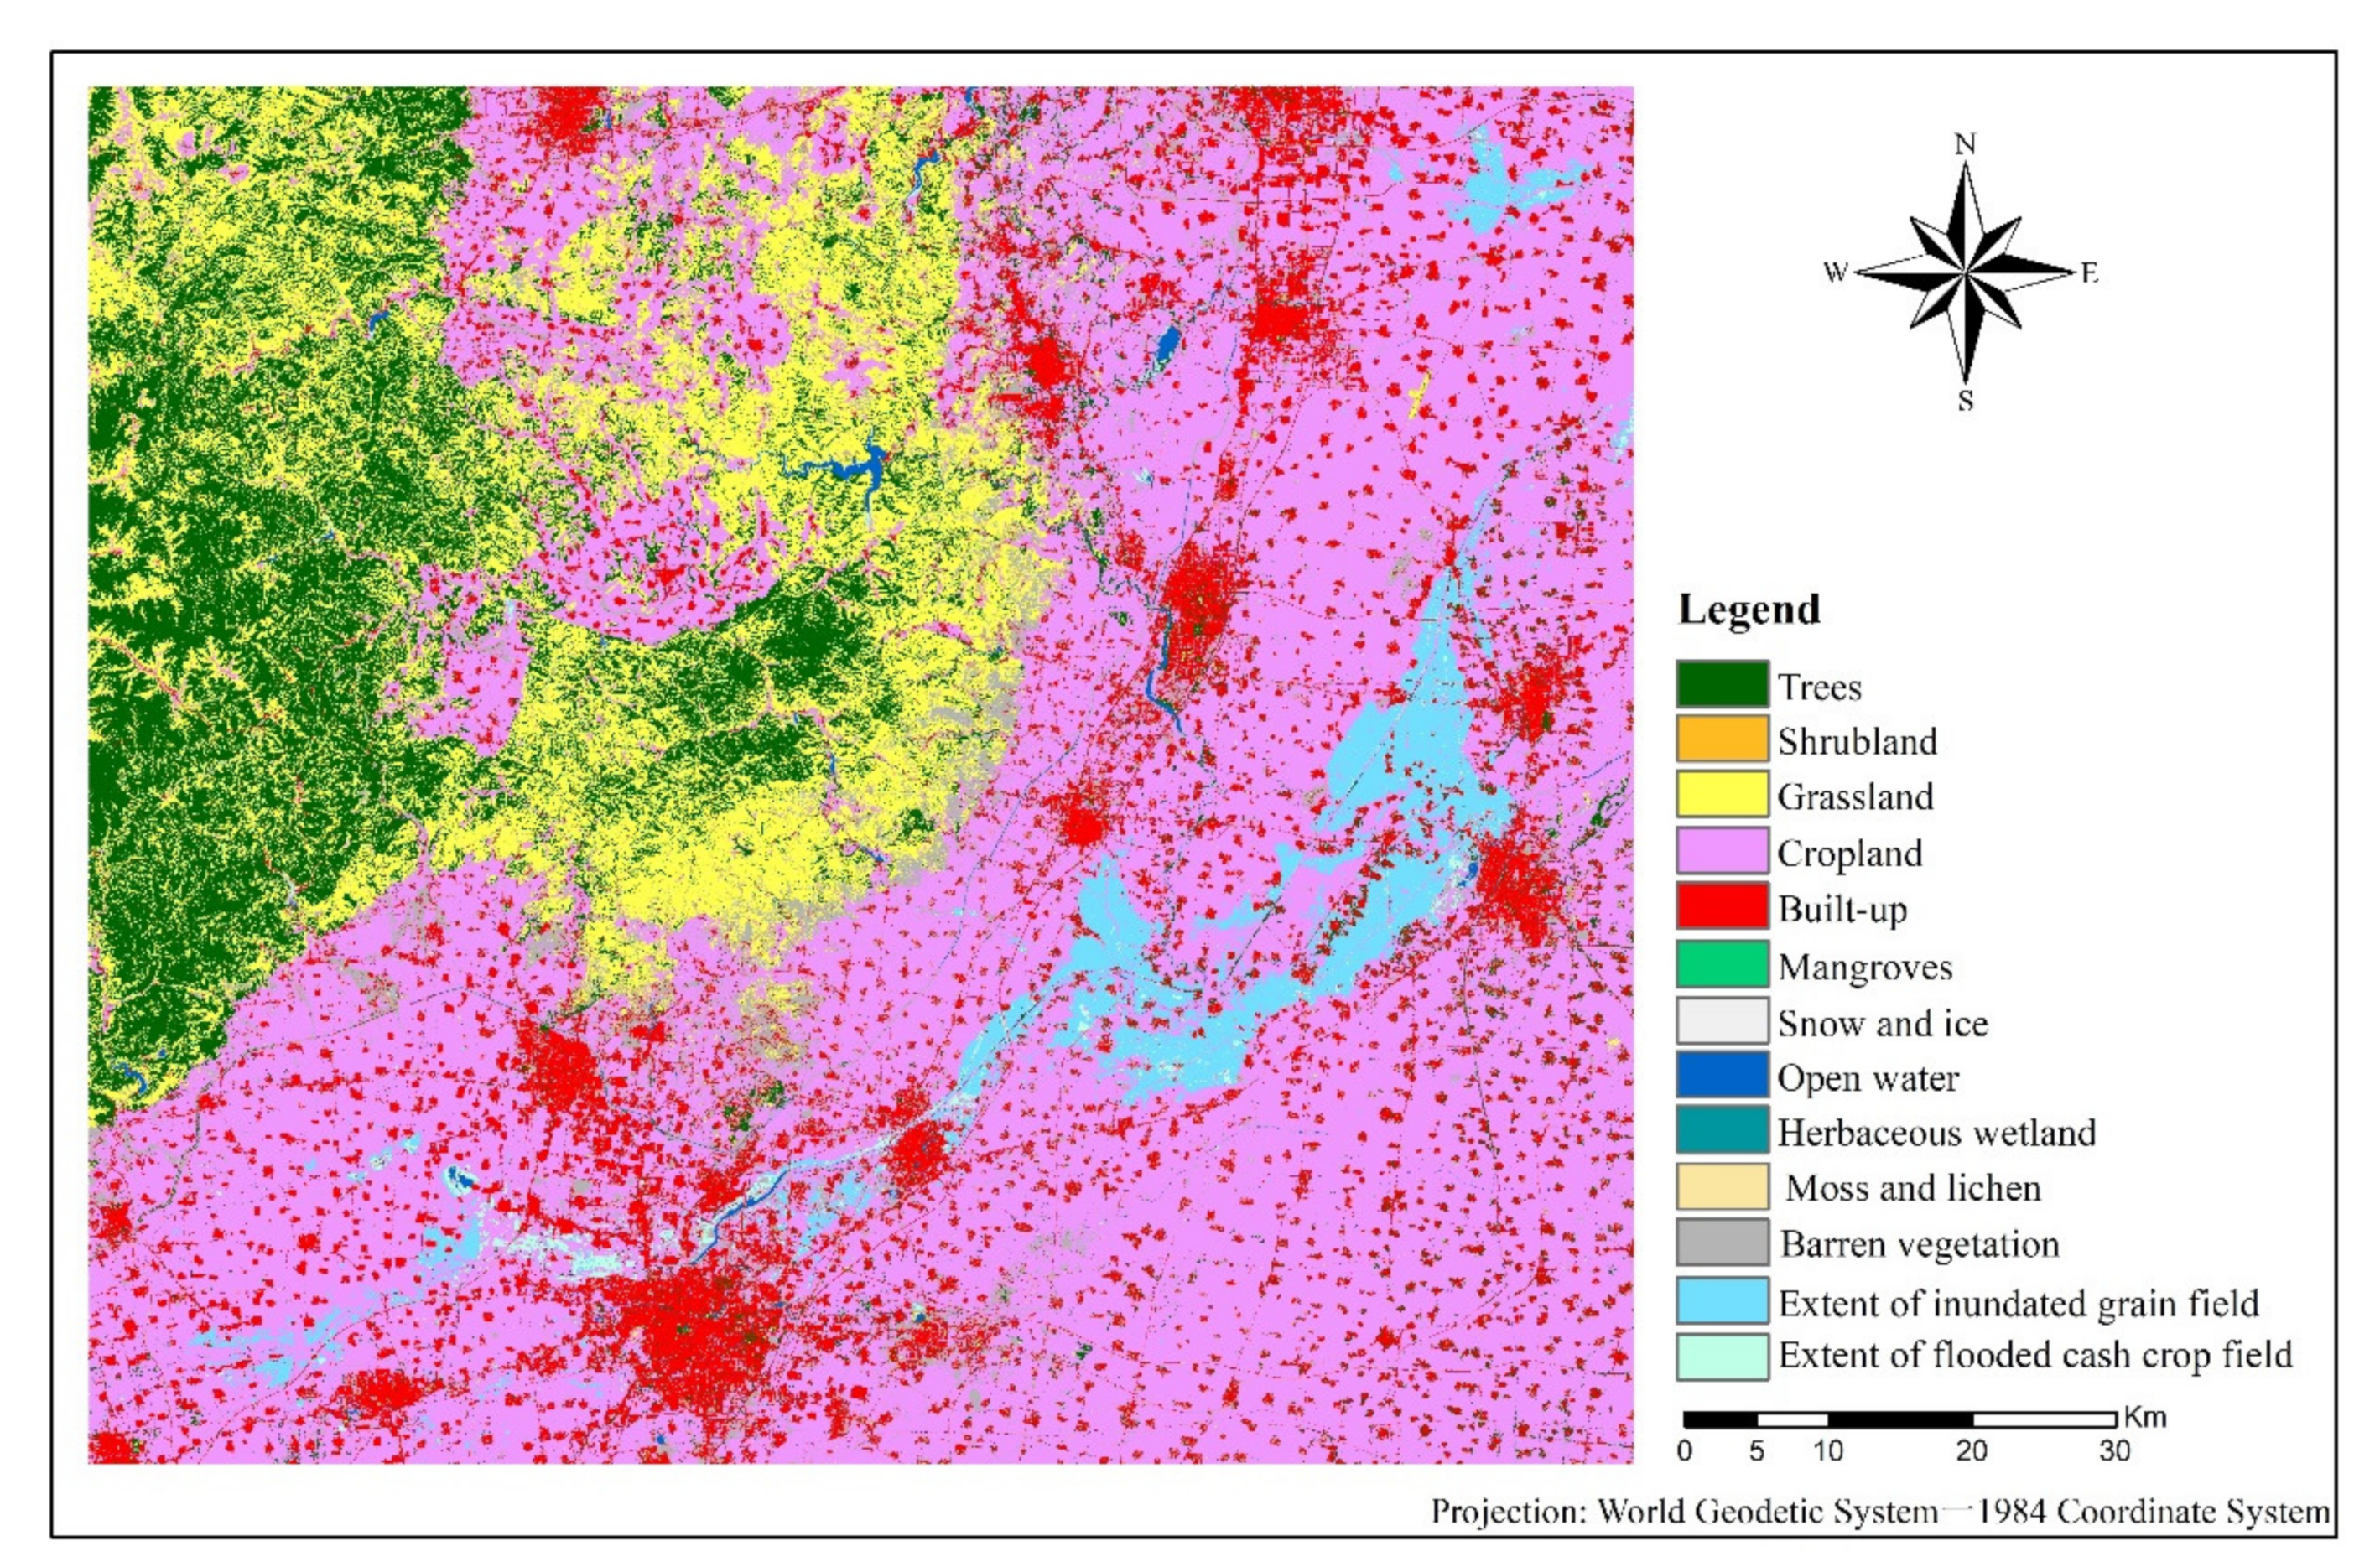
As Henan Province is a major grain-producing province in China and, according to related news reports, the main flood storage areas include key grain-producing areas in Henan [53], it is essential to assess the impact of floods on grain production in this region. Based on the acquired LULC map in 2020, winter wheat cropping distribution data, and statistical data in Henan, we extracted the grain crop planting areas affected by this heavy rainfall event, as shown in Figure 7. The area of farmland affected by this flood was 364.35 km2, of which 313.83 km2 comprised grain-cropping areas, accounting for 86.1%, and 50.25 km2 comprised cash-cropping areas, accounting for 13.9%. Among the crops grown in this region, food crops include winter wheat, corn, soybeans, and rice, and cash crops refer to peanuts, cotton, rapeseed, and other crops [54].
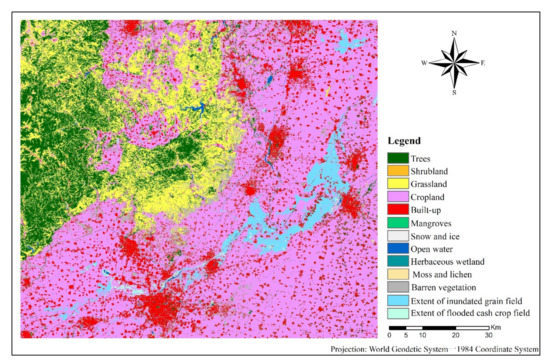
Figure 7.
The inundated grain crop and cash crop planting areas were extracted by overlaying the 2020 LULC map and winter wheat planting distribution map of the study area with the inundated areas on 31 July 2021. The figure was plotted by Arcmap10.2 software.
Henan has a temperate monsoon climate, and most of the farmlands in this region uphold a double cropping system; Henan is the main wheat-corn rotation planting area in north-central China [55]. Based on statistical data, maize and soybean are planted from July to September each year, and winter wheat is planted from October of one year to June of the next year. The 20 July 2021 heavy rainfall event resulted in inundation with different durations in different regions, among which the longest duration was nearly 3 months, covering the growing season of the autumn crop and the corresponding wheat-sowing period.
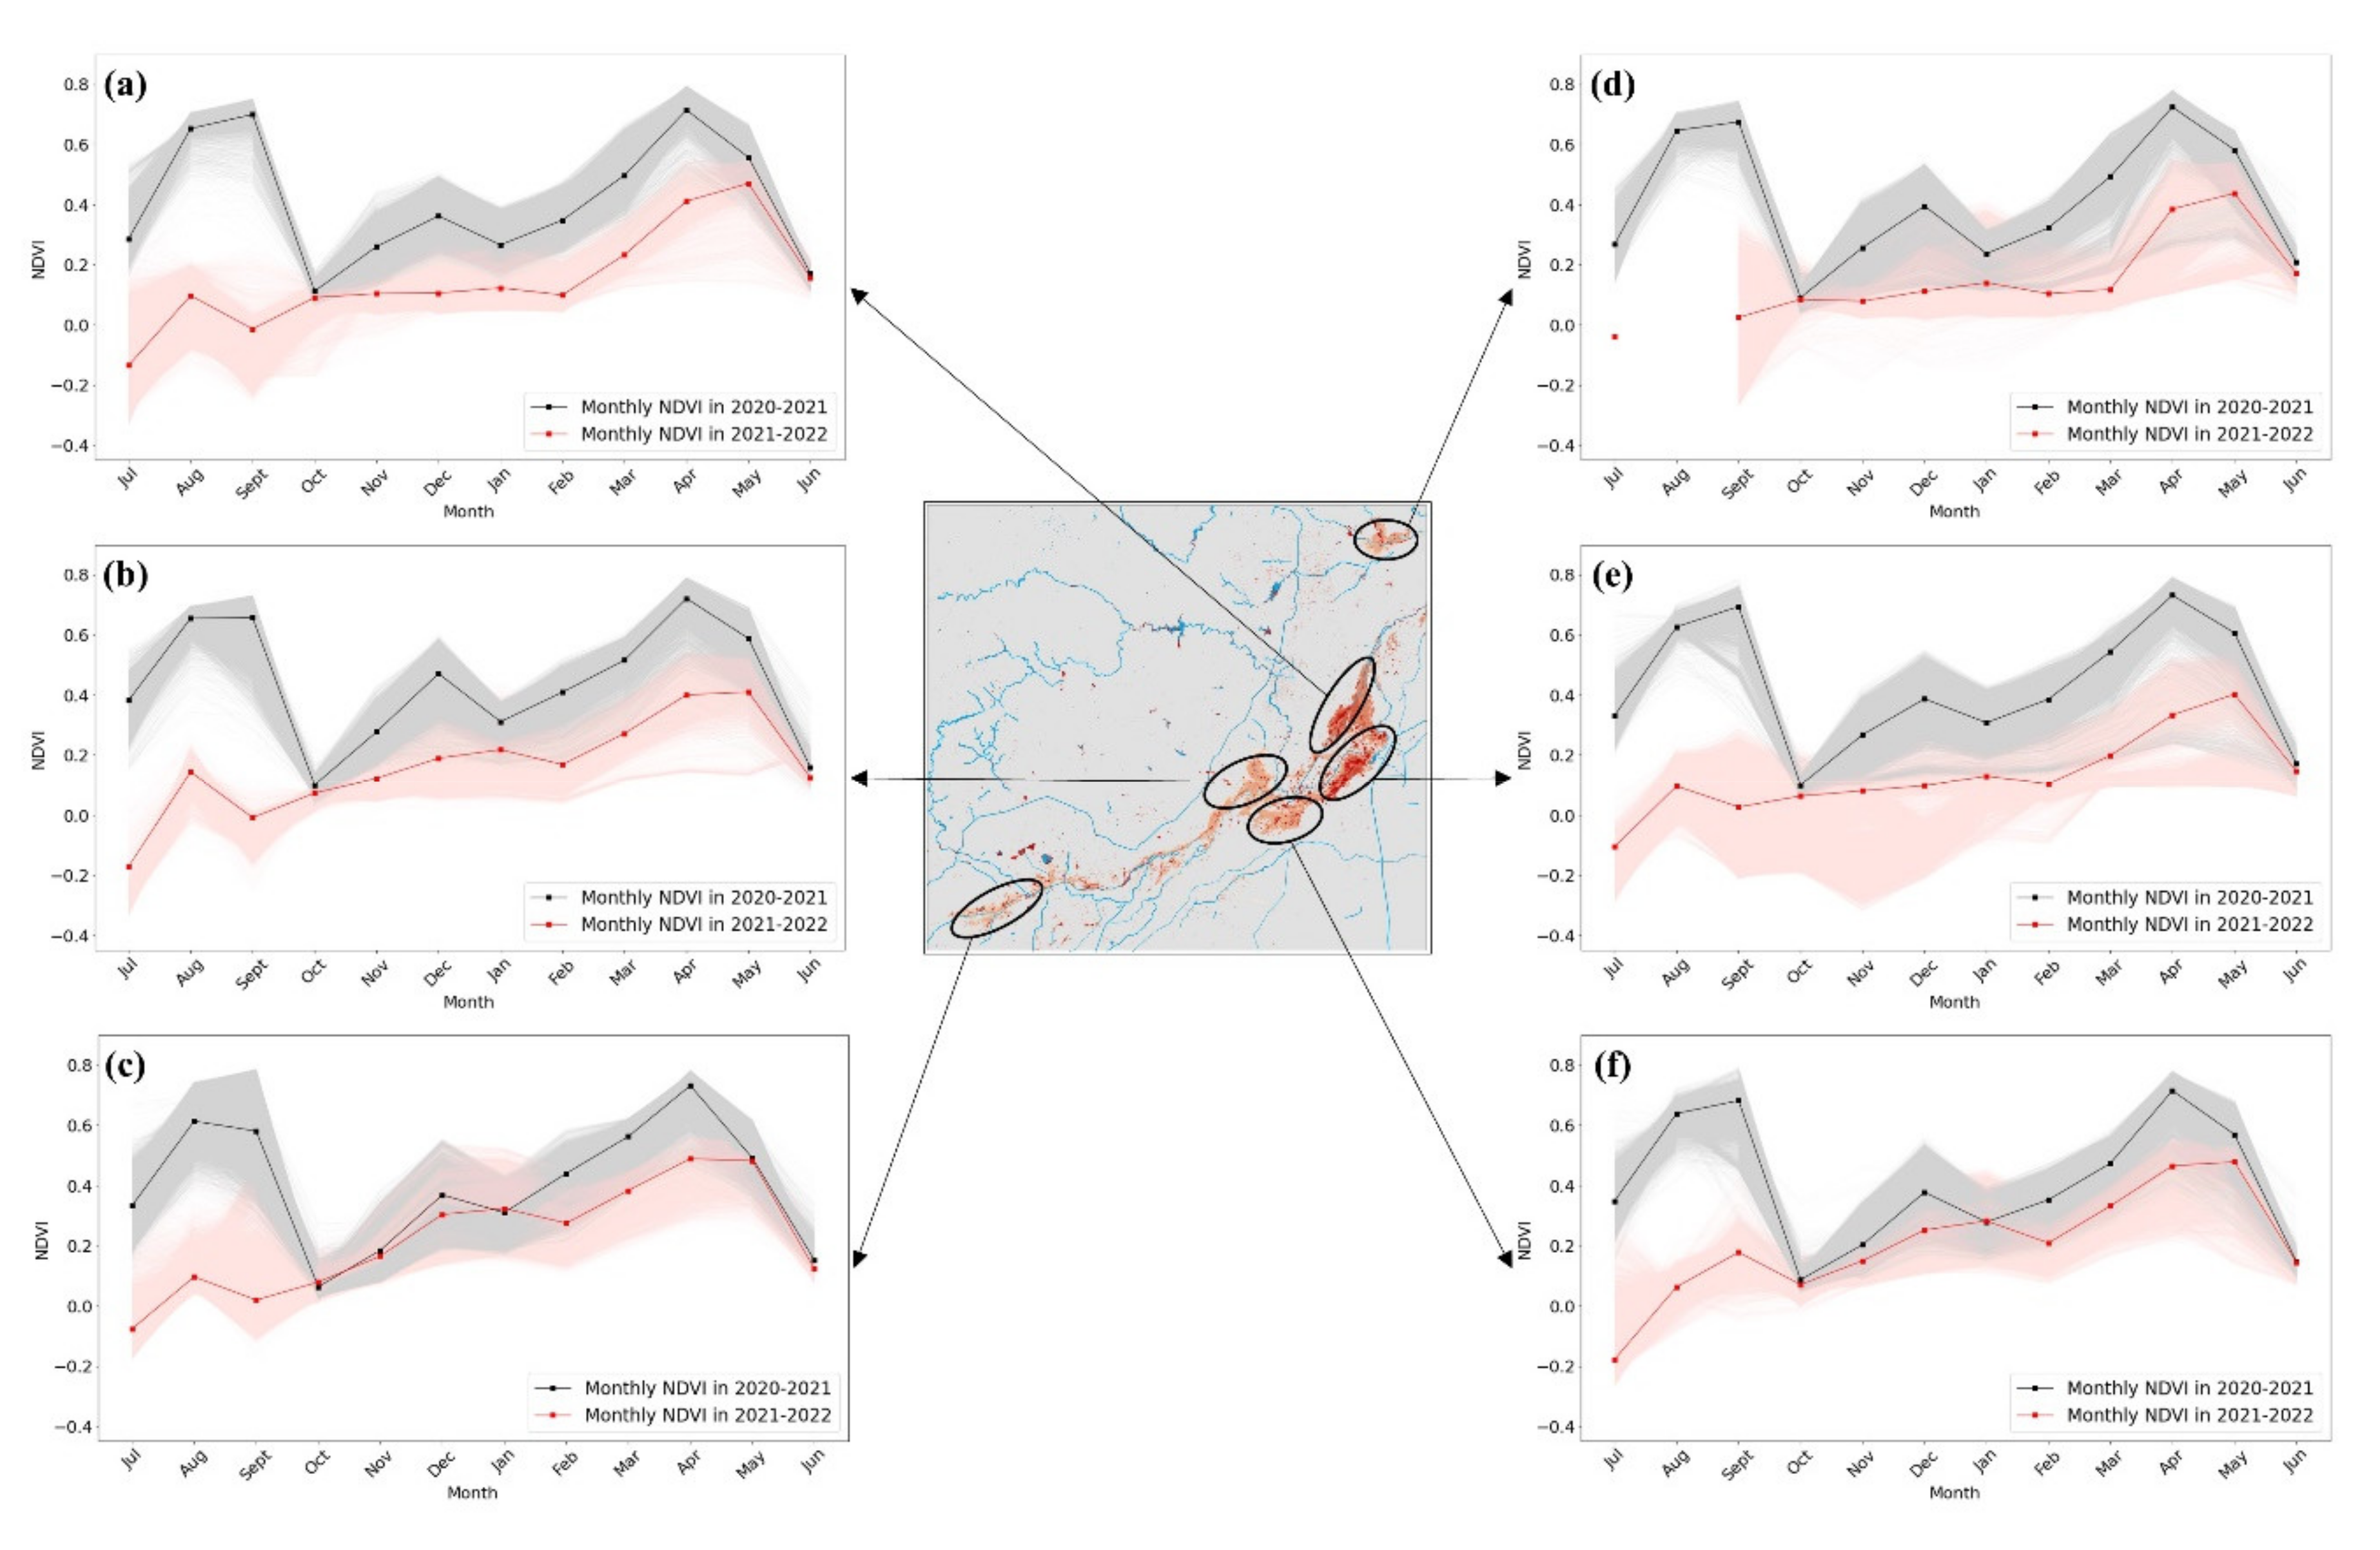
As shown in Figure 8, in general, maize and soybean are sown in mid–late June, followed by seedling rearing and growth, and NDVI peaks in September. Then, as crops mature, the chlorophyll content begins to decline, and NDVI gradually decreases [56]. From July to September 2021, the NDVI values of most areas were below 0.2, except for a few small areas with relatively short inundation durations. Considering that the NDVI value was greater than 0.2 in the same period of 2020, the NDVI value of 0.2 in September 2021 was chosen as the critical threshold to extract the affected autumn grain crop areas, with a statistical area of 263.3 km2. Combined with the statistical data, the yield per unit area of food crops in autumn 2020 was found to be 606.82 t/km2, meaning that the study area experienced a loss of 160,000 t of grain crop production in autumn due to the floods.
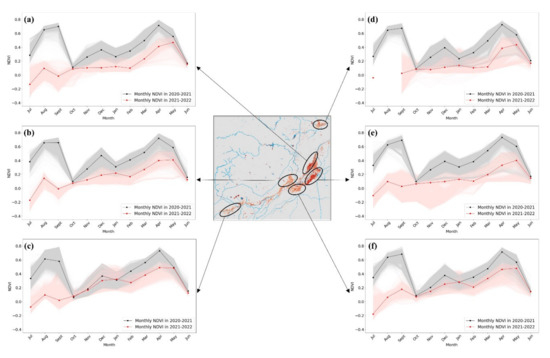
Figure 8.
(a–f) are the seasonal variation in NDVI per pixel in different regions of the study area. The light gray lines indicate the NDVI value for each pixel within the cropland-covered flooded area in the corresponding hotspot area from July 2020 to June 2021; the black line indicates the averaged NDVI of all pixels within the corresponding region from July 2020 to June 2021; the light pink lines indicate the NDVI for each pixel within the cropland-covered flooded area in the corresponding hotspot area from July 2021 to June 2022; and the red line indicates the averaged NDVI of all pixels within the corresponding region from July 2021 to June 2022. The figure was plotted by Python3.9 software.
As shown in Figure 8, the winter wheat NDVI peaks in April each year as wheat enters the tassel stage. In April 2021 (before the flood), the monthly average NDVI in the study area reached 0.6, while, in April 2022 (after the flood), the monthly average NDVI values were generally distributed at approximately 0.4, indicating that the flood adversely affected the winter wheat yield in the following year. According to the statistics, the area with monthly average NDVI values greater than 0.4 in April 2021 was 305.84 km2, accounting for 97% of the total planted area. However, the area with monthly average NDVI values greater than 0.4 in April 2022 was only 207.4 km2, meaning that at least approximately 106.4 km2 of winter wheat yield in the study area would be reduced due to flooding. In addition, it is common to use an NDVI value of 0.2 to distinguish bare land from green vegetation [57]; therefore, a monthly average NDVI value of 0.2 in April 2022 was chosen as the threshold to extract the winter wheat extinction area. Therefore, at least 28 km2 of winter wheat faced extinction. Combined with the 2021 summer grain crop production per unit area of 668.1 t/km2, the loss of at least 18.7 kt of winter wheat occurred in 2022 within the study area.
3.3. Advantages of Hisea-1 Data
Heng used S1 and S2 data to analyze the extent of flooding and perform automatic extraction of this flood using a threshold method with machine learning classification, which focused on a comparison of the effectiveness of the two methods of water extraction [58]; Zhang et al. used CYGNSS data to monitor the extent of flooding in Henan Province during heavy rainfall in 2021 and validated the results using SMAP [59]; Wang et al. used the GF-3 SAR data to statistically analyze the changes in urban water information in Zhengzhou City in July 2021 [60]. Based on the above, it is essential to use high spatial and temporal resolution data to monitor a flood and to assess the damage after the disaster; moreover, high spatial and temporal resolution SAR data is one of the most powerful means to monitor a flood at present.
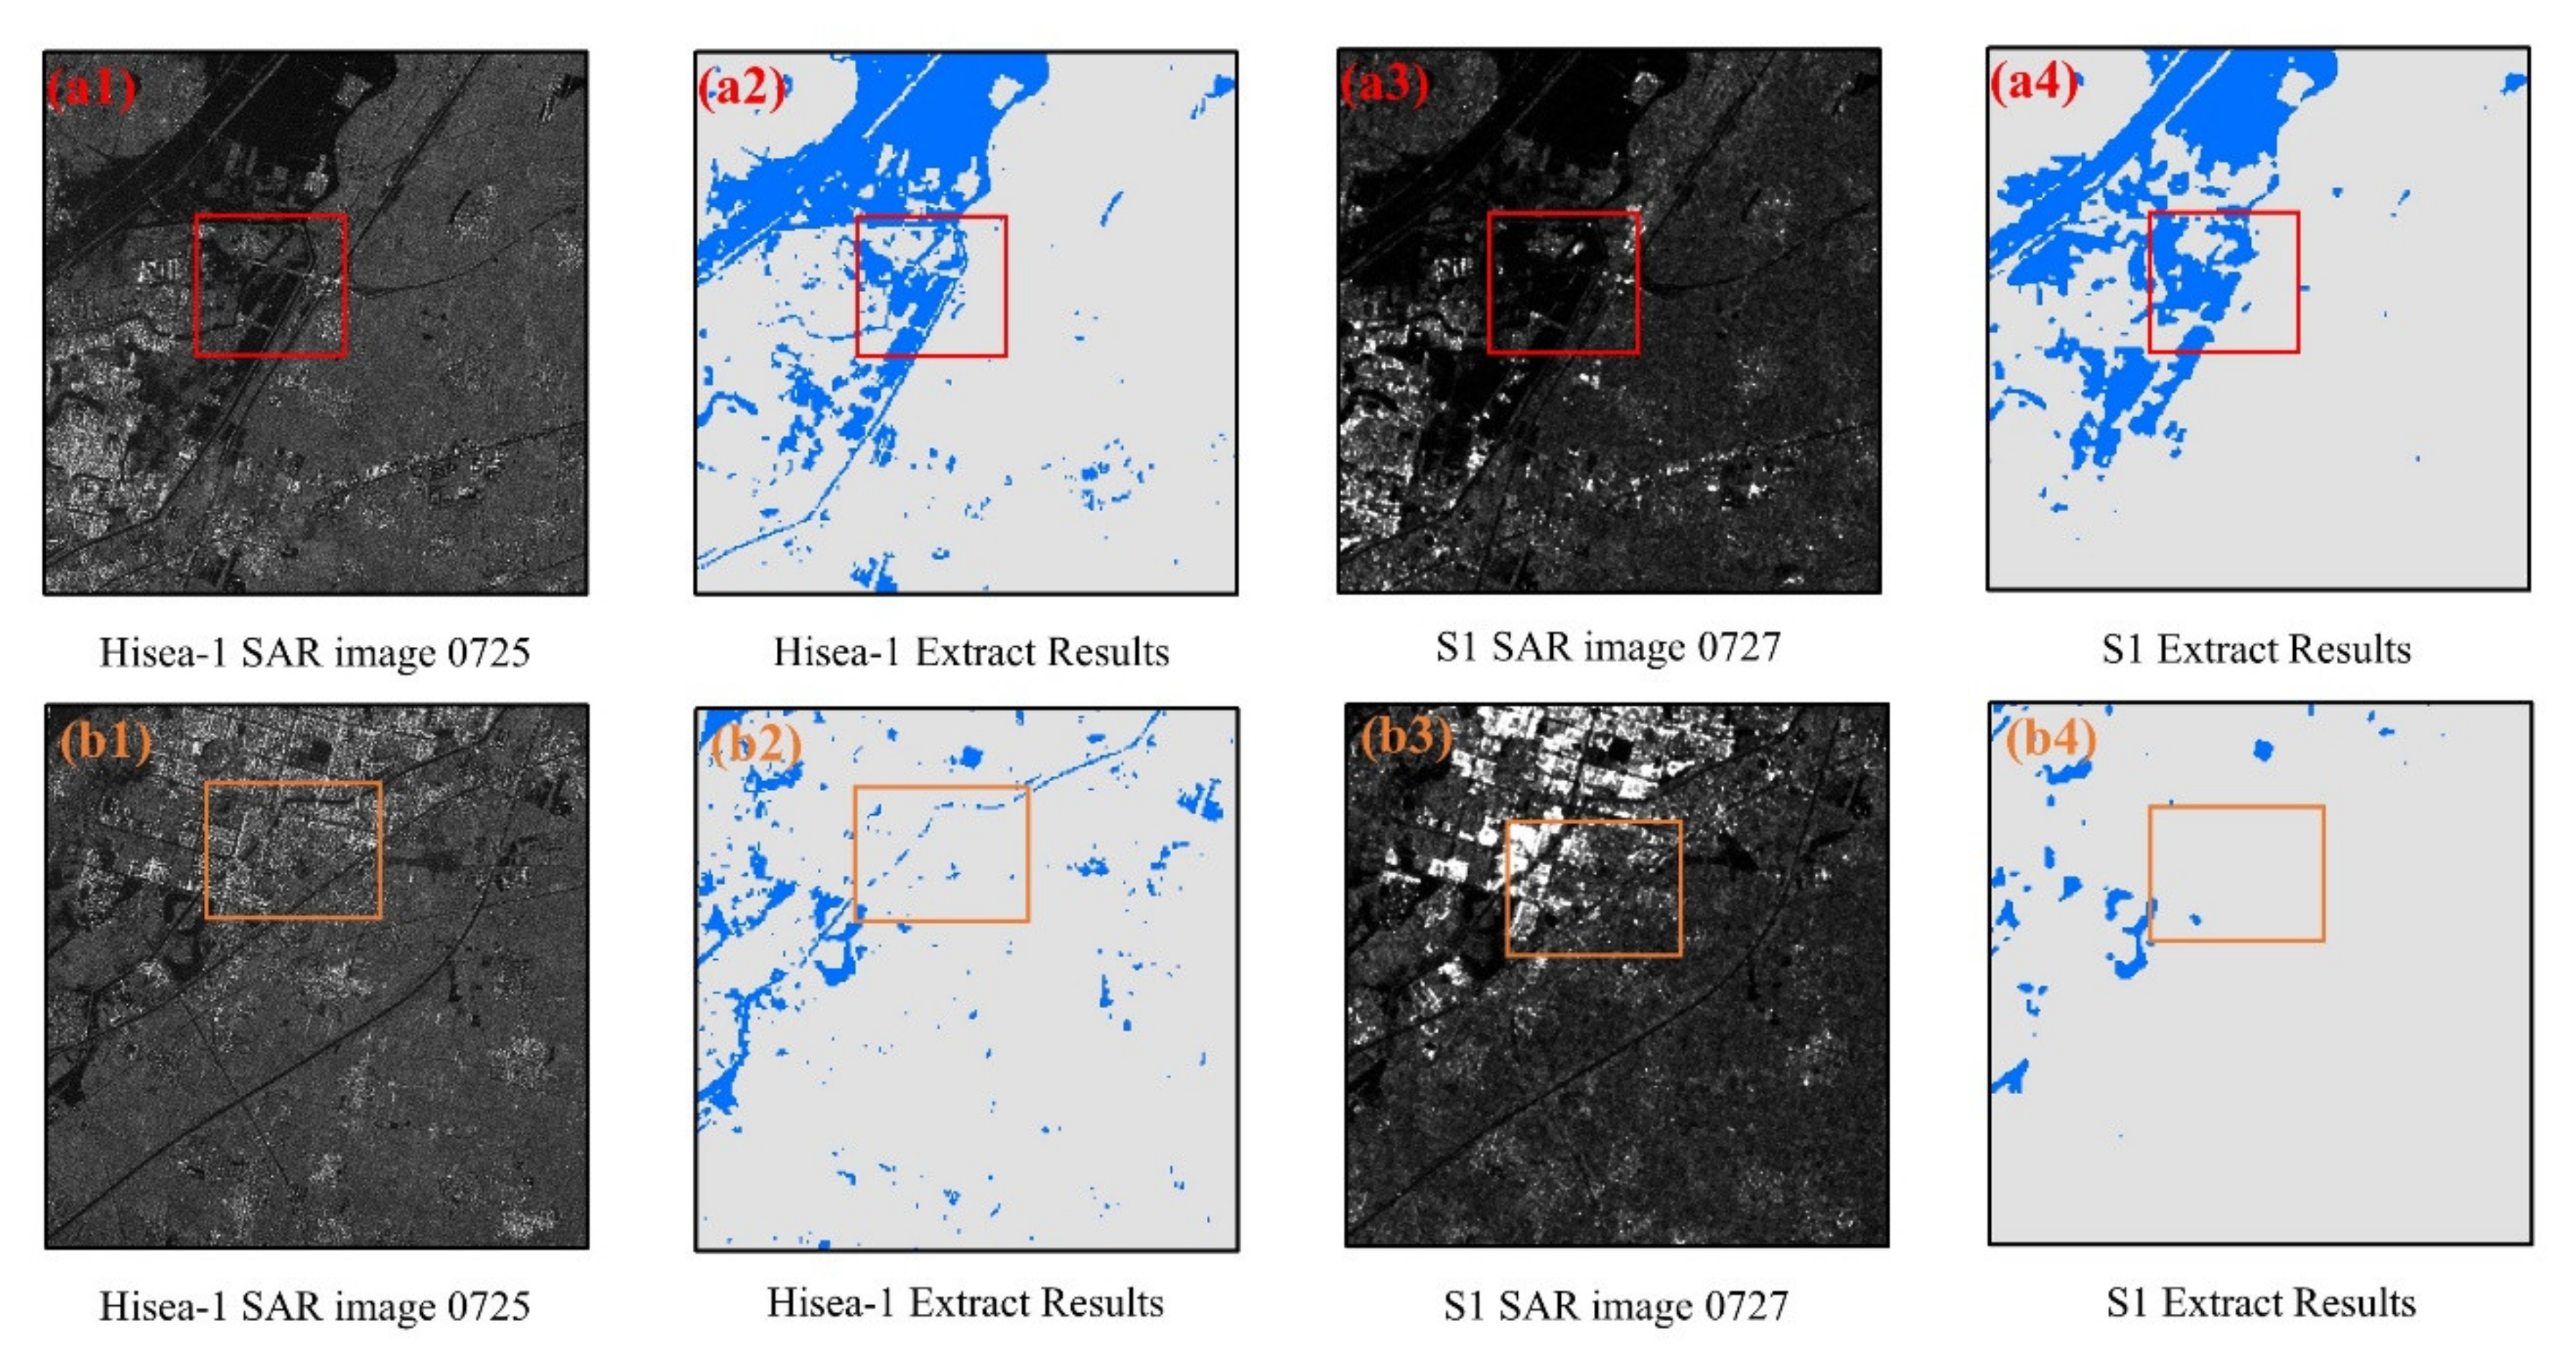
Hisea-1 SAR data have the advantages of a high resolution and cloud penetration and are independent of time and extreme weather; thus, these data play an irreplaceable role in the flood disaster monitoring process. In this study, the earliest flooding imagery data were acquired by Hisea-1 after the disaster occurred. Although Hisea-1 data unfortunately cannot fully cover the affected area, we still cannot ignore the important role played by these high-resolution SAR images in our disaster monitoring research. As shown in Figure 9, compared to the S2 optical imagery, Hisea-1 can monitor the spatial and temporal dynamics of flooding in real time without interference from meteorological conditions when faced with flooding conditions; compared to S1 SAR imagery, Hisea-1 can identify small rivers, roads, bridges, and flooded areas in cities and can provide an important basis for timely and efficient rescue work. In particular, urban flood monitoring, which is mainly caused by accumulation of large amounts of precipitation in a short period of time, results in a large number of deaths [61]. With the launch of the Hisea-2 satellite on 11 June 2021 and the construction of the satellite constellation, these satellites will largely reduce the revisit times of the collected data for disaster monitoring. Although this is beyond the scope of this study, we believe that Hisea-1 will provide important support for urban flood research and other disaster monitoring work in the future.
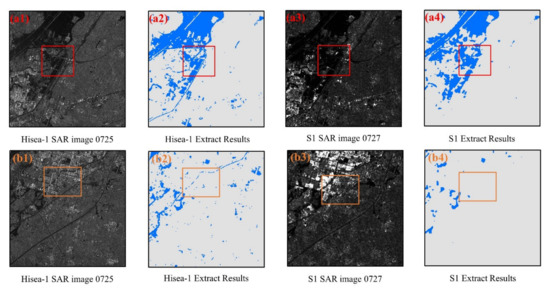
Figure 9.
Comparison of the Hisea-1 image-extracted water area on 25 July 2021 and the S1 SAR image-extracted results on 27 July 2021. The figure was plotted by Arcmap10.2 software. (a1,b1) are the partial areas of Hisea-1 SAR image on 25 July 2021, (a2,b2) are the results of water area extraction based on Hisea-1 image. (a3,b3) are the corresponding areas of (a1,b1) of the Sentinel-1 SAR image on 27 July 2021, (a4,b4) are the results of water body extraction based on the original Sentinel-1 image.
3.4. Result Validation and Uncertainty Analysis
For the water body extraction results, we used ENVI software (version 5.3) to analyze the accuracy of the results by constructing a confusion matrix with the test samples obtained from the visual interpretation of satellite images. We selected two S1 SAR images, one S2 optical image, and one Hisea-1 SAR image for accuracy validation. The overall accuracies were all greater than 90%, and the Kappa coefficients were all greater than 0.9, indicating that the extraction results were reliable. In addition, regarding the statistics of the water body area, the maximum flooded area extracted by Heng et al. was 322.47 km2 on 31 July 2021, which was consistent with our results [58].
Despite the efficiency of our chosen method, some uncertainties remained. For example, the water body thresholds were extracted by the water body index method. For the S1 SAR images and S2 optical images, we used the water body indexes to increase the difference between water bodies and non-water bodies and used the histogram bimodal method to select the appropriate threshold with which to extract water bodies, making the extraction results somewhat subjective. In the future, automatically self-adaptive threshold-selecting methods might be considered to reduce the associated errors. In addition, methods using DEM data to build a three-dimensional (3D) terrain model area and extract the inundation depth could also be considered, which would benefit the subsequent flood damage analysis.
In future studies, long-time-series remote sensing images together with spectral analysis should be considered to accurately identify crop species. After that, by using field experiments or light use efficiency models, the GPP or NPP of damaged crops should be estimated as this would allow the yield losses of crops to be estimated more accurately. In addition, a hydraulic model of flood characteristics and crop production losses could be considered to explore the specific relationship between flood characteristic indicators and crop production losses. Finally, high-resolution SAR and optical remote sensing images should be developed and promoted continuously to monitor urban flooding caused by heavy rainfall in a timely and accurate manner and to respond quickly to protect people’s lives and property to the greatest possible extent.
4. Conclusions
In this study, to monitor the flood induced by the 20 July 2021 extraordinary rainfall event in Henan Province, we constructed a multisource dataset of two S2 optical, nine S1 SAR, and two Hisea-1 SAR remote sensing images. Based on the constructed dataset, we adopted the histogram threshold segmentation method with the MNDWI and SDWI and the k-means clustering method to extract the water body area from each image. Then, by integrating the water body extraction result, the flood dynamic characteristics were obtained, including the flood start time, end time, duration, and area.
We found that flooding began by at least 25 July and did not recede completely until 19 October; overall, the flood consisted of two flood processes and lasted for almost three months. The area of the first flood reached a maximum expanse of 380.2 km2 on 31 July and gradually receded by 1 September. Regarding the second flood process, an area of 215.6 km2 was flooded on 25 September. The spatial distribution map shows that the flooded areas were distributed near the banks of the Wei River and the Communist Canal, and most of these regions were farmland areas.
After combining the NDVI time-series data from GEE with LULC data and statistical data, the area and yield losses of damaged croplands caused by this heavy rainfall event were identified as follows: (1) approximately 263.3 km2 of autumn grains faced extinction in 2021, directly resulting in a loss of approximately 160,000 t of autumn grain production; (2) combined with the per unit area yield of summer grain crops in 2021 (668.1 t/km2), the 2022 winter wheat yield in the study area decreased by at least 18,700 t.
In this study, we used remote sensing images to extract the spatial and temporal variation characteristics of affected crops and combined the results with NDVI time-series data to monitor the growth of crops after the analyzed flooding event. Compared to the traditional statistical methods by which yield losses of affected food crops are quantified, our method was more accurate and effective in determining the type and area of affected crops. In the future, by considering long-time-series remote sensing data, spectral analyses, and multiple vegetation indexes, more accurate affected crop-type identifications and yield loss estimations will be conducted.
Finally, we also tested whether application of Hisea-1 SAR data, due to its high resolution and all-weather capabilities, will play an important role in future disaster monitoring, especially for disasters such as urban flooding. In addition, the large revisit interval of this satellite is still a shortcoming in disaster monitoring applications. With the completion of the satellite constellation, researchers will be able to obtain more detailed information on the dynamic changes associated with disasters in future disaster monitoring work.
Author Contributions
D.L. conceived and designed the study. M.Z. collected and analyzed the datasets. D.L., M.Z. and W.Z. led the paper-writing process, with contributions from all co-authors. W.Z., H.X. and S.W. helped to construct the data plots and improved the discussion. In particular, H.X. contributed the Hisea-1 data for this study. All authors have read and agreed to the published version of the manuscript.
Funding
This study was supported by the National Natural Science Foundation of China (No. 42201516: Multi-scale variations in wetland CH4 fluxes in Qinghai-Tibet Plateau under global warming).
Data Availability Statement
The data in this study are open and can be made available to interested users upon contacting the corresponding author.
Acknowledgments
The authors would like to acknowledge the Institute of Space Integrated Ground Network for the provision of Hisea-1 data.
Conflicts of Interest
The authors declare no conflict of interest.
References
- Janssen, E.; Sriver, R.L.; Wuebbles, D.J.; Kunkel, K.E. Seasonal and regional variations in extreme precipitation event frequency using CMIP5. Geophys. Res. Lett. 2016, 43, 5385–5393. [Google Scholar] [CrossRef]
- Wang, X.L.; Hou, X.Y.; Wang, Y.D. Spatiotemporal variations and regional differences of extreme precipitation events in the Coastal area of China from 1961 to 2014. Atmos. Res. 2017, 197, 94–104. [Google Scholar] [CrossRef]
- Stocker, T.F.; Qin, D.; Plattner, G.-K.; Tignor, M.M.B.; Allen, S.K.; Boschung, J.; Nauels, A.; Xia, Y.; Bex, V.; Midgley, P.M. (Eds.) IPCC, 2013: Climate Change 2013: The Physical Science Basis. Contribution of Working Group I to the Fifth Assessment Report of the Intergovernmental Panel on Climate Change; Cambridge University Press: Cambridge, UK; New York, NY, USA, 2014. [Google Scholar]
- Qin, D.; Thomas, S. Highlights of the IPCC Working Group I Fifth Assessment Report. Progress. Inquisitiones Mutat. Clim. 2014, 10, 1–6. [Google Scholar]
- Re, S. Flood—An Underestimated Risk: Inspect, Inform, Insure; Available via Swiss Re; Swiss Reinsurance Company Ltd.: Zurich, Switzerland, 2018. [Google Scholar]
- Yuehua, Z.; Tao, P.; Ruiqin, S. Research progress on risk assessment of heavy rainfall and flood disasters in China. Torrential Rain Disasters 2019, 38, 494–501. [Google Scholar]
- Compilation Group of China Flood and Drought Disaster Prevention Bulletin. Summary of China Flood and Drought Disaster Prevention Bulletin 2020. China Flood Drought Manag. 2021, 31, 26–32. (In Chinese) [Google Scholar] [CrossRef]
- Notti, D.; Giordan, D.; Caló, F.; Pepe, A.; Zucca, F.; Galve, J.P. Potential and Limitations of Open Satellite Data for Flood Mapping. Remote Sens. 2018, 10, 1673. [Google Scholar] [CrossRef]
- Rao, P.; Jiang, W.; Hou, Y.; Chen, Z.; Jia, K. Dynamic Change Analysis of Surface Water in the Yangtze River Basin Based on MODIS Products. Remote Sens. 2018, 10, 1025. [Google Scholar] [CrossRef]
- Olthof, I.; Tolszczuk-Leclerc, S. Comparing Landsat and RADARSAT for Current and Historical Dynamic Flood Mapping. Remote Sens. 2018, 10, 780. [Google Scholar] [CrossRef]
- Zheng, S.; Fu, Y.; Sun, Y.; Zhang, C.; Wang, Y.; Lichtfouse, E. High resolution mapping of nighttime light and air pollutants during the COVID-19 lockdown in Wuhan. Environ. Chem. Lett. 2021, 19, 3477–3485. [Google Scholar] [CrossRef]
- Zheng, S.; Schlink, U.; Ho, K.F.; Singh, R.P.; Pozzer, A.J.G. Spatial Distribution of PM2. 5-Related Premature Mortality in China. GeoHealth 2021, 5, e2021GH000532. [Google Scholar] [CrossRef]
- Di Vittorio, C.A.; Georgakakos, A.P. Land cover classification and wetland inundation mapping using MODIS. Remote Sens. Environ. 2018, 204, 1–17. [Google Scholar] [CrossRef]
- Yeo, S.; Lafon, V.; Alard, D.; Curti, C.; Dehouck, A.; Benot, M.-L. Classification and mapping of saltmarsh vegetation combining multispectral images with field data. Estuar. Coast. Shelf Sci. 2020, 236, 106643. [Google Scholar] [CrossRef]
- Coulter, L.L.; Stow, D.A.; Tsai, Y.-H.; Ibanez, N.; Shih, H.-C.; Kerr, A.; Benza, M.; Weeks, J.R.; Mensah, F. Classification and assessment of land cover and land use change in southern Ghana using dense stacks of Landsat 7 ETM + imagery. Remote Sens. Environ. 2016, 184, 396–409. [Google Scholar] [CrossRef]
- Dai, Y.; Feng, L.; Hou, X.; Tang, J. An automatic classification algorithm for submerged aquatic vegetation in shallow lakes using Landsat imagery. Remote Sens. Environ. 2021, 260, 112459. [Google Scholar] [CrossRef]
- Zhang, H.K.; Roy, D.P. Using the 500 m MODIS land cover product to derive a consistent continental scale 30 m Landsat land cover classification. Remote Sens. Environ. 2017, 197, 15–34. [Google Scholar] [CrossRef]
- Amitrano, D.; di Martino, G.; Iodice, A.; Riccio, D.; Ruello, G. Unsupervised Rapid Flood Mapping Using Sentinel-1 GRD SAR Images. IEEE Trans. Geosci. Remote Sens. 2018, 56, 3290–3299. [Google Scholar] [CrossRef]
- Jiang, X.; Liang, S.; He, X.; Ziegler, A.D.; Lin, P.; Pan, M.; Wang, D.; Zou, J.; Hao, D.; Mao, G.; et al. Rapid and large-scale mapping of flood inundation via integrating spaceborne synthetic aperture radar imagery with unsupervised deep learning. ISPRS J. Photogramm. Remote Sens. 2021, 178, 36–50. [Google Scholar] [CrossRef]
- Ulaby, F.; Dobson, M.C.; Álvarez-Pérez, J.L. Handbook of Radar Scattering Statistics for Terrain; Artech House: London, UK, 2019. [Google Scholar]
- Lillesand, T.; Kiefer, R.W.; Chipman, J. Remote Sensing and Image Interpretation; John Wiley & Sons: Hoboken, NJ, USA, 2015. [Google Scholar]
- Martinis, S.; Twele, A.; Voigt, S. Unsupervised Extraction of Flood-Induced Backscatter Changes in SAR Data Using Markov Image Modeling on Irregular Graphs. Trans. Geosci. Remote Sens. 2011, 49, 251–263. [Google Scholar] [CrossRef]
- Pulvirenti, L.; Chini, M.; Pierdicca, N.; Guerriero, L.; Ferrazzoli, P. Flood monitoring using multi-temporal COSMO-SkyMed data: Image segmentation and signature interpretation. Remote Sens. Environ. 2011, 115, 990–1002. [Google Scholar] [CrossRef]
- Giustarini, L.; Hostache, R.; Matgen, P.; Schumann, G.J.P.; Bates, P.D.; Mason, D.C. A Change Detection Approach to Flood Mapping in Urban Areas Using TerraSAR-X. Ieee Trans. Geosci. Remote Sens. 2013, 51, 2417–2430. [Google Scholar] [CrossRef]
- Voormansik, K.; Praks, J.; Antropov, O.; Jagomagi, J.; Zalite, K. Flood Mapping with TerraSAR-X in Forested Regions in Estonia. IEEE J. Sel. Top. Appl. Earth Obs. Remote Sens. 2014, 7, 562–577. [Google Scholar] [CrossRef]
- Chini, M.; Pelich, R.; Pulvirenti, L.; Pierdicca, N.; Hostache, R.; Matgen, P. Sentinel-1 InSAR Coherence to Detect Floodwater in Urban Areas: Houston and Hurricane Harvey as A Test Case. Remote Sens. 2019, 11, 107. [Google Scholar] [CrossRef]
- Covello, F.; Battazza, F.; Coletta, A.; Lopinto, E.; Fiorentino, C.; Pietranera, L.; Valentini, G.; Zoffoli, S. COSMO-SkyMed an existing opportunity for observing the Earth. J. Geodyn. 2010, 49, 171–180. [Google Scholar] [CrossRef]
- Werninghaus, R. TerraSAR-X mission. In Proceedings of the SAR Image Analysis, Modeling, and Techniques VI, Bellingham, WA, USA, 12 February 2004; pp. 9–16. [Google Scholar]
- Xue, S.; Geng, X.; Meng, L.; Xie, T.; Huang, L.; Yan, X.-H. HISEA-1: The First C-Band SAR Miniaturized Satellite for Ocean and Coastal Observation. Remote Sens. 2021, 13, 2076. [Google Scholar] [CrossRef]
- China’s “Hisea-1” satellite to help Tonga disaster relief. Sci. Technol. Dly. 2022, 51, 862–872. (In Chinese)
- Lang, Y.; Jiang, Z.; Wu, X. Investigating the Linkage between Extreme Rainstorms and Concurrent Synoptic Features: A Case Study in Henan, Central China. Water 2022, 14, 1065. [Google Scholar] [CrossRef]
- Zhang, S.; Chen, Y.; Luo, Y.; Liu, B.; Ren, G.; Zhou, T.; Martinez-Villalobos, C.; Chang, M. Revealing the Circulation Pattern Most Conducive to Precipitation Extremes in Henan Province of North China. Geophys. Res. Lett. 2022, 49, e2022GL098034. [Google Scholar] [CrossRef]
- China State Council Disaster Investigation Team. Investigation Report on the ‘720’ Exceptionally Heavy Rainstorm Disaster in Zhengzhou, Henan Province. 2022. Available online: http://www.zyhc.gov.cn/zwgk/zfxxgkml/zdlyxx/zdmsxx_5866586/aqsc/202202/P020220222563841407337.pdf (accessed on 21 January 2022). (In Chinese)
- Ding, Y. On the study of the unprecedented heavy rainfall in Henan Province during 4–8 August 1975: Review and assessment. Acta Meteorol. Sin. 2015, 73, 411–424. [Google Scholar]
- The State Council of the People’s Republic of China. 2019. Available online: https://baike.baidu.com/reference/132980/2e26FfNve7XDj_XhT6XOKmzIC1Egp_G5Qs7phU6bm70S3wkdVDTRqmx0IV8qzt7xCzND1IPJ5fj5H3S7DJBn6MWLyKT7LhVhuuLLDqm1xBtYcJg (accessed on 22 April 2019). (In Chinese).
- Henan Province Bureau of Statistics. 2022. Available online: https://tjj.henan.gov.cn/2022/03-10/2412169.html (accessed on 12 March 2022). (In Chinese)
- Tian, W.; Cao, X.; Peng, K.J.S. Technology for Position Correction of Satellite Precipitation and Contributions to Error Reduction—A Case of the ‘720’ Rainstorm in Henan, China. Sensors 2022, 22, 5583. [Google Scholar] [CrossRef]
- Shi, W.; Li, X.; Zeng, M.; Zhang, B.; Wang, H.; Zhu, K.; Zhuge, X. Multi-model comparison and high-resolution regional model forecast analysis for the ‘7· 20’Zhengzhou severe heavy rain. Trans. Atmos. Sci. 2021, 44, 688–702. [Google Scholar]
- Li, W.; Ma, H.; Fu, R.; Han, H.; Wang, X. Development and Maintenance Mechanisms of a Long-Lived Mesoscale Vortex Which Governed the Earlier Stage of the “21.7” Henan Torrential Rainfall Event. Front. Earth Sci. 2022, 10, 944. [Google Scholar] [CrossRef]
- Xu, L.; Cheng, W.; Deng, Z.; Liu, J.; Wang, B.; Lu, B.; Wang, S.; Dong, L. Assimilation of the FY-4A AGRI Clear-Sky Radiance Data in a Regional Numerical Model and Its Impact on the Forecast of the “21· 7” Henan Extremely Persistent Heavy Rainfall. Adv. Atmos. Sci. 2022, 1–17. [Google Scholar] [CrossRef]
- Zeng, L.; Li, L.; Wan, L. Rapid extraction of flood inundation extent based on Sentinel-1 satellite SAR data. Geoinf. World 2015, 22, 100–103+107. (In Chinese) [Google Scholar]
- Wu, W.H.; Wang, L.H.; Ma, Z. Flood extraction and monitoring based on Sentinel-1B SAR data. Mapp. Spat. Geogr. Inf. 2019, 42, 110–111. (In Chinese) [Google Scholar]
- Jiang, Z.; Huete, A.R.; Chen, J.; Chen, Y.; Li, J.; Yan, G.; Zhang, X. Analysis of NDVI and scaled difference vegetation index retrievals of vegetation fraction. Remote Sens. Environ. 2006, 101, 366–378. [Google Scholar] [CrossRef]
- Dong, J.; Fu, Y.; Wang, J.; Tian, H.; Fu, S.; Niu, Z.; Han, W.; Zheng, Y.; Huang, J.; Yuan, W.D. Early-season mapping of winter wheat in China based on Landsat and Sentinel images. Earth Syst. Sci. Data 2020, 12, 3081–3095. [Google Scholar] [CrossRef]
- Haddad, O.; Abdelfattah, R.; Ajili, H. Extracting radar shadow from SAR images. In Proceedings of the 2012 IEEE International Geoscience and Remote Sensing Symposium, Munich, Germany, 22–27 July 2012; pp. 2101–2104. [Google Scholar]
- Demek, J.; Embleton, C. Guide to Medium-Scale. Geomorphological Mapping; IGU Commission on Geomorphological Survey and Mapping; E. Schweizerbart’sche Verlagsbuchhandlung: Stuttgart, Germany, 1978. [Google Scholar]
- Jia, S.C.; Xue, D.J.; Li, C.R.; Zheng, J.; Li, W.Q. Study of water body information extraction method based on Sentinel-1 data. Yangtze River 2019, 50, 213–217. (In Chinese) [Google Scholar] [CrossRef]
- Xu, H. A Study on Information Extraction of Water Body with the Modified Normalized Difference Water Index (MNDWI). J. Remote Sens. 2005, 9, 595. [Google Scholar]
- Gong, Y.; Yang, Y.Q. Fast extraction and change analysis of flood inundation extent based on Sentinel-1 SAR images. In Proceedings of the 2020 Annual Academic Conference of Jiangsu Mapping and Geographic Information Society, Online, 30–31 October 2020; pp. 29–32. (In Chinese). [Google Scholar]
- Hartigan, J.A.; Wong, M.A. Algorithm AS 136: A k-means clustering algorithm. J. R. Stat. Soc. Ser. C 1979, 28, 100–108. [Google Scholar] [CrossRef]
- Piloyan, A.; Konečný, M. Semi-automated classification of landform elements in Armenia based on SRTM DEM using k-means unsupervised classification. Quaest. Geogr. 2017, 36, 93–103. [Google Scholar] [CrossRef]
- Cao, S. Directly focus on the site of the Hebi section of the Weihe River breach. China Youth 2021, 15, 1. (In Chinese) [Google Scholar]
- Zheng, T.; Zhang, X.; Yin, G.; Wang, L.; Han, Y.; Chen, L.; Huang, F.; Tang, J.; Xia, X.; He, Z. Genetic gains in grain yield, net photosynthesis and stomatal conductance achieved in Henan Province of China between 1981 and 2008. Field Crops Res. 2011, 122, 225–233. [Google Scholar] [CrossRef]
- Henan Province Statistical Yearbook 2021. 2021. Available online: https://oss.henan.gov.cn/sbgt-wztipt/attachment/hntjj/hntj/lib/tjnj/2021nj/zk/indexch.htm (accessed on 16 December 2021). (In Chinese)
- He, P.; Li, S.; Jin, J.; Wang, H.; Li, C.; Wang, Y.; Cui, R. Performance of an optimized nutrient management system for double-cropped wheat-maize rotations in North-central China. Agron. J. 2009, 101, 1489–1496. [Google Scholar] [CrossRef]
- Yang, X.; Zhang, X.; Jiang, D. Extraction of multi-crop planting areas from MODIS data. Resour. Sci. 2004, 26, 17–22. [Google Scholar]
- Carlson, T.N.; Ripley, D.A. On the relation between NDVI, fractional vegetation cover, and leaf area index. Remote Sens. Environ. 1997, 62, 241–252. [Google Scholar] [CrossRef]
- Heng, Y. Automatic Extraction and Analysis of Flood Area in Henan Province Based on Multi-Source Remote Sensing Satellite. Sci. Technol. Innov. Her. 2021, 18, 115–119. (In Chinese) [Google Scholar]
- Zhang, S.; Ma, Z.; Li, Z.; Zhang, P.; Liu, Q.; Nan, Y.; Zhang, J.; Hu, S.; Feng, Y.; Zhao, H. Using CYGNSS Data to Map Flood Inundation during the 2021 Extreme Precipitation in Henan Province, China. Remote Sens. 2021, 13, 5181. [Google Scholar] [CrossRef]
- Wang, J.X.; Qiu, S.K.; Wang, Z.; Wang, C.; Du, J. Flood Disaster Monitoring Based on Water Body Extraction of GF-3 Image in Zhengzhou. Henan Sci. 2021, 2, 86–92. [Google Scholar]
- Tingsanchali, T. Urban flood disaster management. Procedia Eng. 2012, 32, 25–37. [Google Scholar] [CrossRef]
Publisher’s Note: MDPI stays neutral with regard to jurisdictional claims in published maps and institutional affiliations. |
© 2022 by the authors. Licensee MDPI, Basel, Switzerland. This article is an open access article distributed under the terms and conditions of the Creative Commons Attribution (CC BY) license (https://creativecommons.org/licenses/by/4.0/).

