Article

Cryogenic Refocusing of an Ultrawide FOV Long-Wave Infrared Imaging Spectrometer in a Geostationary Orbit

1
Changchun Institute of Optics, Fine Mechanics and Physics, Chinese Academy of Sciences, Changchun 130033, China
2
University of Chinese Academy of Sciences, Beijing 100049, China
*
Author to whom correspondence should be addressed.
Remote Sens. 2022, 14(22), 5799; https://doi.org/10.3390/rs14225799
Submission received: 25 August 2022 / Revised: 3 November 2022 / Accepted: 14 November 2022 / Published: 17 November 2022

Abstract

:
Imaging spectrometers in a geostationary orbit have unique advantages for various applications ranging from atmospheric to ocean remote sensing. To increase remote sensing range, we developed an ultrawide FOV LWIR imaging spectrometer. We compared several spectrometers and picked the “Offner + center single prism” form, which can simplify the system structure and increase cryogenic adaptability, making it ideal for ultrawide FOV designs. However, to reduce background radiation in LWIR bands, the imaging spectrometer was cooled to 123 K, causing the image plane to deviate from the focal plane. Therefore, we propose a cryogenic refocusing method based on an inclined slit in this paper that employs the full width half maximum (FWHM) of the spectral response function (SRF) as the refocusing evaluation function. By analyzing the effect of deviation on FWHM, the refocusing principle is well explained. The slit is tilted to find the minimal function value, so the deviation amount is calculated using differences in FOVs corresponding to the minimum FWHM at different temperatures. Experiments show that the FWHM is nearly 2.1 pixels after refocusing and that the actual spectral resolution is within 120 nm after spectral calibration. The method reduced the design time and provided references for optical systems experiencing refocusing issues in remote sensing imaging.

Graphical Abstract

1. Introduction

The imaging spectrometer in a geostationary orbit has been found to have many advantages, including its high temporal resolution, wide monitoring range, strong continuity, and short revisit period [1]. Thus, the problem of remote sensing applications that require all-day, wide-range, full-spectrum, continuous monitoring, identification, and classification can be solved through high-resolution spectral detection in a geostationary orbit, which will meet the needs of applications in resources, forestry, environment, ocean, agriculture, and disaster mitigation [2]. Therefore, as an essential tool for space-to-ground observation, the research and development of imaging spectrometers in geostationary orbit are of great significance to the field of spectral remote sensing.
The imaging spectrometer on a geostationary orbit can provide whole spectral region images in visible and near-infrared (VNIR, 0.3~1.0 μm), short-wave infrared (SWIR, 1.0~2.5 μm), mid-wave infrared (MWIR, 2.5~5 μm) and long-wave infrared (LWIR, 8~12.5 μm) bands. Among these bands, the LWIR imaging spectrometer has apparent advantages in target recognition and classification because the long-wave spectrum has the qualities of passively gathering radiation signals, all-weather operation, good concealment, and strong anti-interference ability [3]. Thus, it has a wide range of potential applications in several industries, such as national production, military security, and scientific research. Increasing the spatial resolution of the LWIR imaging spectrometer helps with target identification. However, the high spatial resolution requires a large array detector, which in turn requires an imaging spectrometer with an ultrawide field of view (FOV). Because the FOV coverage width is larger, the corresponding swath width of the instrument is larger. Therefore, the return period of the instrument is shorter, and the time resolution is higher, which can make the data and research methods available for many applications are more and more.
The common method to increase the slit FOV is to splice together multiple separate spectral imaging modules [4]. This method has a strong ability to expand the FOV. The telescope’s wide FOV is split into a series of narrow FOVs, each of which corresponds to a separate spectral imaging module and has been organized in the appropriate way. However, the FOV stitching with several separate spectral imaging modules makes the system oversized, which cannot match the development demands of miniaturization and lightweight spectral imaging systems. It also raises the burden of cryogenic cooling to suppress background radiation for LWIR imaging spectrometers. A multi-slit stitching approach is provided, considering the need for an ultrawide FOV and the limitations of current infrared detectors. By splicing multiple flat slits in an orderly manner, only a single spectral imaging module is needed to provide an ultrawide slit FOV. Designing and demonstrating an ultrawide FOV LWIR imaging spectrometer that meets the splicing condition is one of the key issues to be solved in this paper.
Another problem to be solved is correcting the deviation of the image plane from the focal plane of the imaging spectrometer, which can provide an experimental guarantee for subsequent work such as spectrometer calibration. The imaging spectrometer on a geostationary orbit enables whole spectra detection, whereas it is affected by serious effects of the background radiation in the infrared band, especially LWIR [5]. The background radiation originates from the outside of the optical system, but more importantly, from the internal optical elements and mechanical structures [6]. Cooling the spectrometer has been found to be an excellent choice to reduce the background radiation from the source [7], which requires the spectrometer to operate at cryogenic temperatures while still being fully functional at ambient temperatures. Due to temperature changes, the spectrometer’s image plane will deviate from the focal plane [8]. Thus, the refocusing of the spectrometer determines whether cryogenic cooling can be adopted to suppress the background radiation.
Hackwell et al. (1996) developed a MWIR-LWIR imaging spectrometer, SEBASS [9], which was cooled by liquid helium to 10 K. This imaging spectrometer is capable of adjusting the position of the detector through 2~3 tests to make the instrument focus. Taccola et al. (2008) proposed the NIRSpec [10,11], one of the science instruments installed in the JWST, which was passively cooled to 30–35 K using a five-layer sunshield and special radiator panels. It contained a cryogenic refocusing mechanism (RMA) to accommodate the change of focus. Yuan et al. (2016) built an airborne thermal infrared imaging spectrometer [12] that was generally cooled to 100 K. This spectrometer used a double-pass reflective triplet with a flat grating in an all-reflective optical form to promote the temperature adaptability, and the same material, aluminum alloy, was selected for the mirrors, the mirror brackets, and the frame. In addition, screw threads were designed for a continual focus adjustment to the slit, and a stainless steel corrugated tube was designed for a flexible focus adjustment to the FPA. In 2016, Zhang designed the LWIR spectrometer based on a blazed convex grating [13], with all components made of materials with low thermal expansion coefficients, except for the concentric correction lens, which was found to have a high thermal expansion coefficient. They worked jointly to reduce the effects arising from thermal and stress deformation. The above methods of presetting the focal surface, matching materials, adding compensation elements, and adding focusing devices are all capable of achieving refocusing. However, the disadvantages of these methods cannot be ignored. For instance, the pre-set focal surface method usually requires multiple tests to identify the accurate position of the focal plane at the cryogenic temperature, and the cooling and warming processes are extremely slow to prevent the optical elements from being destroyed. In the development of spectrometers, the method of matching materials suffers from less material selectivity. Likewise, the use of compensation elements and focusing devices increases the complexity of the instrument while leading to a greater cooling burden.
In this paper, a refocusing method based on the inclined slit is proposed. Part of the spectrometer’s FOV could still image clearly over a certain temperature range based on the inclined slit, and the optical performance of the spectrometer at different temperatures conforming to a focusing image could be measured through a single cryogenic experiment. Meanwhile, we take the LWIR imaging spectrometer on a geostationary orbit whole spectrum imager as an example, demonstrating the analytical design and development of the ultrawide FOV imaging spectrometer. Furthermore, the cryogenic refocusing and spectral performance test experiments are built based on these basic principles and our optical design. The proposed cryogenic refocusing imaging spectrometer with an ultrawide FOV provides a new possibility for remote sensing in a geostationary orbit.

2. Materials and Methods

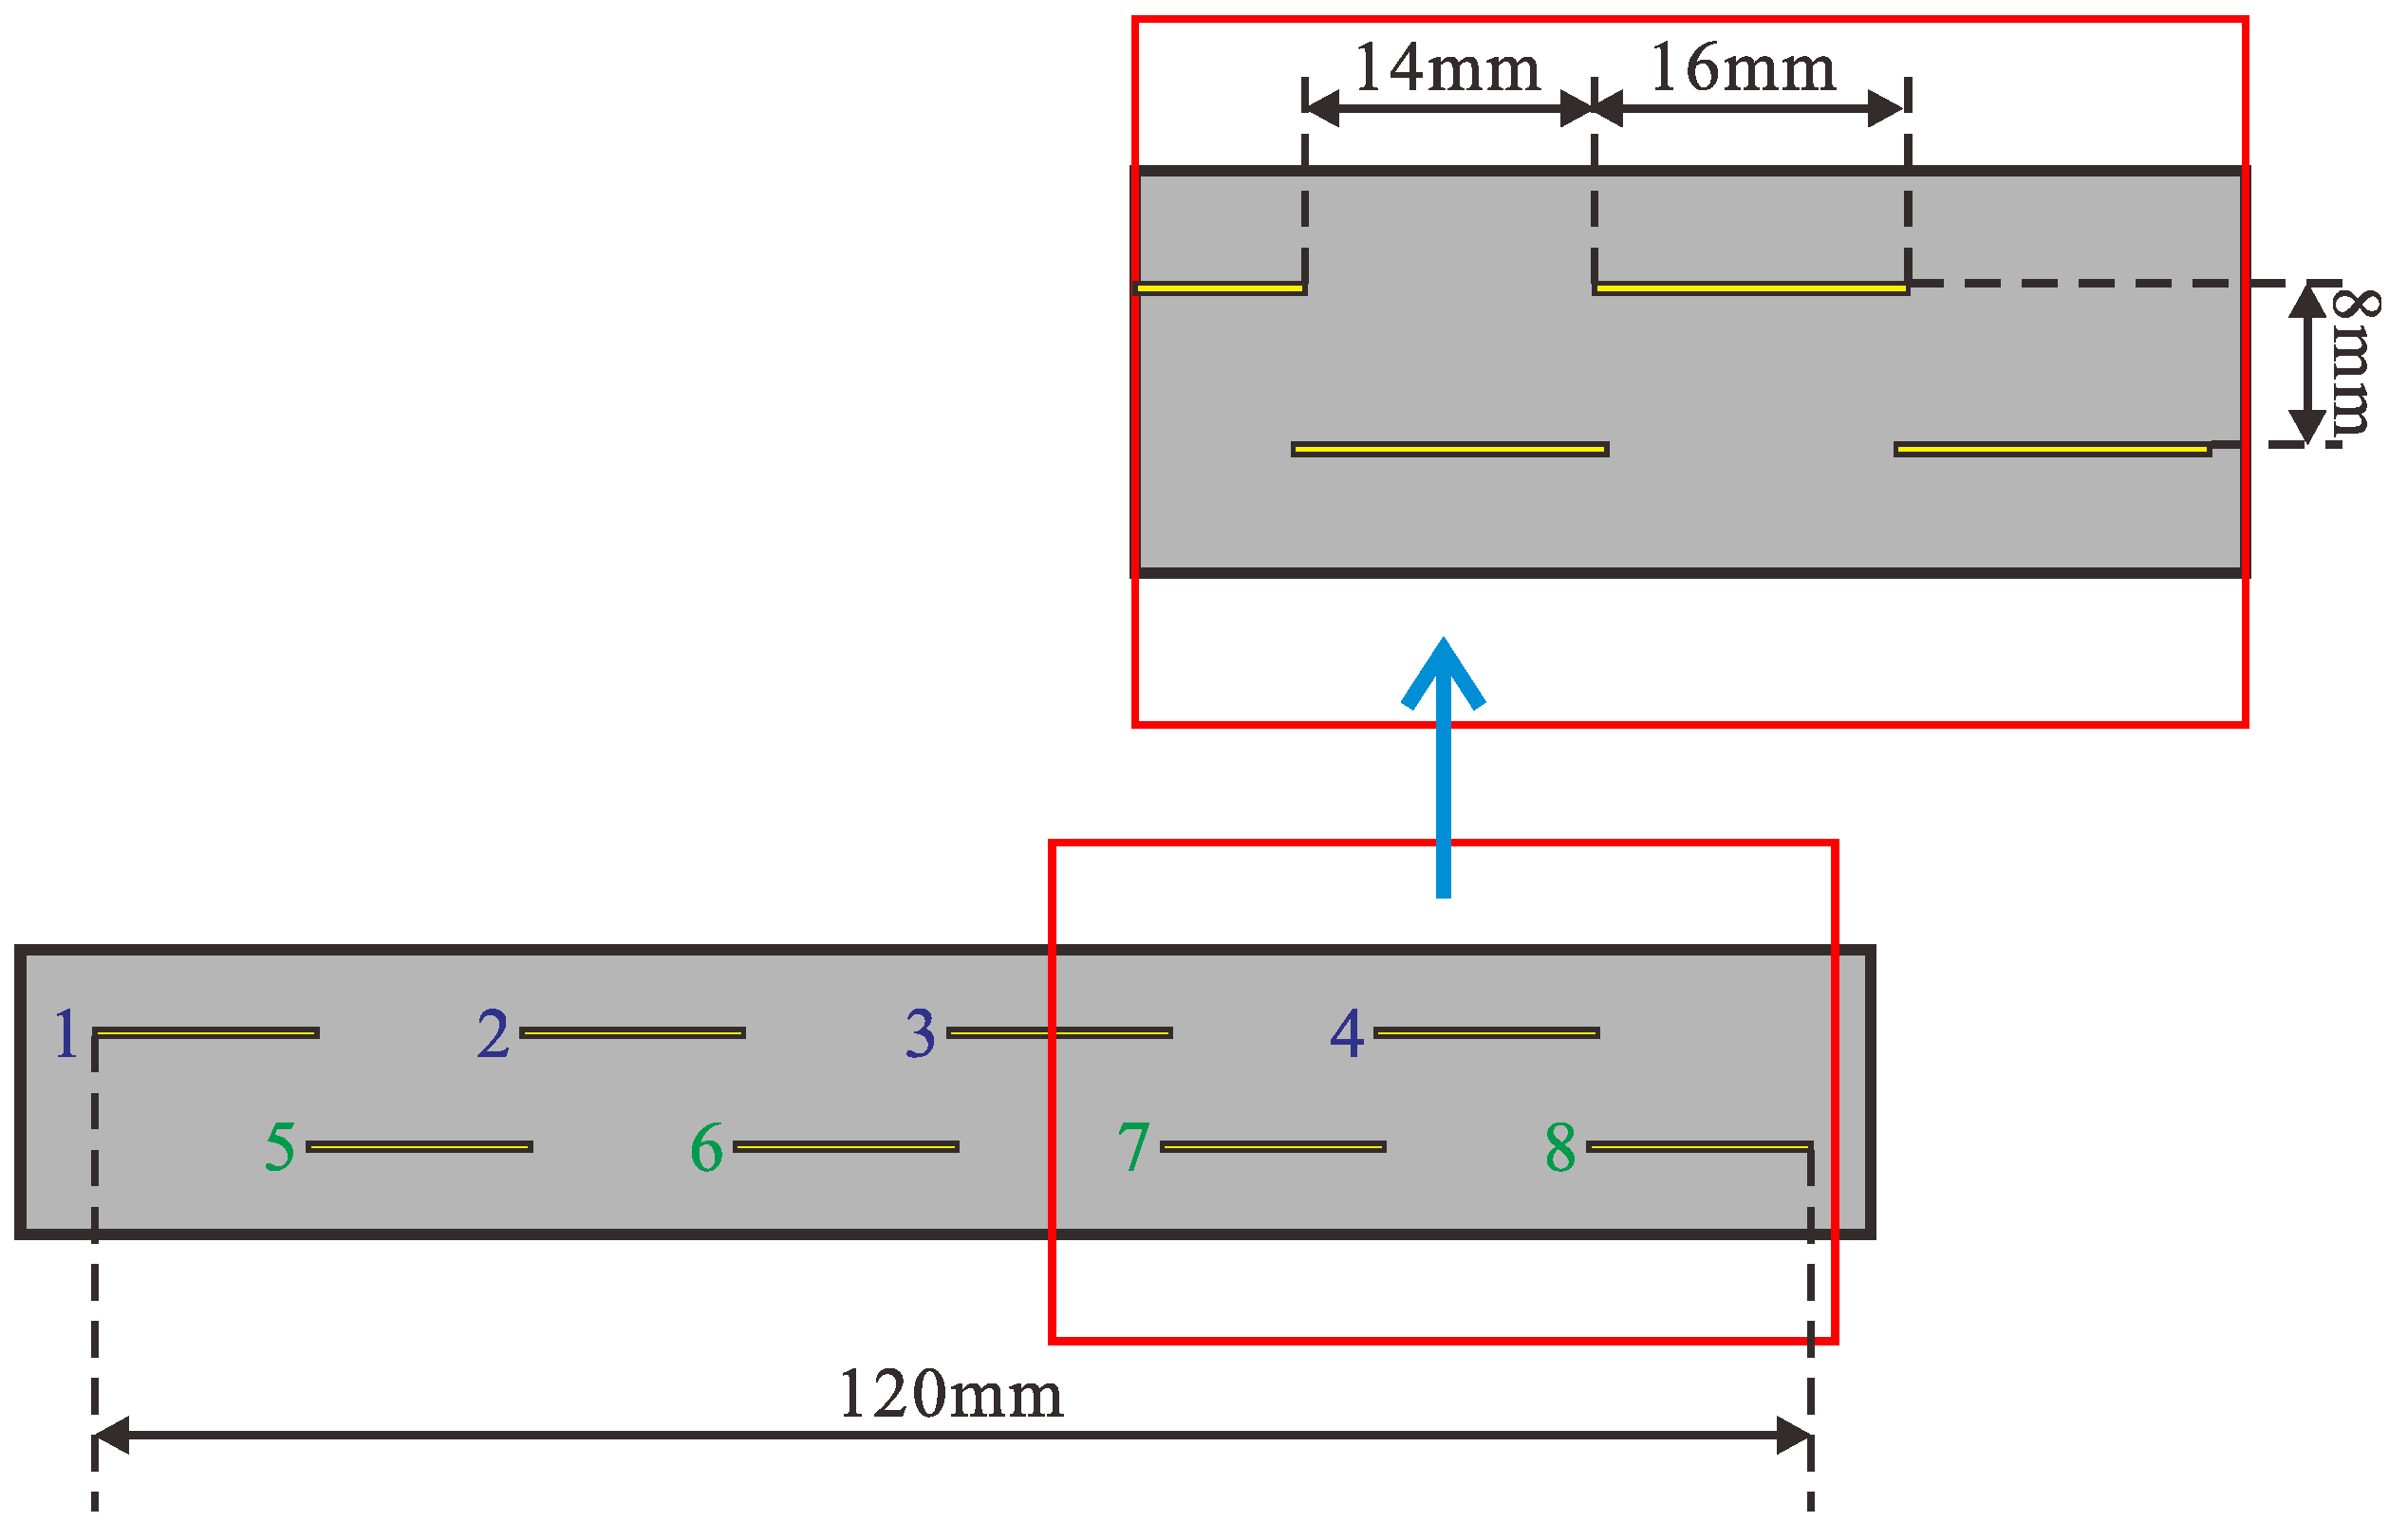
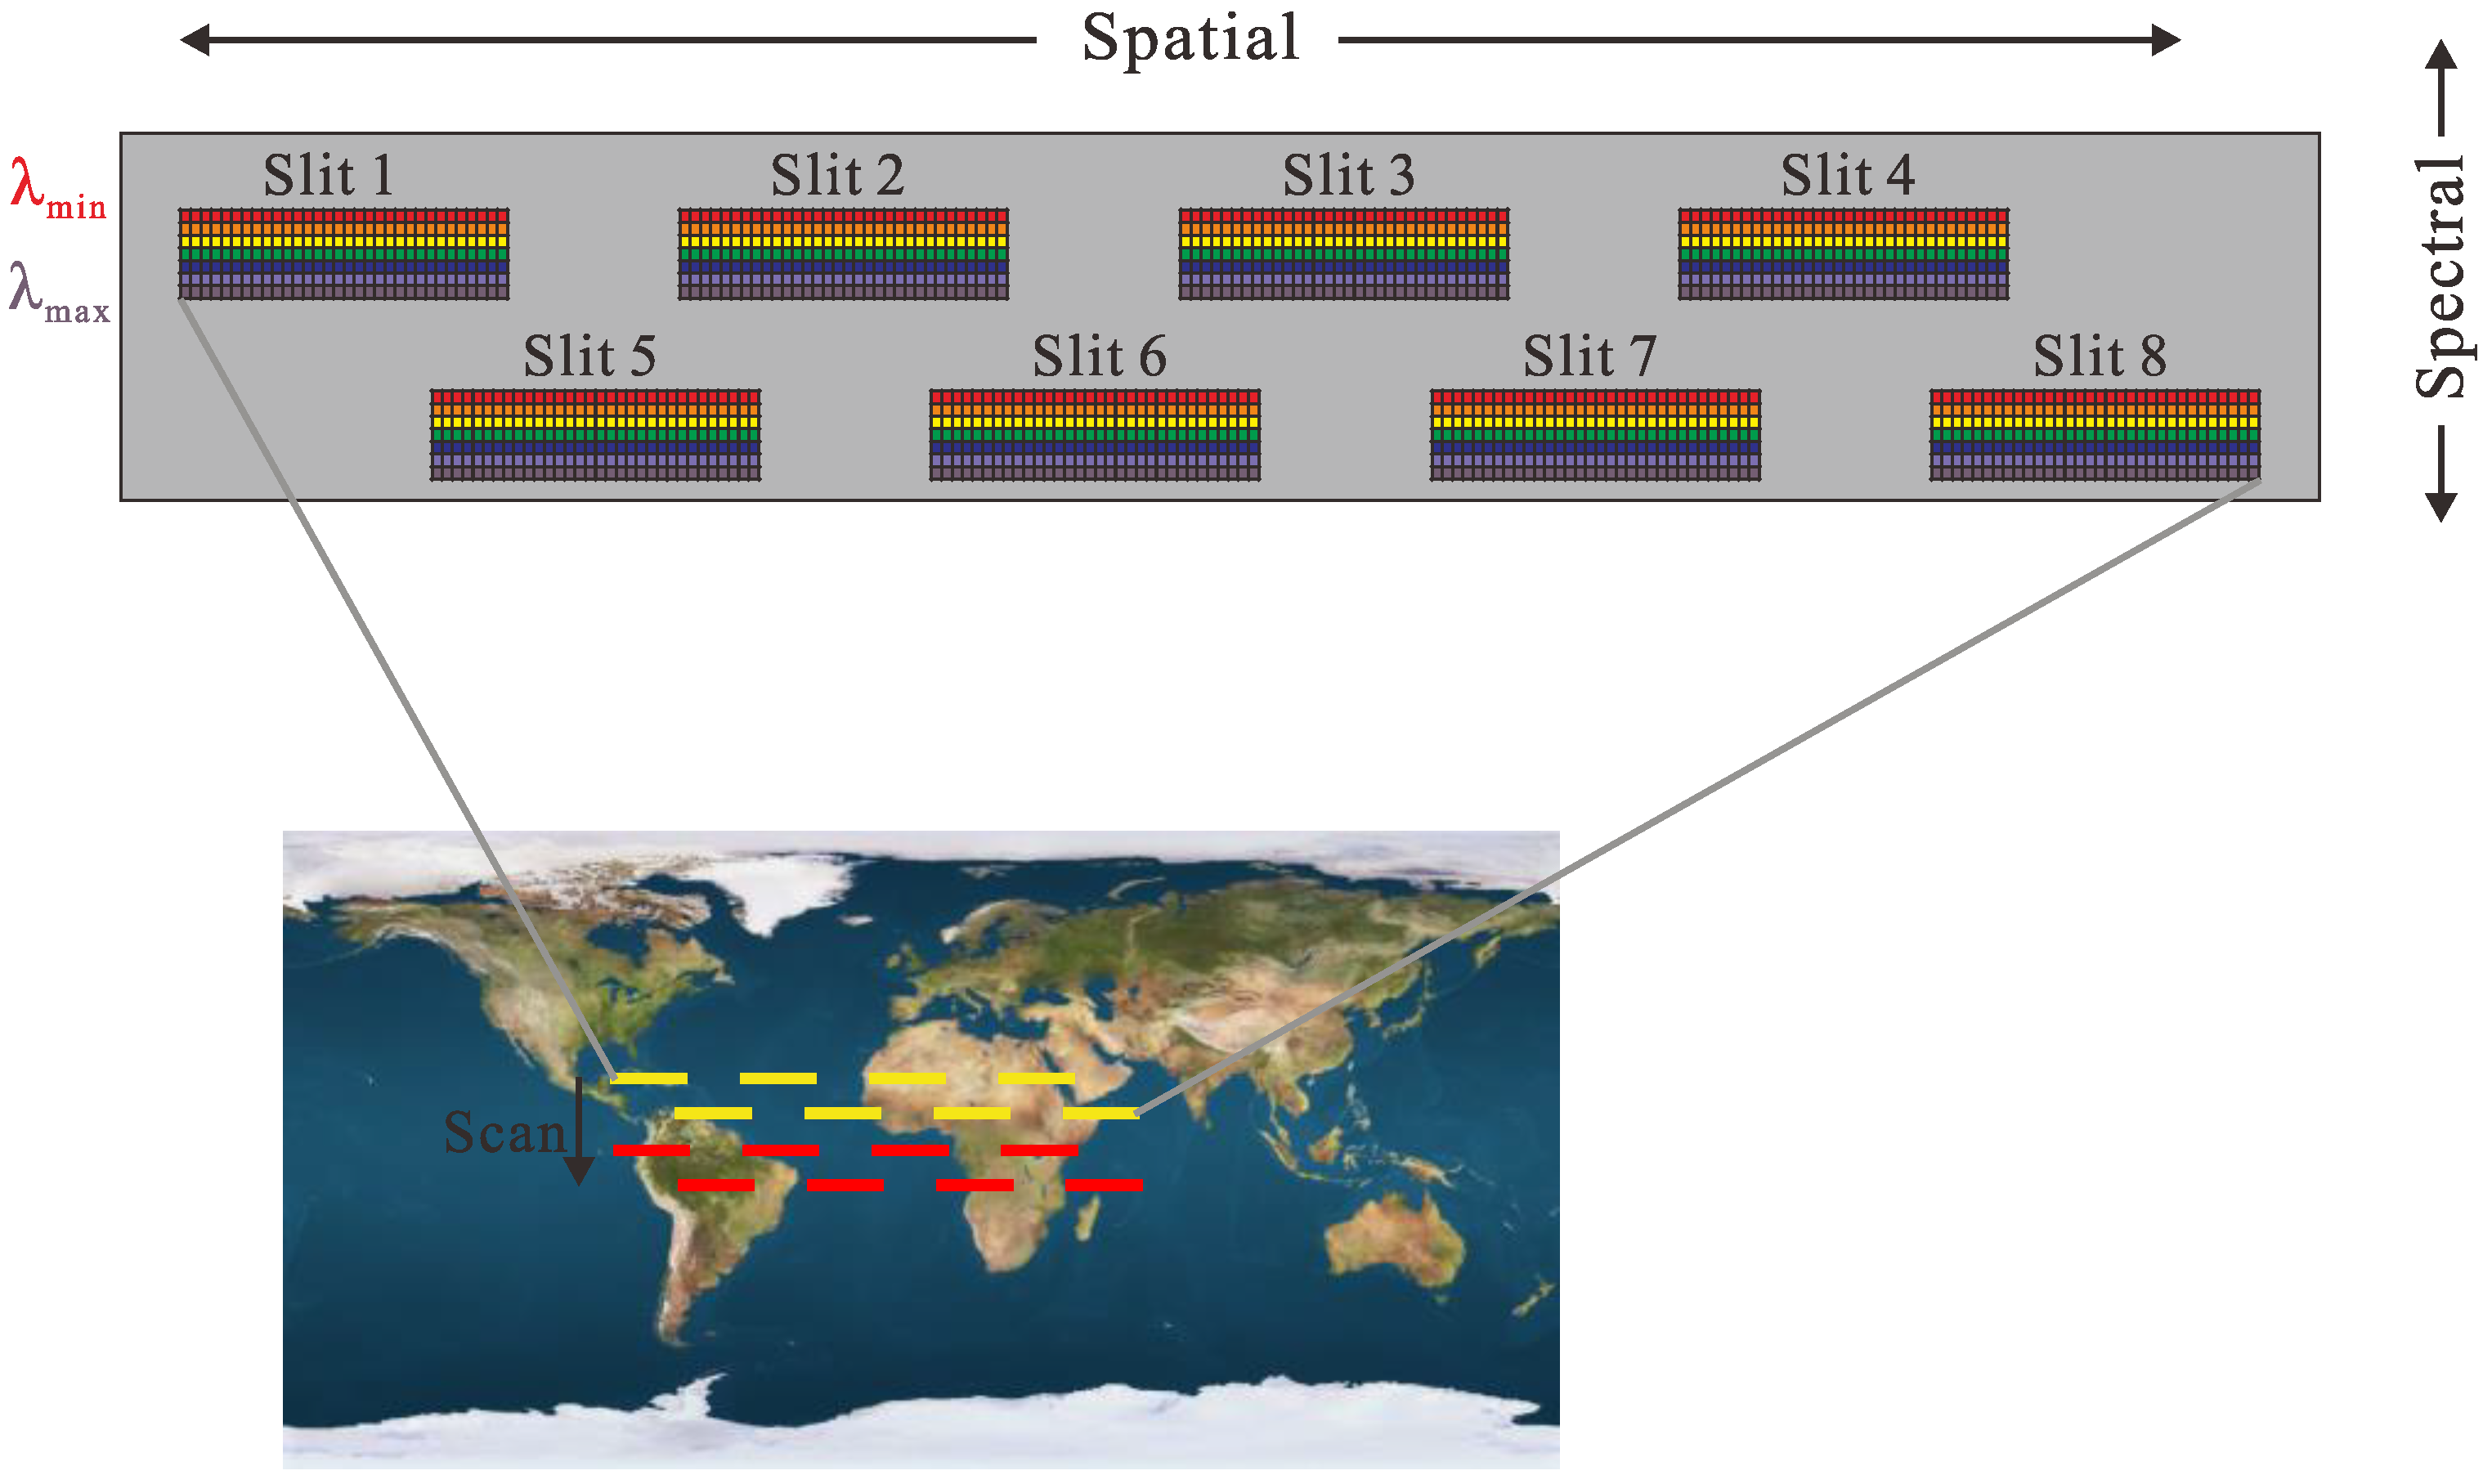
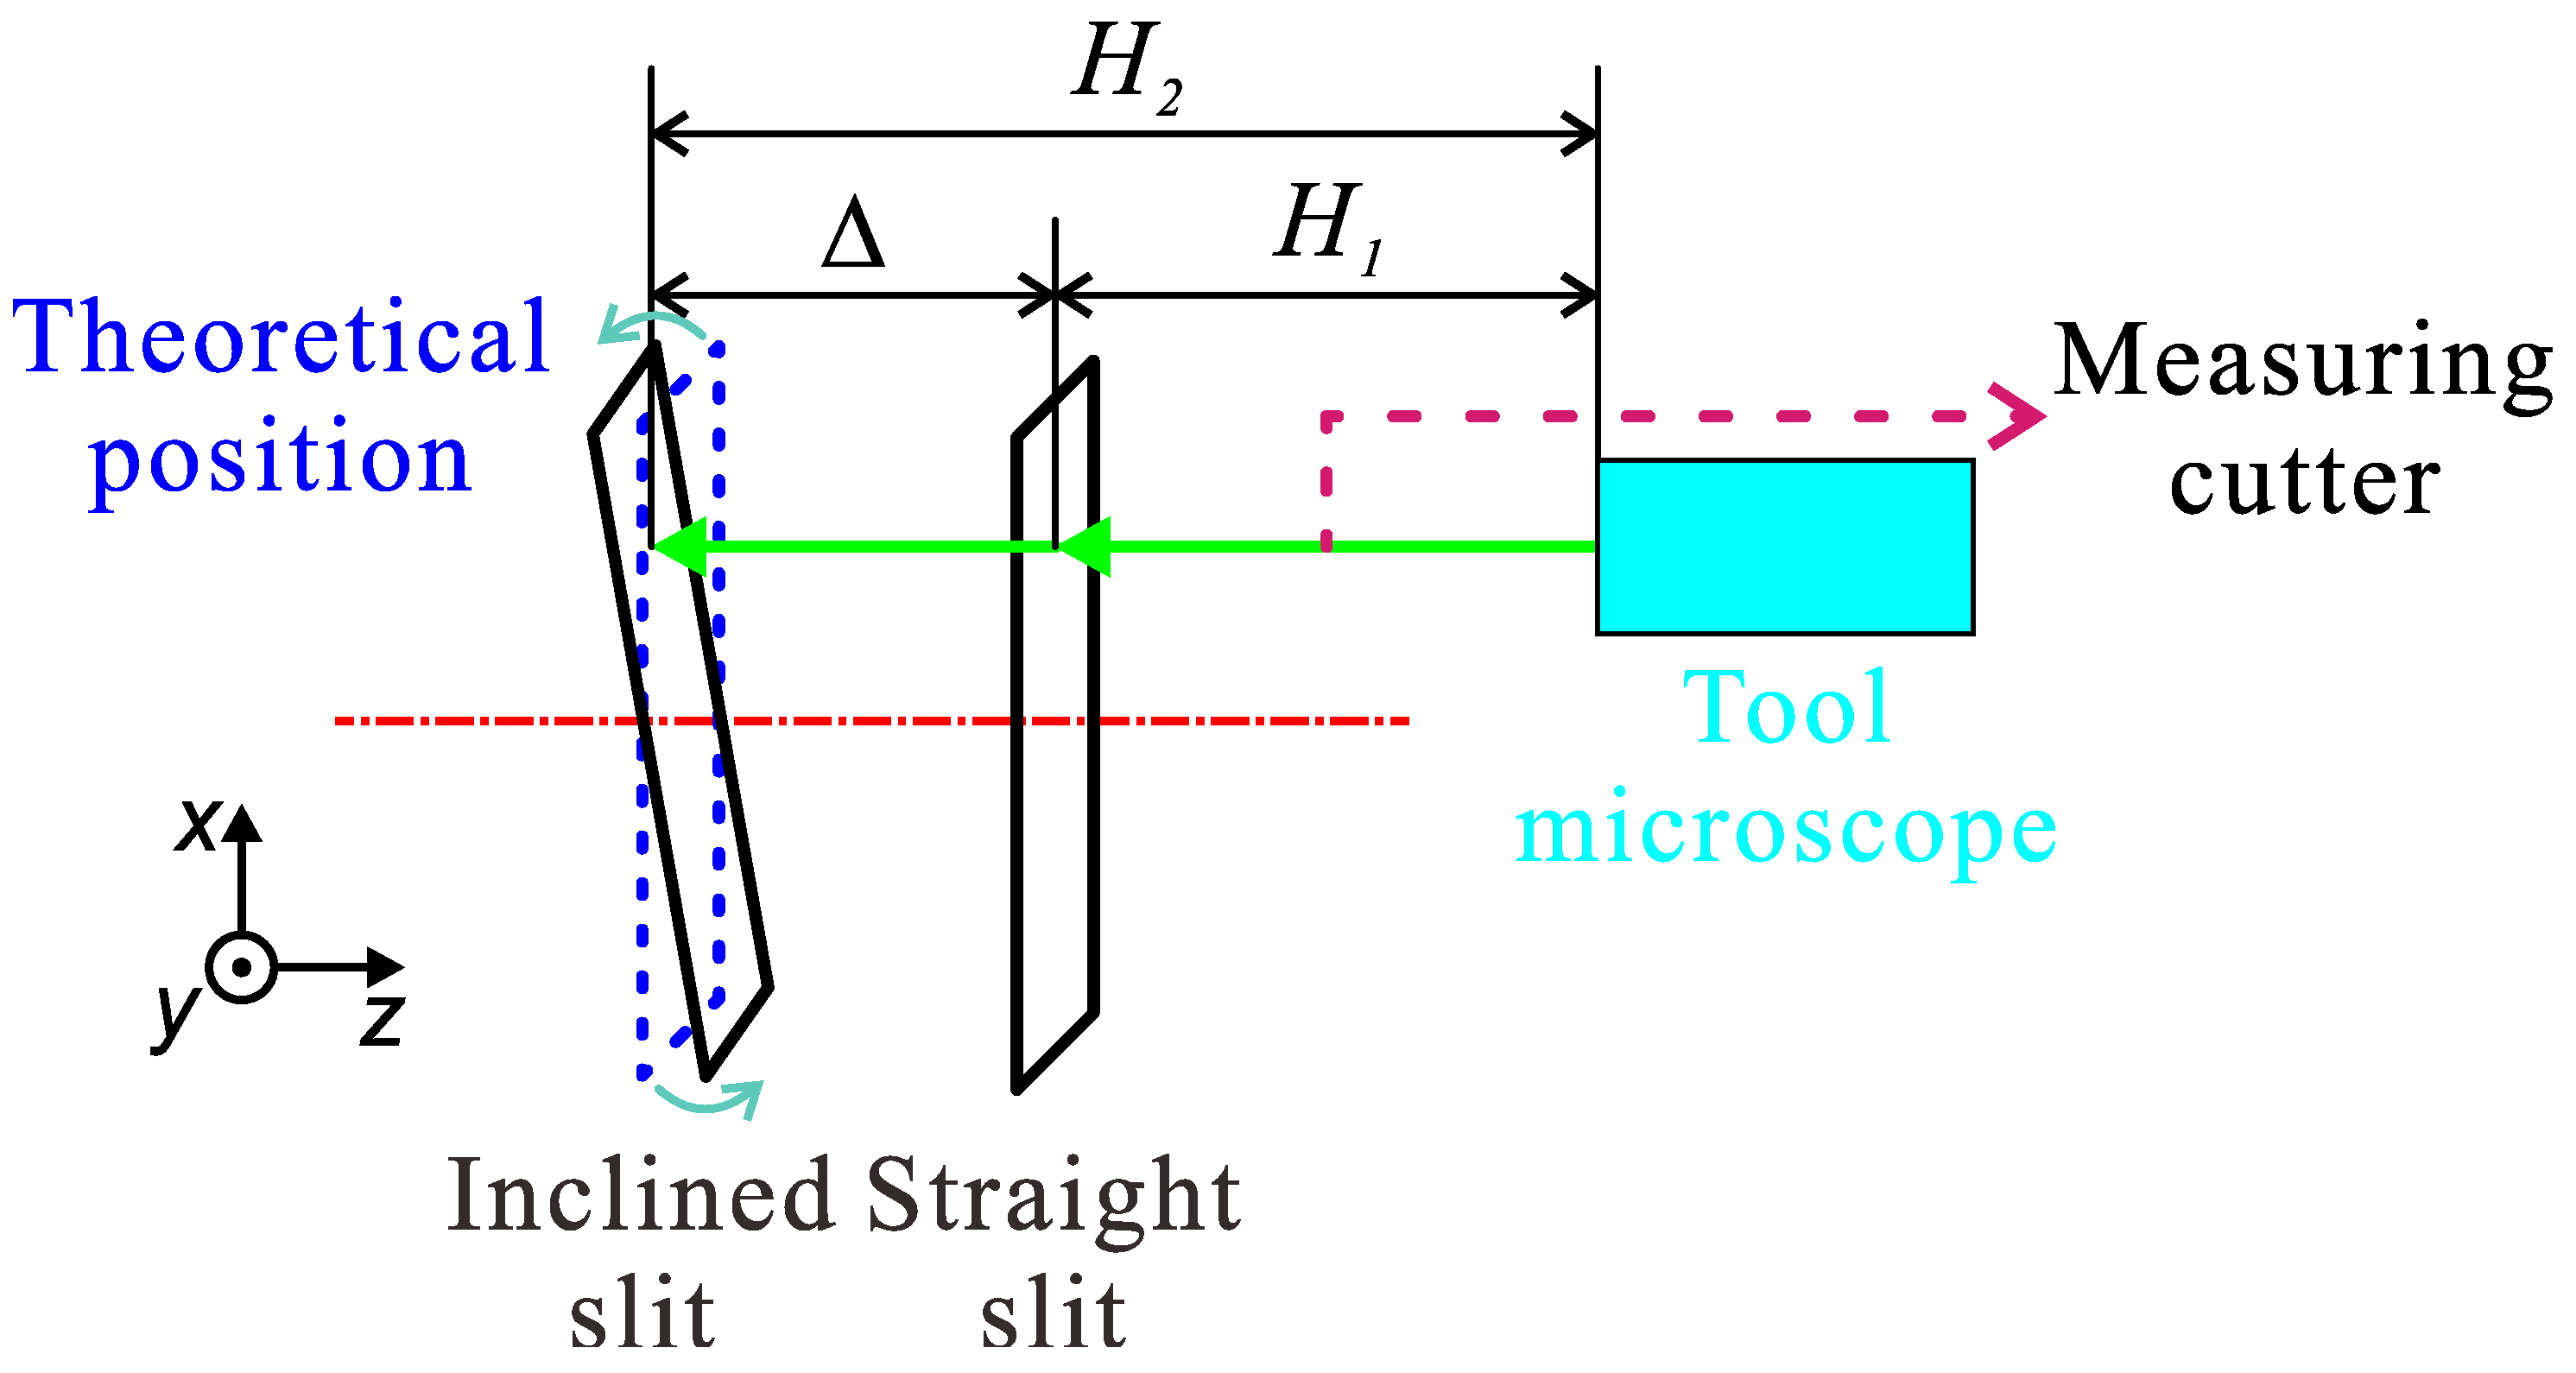
2.1. Field Stitching Method

The FOV affects the remote sensing efficiency of the imaging spectrometer, and to obtain a wide FOV, the current method is to splice multiple independent spectral imaging systems. However, this method makes the whole system too large, which is not suitable for the development requirements of miniaturization and lightweighting the spectral imaging system. Therefore, we propose a method to achieve an ultrawide FOV by splicing multiple slits in this paper. Multi-slit LWIR imaging spectrometers extend traditional single-slit spectrometer designs. For a large FOV imaging spectrometer design, multiple incident slits are spliced orderly in the length and width directions. Multiple slits image through the spectrometer in the focal plane and act together to form the whole spectrum.
The LWIR infrared imaging spectrometer in geostationary orbit has an orbit height of 3600 km, a swath width of 400 km, a spatial resolution of 100 m, a spectral resolution of 120 nm, and the detector can respond to 8~12.5 μm spectrum. The pixel array is 320 pixels × 256 pixels, and the pixel size is 30 μm × 30 μm. It was calculated that there are 4000 spatial channels and at least 37 spectral channels to meet the requirements. So, the total slit length required is 120 mm, and the dispersion width is set to 3.75 mm. Therefore, for multiple detectors to effectively receive the spectral images in the width direction, the spacing between multiple slits must be greater than the total dispersion width. Here, there are two rows of slits, each with a dispersion width of 3.75 mm. Thus, the spacing in the width direction is 8 mm. The spacing is 14 mm in the length direction to facilitate detecting continuous spatial information. In this case, the individual slit size is 16 mm (length) × 60 μm (width), and there are eight slits to provide an ultrawide FOV as large as 120 mm. Figure 1 shows the schematic diagram of multi-slit stitching.
Figure 2 reveals the instantaneous projections of eight slits on the scene and the dispersion spectra of each slit after imaging on the focal plane. The scanning mirror moves continuously to cover the gaps between the instantaneous slit images, producing a hyperspectral image cube across the FOV in geostationary orbit that generates “image blocks”, each containing eight separate spectral images. Figure 2 shows two “image blocks”, one yellow and one red. After generating the first “image block” (yellow), the scanner jumps to the beginning of the following “image block” (red). The scan is repeated for the next “image block” (red). Each scan cycle can cover an ultrawide FOV of 120 mm, satisfying the requirement to identify high-precision targets from geostationary orbit. The designs based on multi-slit effectively reduce the difficulty and cost of manufacture, in contrast to single-slit incidence imaging spectrometers that excessively rely on large infrared focal plane detectors to obtain large FOVs.
The development of a high-precision array multi-slit was carried out to design an LWIR imaging spectrometer with an ultrawide FOV of up to 120 mm. The multi-slit, a critical part of the spectrometer, was made by a new slit manufacturing method using laser-etched indium steel strips and iterated process mapping and design optimization. After finishing the machining, the multi-slit was tested. The results show that the edge straightness and parallelism of the multi-slit were better than 4 μm, satisfying the requirements of the optical system. Figure 3 displays the multi-slit assembly.

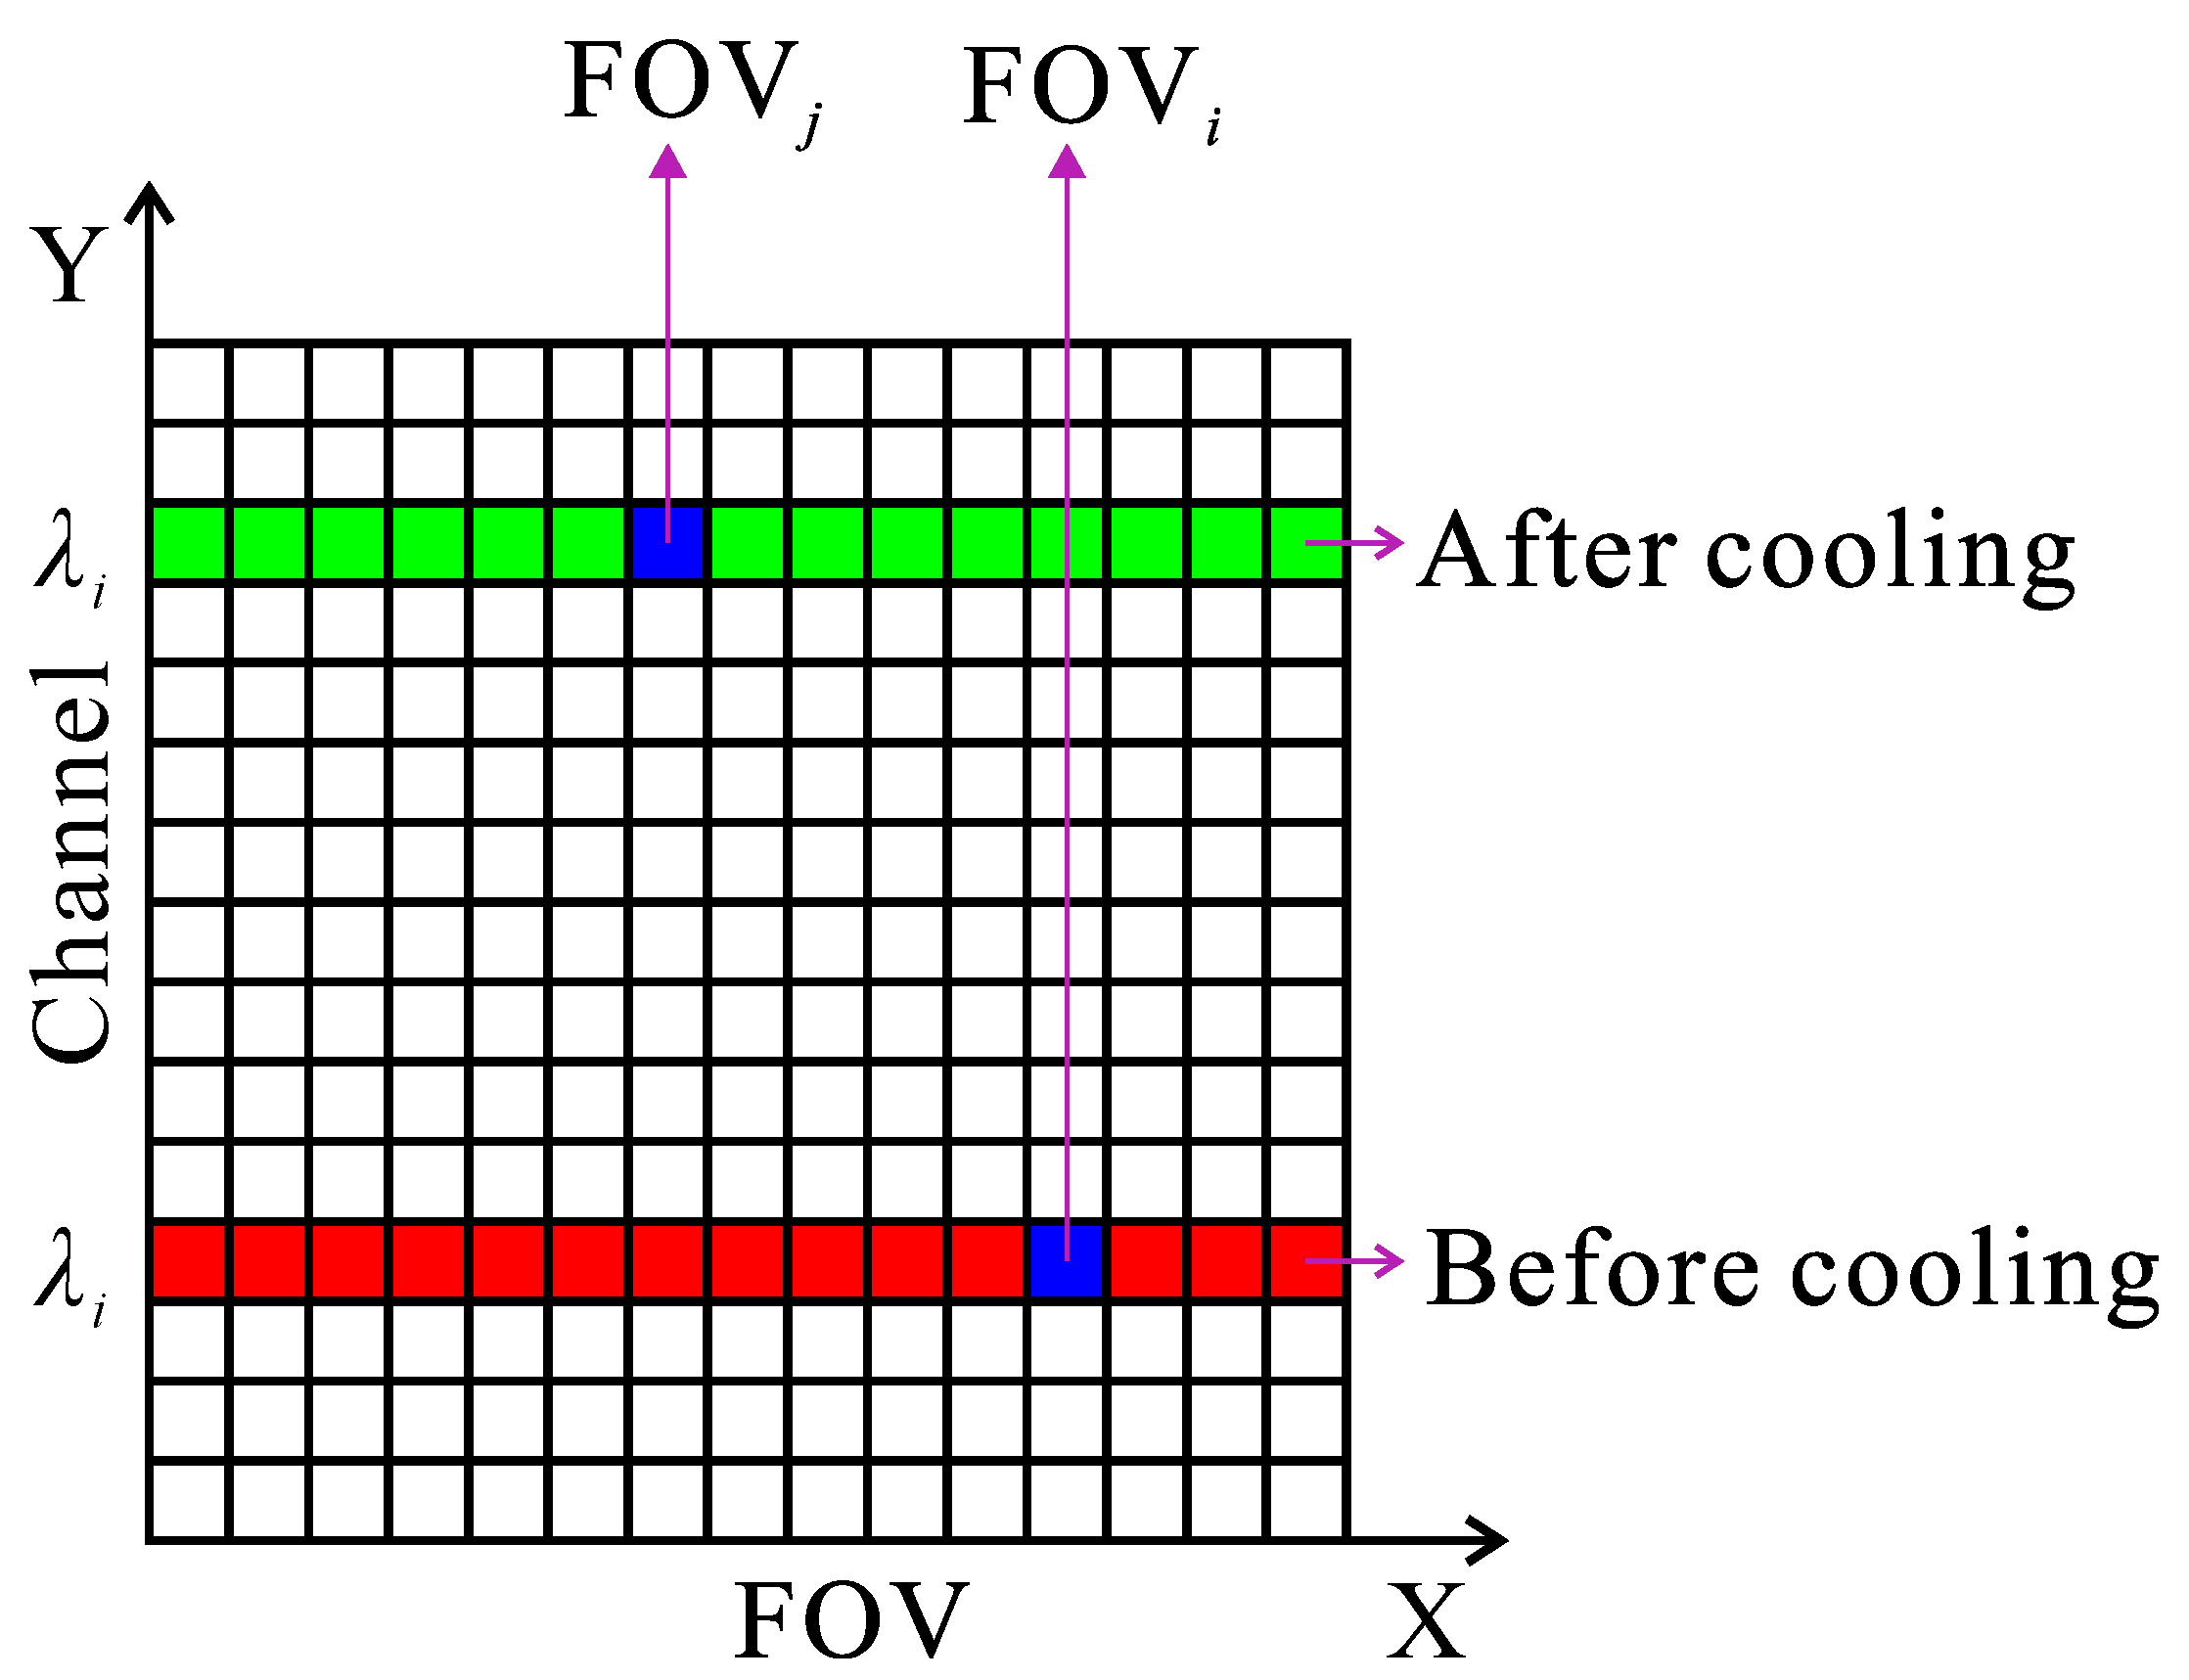
2.2. Cryogenic Refocusing Principle

The spectral response of the spectrometer in the respective channel is a function of the correlation between the detector output and the incident wavelength [14]. For the i-th channel of the spectrometer, the output signal xi is expressed as:
x i = + E λ π A β 2 ρ λ τ a λ τ o λ S s λ R d λ R e λ ,
In Equation (1), Eλ is the irradiance of the sun per unit wavelength interval near λ; β is the instantaneous FOV of the system; A is the effective optical area of the system; ρ(λ) is the spectral reflectance of the ground object; τa(λ) is the spectral transmittance of the atmosphere; τo(λ) is the optical efficiency of the system; Ss(λ) is the transfer function of the spectrometer dispersion system; Rd (λ) is the spectral responsivity of the detector; Re(λ) is the spectral responsivity of the electronics system.
Eλ, ρ(λ), and τa(λ) represent system-independent quantities, while τo(λ), Ss(λ), Rd (λ), and Re(λ) denote system-determined covariates. Therefore, the SRF for the i-th channel (SRFi(λ)) in the system is expressed by their product:
S R F i λ = τ o λ S s λ R d λ R e λ ,
Considering the certain width of the slit and the factors of τo(λ), Ss(λ), Rd (λ), and Re(λ) correlated with the system, a Gaussian function can be employed to simulate SRFi(λ), which is expressed as:
S R F i λ = A exp 1 2 λ λ i σ i 2 ,
where A denotes a constant, λi represents the central wavelength, and σi expresses the mean square deviation of the Gaussian function.
The FWHM of the Gaussian function is generally considered the spectral resolution δλ of the system, which is written as:
δ λ = 2 2 l n 2 σ i ,
After the spectrometer has been adjusted at an ambient temperature, it should be cooled to the operating temperature so that the background radiation can be effectively suppressed. Due to the temperature change in the cooling process, the image plane of the spectrometer deviates from the focal plane, thus resulting in defocus aberration and having an effect on the spectral resolution of the system. Assuming that the diffuse spot radius of the spectrometer due to aberration in wavelength coordinates is σd, the point spread function PSF(λ) of the spectrometer system in a wavelength coordinate system is approximated by a Gaussian function as:
P S F λ = e x p 1 2 λ λ i σ d 2 ,
The SRF(λ) of actual spectrometer systems is the convolution of the SRFi(λ) when there is no aberration and the PSF(λ) when there is aberration.
S R F λ = A e x p 1 2 λ λ i σ i 2 × e x p 1 2 λ λ i σ d 2 ,
Through the further calculation of Equation (6), it yields:
S R F λ = A e x p 1 2 λ λ i σ 2 ,
Here, σ2 = σi2 + σd2.
Equation (7) reveals that the aberration increases the FWHM of the SRF; the larger the aberration, the larger the FWHM will be. The FWHM value is at its minimum when the system is in the focused position, but it will increase when the system is in the defocused position. Additionally, the increment becomes larger as the degree of deviation from focus grows. Accordingly, the FWHM is adopted to assess the refocusing effect. The slit shim thickness should be adjusted to compensate for the deviation of the image plane from the focal plane caused by temperature changes. However, the slit shim thickness is difficult to automatically adjust, mainly because the spectrometer should be cooled to 123 K. The design of cryogenic activity components is complicated to avoid cold welding, and the period of subsequent experiments is relatively long. Thus, this paper proposes using an inclined slit to determine the slit shim thickness accurately and quickly.
The slit is tilted at an angle along the FOV direction, and then part of the spectrometer’s FOVs can still image well when the temperature changes over a range. At this point, the FWHM has a minimum value in the entire FOV, and the corresponding FOV is considered focused. As depicted in Figure 4, after the FOV corresponding to the position of imaging clarity at a specific temperature is obtained, which is the FOV corresponding to the minimum FWHM, the slit shim thickness based on the difference between different FOVs can be accurately calculated. In this study, the length of the single available slit is 9.6 mm, and the angle of the tilted slit θ is 10°. In theory, there are FOV positions capable of imaging clearly within ±0.83 mm of the slit shim thickness.
Next, the thickness Δ of the slit shim to be adjusted is calculated as follows:
Δ = F O V j F O V i × a × sin 10 ° ,
where FOVi and FOVj denote the optimal imaging FOV at ambient temperature and cryogenic temperature, respectively, and a represents the actual pixel size of the detector.

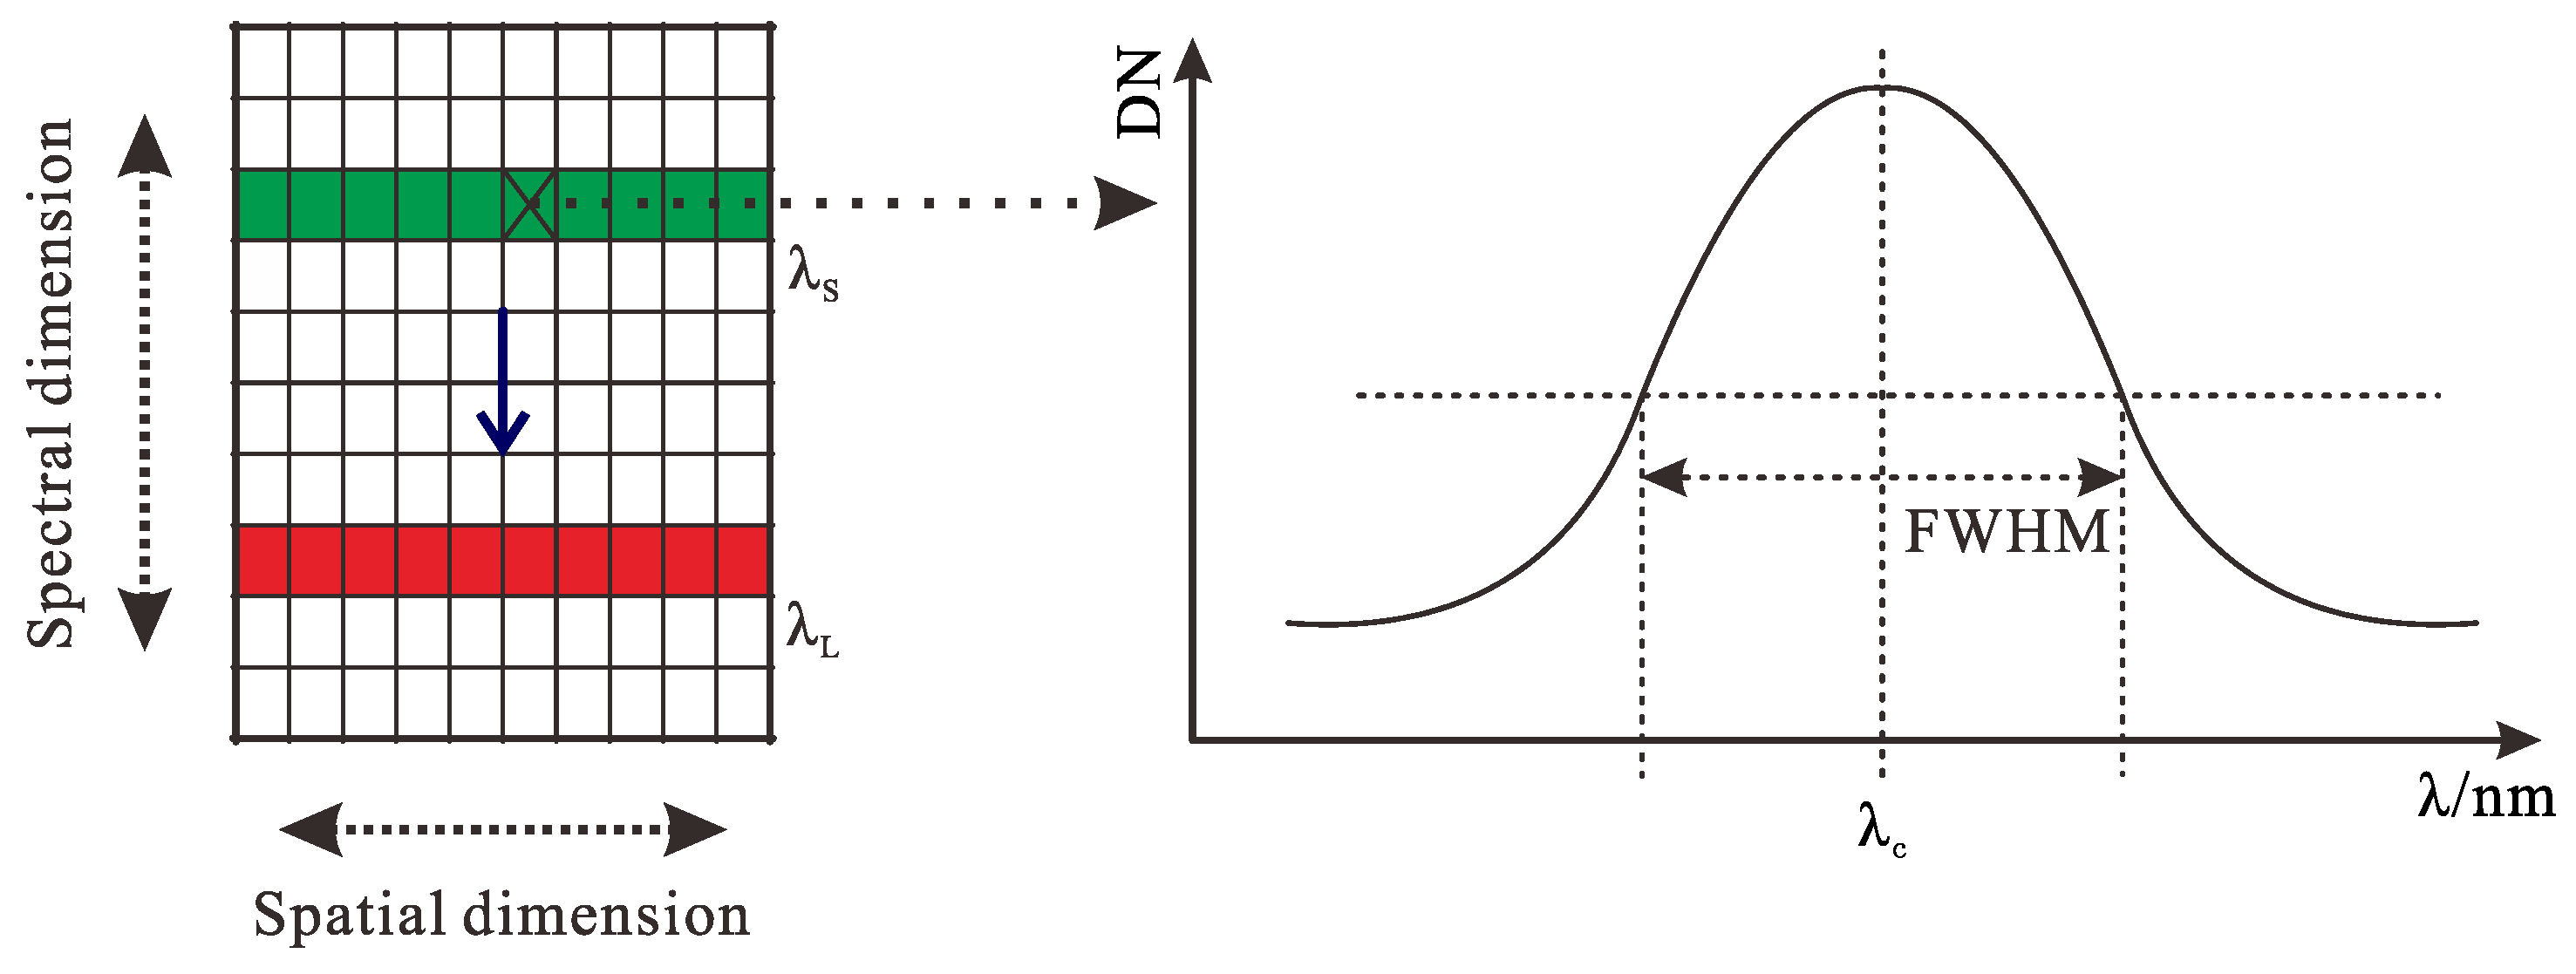
2.3. Spectral Response Function Basis

The SRF of each channel of the spectrometer is determined using the slit function D1(λ), the pixel response function D2(λ), and the optical line spread function in the tangential direction LSFT(λ), and it is the convolution of the above three [15]. It is written as
S R F λ = D 1 λ D 2 λ L S F T λ ,
where ∗ denotes convolution. Typically, the spectral integrated energy is optimal when the slit and the pixel are matched, and the SRF can be compared to a Gaussian function.
In general, the slit function and the pixel response function are rectangular functions. If the width of the slit and the pixel are both selected as a, it yields:
D 1 y = r e c t 1 y a ,
D 2 y = r e c t 2 y a ,
When yλ − a/2 ≤ yyλ + a/2, D1(y) = 1, D2(y) = 1; y < yλ − a/2 and y > yλ + a/2, D1(y) = 0, D2(y) = 0. y denotes the tangential coordinate on the image plane, and yλ is the position of the central wavelength in the tangential coordinate. Here, the slit width is equal to the pixel size of the detector. The LSF is obtained by integrating the PSF in the direction of the slit length, and LSFT(y) is the tangential line spread function at y.
Thus, the spectral response function is expressed as:
S R F y = r e c t 1 y a r e c t 2 y a L S F T y ,
In this case, Equation (12) can be used to obtain the SRF. However, because there is a difference between Equations (12) and (9), y must be mapped from the position coordinate system onto λ in the wavelength coordinate system by iteratively tracing the chief rays on the axis of the field of view at a series of wavelengths following the tangential direction. Finally, SRF(λ) correctly calculated the FWHM, i.e., the spectral resolution identified in this way covers aberration and diffraction information.

3. Imaging Spectrometer Design and Analysis

3.1. Spectrometer Technical Specifications

The LWIR imaging spectrometer investigated in this paper is primarily utilized for space observation from a geostationary orbit. When combined with visible to near-infrared, short-wave infrared, and mid-wave infrared imaging spectrometers, it can accomplish continuous monitoring over a wide range throughout the day, satisfying the demands of space remote sensing applications for high-accuracy target classification and identification. Additionally, it has been extensively used in mineral exploration and geological mapping [16], gas detection and recognition [17], environmental monitoring and resource investigation [18], military reconnaissance and security defense [19], etc. Table 1 displays some of the main specifications of the LWIR imaging spectrometer.

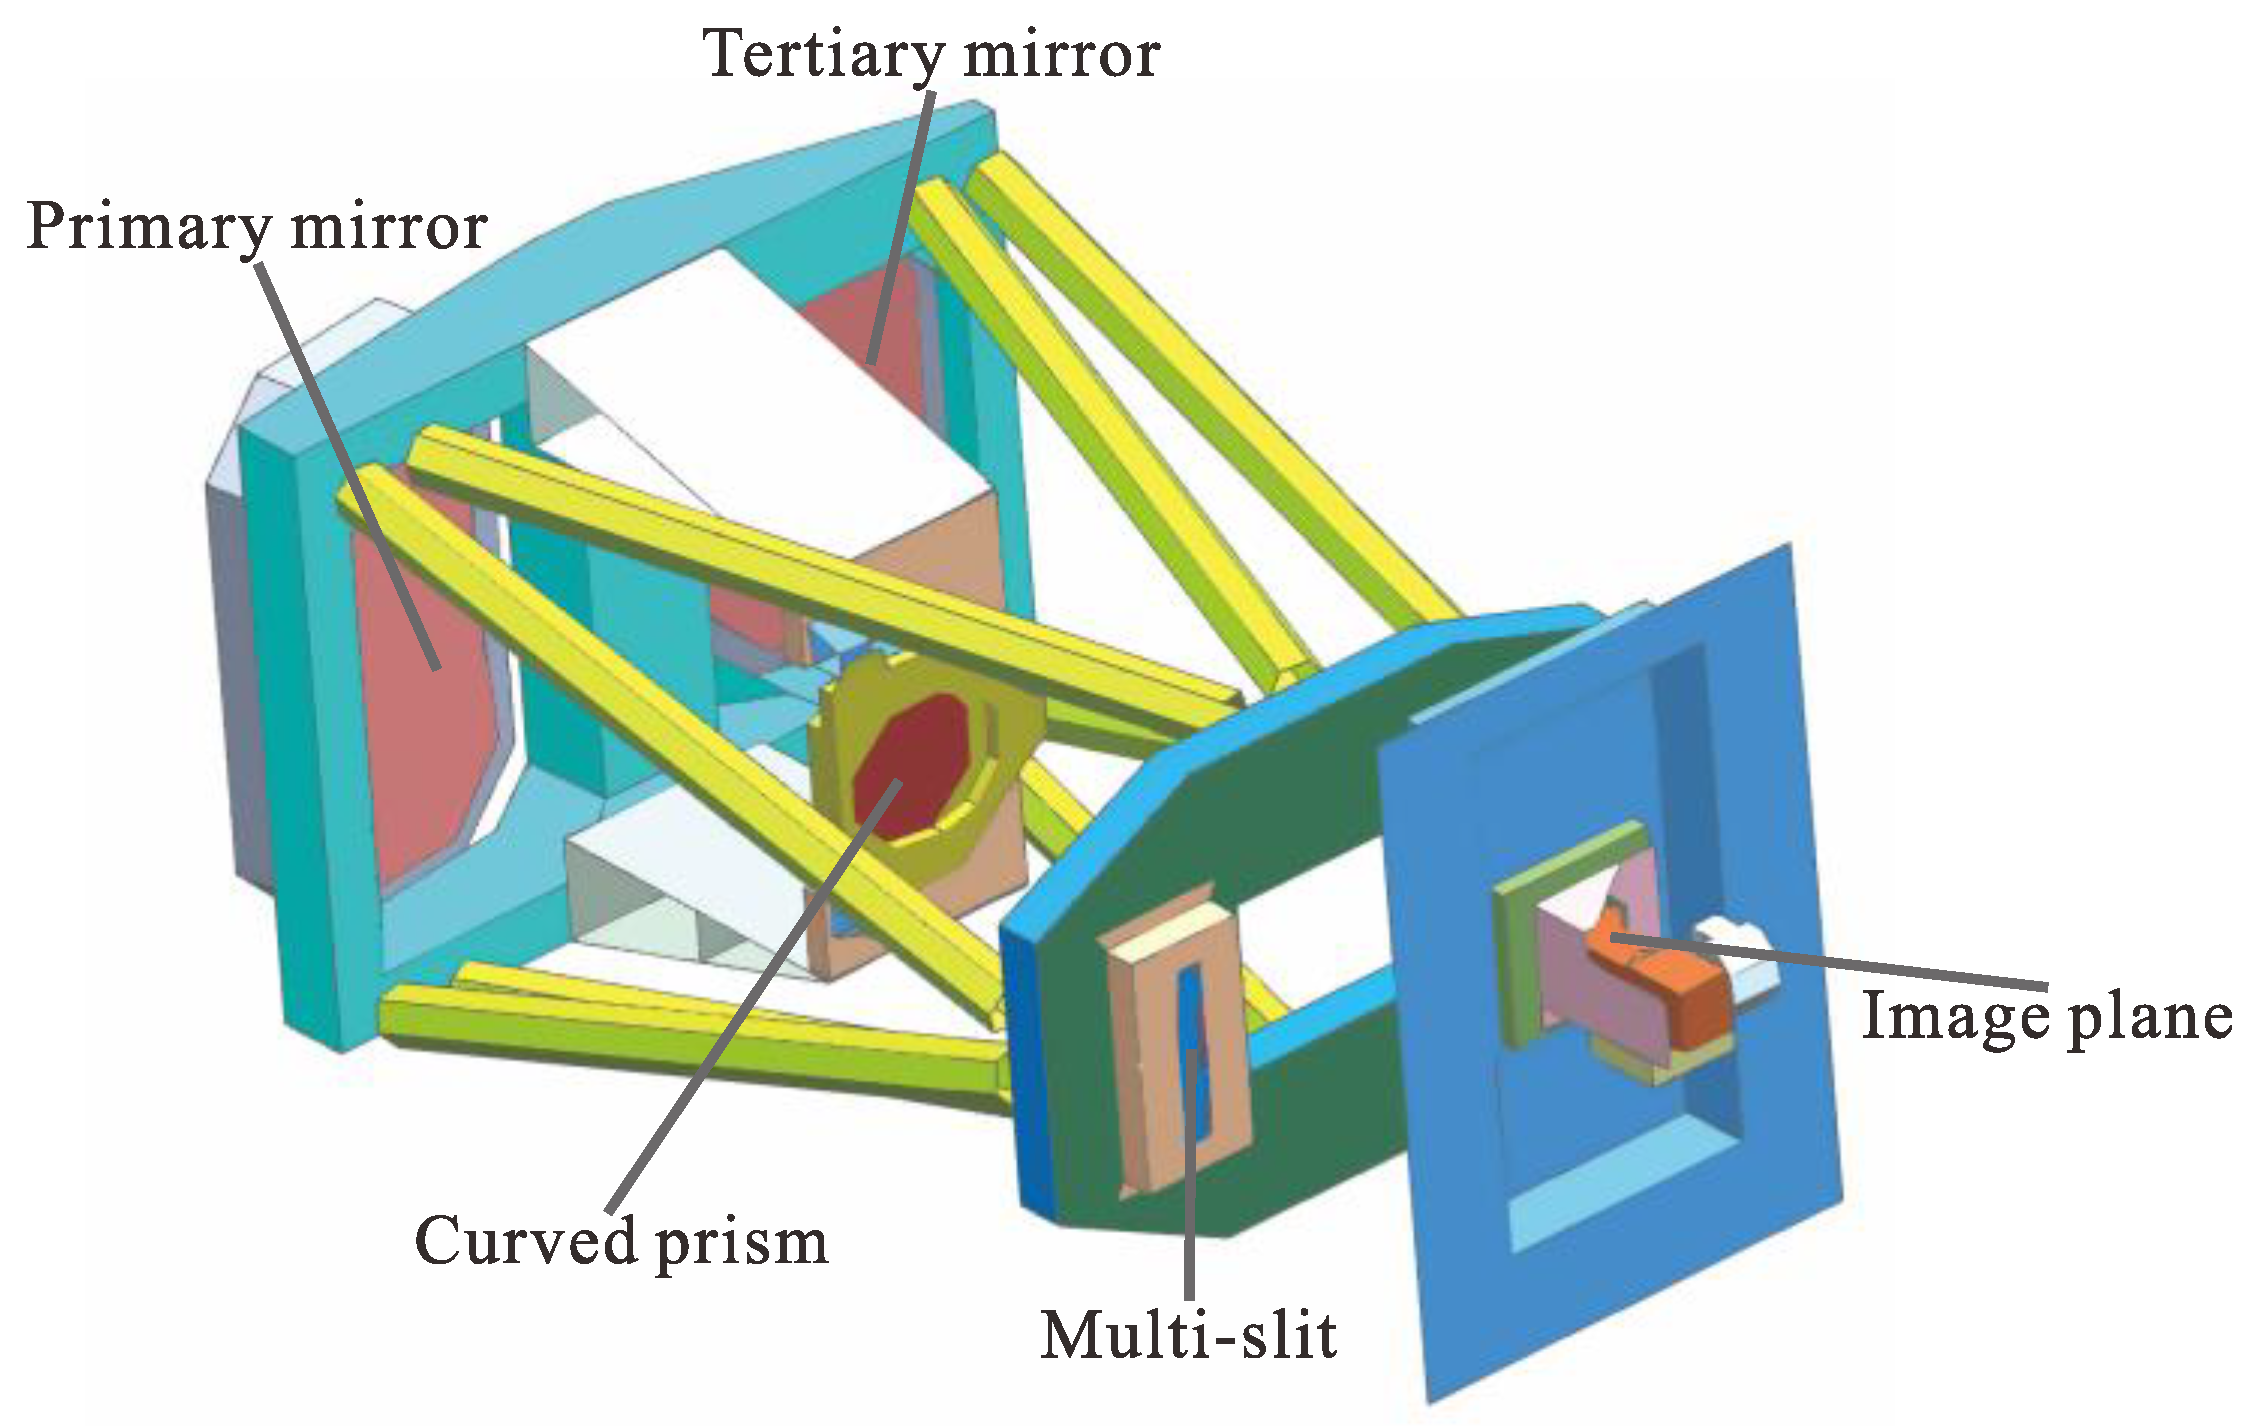
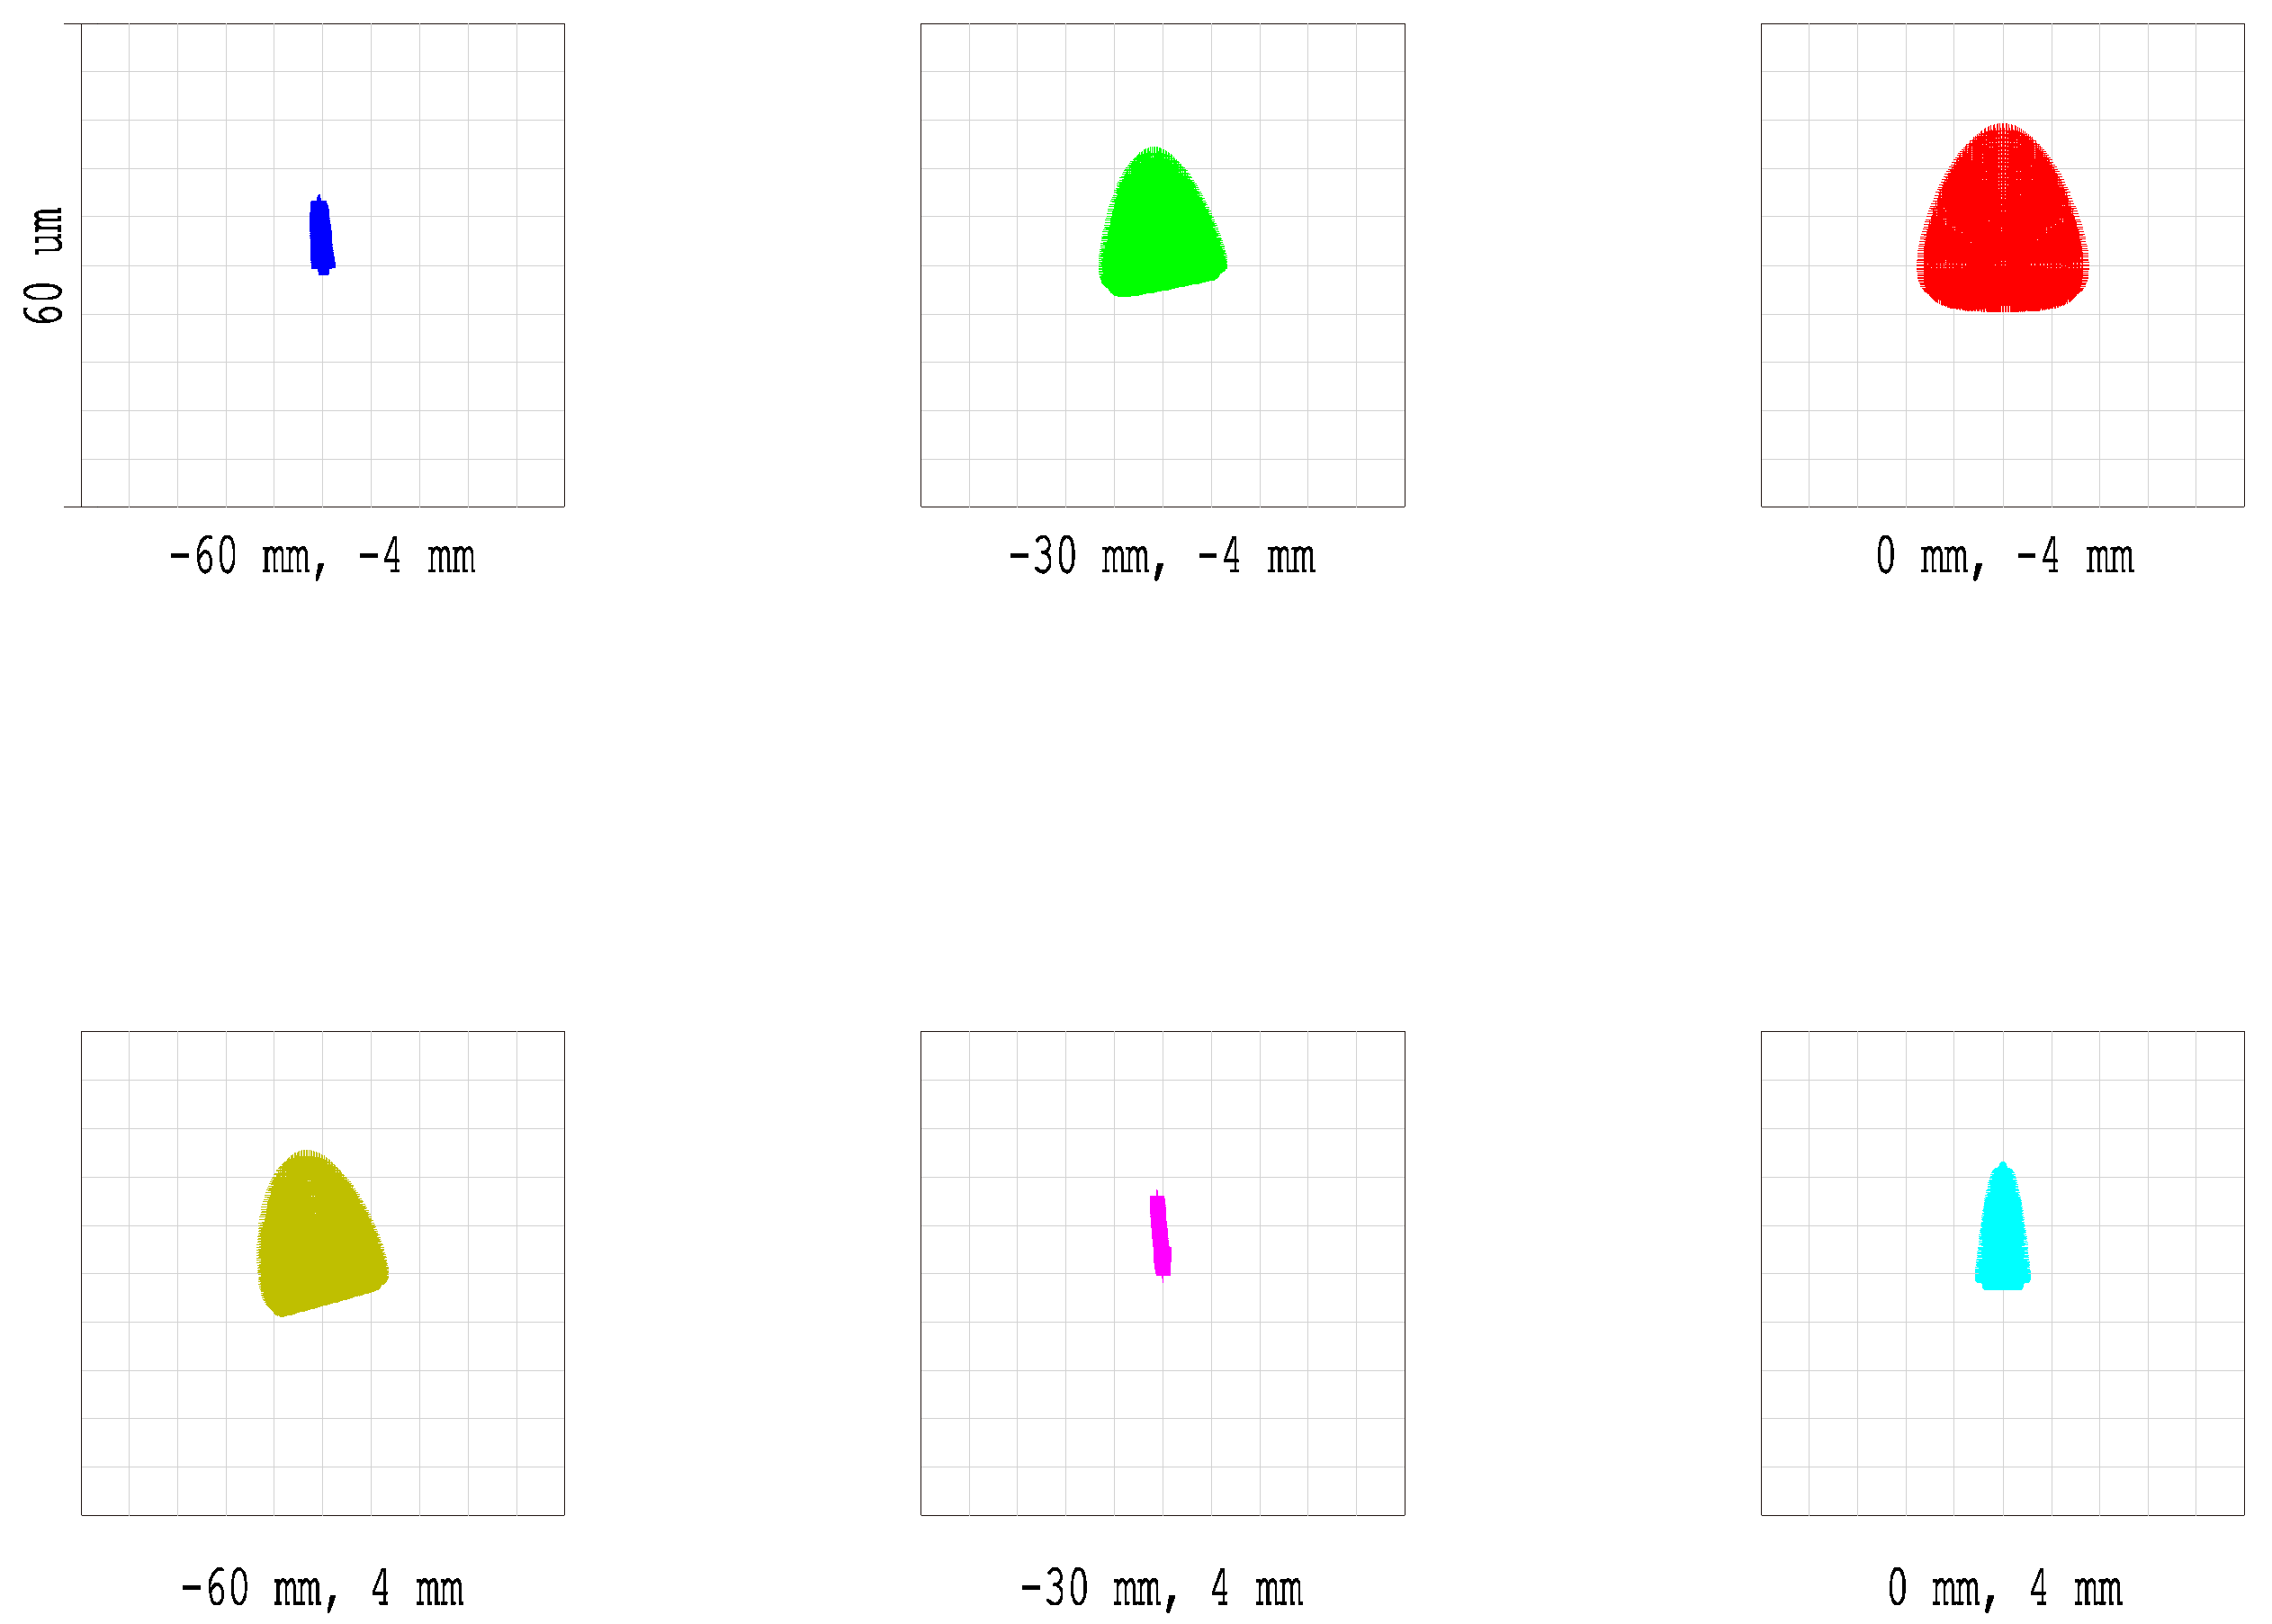
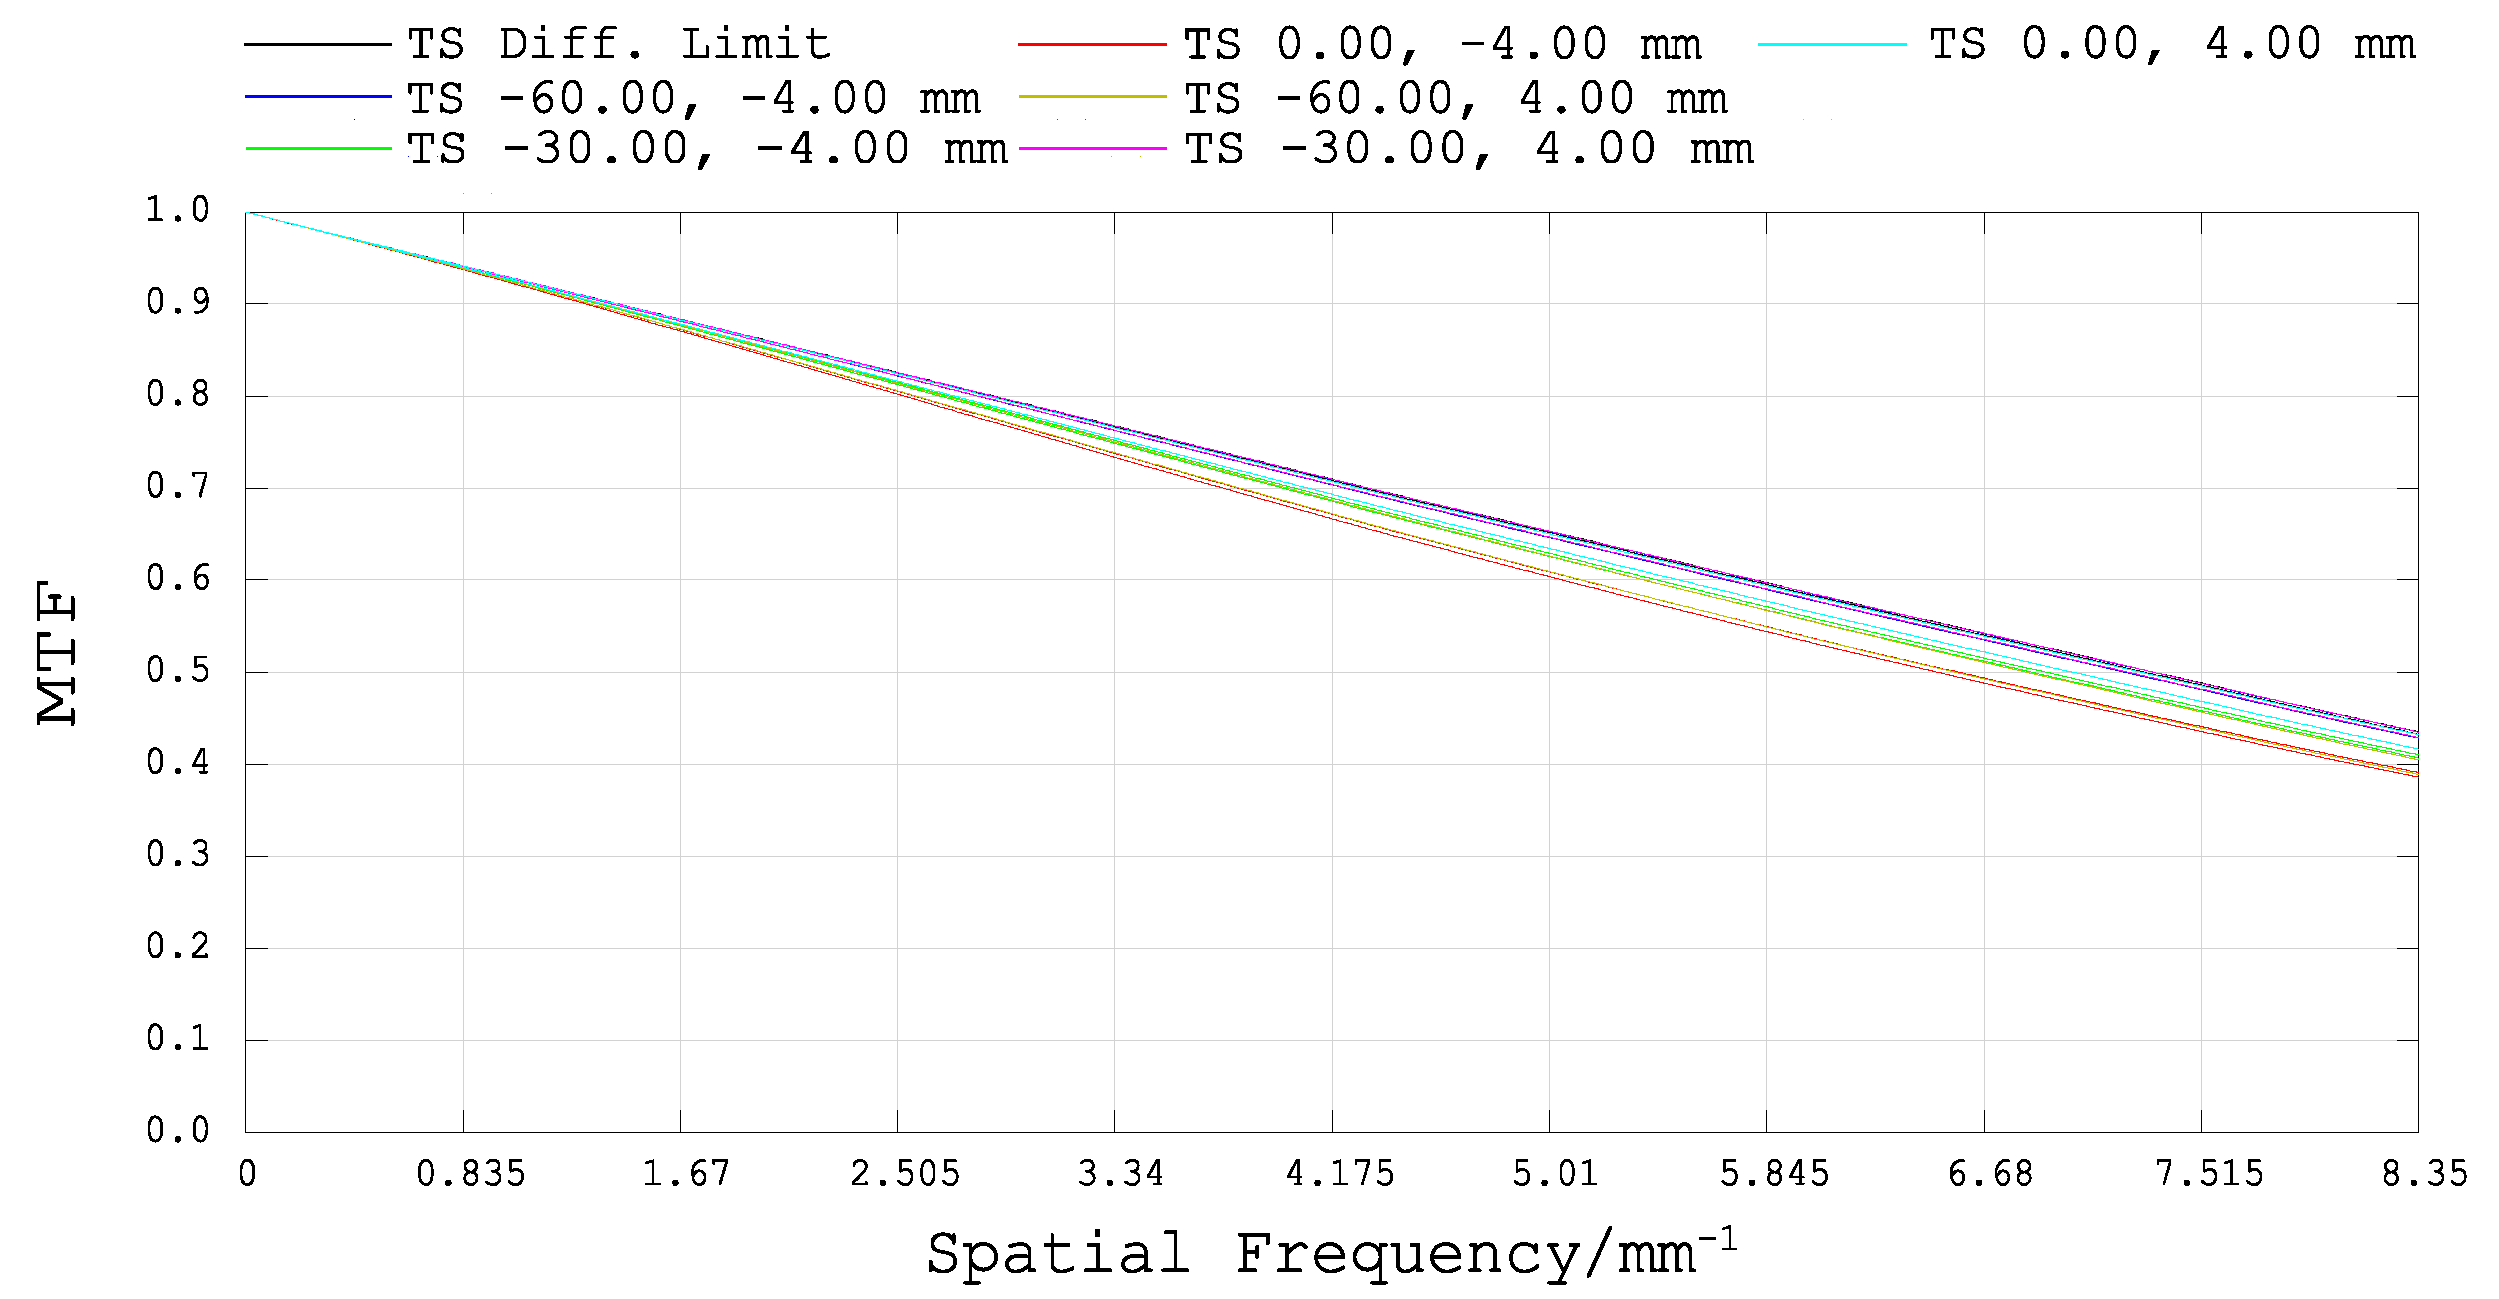
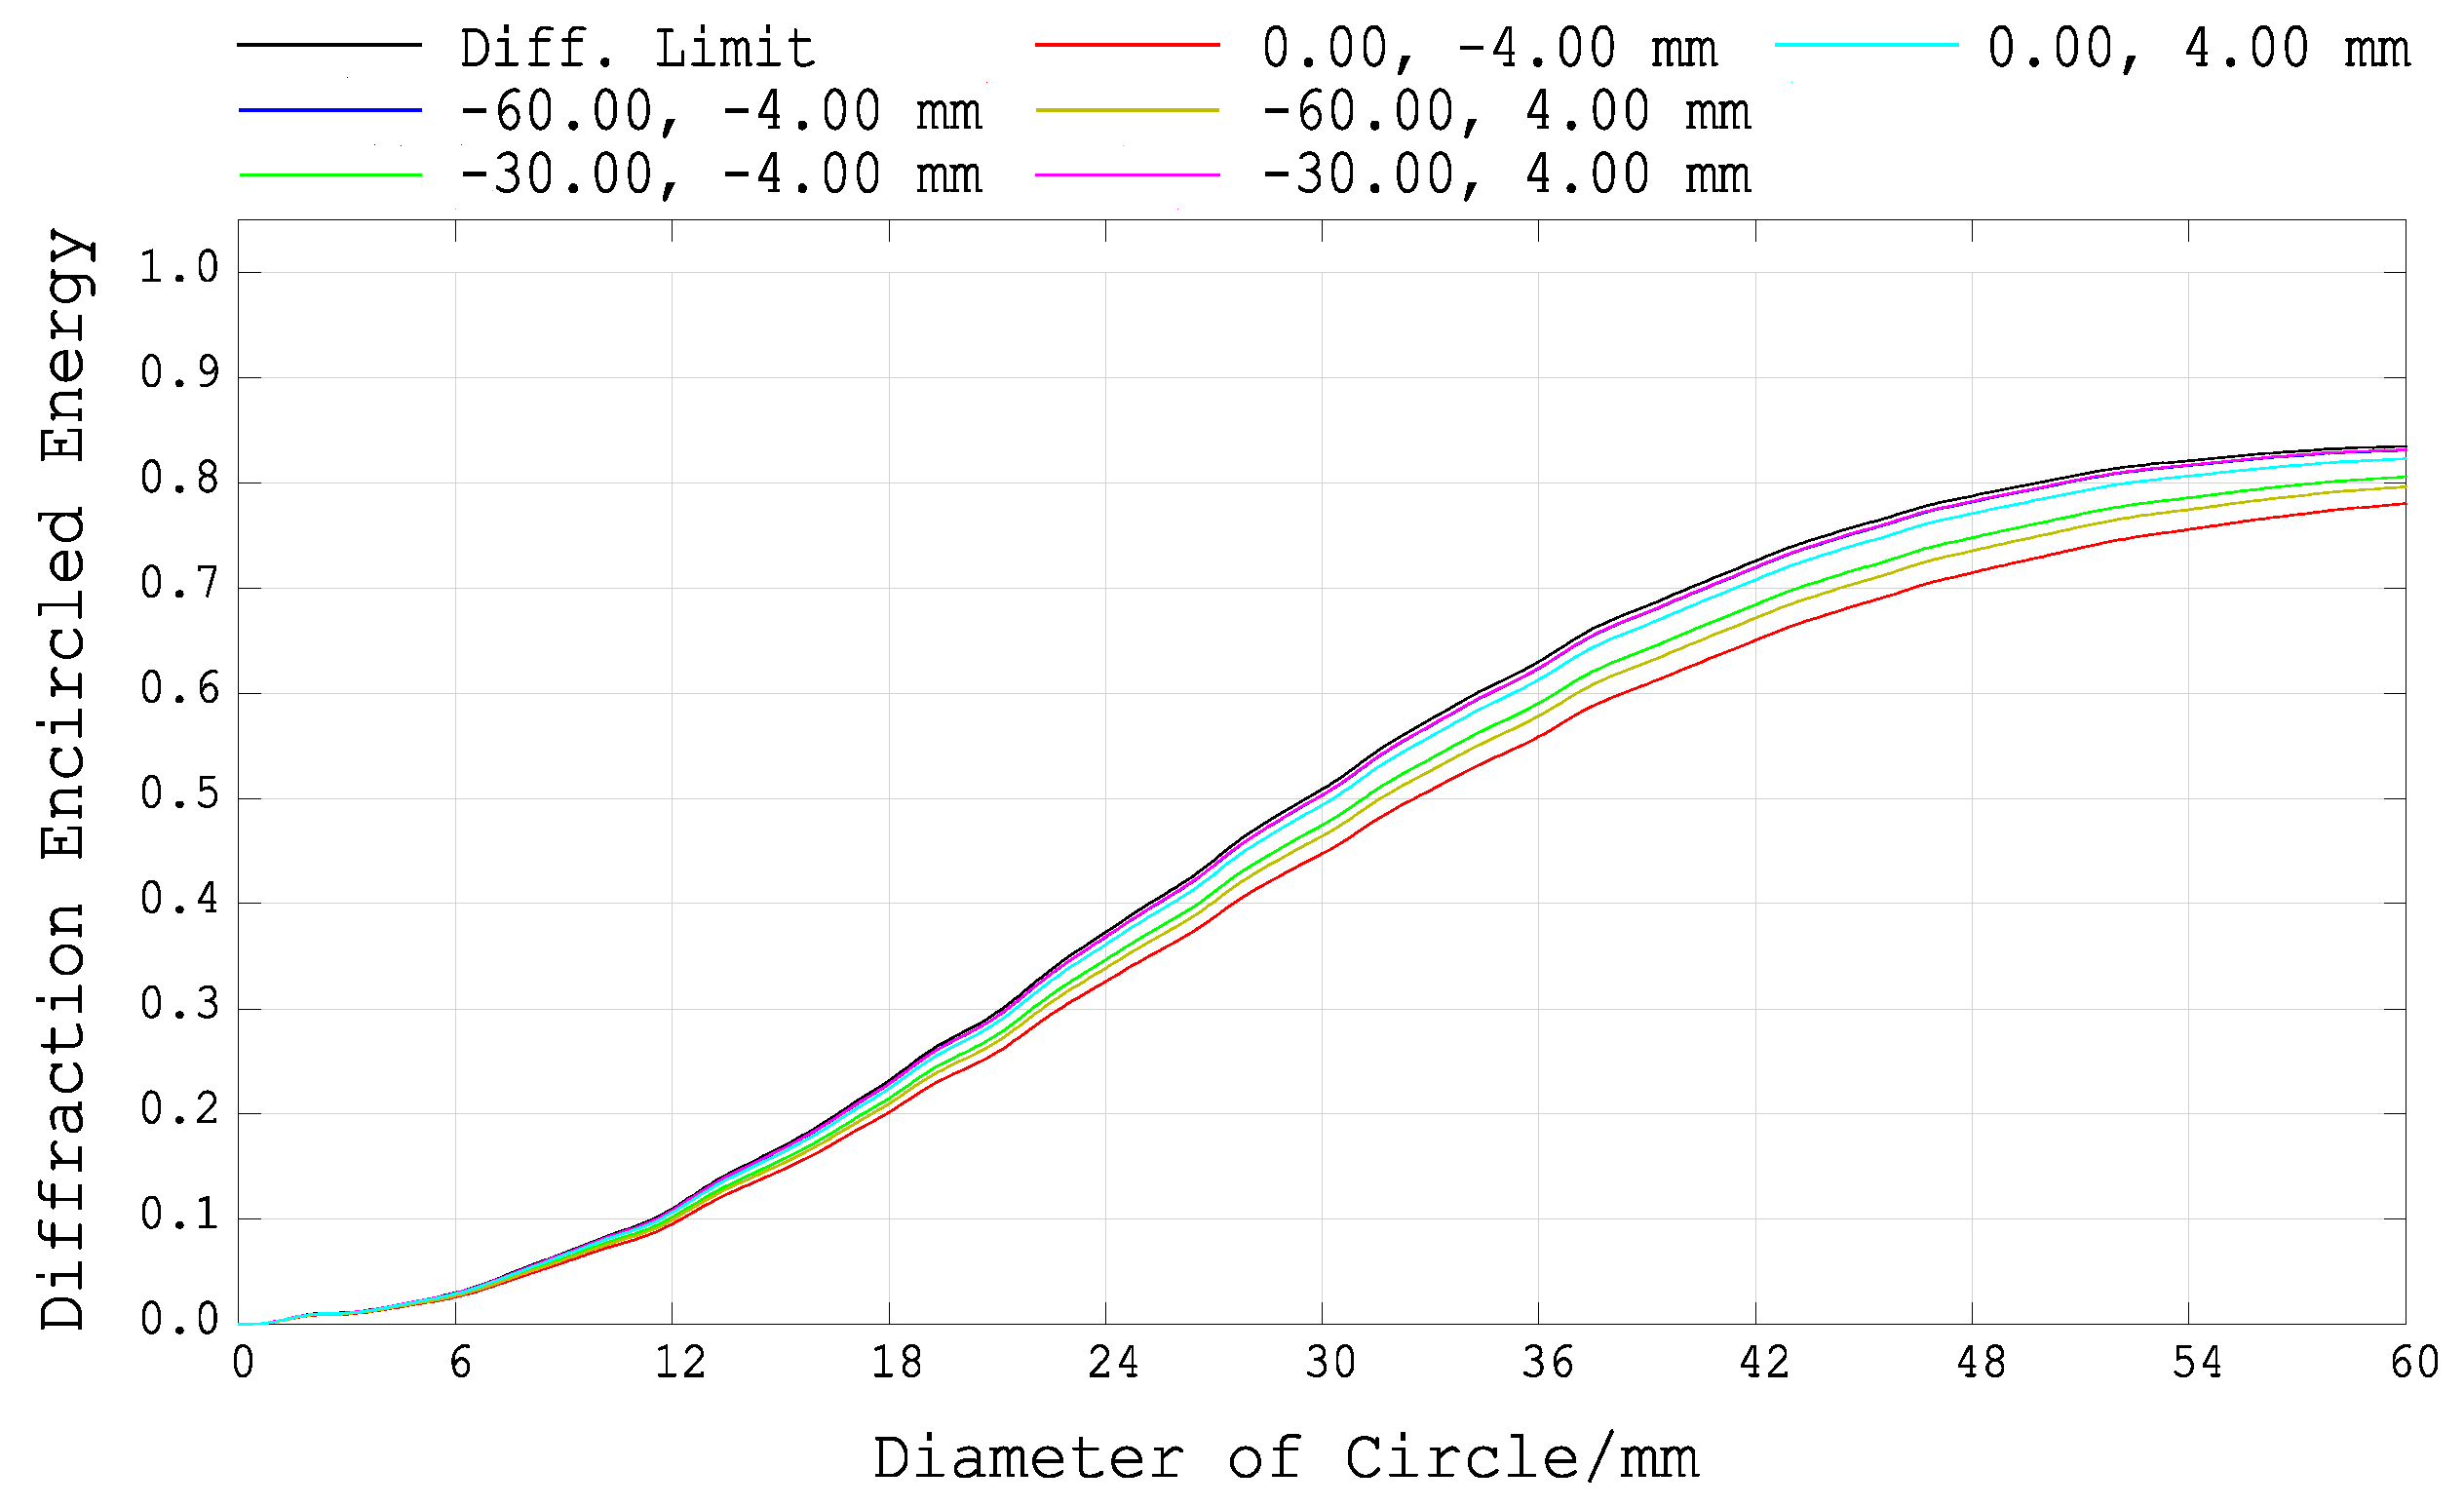
3.2. Ultrawide FOV Imaging Spectrometer Design

Designs of imaging spectrometers for hyperspectral applications must satisfy stringent aberrations and image quality requirements. Common designs to achieve objective performance are the concentric Offner [20] and Dyson [21] types that use grating elements for dispersion. For dispersion based on prism elements, classical spectrometer designs include a collimator, a prism disperser, and camera elements [22]; or an alternative approach using curved prisms in non-collimated beams, as proposed initially by Féry [23]. For the design of the 120 mm ultrawide FOV LWIR imaging spectrometer in this paper, we have adopted an “Offner concentric structure + curved prism” form. The form takes advantage of the small envelope, the low distortion of the Offner concentric structure, and the high throughput and low polarization sensitivity of the curved prism dispersion element. Figure 5 shows the optical layouts.
Based on the above indexes, the optical form of the spectrometer system was comprehensively selected, including the “four-channel Offner + dual-arm prism”, “dual-channel Offner + dual-arm prism”, “Offner + center dual-prism”, and “Offner + center single prism”. These four optical forms have respective advantages and disadvantages. (a) The four-channel, dual-arm form has four times the dispersion power. However, its prism size is too large, resulting in a large and massive system; (b) the dual-channel, dual-arm form has good aberration correction capability. It is relatively small in size, but its prism thickness is too thick for the nonthermal design of the spectrometer; (c) the central dual-prism form also has four times the dispersion power and a compact structure, but the light is reflected several times, so its energy is lost more severely; and (d) the single central prism form avoids the need for extra aberration correction components and allows better control over the size of the optical elements. In exchange for giving up half of the spectral resolution, the system can be more cryogenically adaptable and have a smaller volume and weight, making it easier to apply cryogenics to suppress background radiation in LWIR imaging spectrometers.
A comprehensive comparison of the above options in terms of performance indicators, processing, and assembly shows that the “Offner + center single prism” configuration is the best choice. Based on the symmetry of the Offner concentric structure, a curved prism is introduced into the Offner concentric structure for a dual-channel configuration to increase the dispersion power. To maintain symmetry, the curved prism is placed in the position of the convex mirror. In addition, to suppress stray light reflected from the prism and reduce polarization sensitivity, the front surface and the back surface of the prism are coated. Meanwhile, the concave mirror was divided into two mirrors, the primary mirror and the tertiary mirror, to boost design flexibility. Figure 6 shows the optical structure. Additionally, Table 2 shows the initial parameters of the mirrors and the curved prism.
Due to the nonlinearity of the refractive index with wavelength, spectrometers based on prisms for dispersion inherently suffer from geometric distortions along the spectral axis (nonlinear dispersion) [24]. However, this problem has only a minimal impact on spectrometers in the long-wave spectrum since most optical materials have weak dispersion nonlinearity in the 8~12.5 µm range [25]. Therefore, using curved prisms as dispersive elements means enjoying high luminous fluxes without extra nonlinear corrections. For this reason, considering the dispersive character and imaging performance of materials in a spatial radiation environment, we have chosen ZnS, which has good dispersion capability in the long-wave spectrum, as the material for the curved prism. In addition, the optical components and mechanical structures of the LWIR imaging spectrometer lead to strong background radiation, which is transferred to the image plane, thus resulting in noise. As a result, the sensitivity of the system can be reduced, and thus the image quality is affected. Cooling the spectrometer system can effectively suppress background radiation. Synthetically, considering the cooling burden and the effect arising from cryogenic temperatures on the instrument’s performance, the optical system is cooled in part using liquid helium to cool the spectroscopic system of the LWIR imaging spectrometer to 123 K. Accordingly, the principle of homogeneity is followed in the design of the optical machine structure, where the structure is made of materials with a low linear expansion coefficient. To be specific, the spectrometer frame is made of low-temperature invar and carbon fiber-reinforced cyanate ester composite, the support structure is made of low-temperature invar, and the primary mirror and tertiary mirror are made of Zerodur. In addition, the linear expansion coefficients of low-temperature invar and Zerodur are 1.55 × 10⁻⁶ and −0.125 × 10⁻⁶ respectively, while the axial linear expansion coefficient of the cyanate-ester composite in use is consistent with that of low-temperature invar.
The design results of the LWIR imaging spectrometer are discussed in detail below. Spot diagrams and the MTF curves for the ultrawide FOV LWIR spectrometer over the whole FOV at the central wavelength of 10 μm are shown in Figure 7 and Figure 8, respectively. The two relatively large RMS of the diffuse spot radius at all FoV appear in the central FOV (0 mm, −4 mm) and the edge FOV (−60 mm, 4 mm) with 25.042 µm and 20.829 µm, respectively, both within 60 µm of a merged image pixel. The MTF curves at the central wavelength for the full FOV coincide almost perfectly with the diffraction limit curve and are more than 0.35 @ 8.35 lp/mm. Moreover, the MTF curves in the tangential and sagittal (TS) directions coincide almost perfectly, and the difference is negligible. It can be seen that the ultrawide FOV LWIR imaging spectrometer’s geometrical image quality meets the requirements of engineering applications.
Smile and keystone are critical spectral and field distortions, respectively, that adversely affect the fidelity of the imaging spectrometer. For the ultra-wide FOV LWIR imager here, these distortions directly affect the image quality and spectral resolution. Figure 9 is the smile and keystone of the LWIR imaging spectrometer. From Figure 9a, it can be seen that the smile is symmetric about the central FOV, and the smile increases as the wavelength decreases, but the maximum smile is only 20.04 µm, which is only 2/3 of a pixel. From Figure 9b, the keystone increases with the increase of the FOV; for the same FOV, the keystone of the edge wavelength is larger than that of the central wavelength, and the maximum keystone is 0.3315 µm, which is only 1/100 of a pixel. The analysis results show that the LWIR imaging spectrometer has good fidelity in its spectral imaging capability. Therefore, it can effectively detect the LWIR band, which makes the LWIR imaging spectrometer have good high-frequency spectral imaging capability.
The “Offner + center single prism” form of the LWIR imaging spectrometer design allows for a high luminous flux. Figure 10 illustrates the image plane energy distribution of the ultrawide FOV LWIR imaging spectrometer. At an operating pixel size of 60 μm, almost every FOV of the central wavelength can meet more than 0.8 energy concentration, and even over 0.7 of the edge wavelengths concentrate within a detector pixel, allowing the detector to accept information more efficiently.
The above design is a simple Offner curved prism imaging spectrometer, containing only one primary mirror, one tertiary mirror, and one curved prism in addition to the slit and image plane. All surfaces of the mirrors and the prism are spherical, which significantly reduces the installation difficulty of the spectrometer and the cost of manufacture. The aperture diaphragm of the spectrometer is retained on the back surface of the curved prism. This design form has high linear dispersion, in addition to the curved prism for dual-channel dispersion, and appropriately increases arm length. It is also possible to increase the total dispersion of the spectrometer in this way. The specific optical path is depicted in Figure 5d. The spectral radiation imagery of the feature is intercepted by the slit at a specific aperture angle; it sequentially passes through the primary mirror, the curved prism, and the tertiary mirror, and eventually enters the detector. Specifically, the light leaves the slit and is reflected by the primary mirror onto the curved prism, where it is first dispersed. Then, as the back side of the curved prism is the reflective surface, the light is reflected by the curved prism and is again dispersed, forming a dual-channel dispersion. Finally, the tertiary mirror reflects the light that has undergone dual-channel dispersion onto the image plane, where the detector receives independent spectral images of the multiple slits. The detector is an HgCdTe plane array detector with the sensitive area at the center of the detector. The detector is mounted on the focal plane of the spectrometer. Corresponding to the geometrical stitching position of the multi-slit, the same method is adopted to stitch the detectors. Furthermore, in measuring the data, 2 × 2 pixels are combined to match the size of the detector with the slit. This means that the FWHM of the point spread function (PSF) must be greater than two pixels at all wavelengths.

4. Experiment Results

4.1. Simulation Results of Cryogenic Refocusing

To facilitate the testing of the spectrometer at different temperatures, the inclined slit refocusing was first simulated before the cryogenic experiment. The slit was tilted by 10° and was set to pass light at 30 μm intervals in its length direction; the image function of the slit was derived directly from the Zemax [26]. Subsequently, the spectrometer’s image function was calculated by Equation (12), and the result was mapped to the corresponding wavelength position to yield the spectral response function, and the change of the spectrometer’s FWHM with FOV at this temperature could be obtained as well. The difference in slit shim thickness between the ambient temperature and the cryogenic temperature was evaluated as 0.8095 mm before the cryogenic simulation, and the slit moved away from the primary mirror. Figure 11 and Figure 12 show the FWHM of the slit image at 293 K and 123 K, respectively, as well as the discrete sampling curve of the slit image at the FOV where the slit image was the clearest.
As indicated by Figure 11 and Figure 12, the slit could image clearly at an FOV of 3.60 mm at 293 K and −1.08 mm at 123 K, corresponding to FWHMs of 83.37 and 83.72 nm, respectively. The movement of the focal point was obtained as (−1.08 − 3.60) × sin10° = −0.8127 mm by Equation (8), only 0.0032 mm different from the direct simulation result, which was within the tolerance of error and revealed that the method could be theoretically feasible.

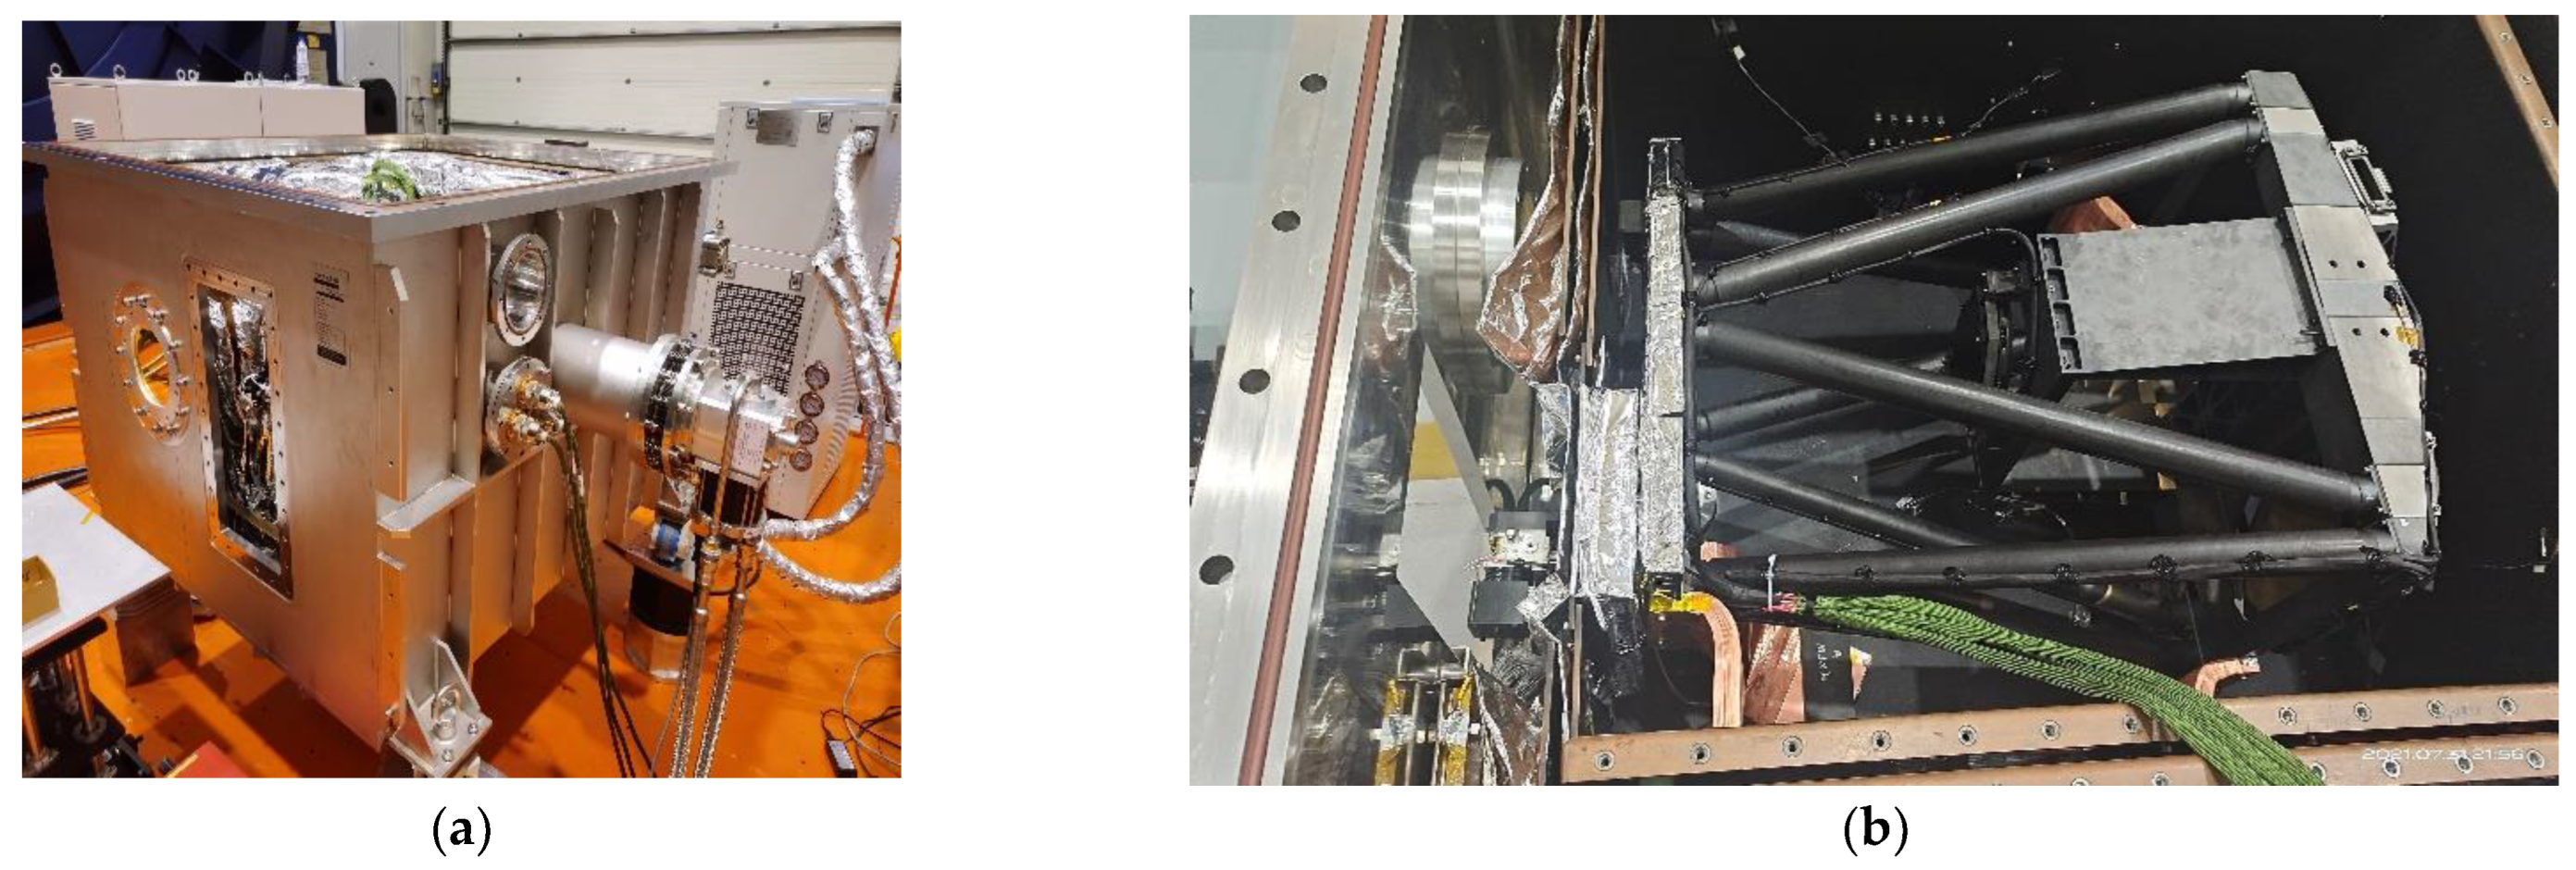
4.2. Experimental Results of Cryogenic Refocusing

Based on the cryogenic operating characteristics of the LWIR imaging spectrometer and the principle of refocusing using the inclined slit, a test system for refocusing the cryogenic imaging spectrometer was established, and the layout is illustrated in Figure 13.
The system primarily consisted of the CO2 laser, the LWIR wavemeter, the fiber splitter, the integrating sphere, the collimator, and the computer. The CO2 laser provided good monochromatic light with a central output wavelength of 10.6 μm. After the laser from the CO2 laser passed through fiber splitters, part of the laser entered the wavemeter for monitoring the laser power and wavelength stability in real-time, while the rest was distributed evenly through the integrating sphere into the collimator. The collimator expanded and collimated the laser to fill the detector’s entrance pupil uniformly. Lastly, the appropriate spectral response was received at the detector and recorded by the computer.
The optomechanical system of the LWIR imaging spectrometer is usually assembled and commissioned at ambient temperature. Subsequently, the slit shim thickness was adjusted at the cryogenic temperature to bring the image plane into alignment with the focal plane. The inclined slit could be adopted to determine the deviation of the image plane from the focal plane at the cryogenic temperature; on that basis, the slit shim thickness could be adjusted so the detector could be installed on the focal plane. After testing at room temperature, the LWIR spectrometer should be placed in the cryogenic vacuum chamber for cryogenic testing, as shown in Figure 14. Before the above procedure, the inclined slit should be installed, and the cooling rate of the cryogenic vacuum chamber should be set to 2.0 K/h.
The method of calculating the deviations from the difference between the FOV and the minimum FWHM at different temperatures had some errors, which were improved. During the cryogenic tests, the absolute mounting height of the slit was measured under a tool microscope, so Δ could be obtained directly from the difference between the absolute mounting height H2 at the cryogenic temperature and the absolute mounting height H1 at the ambient temperature to reduce the error. The measurement principle of tool microscopy is illustrated in Figure 15.
Actually, the slit was customized to pass light at 153 μm intervals in its length direction, and it was illuminated by the 10.6 μm CO2 laser. The straight slit was first tested at an ambient temperature of 293 K. The image of the straight slit and the FWHM of the discrete sampling curve of the slit image are presented in Figure 16. It can be seen that the straight slit could image clearly over the full FOV, and the FWHM is concentrated at 2.1 pixels. The absolute height of the mounting surface of the straight slit was measured with the tool microscope at 20.50 mm.
Subsequently, the slit shim was removed, and the slit was installed in the theoretical image position. The slit was tilted at 10° before the cryogenic vacuum chamber was opened to cool the spectrometer. After the temperature reached a steady state of 123 K, the spectrometer was continuously tested with the CO2 laser. Figure 17 depicts the image of the inclined slit, the FWHM of the discrete sampling curve of the inclined slit image, and the discrete sampling curve of the inclined slit image in pixels.
Figure 17 shows that the response of the detector’s pixels to the inclined slit image was clearly inconsistent, as reflected in the imaging resolution, from left to right, presenting a trend of progressively clearer-clearest-progressively blurrier. This result was achieved due to the presence of focal depth, where it is generally assumed that the image remains clear within the focus depth range. Thus, the middle FOV within that range was considered the FOV with the clearest image, and its spectral response pointed to the spectral response on focusing. The FWHM of the slit image of the spectrometer’s intermediate field of view FOV174 at a cryogenic temperature of 123 K was approximately 2.1 pixels, well consistent with the test results for the straight slit at an ambient temperature of 293 K. The subscript 174 of FOV174 indicates the channel number of FOV. The above result suggests that the LWIR imaging spectrometer had the same spectral resolution at the cryogenic vacuum of 123 K as at an ambient temperature of 293 K; the slit position corresponding to the detector image at this point was the actual slit position after the spectrometer underwent the temperature change.
It was therefore demonstrated that the FOV of the LWIR imaging spectrometer imaging clearest at 123 K was FOV174, corresponding to the absolute height at the edge of the slit shim measured by the tool microscope as 22.95 mm. The absolute height of the mounting surface of the straight slit shim at 293 K was known as 20.50 mm, so the actual slit shim thickness could be calculated as 2.45 mm.
The slit shim was replaced based on the test result, and the slit was restored to straight. The LWIR imaging spectrometer was then tested again at cryogenic temperature to verify that the corrected slit shim could adjust the focal plane to the detector for refocusing. Lastly, the image of the straight slit and the FWHM of the discrete sampling curve of the straight slit image at 123 K are presented in Figure 18, depicting that the slit images were clear in the entire FOV and FWHMs were concentrated at 2.1 pixels. Some values deviate from the expected value of 2.1 pixels at ambient temperature, mainly due to the slight misalignment in the optical axis direction of the FPA with respect to the imaging plane.

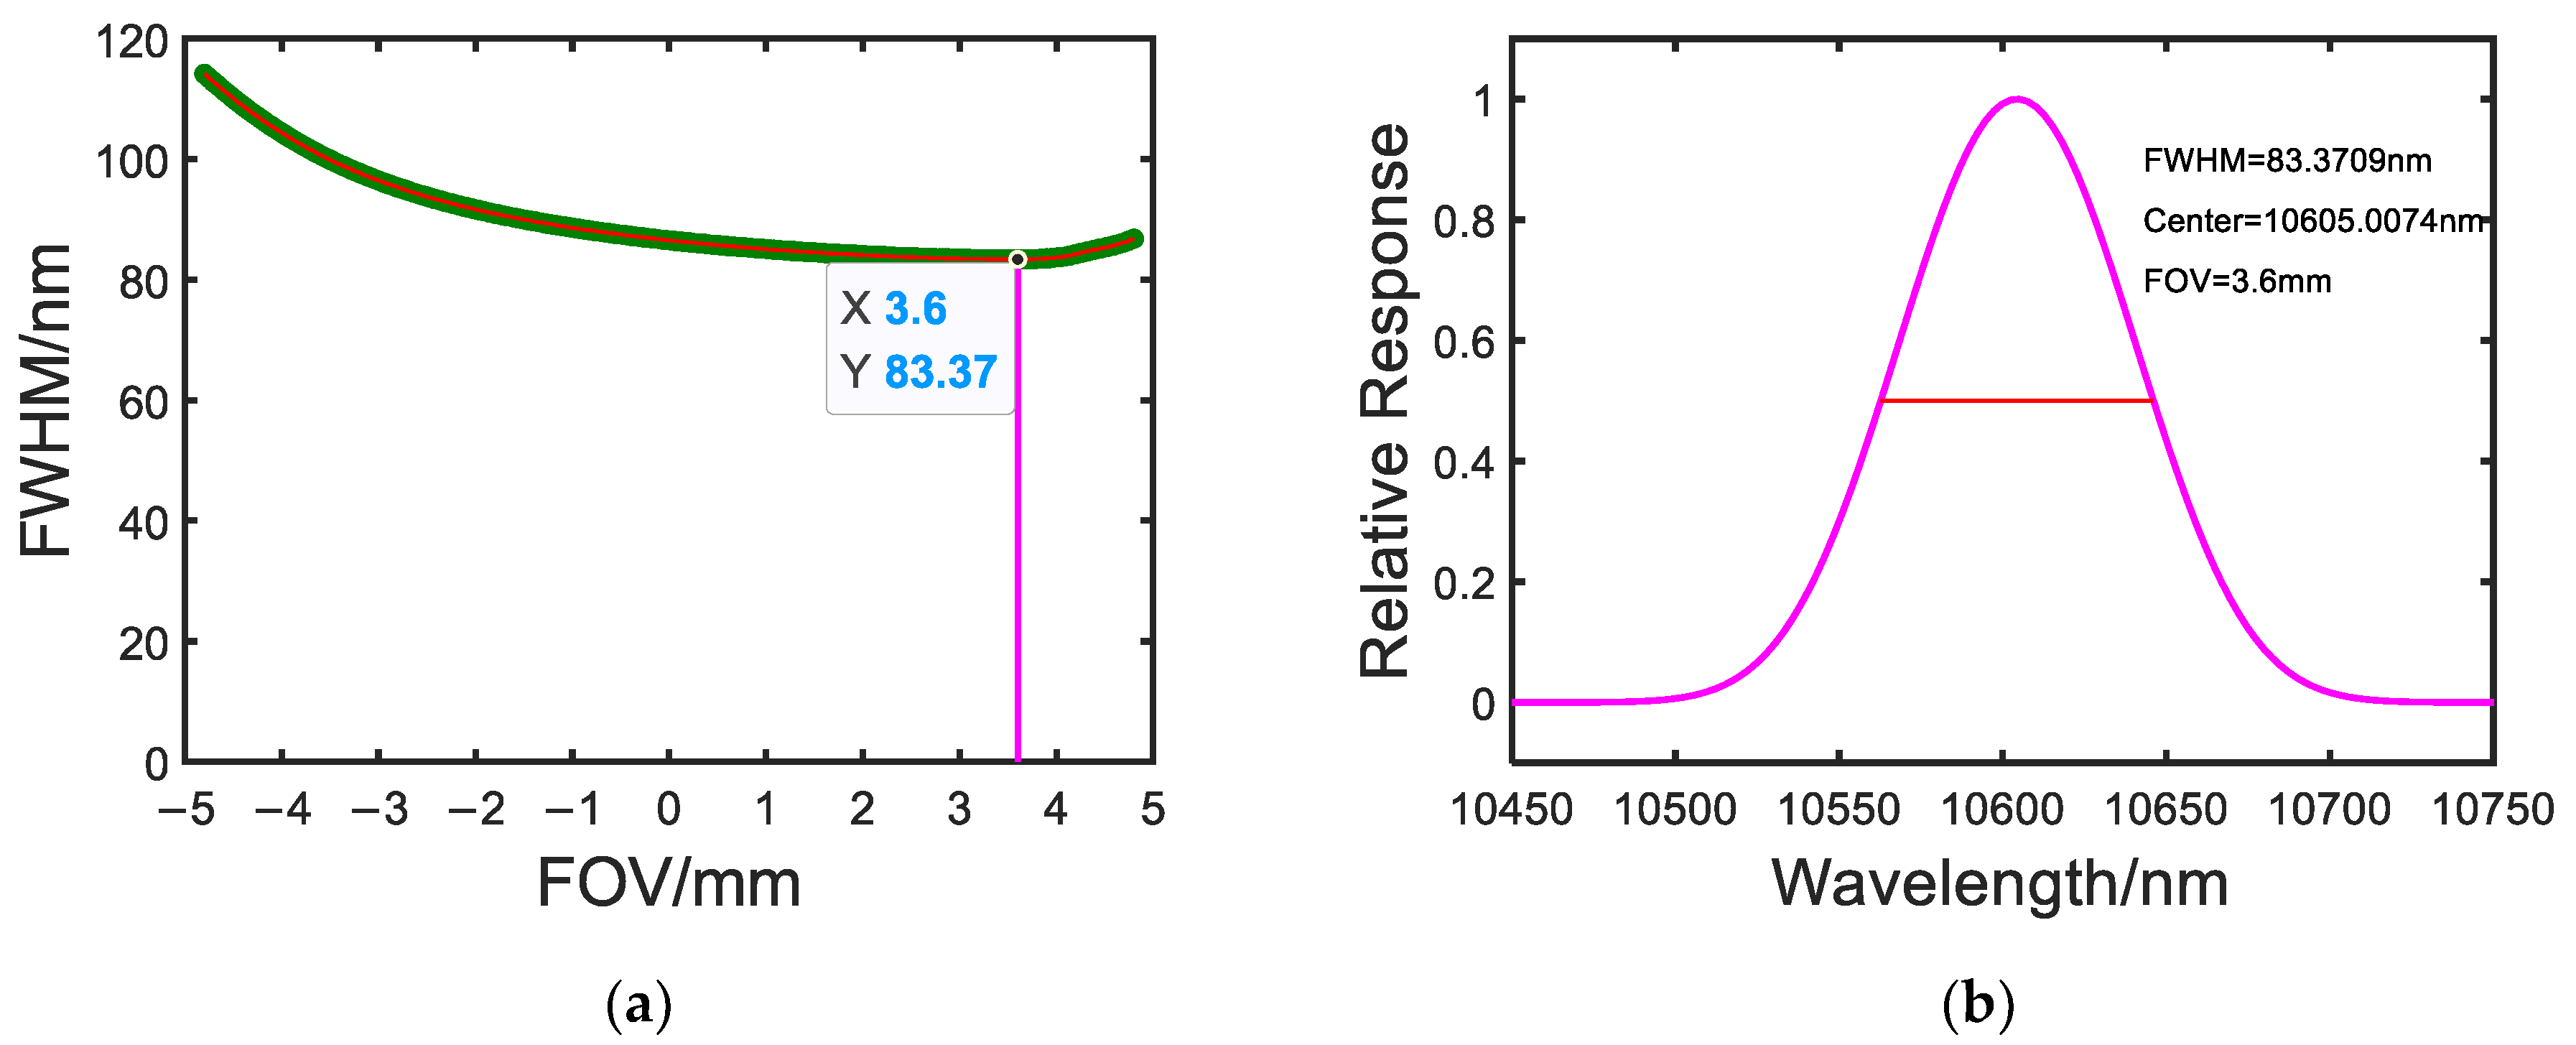
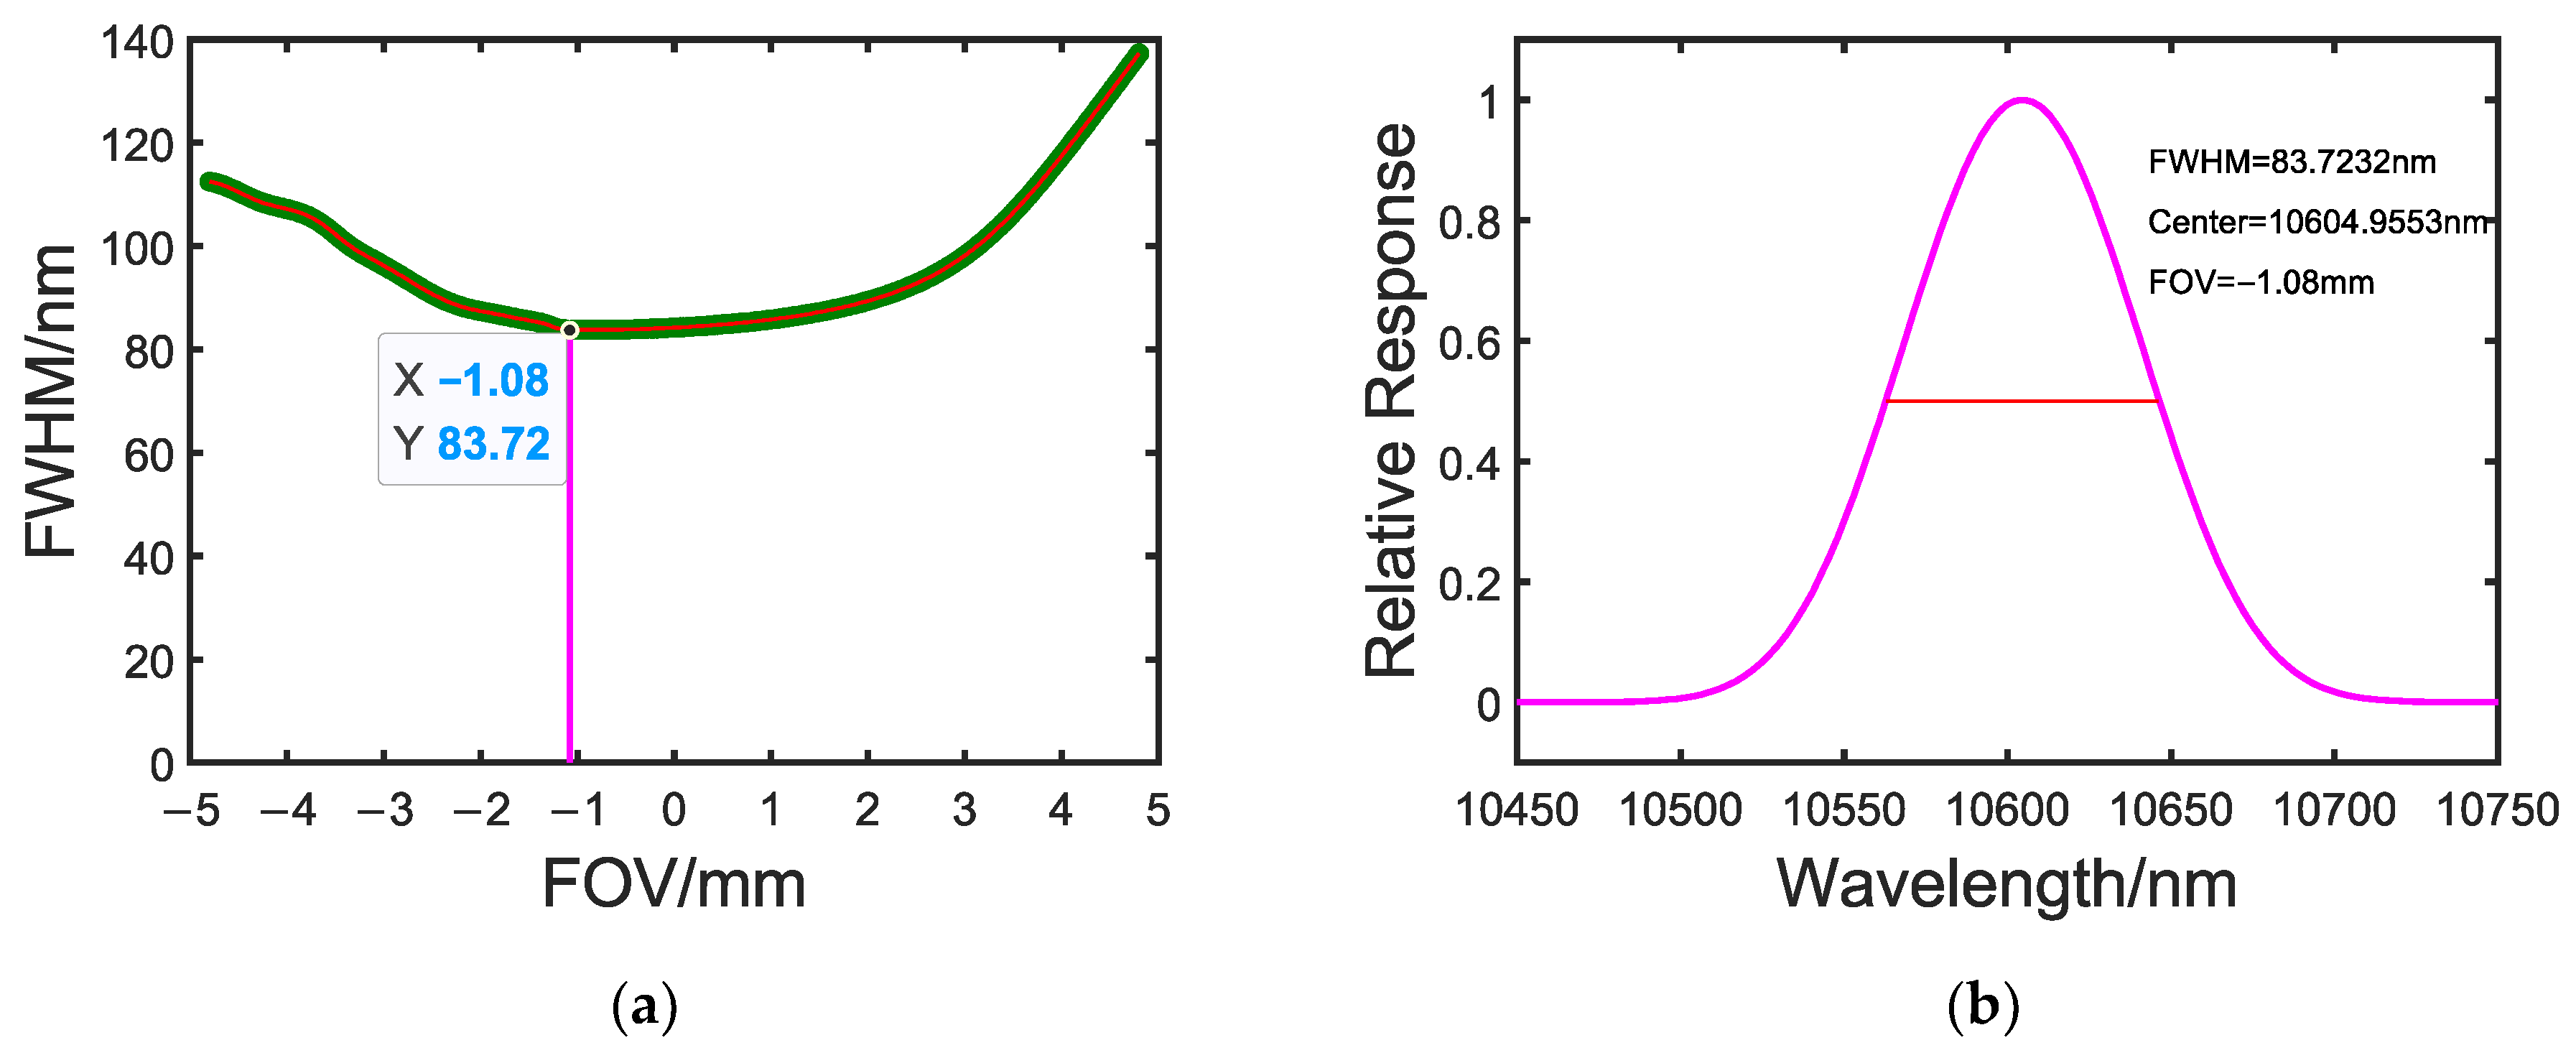
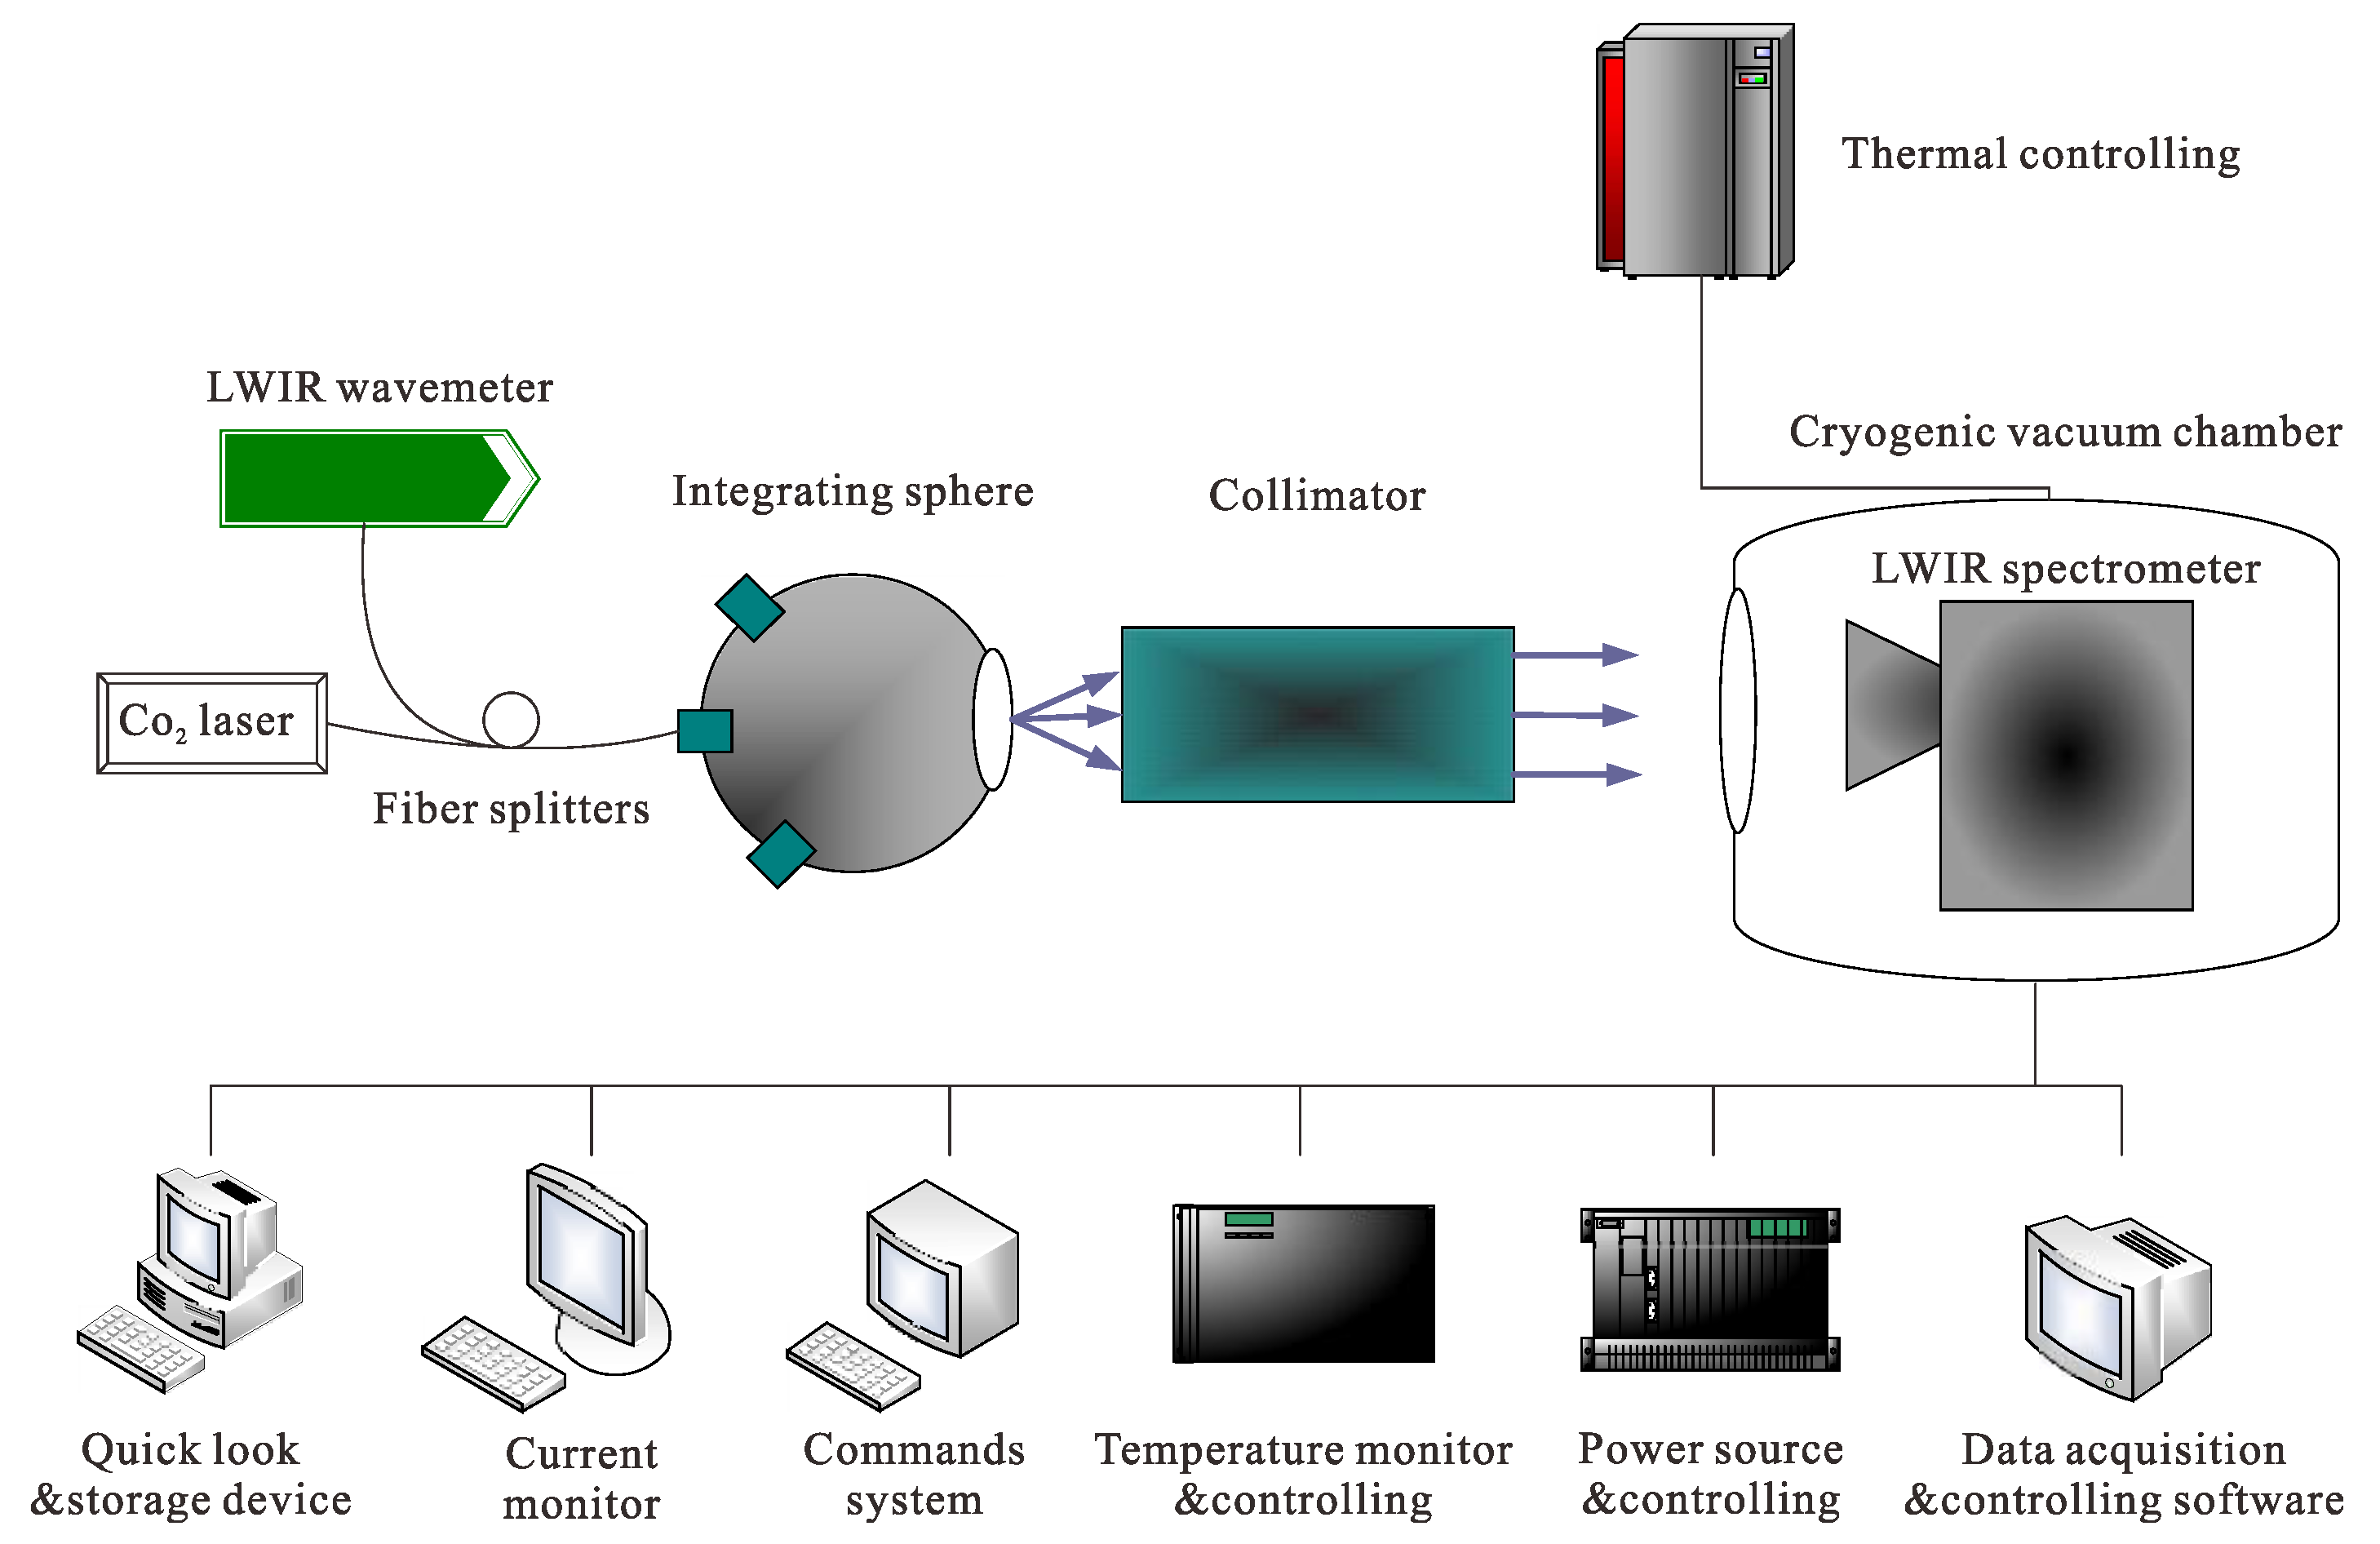
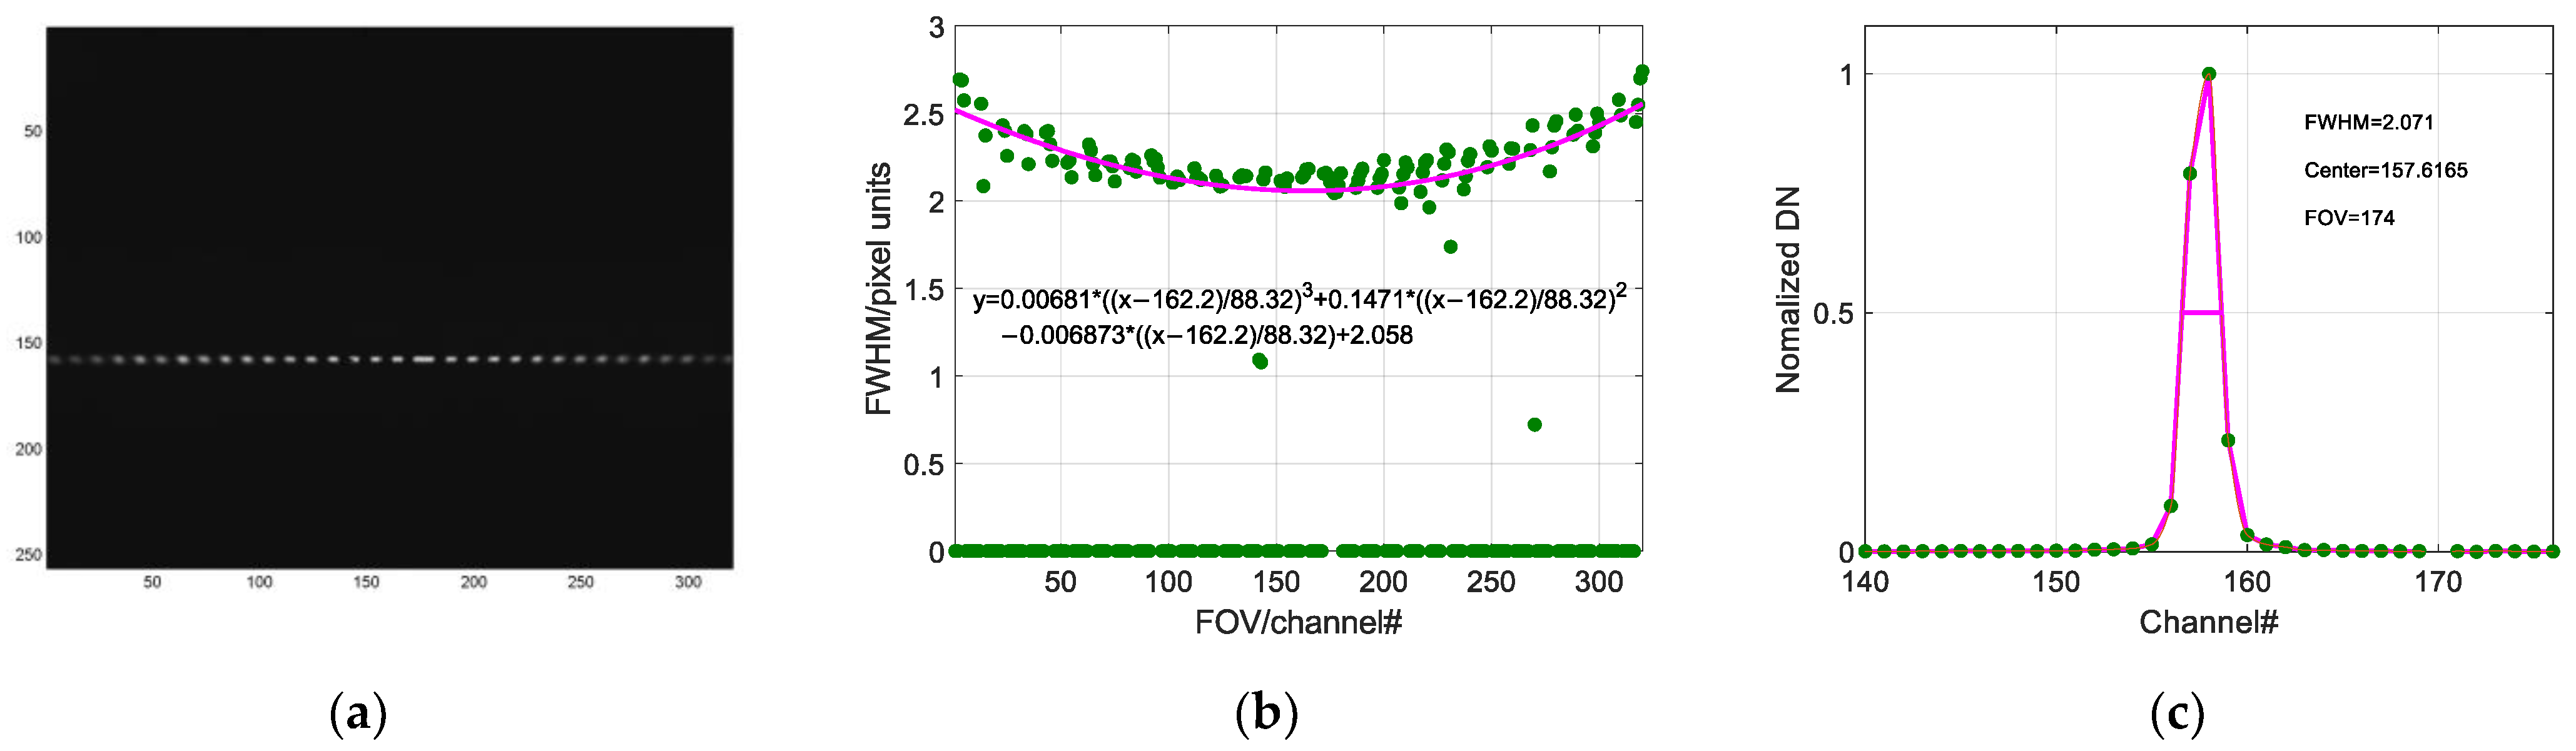
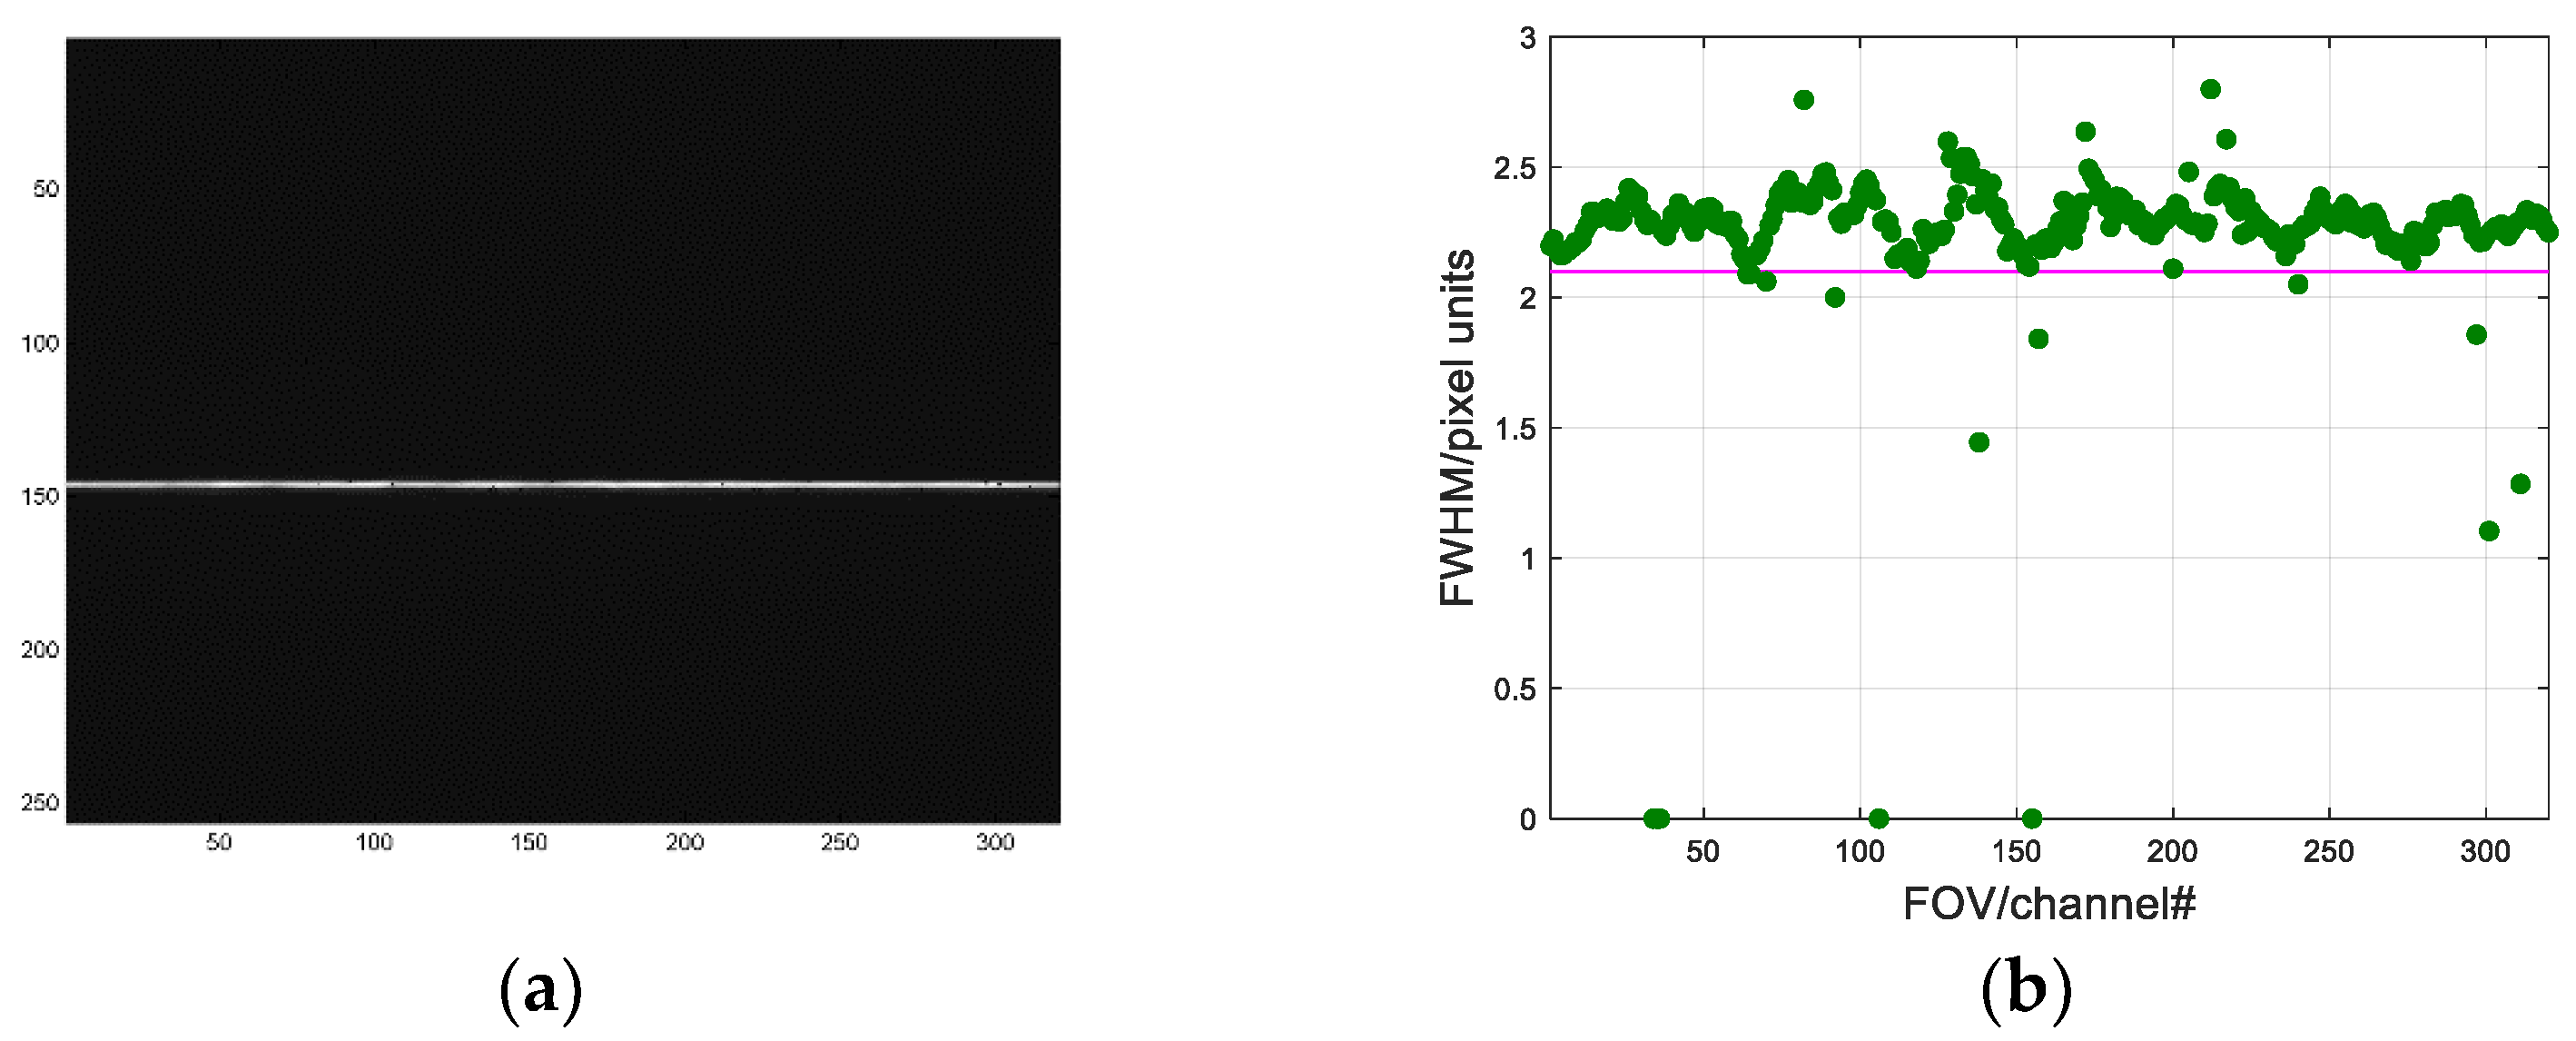
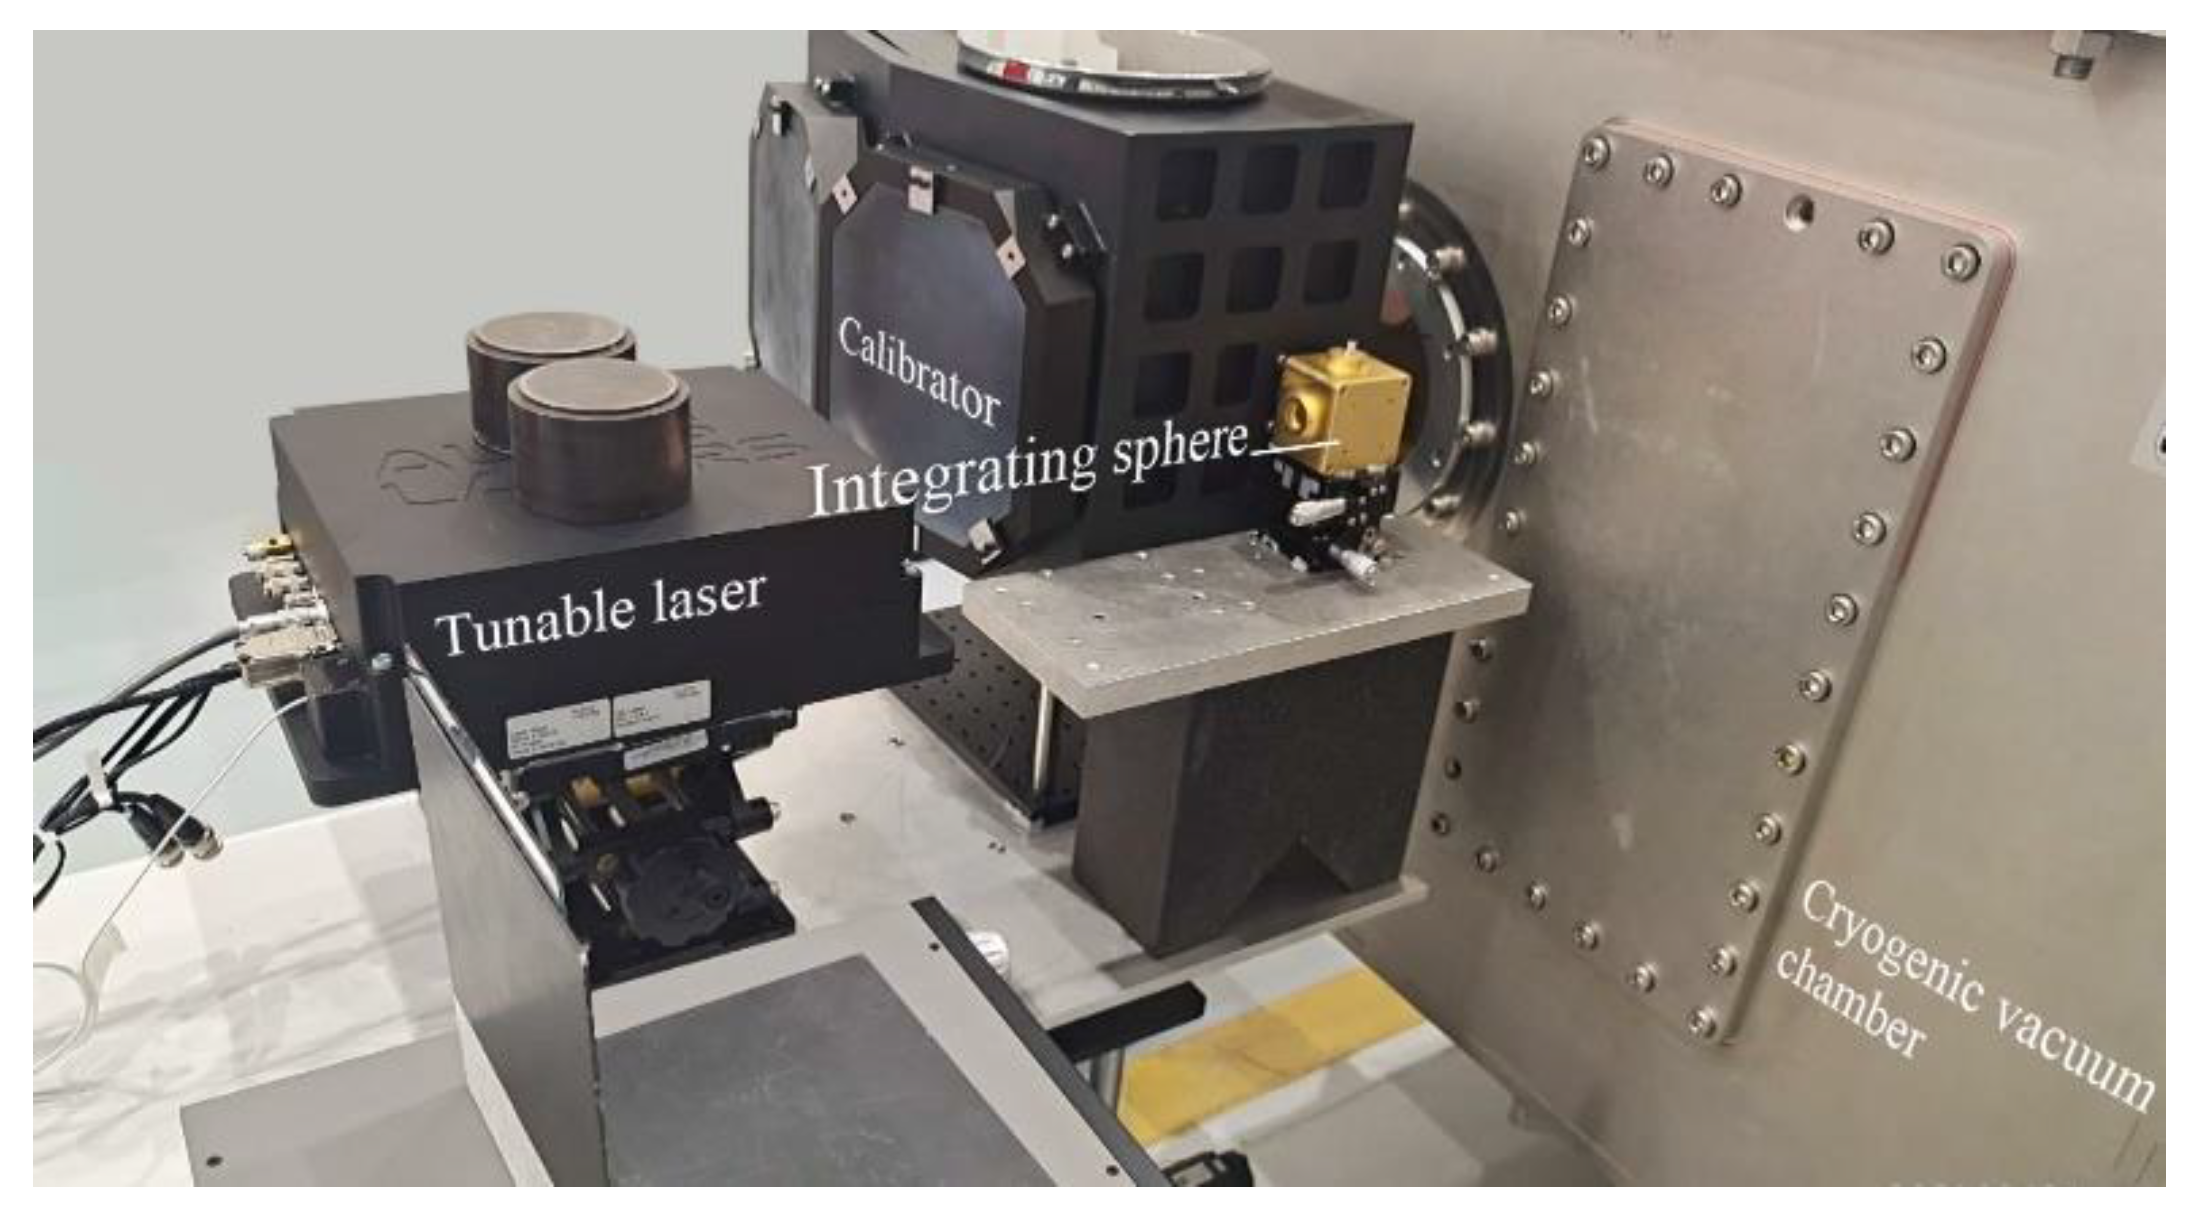
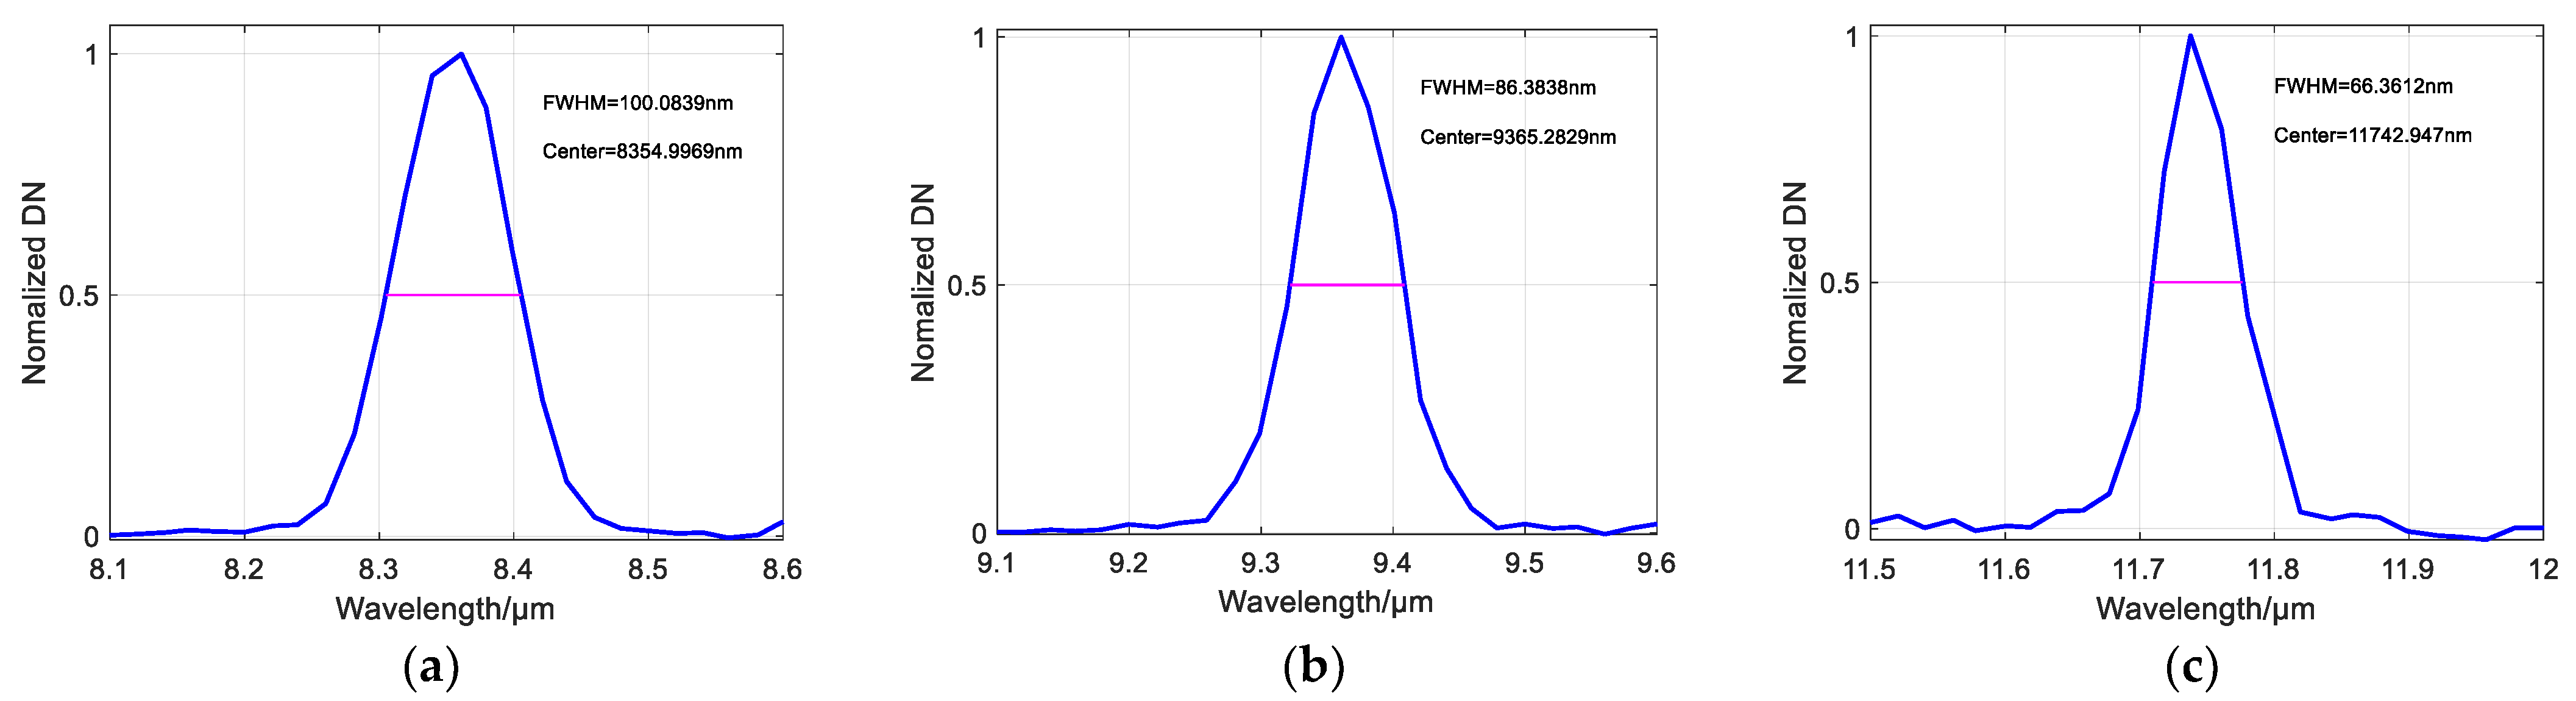
4.3. Experimental Results of Laboratory Spectral Calibration

We completed the assembly of the LWIR imaging spectrometer based on the results of cryogenic refocusing. The design of cryogenic refocusing laid a good foundation for spectral calibration. The spectral response function reflects the spectral detection capability of the imaging spectrometer, and the task of spectral calibration is to determine the spectral response function of each spectral channel to obtain the parameters describing the spectral capability of the system. According to the operating principle of an imaging spectrometer and the object conjugation principle of an imaging system, if the target is a monochromatic point object, a certain pixel of the detector must be conjugated with it; the line position of the conjugated pixel depends on the wavelength of the monochromatic point object, and the column position depends on the FOV of the monochromatic point object. By reading the intensity value of the pixel, the actual spectral response data of the pixel can be obtained, further allowing for the determination of its central wavelength λc and spectral bandwidth FWHM. According to the imaging characteristics of the LWIR imaging spectrometer in geostationary orbit and the principle of spectral calibration, as detailed in Section 2 and Section 3, we have developed a spectral calibration system for the LWIR imaging spectrometer in geostationary orbit. The system is tested for its spectral capability in a cryogenic environment. The ILS curves of pixels in different spectral bands are obtained by building the experimental platform.
For a long-wave infrared imaging spectrometer in geostationary orbit, as long as the response values of each channel of its detector to different wavelengths are measured, the spectral response function of each channel can be obtained through numerical fitting so that the central wavelength and spectral resolution of the system can be calculated. The spectral calibration methods of spectral instruments commonly used are the spectral line lamp method [27] and the continuous spectral calibration method [28]. The spectral line lamp method utilizes the mercury lamp and sodium lamp to transmit spectral lines, which can only realize the wavelength calibration of linear dispersion instruments with a high spectral resolution but not the spectral bandwidth calibration. While the continuous spectral calibration method continuously produces monochromatic collimated light capable of achieving wavelength and bandwidth calibration over a wide spectral range.
Figure 19 shows the principle of the continuous spectral calibration method. Tunable lasers have the feature of narrow linewidth scanning in a continuous tuning range, and they can produce lasers with continuously tunable wavelengths. After the outgoing laser passes through the imaging spectrometer, the target slit image is received by the array detector as a strip distributed along the spatial dimension. When the tunable laser is used for spectral calibration, the wavelength of the output laser is continuously tuned from the short-wave wavelength λS to the long-wave wavelength λL, and the monochromatic strip moves along the spectral dimension accordingly. The DN values of the imager detector are recorded simultaneously, and then the calibration data are analyzed and handled by the corresponding data processing algorithm so that the central wavelength and FWHM are calculated to accomplish the spectral calibration.
Therefore, the spectral calibration was performed using an Alpes Lasers tunable laser with an output line width of 5 nm near 8.5 μm. The output laser from the tunable laser was measured using a Bristol 771B wavelength meter and was calibrated to a wavelength accuracy σ1 better than 1.71 nm. The tunable filter’s output is a continuous monochromatic source that is incident on the inlet hole of the integrating sphere, which can reduce the minor errors caused by inhomogeneous distribution of the incident source or beam shift during measurement. For high measurement accuracy, the opening ratio of the integrating sphere should be as small as possible. To guarantee the F-number of the incident light from the slit, the calibrator calibrates the light from the integrating sphere to maintain the F-number at the design requirement of 5.4. The monochromatic light from the calibrator passes through the slit into the spectrometer and is finally detected and received by the LWIR imaging spectrometer. An array detector receives the target slit image as a strip distributed along the spatial dimension. Subsequently, the tunable laser is controlled stepwise to scan the wavelength. As the tunable laser scans from the short-wave wavelength λS to the long-wave wavelength λL, the monochromatic strips move along the spectral dimension accordingly. The DN value of the output of the geostationary imaging spectrometer is recorded simultaneously. Therefore, the spectral calibration system of the imaging spectrometer consists of the tunable laser, the integrating sphere, the calibrator, the imaging spectrometer to be tested, and the cryogenic vacuum chamber. The layout of the spectral calibration system is shown in Figure 20.
The LWIR imaging spectrometer needs to enter a cryogenic vacuum chamber for testing purposes. When entering the vacuum chamber for testing, the heat delivery surface of the IR detector is connected to the vacuum chamber using a graphene thermal lock to simulate the temperature of the IR detector in orbit. The vacuum in the chamber is less than 1 × 10⁻⁵ Pa; the heat sink temperature is −153 ℃; the target temperature of the detector heat balance is 60 K; the target temperature of the IR detector heat delivery surface is −5 °C. Meanwhile, the detector uses a 32-frame merged output for the spectral performance test. A 2 × 2-pixel merger (2 spatial pixels and 2 spectral pixels) is needed to handle measurement data. The ILS curves of pixels in different bands are obtained through the experimental platform and software processing, as shown in Figure 21. We selected three specific bands. The final measured spectral resolution results for the full spectrum are shown in Figure 22.

5. Discussion

Using conventional single-slit imaging spectrometers to achieve short revisit cycles, high spatial resolution, high temporal resolution, and high signal-to-noise ratios can lead to a complex, oversized, and heavy instrument, resulting in increased risk and cost when deployed to geostationary orbit. In this paper, we show that stitching multiple slits orderly to form an ultrawide FOV and combining the spatial dual-channel multiplexing of curved prisms to provide a high-quality spectral image of ground targets can guarantee a high luminous flux while significantly reducing the system’s complexity. The difference between the operating temperature and the mounting temperature of the LWIR imaging spectrometer requires that we consider the anthermalization design of the spectrometer during the optical-mechanical integration. However, it still inevitably leads to a deviation of the focal plane from the image plane. For this reason, we had to perform an additional cryogenic refocusing design.
The image of the straight slit and the FWHM of the discrete sampling curve of the straight slit image at 123 K after complete refocusing are shown in Figure 18. This revealed that the image plane of the spectrometer coincided with the focal plane, thus proving the method of cryogenic refocusing for the spectrometer with the inclined slit proposed in this paper could be accurate and reliable. Only one cryogenic experiment was needed to obtain the accurate deviations, thus significantly accelerating the design process.
Figure 21 illustrates the ILS curves of pixels in three specific bands, and we noticed that the shape of the curves is almost Gaussian. Meanwhile, it can be seen in Figure 22 that SRF FWHMs in the full spectrum are within 120 nm. This proves that the ultrawide FOV LWIR imaging spectrometer meets the design requirements and can be used for target detection and identification in remote sensing applications.

6. Conclusions

In this paper, we present a cryogenic refocusing LWIR imaging spectrometer with an ultrawide FOV for remote sensing from geostationary orbit. To meet the splicing condition of multi-slit for ultrawide FOV coverage, a high-luminous flux “Offner + center single prism” imaging spectrometer was designed. The developed spectrometer has high imaging quality, small distortion, and spectral uniformity while possessing an ultrawide FOV and a high luminous flux. To suppress the background radiation, obtain a high signal-to-noise ratio, and avoid the deviation of the image plane from the focal plane caused by the difference between operating temperature and mounting temperature, the influence of the deviation on SRF is analyzed, and the simulation theory of SRF is given according to the principle that SRF presents a Gaussian distribution. By tilting the slit to obtain the deviation amount and adjusting the slit shim thickness on this basis, the image plane of the spectrometer coincides with the focal plane. This method can replace complex focusing mechanisms and additional compensating elements, thus simplifying the instrument’s complexity as well as reducing the material dependence of the spectrometer’s athermal design. The position of the focal plane can be determined in one cryogenic test, shortening the design cycle. The measured slit shim thickness was 2.45 mm, and the FWHM achieved using the refocusing method was concentrated at 2.1 pixels at both ambient and cryogenic temperatures, which satisfies the design requirements. The refocusing of the spectrometer could facilitate subsequent spectrum calibrations, and the actual spectral resolution is within 120 nm. This method was confirmed to be simple and accurate, and it could also be extended to the focusing design and cryogenic assembly of the same type of optical system. The work in this paper provides an effective method for promoting the application of LWIR imaging spectrometers in remote sensing.

Author Contributions

Experimental and manuscript writing—initial draft, Y.H.; experimental assistance and manuscript writing—initial draft, Y.Z.; conceptualization, C.L. (Chao Lin); management of projects—funding and design of the optical system, Z.J.; conceptualization and experimental—cryogenic refocusing experiments. H.X.; conceptualization and experimental—spectral performance, C.L. (Chengliang Li); manuscript—revision, J.Z.; experimental assistance, Y.S. and Q.G. All authors have read and agreed to the published version of the manuscript.

Funding

This work was supported by the National Key Research and Development Program of China (No. 2021YFB3901000, 2021YFB3901004) and (No. 2018YFB0504603).

Data Availability Statement

Not applicable.

Conflicts of Interest

The authors declared that there is no conflict of interest.

References

  1. Xue, Q.; Tian, Z.; Yang, B.; Ji, Z.; Luan, X.; Mu, B.; Qiu, X. Optical System Design of Geostationary Hyperspectal Ocean Water Color Imager with Wide Coverage. Acta Photonica Sin. 2020, 49, 0501001. [Google Scholar] [CrossRef]
  2. Guo, L.; Deng, Z.; Tao, J.; Sun, X.; Wang, B.; Pei, S.; Liang, W.; Gu, W. Preliminary research on development of foreign GEO remote sensing satellites. Spacecr. Recovery Remote Sens. 2010, 31, 23–30. [Google Scholar] [CrossRef]
  3. Zhang, L.; Wang, J.; An, Z. Design of a Communication Device of Infrared Thermal Imaging Target Recognition and Tracking System. Adv. Multimed. 2022, 2022, 1995418. [Google Scholar] [CrossRef]
  4. Chrisp, M.P. Wide Swath Imaging Spectrometer Utilizing a Multi-Modular Design. U.S. Patent 7,808,635B2, 4 March 2010. [Google Scholar]
  5. Wang, J.; Li, C.; Lv, G.; Yuan, L.; Liu, E.; Jin, J.; Ji, H. Development of practical thermal infrared hyperspectral imaging system. In Proceedings of the Multispectral, Hyperspectral, and Ultraspectral Remote Sensing Technology, Techniques and Applications V, Beijing, China, 13–16 October 2014; Volume 9263, p. 92630E. [Google Scholar] [CrossRef]
  6. Johnson, W.R.; Hook, S.J.; Mouroulis, P.Z.; Wilson, D.W.; Gunapala, S.D.; Hill, C.J.; Mumolo, J.M.; Eng, B.T. QWEST: Quantum Well Infrared Earth Science Testbed. In Imaging Spectrometry XIII, Proceedings of the Optical Engineering + Applications, San Diego, CA, USA, 27 August 2008; SPIE: Bellingham, WA, USA, 2008; Volume 7086, p. 708606. [Google Scholar] [CrossRef]
  7. Shen, S.; Zhu, J.; Huang, X.; Shen, W. Suppression of the Self-Radiation Stray Light of Long-Wave Thermal Infrared Imaging Spectrometers. In Proceedings of the 5th International Symposium of Space Optical Instruments and Applications, Beijing, China, 5–7 September 2018; Volume 232, pp. 101–110. [Google Scholar] [CrossRef]
  8. Li, C.; Ding, Y.; Lin, C.; Wei, Y.; Zheng, Y.; Zhang, L. Optomechanical design and simulation of a cryogenic infrared spectrometer. Appl. Opt. 2020, 59, 4642–4649. [Google Scholar] [CrossRef] [PubMed]
  9. Hackwell, J.A.; Warren, D.W.; Bongiovi, R.P.; Hansel, S.J.; Hayhurst, T.L.; Mabry, D.J.; Sivjee, M.G.; Skinner, J.W. LWIR/MWIR imaging hyperspectral sensor for airborne and ground-based remote sensing. In Proceedings of the SPIE’s 1996 International Symposium on Optical Science, Engineering, and Instrumentation, Denver, CO, USA, 13 November 1996; Volume 2819, pp. 102–107. [Google Scholar] [CrossRef]
  10. Te Plate, M.; Birkmann, S.; Sirianni, M.; Rumler, P.; Jensen, P.; Ehrenwinkler, R.; Mosner, P.; Karl, H.; Rapp, R.; Wright, R.; et al. JWST’s near infrared spectrograph status and performance overview. In Proceedings of the SPIE Optical Engineering + Applications, San Diego, CA, USA, 14 September 2016; Volume 9973, p. 99730E. [Google Scholar] [CrossRef]
  11. Taccola, M.; Bagnasco, G.; Barho, R.; Caprini, G.C.; Giampietro, M.D.; Gaillard, L.; Mondello, G.; Salvignol, J.C.; Plate, M.T.; Tonetti, N.; et al. The cryogenic refocusing mechanism of NIRSpec opto-mechanical design, analysis, and testing. In Proceedings of the SPIE Astronomical Telescopes + Instrumentation, Marseille, France, 23 July 2008; Volume 7018, p. 70181Z. [Google Scholar] [CrossRef]
  12. Yuan, L.; He, Z.; Lv, G.; Wang, Y.; Li, C.; Xie, J.; Wang, J. Optical design, laboratory test, and calibration of airborne long wave infrared imaging spectrometer. Opt. Express. 2017, 25, 22440–22454. [Google Scholar] [CrossRef] [PubMed]
  13. Zhang, Y. Optical Technology of Long-Wave Infrared Hyperspectral Imaging; Shanghai Institute of Technical Physics: Shanghai, China, 2016. [Google Scholar]
  14. Duncan, B.D.; Bos, P.J.; Sergan, V. Wide-angle achromatic prism beam steering for infrared countermeasure applications. Opt. Eng. 2003, 42, 1038–1047. [Google Scholar] [CrossRef]
  15. Palmer, T.A.; Alexay, C.C.; Vogel, S. Somewhere under the rainbow: The visible to far infrared imaging lens. In Proceedings of the SPIE Defense, Security, and Sensing, Orlando, FL, USA, 20 May 2011; Volume 8012, p. 801223. [Google Scholar] [CrossRef]
  16. Kruse, F.A.; McDowell, M. Analysis of multispectral and hyperspectral longwave infrared (LWIR) data for geologic mapping. In Proceedings of the Algorithms and Technologies for Multispectral, Hyperspectral, and Ultraspectral Imagery XXI, Baltimore, MD, USA, 21 May 2015; Volume 9472, p. 94721E. [Google Scholar] [CrossRef]
  17. Hall, J.L.; Boucher, R.H.; Buckland, K.N.; Gutierrez, D.J.; Hackwell, J.A.; Johnson, B.R.; Keim, E.R.; Moreno, N.M.; Ramsey, M.S.; Sivjee, M.G.; et al. MAGI: A new high-performance airborne thermal-infrared imaging spectrometer for earth science applications. IEEE Trans. Geosci. Remote Sens. 2015, 53, 5447–5457. [Google Scholar] [CrossRef]
  18. Notesco, G.; Weksler, S.; Ben-Dor, E. Application of Hyperspectral Remote Sensing in the Longwave Infrared Region to Assess the Influence of Dust from the Desert on Soil Surface Mineralogy. Remote Sens. 2020, 12, 1388. [Google Scholar] [CrossRef]
  19. Zare, A.; Bolton, J.; Gader, P.; Schatten, M. Vegetation Mapping for Landmine Detection Using Long-Wave Hyperspectral Imagery. IEEE Trans. Geosci. Remote Sens. 2008, 46, 172–178. [Google Scholar] [CrossRef]
  20. Zhang, J.; Zheng, Y.; Lin, C.; Ji, Z.; Wu, H. Analysis method of the Offner hyperspectral imaging spectrometer based on vector aberration theory. Appl. Opt. 2021, 60, 264–275. [Google Scholar] [CrossRef] [PubMed]
  21. Montero-Orille, C.; Prieto-Blanco, X.; González-Núñez, H.; Fuente, R.d.l. Design of Dyson imaging spectrometers based on the Rowland circle concept. Appl. Opt. 2011, 50, 6487–6494. [Google Scholar] [CrossRef] [PubMed]
  22. Content, R.; Sharples, R.M.; Blake, S.; Talbot, R.G. EUCLID: Design of the prism DMD NIR spectrograph. In Proceedings of the SPIE Astronomical Telescopes + Instrumentation, San Diego, CA, USA, 10 August 2010; Volume 7731, p. 77312Y. [Google Scholar] [CrossRef]
  23. FÉRY, C. A prism with curved faces, for spectrograph or spectroscope. Astrophys. J. 1911, 34, 79–87. [Google Scholar] [CrossRef]
  24. Wang, J. Analysis about Spectral Resolving Power of Imaging Spectrometer. Chin. J. Infrared Res. 1990, 9, 277–286. [Google Scholar]
  25. Gao, Z.; Jia, R.; Zhang, H.; Xia, Z.; Fang, W. Simulation and Analysis of Spectral Response Function and Bandwidth of Spectrometer. Int. J. Aerospace. Eng. 2016, 2016, 2759121. [Google Scholar] [CrossRef] [Green Version]
  26. Zemax (An Ansys Company); OpticsAcademy (Optics Studio). Available online: https://www.zemax.com (accessed on 1 August 2022).
  27. Zheng, Y. Precise spectral calibration for hyperspectral imager. Opt. Precision Eng. 2010, 18, 2347–2354. [Google Scholar]
  28. Zadnik, J.; Guerin, D.; Moss, R.; Orbeta, A.; Dixon, R.; Simi, C.G.; Dunbar, S.; Hill, A. Calibration procedures and measurements for the COMPASS hyperspectral imager. In Proceedings of the Defense and Security, Orlando, FL, USA, 12 August 2004; Volume 55425, pp. 182–1188. [Google Scholar] [CrossRef]
Figure 1. Schematic diagram of multi-slit stitching for ultrawide FOV (slit plane).
Remotesensing 14 05799 g001
Figure 2. Instantaneous projection of a multi-slit LWIR imaging spectrometer (detector plane).
Remotesensing 14 05799 g002
Figure 3. Assembly diagram of the multi-slit element.
Remotesensing 14 05799 g003
Figure 4. The change in focusing FOV position before and after cooling.
Remotesensing 14 05799 g004
Figure 5. Optical layouts of an ultrawide FOV LWIR imaging spectrometer. (a) Four-channel Offner + dual-arm prism; (b) Dual-channel Offner + dual-arm prism; (c) Offner + center dual-prism; (d) Offner + center single prism.
Remotesensing 14 05799 g005
Figure 6. Optical structure of the ultrawide FOV LWIR imaging spectrometer.
Remotesensing 14 05799 g006
Figure 7. Spot diagrams of the LWIR imaging spectrometer for the fields ((−60 mm, −4 mm), (−30 mm, −4 mm), (0 mm, −4 mm), (−60 mm, 4 mm), (−30 mm, 4 mm), and (0 mm, 4 mm)) along the slit for the central wavelength of 10 μm. The size of the scale box equals that of two detector pixels (60 μm × 60 μm).
Remotesensing 14 05799 g007
Figure 8. MTF curves for the fields ((−60 mm, −4 mm), (−30 mm, −4 mm), (0 mm, −4 mm), (−60 mm, 4 mm), (−30 mm, 4 mm), and (0 mm, 4 mm)) along the slit for the central wavelength of 10 μm.
Remotesensing 14 05799 g008
Figure 9. Smile and Keystone. (a) Smile; (b) Keystone.
Remotesensing 14 05799 g009
Figure 10. Diffraction encircled energy curves for the fields ((−60 mm, −4 mm), (−30 mm, −4 mm), (0 mm, −4 mm), (−60 mm, 4 mm), (−30 mm, 4 mm), and (0 mm, 4 mm)) along the slit for the central wavelength of 10 μm.
Remotesensing 14 05799 g010
Figure 11. Simulation of the inclined slit image at 293 K. (a) the FWHM of the slit image; (b) the discrete sampling curve of the slit image.
Remotesensing 14 05799 g011
Figure 12. Simulation of the inclined slit image at 123 K. (a) the FWHM of the slit image; (b) the discrete sampling curve of the slit image.
Remotesensing 14 05799 g012
Figure 13. Layout of the refocusing test system.
Remotesensing 14 05799 g013
Figure 14. (a) A schematic diagram of the cryogenic vacuum chamber; (b) A layout of the inner cryogenic vacuum chamber.
Remotesensing 14 05799 g014
Figure 15. Principle diagram of the measurement under a tool microscope.
Remotesensing 14 05799 g015
Figure 16. Imaging of the straight slit at 293 K. (a) a straight slit image; (b) the FWHM of the straight slit image.
Remotesensing 14 05799 g016
Figure 17. Imaging of the straight slit at 123 K. (a) The image of the straight slit; (b) the FWHM of the inclined slit image; (c) the discrete sampling curve of the inclined slit image by pixels.
Remotesensing 14 05799 g017
Figure 18. Imaging of the straight slit at 123 K. (a) The image of straight slit; (b) FWHM of straight slit image.
Remotesensing 14 05799 g018
Figure 19. Continuous spectral calibration method.
Remotesensing 14 05799 g019
Figure 20. Layout of the spectral calibration system of the LWIR imaging spectrometer.
Remotesensing 14 05799 g020
Figure 21. ILS curves of pixels at four specific wavelengths. (a) Specific band 1; (b) Specific band 2; (c) Specific band 3.
Remotesensing 14 05799 g021
Figure 22. Measured spectral resolution in the full spectrum.
Remotesensing 14 05799 g022
Table 1. Main specifications of the LWIR imaging spectrometer.
ParameterValue
Spectral ranges8~12.5 μm
Numerical aperture0.0923
Slit length120 mm
Spectral resolution<120 nm
Dispersion width3.75 mm
Pixel size30 μm × 30 μm
Pixel array320 × 256
Table 2. Initial parameters of the LWIR imaging spectrometer.
SurfaceRadius/mmDistance/mmTilt/°
Primary mirror−776.45764.86−7.6315
Curved prism (front surface)−411.57−374.42−16.446
Curved prism (back surface)−399.9033.13−11.9203
Triple mirror−776.45375.21−7.2913
Publisher’s Note: MDPI stays neutral with regard to jurisdictional claims in published maps and institutional affiliations.

