1. Introduction
Pollen allergy is a disease that causes patients to present with IgE-induced (immunoglobulin E) allergy symptoms after inhalation or exposure to pollen allergens [
1], such as allergic rhinitis, allergic conjunctivitis, asthma, urticaria, and allergic dermatitis. In Europe, more than 15% of the population suffers from pollen allergies, and the proportion of pollen allergy sufferers is much higher in urban areas [
2]. In China, the probability of diseases caused by pollen allergies is 0.5–1.0%, reaching approximately 5% in densely populated areas [
3], and the rate of incidence is increasing continuously [
4]. For pollen-allergic patients, the most direct way of relieving the symptoms of pollen allergy is to suggest the use of protective gear during the pollen allergy period. Hence, effectively predicting the outbreak date of pollen allergies can help to inform patients for when protection is necessary.
Airborne pollen is an important cause of pollen allergies [
5], and the outbreak date of pollen is closely related to vegetation phenology. Remote sensing data have been widely used in vegetation phenology monitoring [
6,
7]. Therefore, using remote sensing data to reveal the outbreak date of pollen allergies and the greenness characteristics before the outbreak date can facilitate the prevention of pollen allergy diseases.
Current related studies on pollen allergy monitoring based on remote sensing data mainly focus on detecting pollen sources [
8,
9], extracting the flowering date [
10,
11], and identifying spectral features of pollen [
12,
13,
14]. Satellite-based monitoring of the flowering date is difficult due to the short flowering period (5–30 days) and the relatively weak spectral signals of flowers at large scales. Satellite data with coarse spatial resolution (e.g., Landsat and MODIS) have fewer applications for monitoring flowering dates due to their low ability to distinguish optical signals of flowering. However, the flowering date is closely related to the phenological characteristics of vegetation greenness [
15]. Therefore, the satellite data with moderate and low spatial resolution are able to indirectly reflect the flowering date through the earlier greenness characteristics of vegetation despite its inability to directly detect the spectral signals of flowering, which provides a possibility to monitor the outbreak date of pollen allergy.
The flowering period and pollen concentration are closely related to the symptoms of pollen allergy sufferers [
16], so the current prediction models for pollen allergy outbreaks are mainly established to forecast the start date of flowering and the concentration of airborne pollen. Høgda et al. [
17] predicted the start of the pollen season of Nordic birch based on the relationship between the normalized difference vegetation index (NDVI) and the phenology records of sites. Karlsen et al. [
10] produced a map to characterize the onset of the birch pollen season utilizing NDVI satellite data. Khwarahm et al. [
18] developed a technique to estimate the flowering phenophase of birch and grass from MERIS terrestrial chlorophyll index (MTCI) time-series data. Since the start date of the pollen season was recorded by monitoring the concentration of airborne pollen at sites, some studies started to predict the outbreak date of pollen allergies through the empirical relationship between pollen concentration and meteorological parameters [
19]. For instance, He et al. [
20] established a statistical model for pollen concentration prediction in Beijing combined with meteorological data. Iglesias et al. [
21] developed a pollen concentration prediction model of sycamores in northwestern Spain based on temperature data. Myszkowska et al. [
22] constructed a pollen concentration prediction model based on the relationship between the pollen concentration of multiple vegetation types and meteorological parameters in southern Poland. However, pollen monitors can only reflect pollen concentrations at the site scale because of their limited spatial coverage. Predicting pollen concentration based on the empirical relationship between pollen concentration and meteorological parameters tends to ignore the effects of other environmental factors on pollen concentration [
23]. Therefore, some studies have developed pollen concentration prediction models based on remote sensing data, such as using machine learning methods to establish the relationship between pollen concentration and remote sensing data to predict future pollen concentrations [
23,
24,
25,
26]. However, neither the start date of flowering nor the concentration of pollen can fully reflect the outbreak date of pollen allergy, as they are only necessary conditions for pollen allergy rather than sufficient conditions. For example, the pollen concentration is also high in southern China in spring and autumn [
27], but the concurrent number of pollen allergic patients is smaller than that in northern China [
28]. This contradiction is because pollen allergy is caused by the allergenic pollen concentration rather than the total pollen concentration, and it is also related to seasonal changes in human immunity [
29]. Therefore, it is necessary to establish a direct relationship between the incidence of pollen allergy (rather than flowering date or pollen concentration) and remote sensing data to predict the outbreak date of pollen allergy.
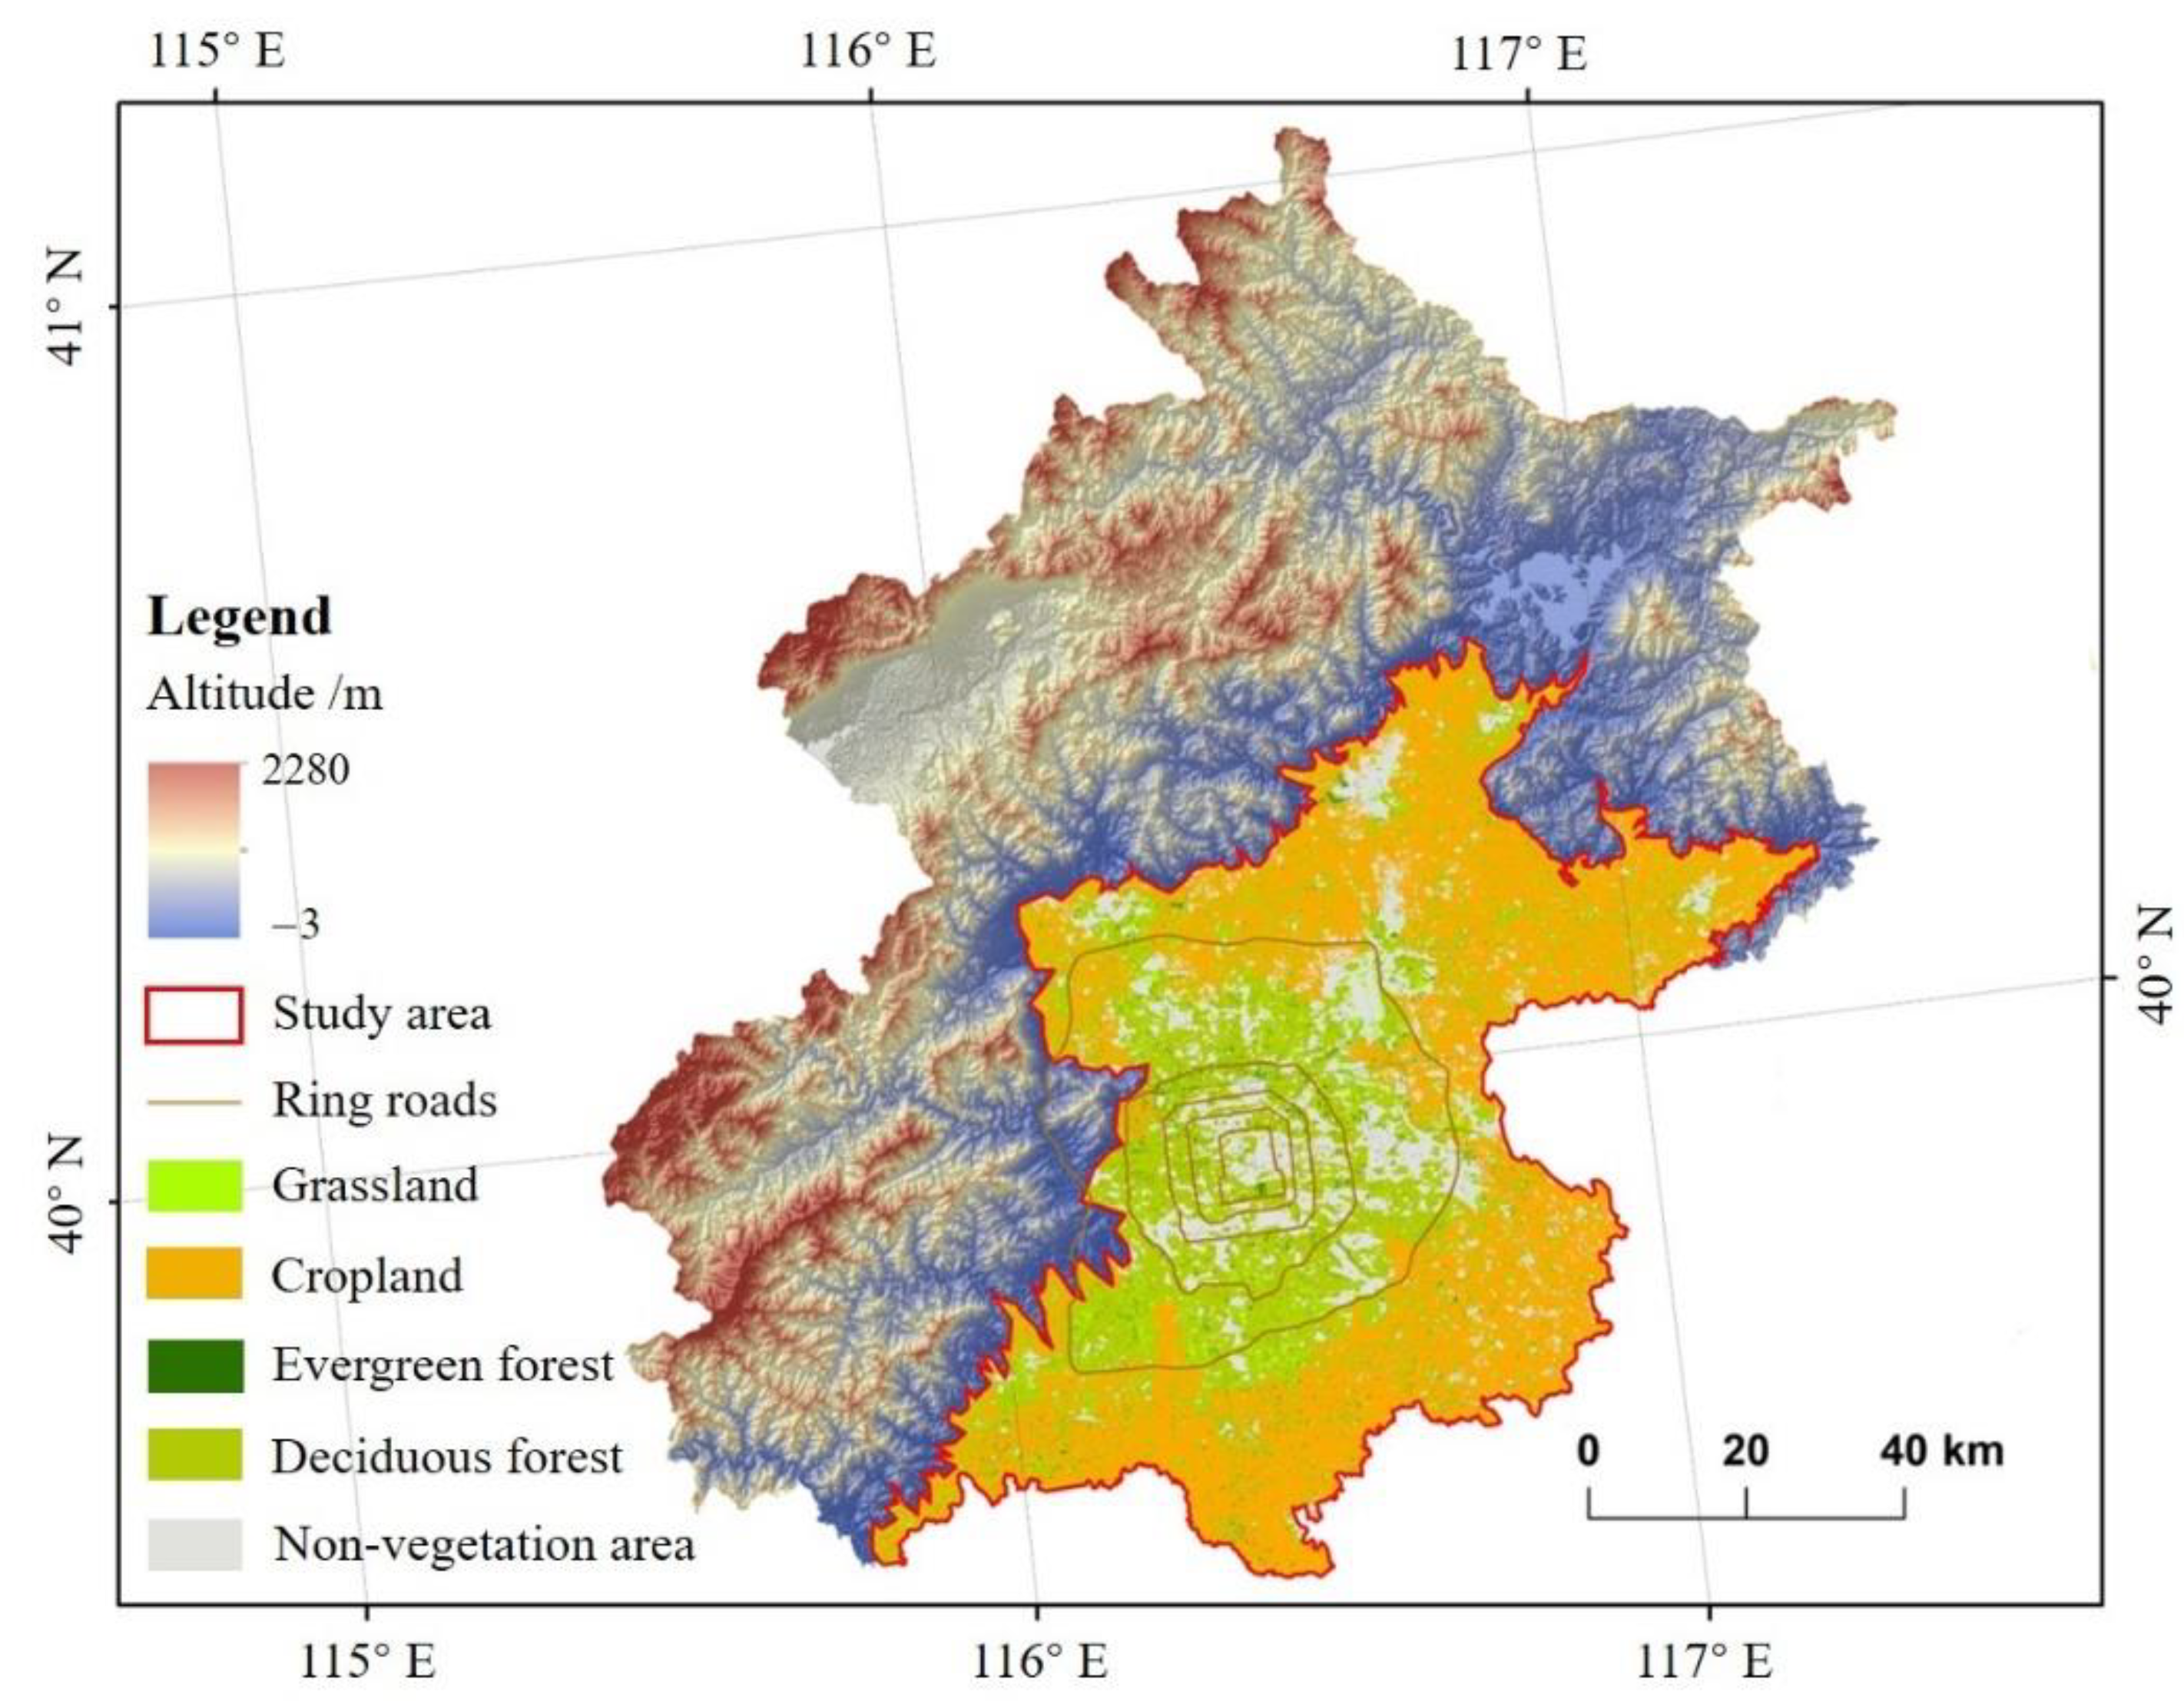
Beijing has various plants with allergenic pollen due to the warm temperate semi-humid climate [
30], and the three main plants that cause pollen allergy in spring are cypress, poplar, and willow (especially cypress), whose flowering periods are all close to each other [
31], resulting in a high risk of pollen allergy [
32]. Shi [
33] found that one-quarter to one-third of respiratory allergy patients in Beijing are allergic to pollen. Wang et al. [
34] discovered that the pollen concentration in Beijing has two peaks, spring (March to April) and summer-autumn (August to September), where allergic pollen mainly comes from woody plants in spring and herbaceous plants in summer-autumn. Meanwhile, the incidence of pollen allergies also has an obvious seasonal pattern, with a high incidence mainly in spring and autumn [
35]. To benefit pollen allergic patients in Beijing, researchers have established a pollen concentration prediction model based on meteorological parameters since 2016 to predict recent pollen concentrations in all districts of Beijing [
36]. However, the prediction model can only forecast pollen concentration at sites and tends to ignore the effects of other environmental factors on pollen concentration due to the limit of pollen monitor amounts and the uncomprehensive representativeness of meteorological parameters. To address this problem, some scholars have started to apply satellite data to build pollen concentration prediction models in Beijing. Bian et al. [
23] established a next-day pollen concentration prediction model based on the average vegetation leaf area index (LAI) and daily meteorological data of tree and grass growth areas in Beijing with a nonlinear autoregressive neural network model (NARXnet). Although the prediction model has a high accuracy, the forecast period is very short, i.e., only for the next day but not for the medium or long term (e.g., the next 10 days or one month), and the forecast content is the total pollen concentration rather than the incidence of pollen allergy. Therefore, it is still difficult to aid the prevention of pollen allergies.
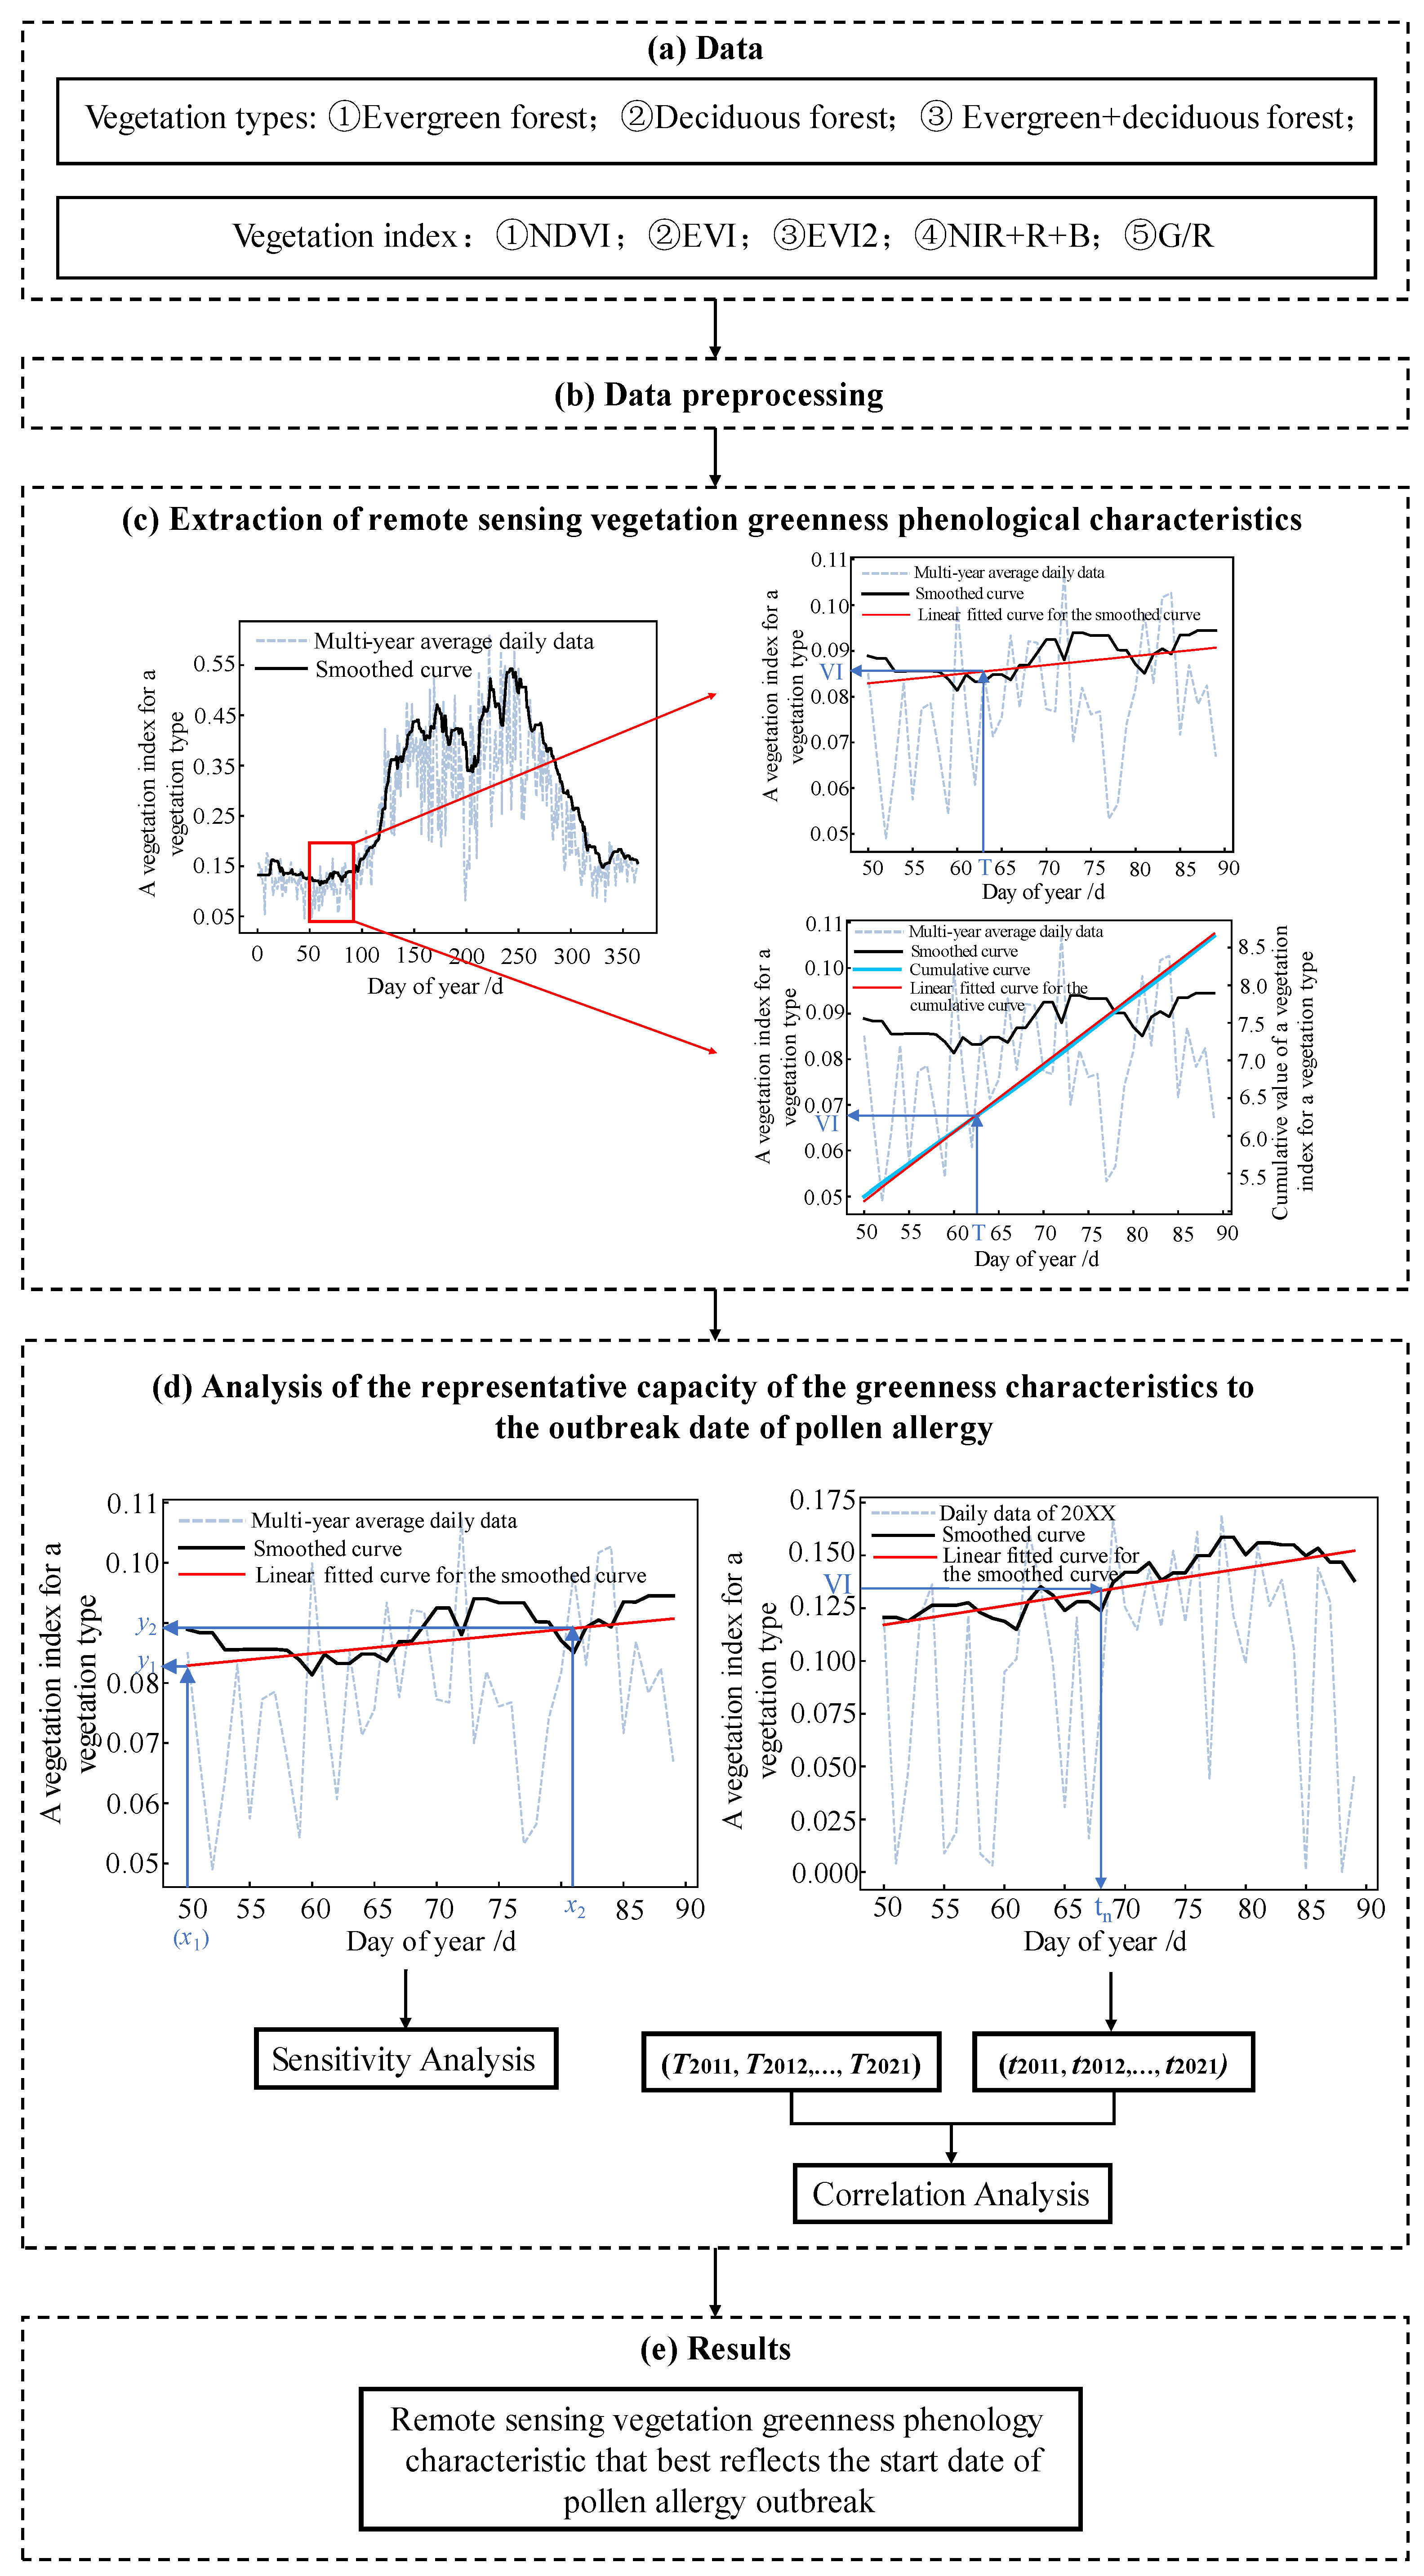
Although there are two peak periods for pollen allergy in Beijing, spring and summer-autumn, we focused on the spring pollen allergy and its vegetation phenological characteristics for prediction models, considering that the vegetation phenology changes more obviously in spring. This study aims to address two issues: first, to reveal the satellite-derived phenological characteristics of vegetation greenness on and before the outbreak date of spring pollen allergy in Beijing; and second, to establish a direct prediction model for the outbreak date of spring pollen allergy in Beijing based on the satellite-derived phenological characteristics of vegetation greenness.
5. Conclusions
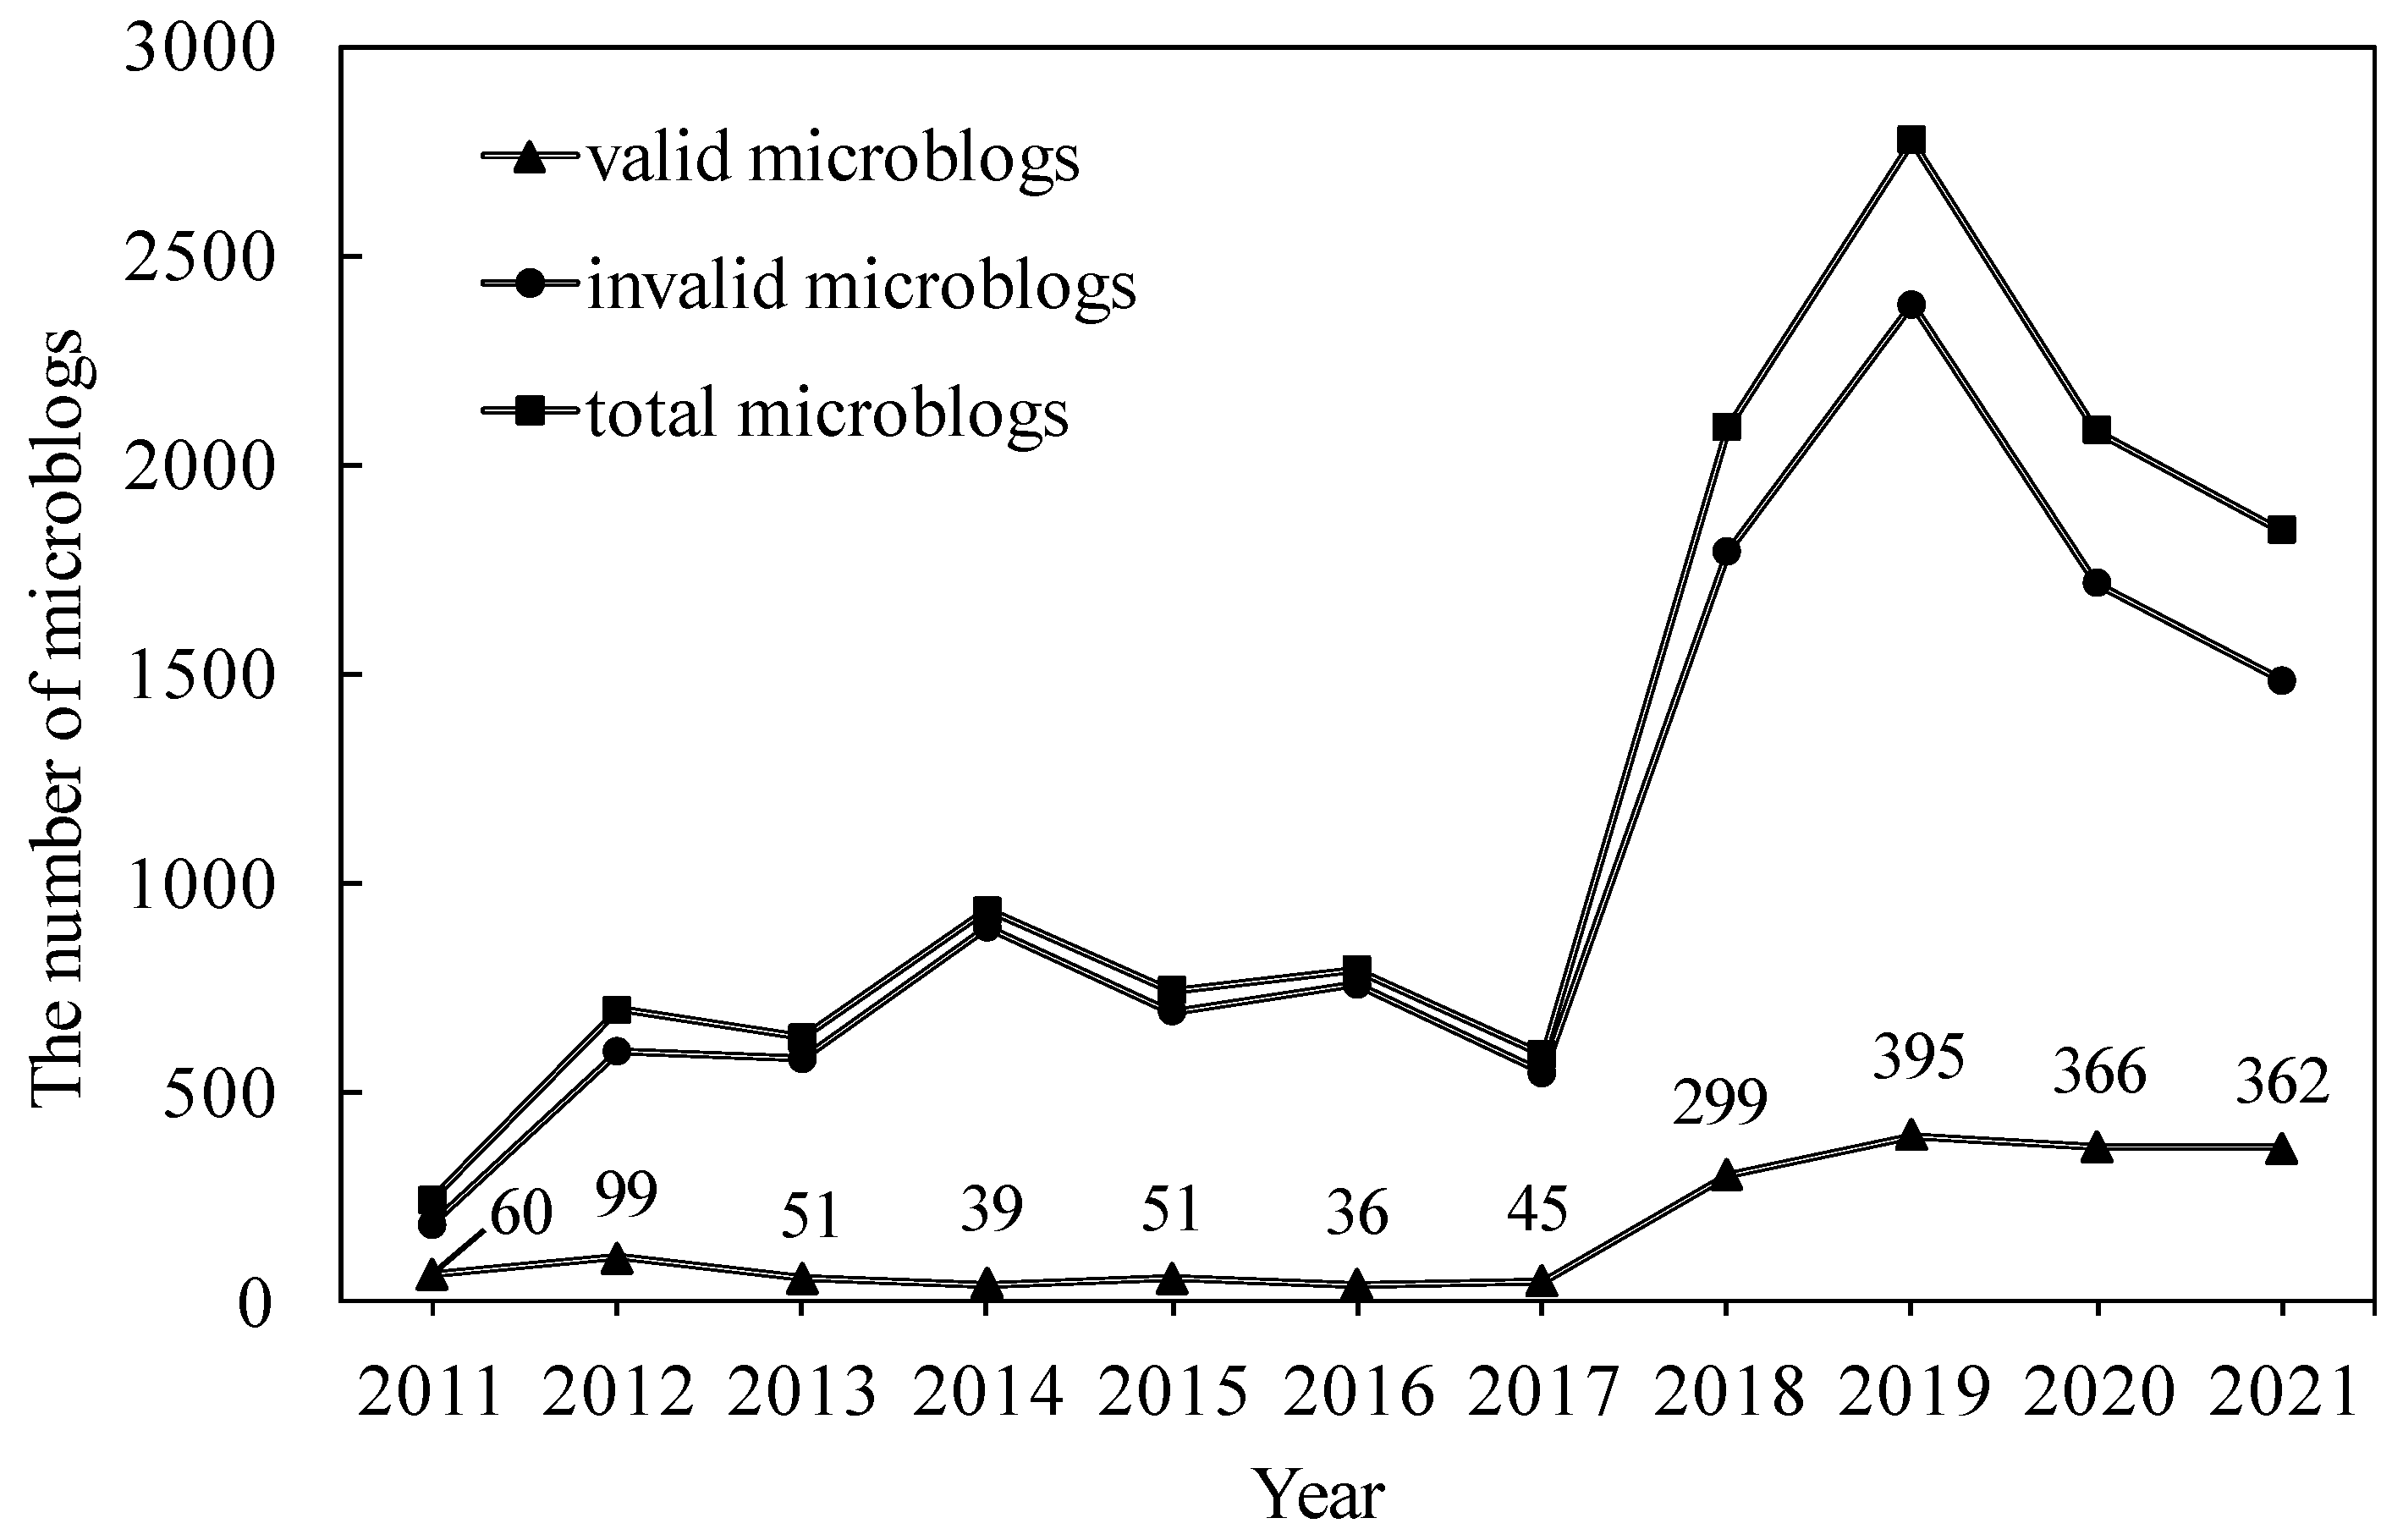
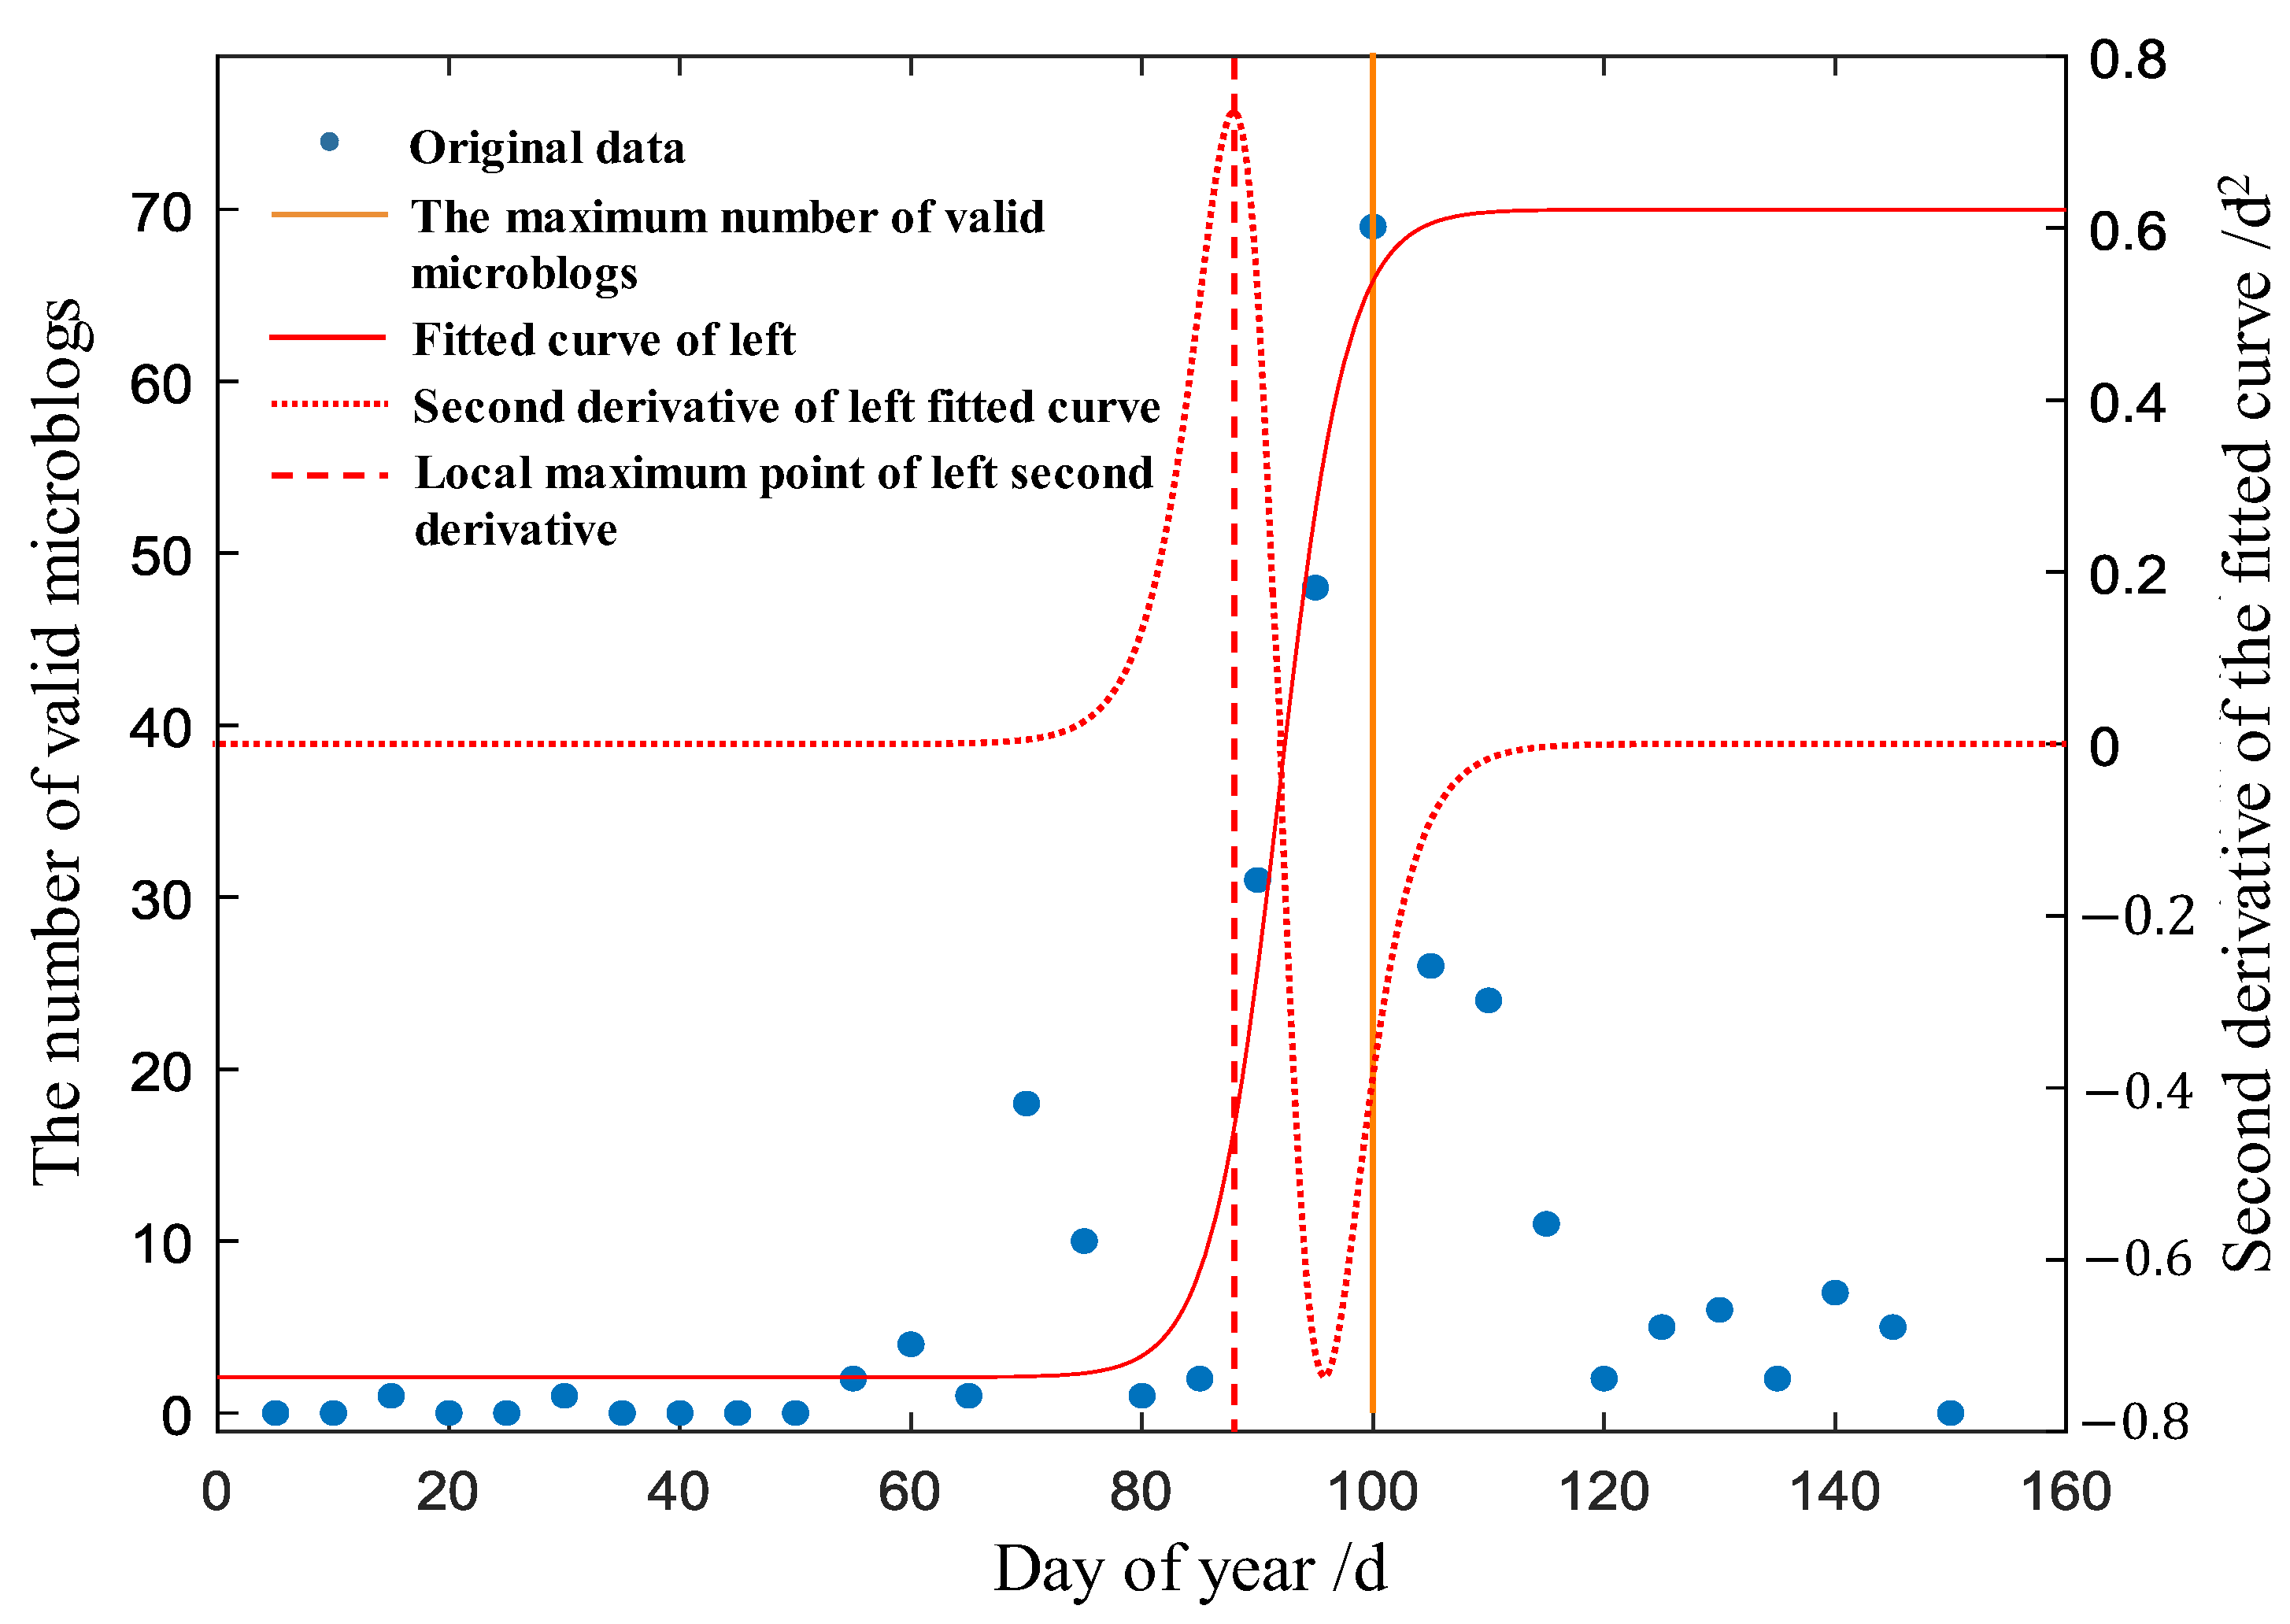
This study revealed the satellite-derived phenological characteristics of vegetation greenness before the spring pollen allergy outbreak in Beijing based on 11-year Sina Weibo data and corresponding satellite data, and established a prediction model to forecast the outbreak date of spring pollen allergies in Beijing based on the phenological characteristics that best reflect spring pollen allergies. The main conclusions are as follows.
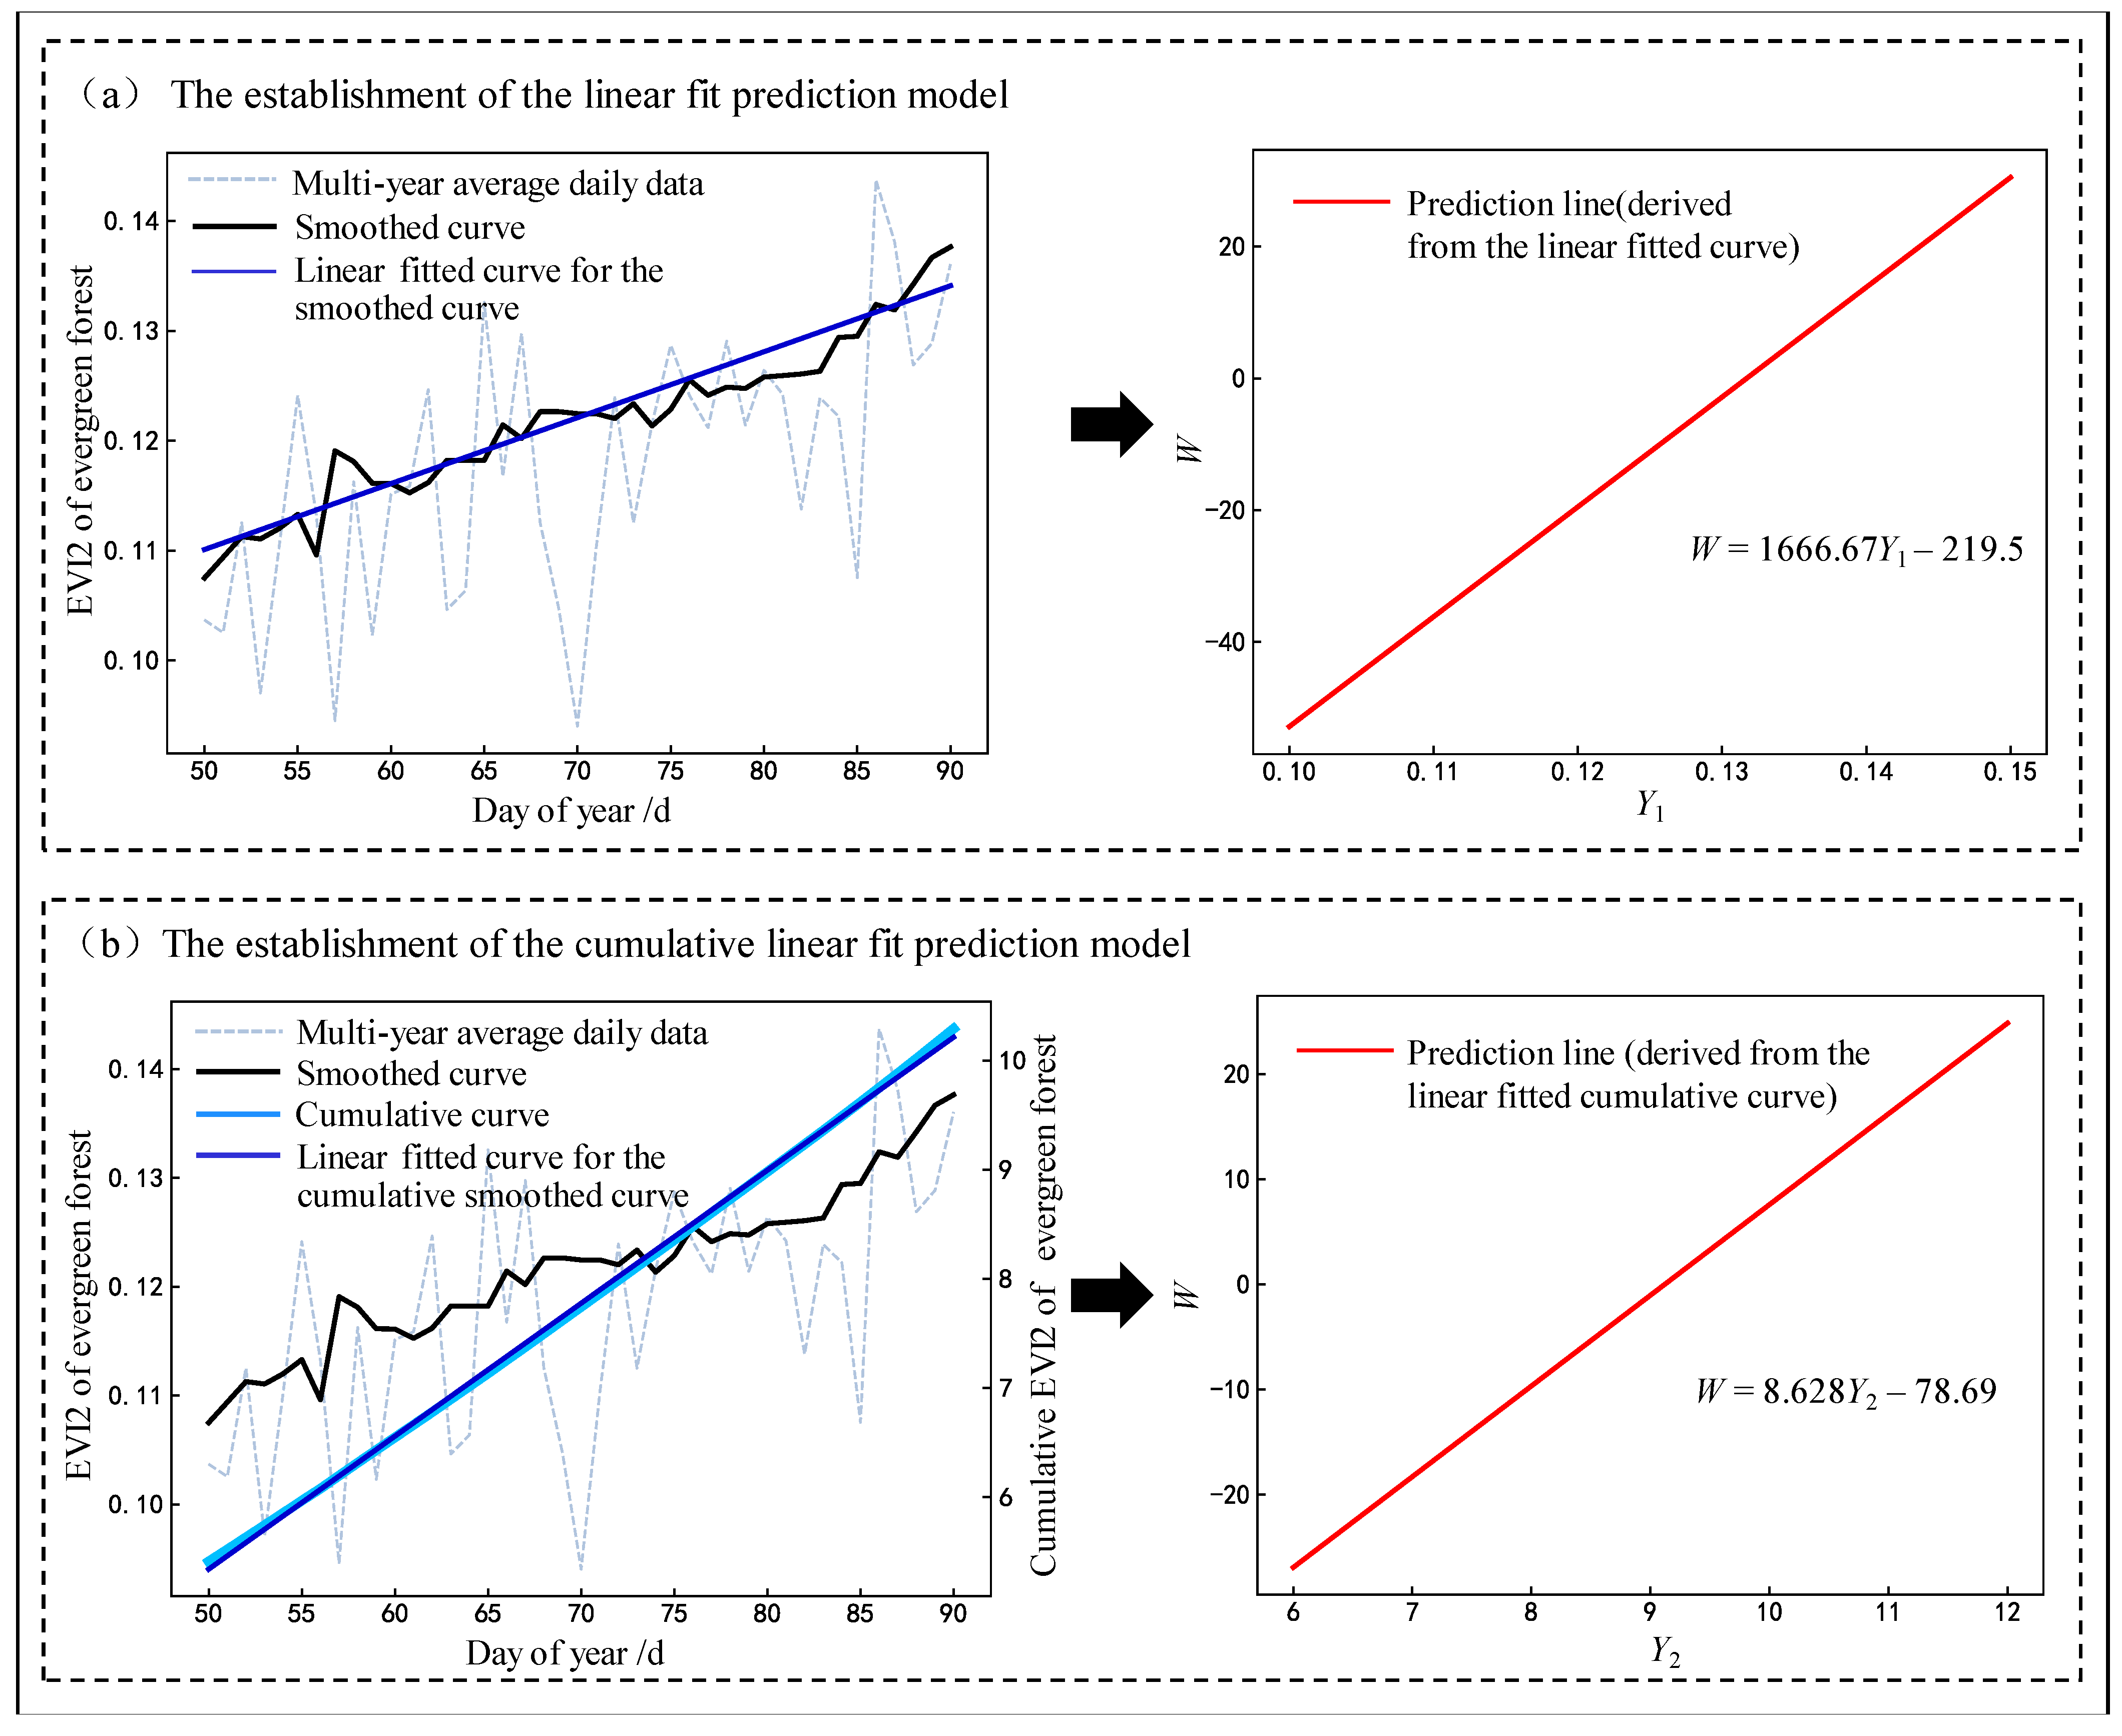
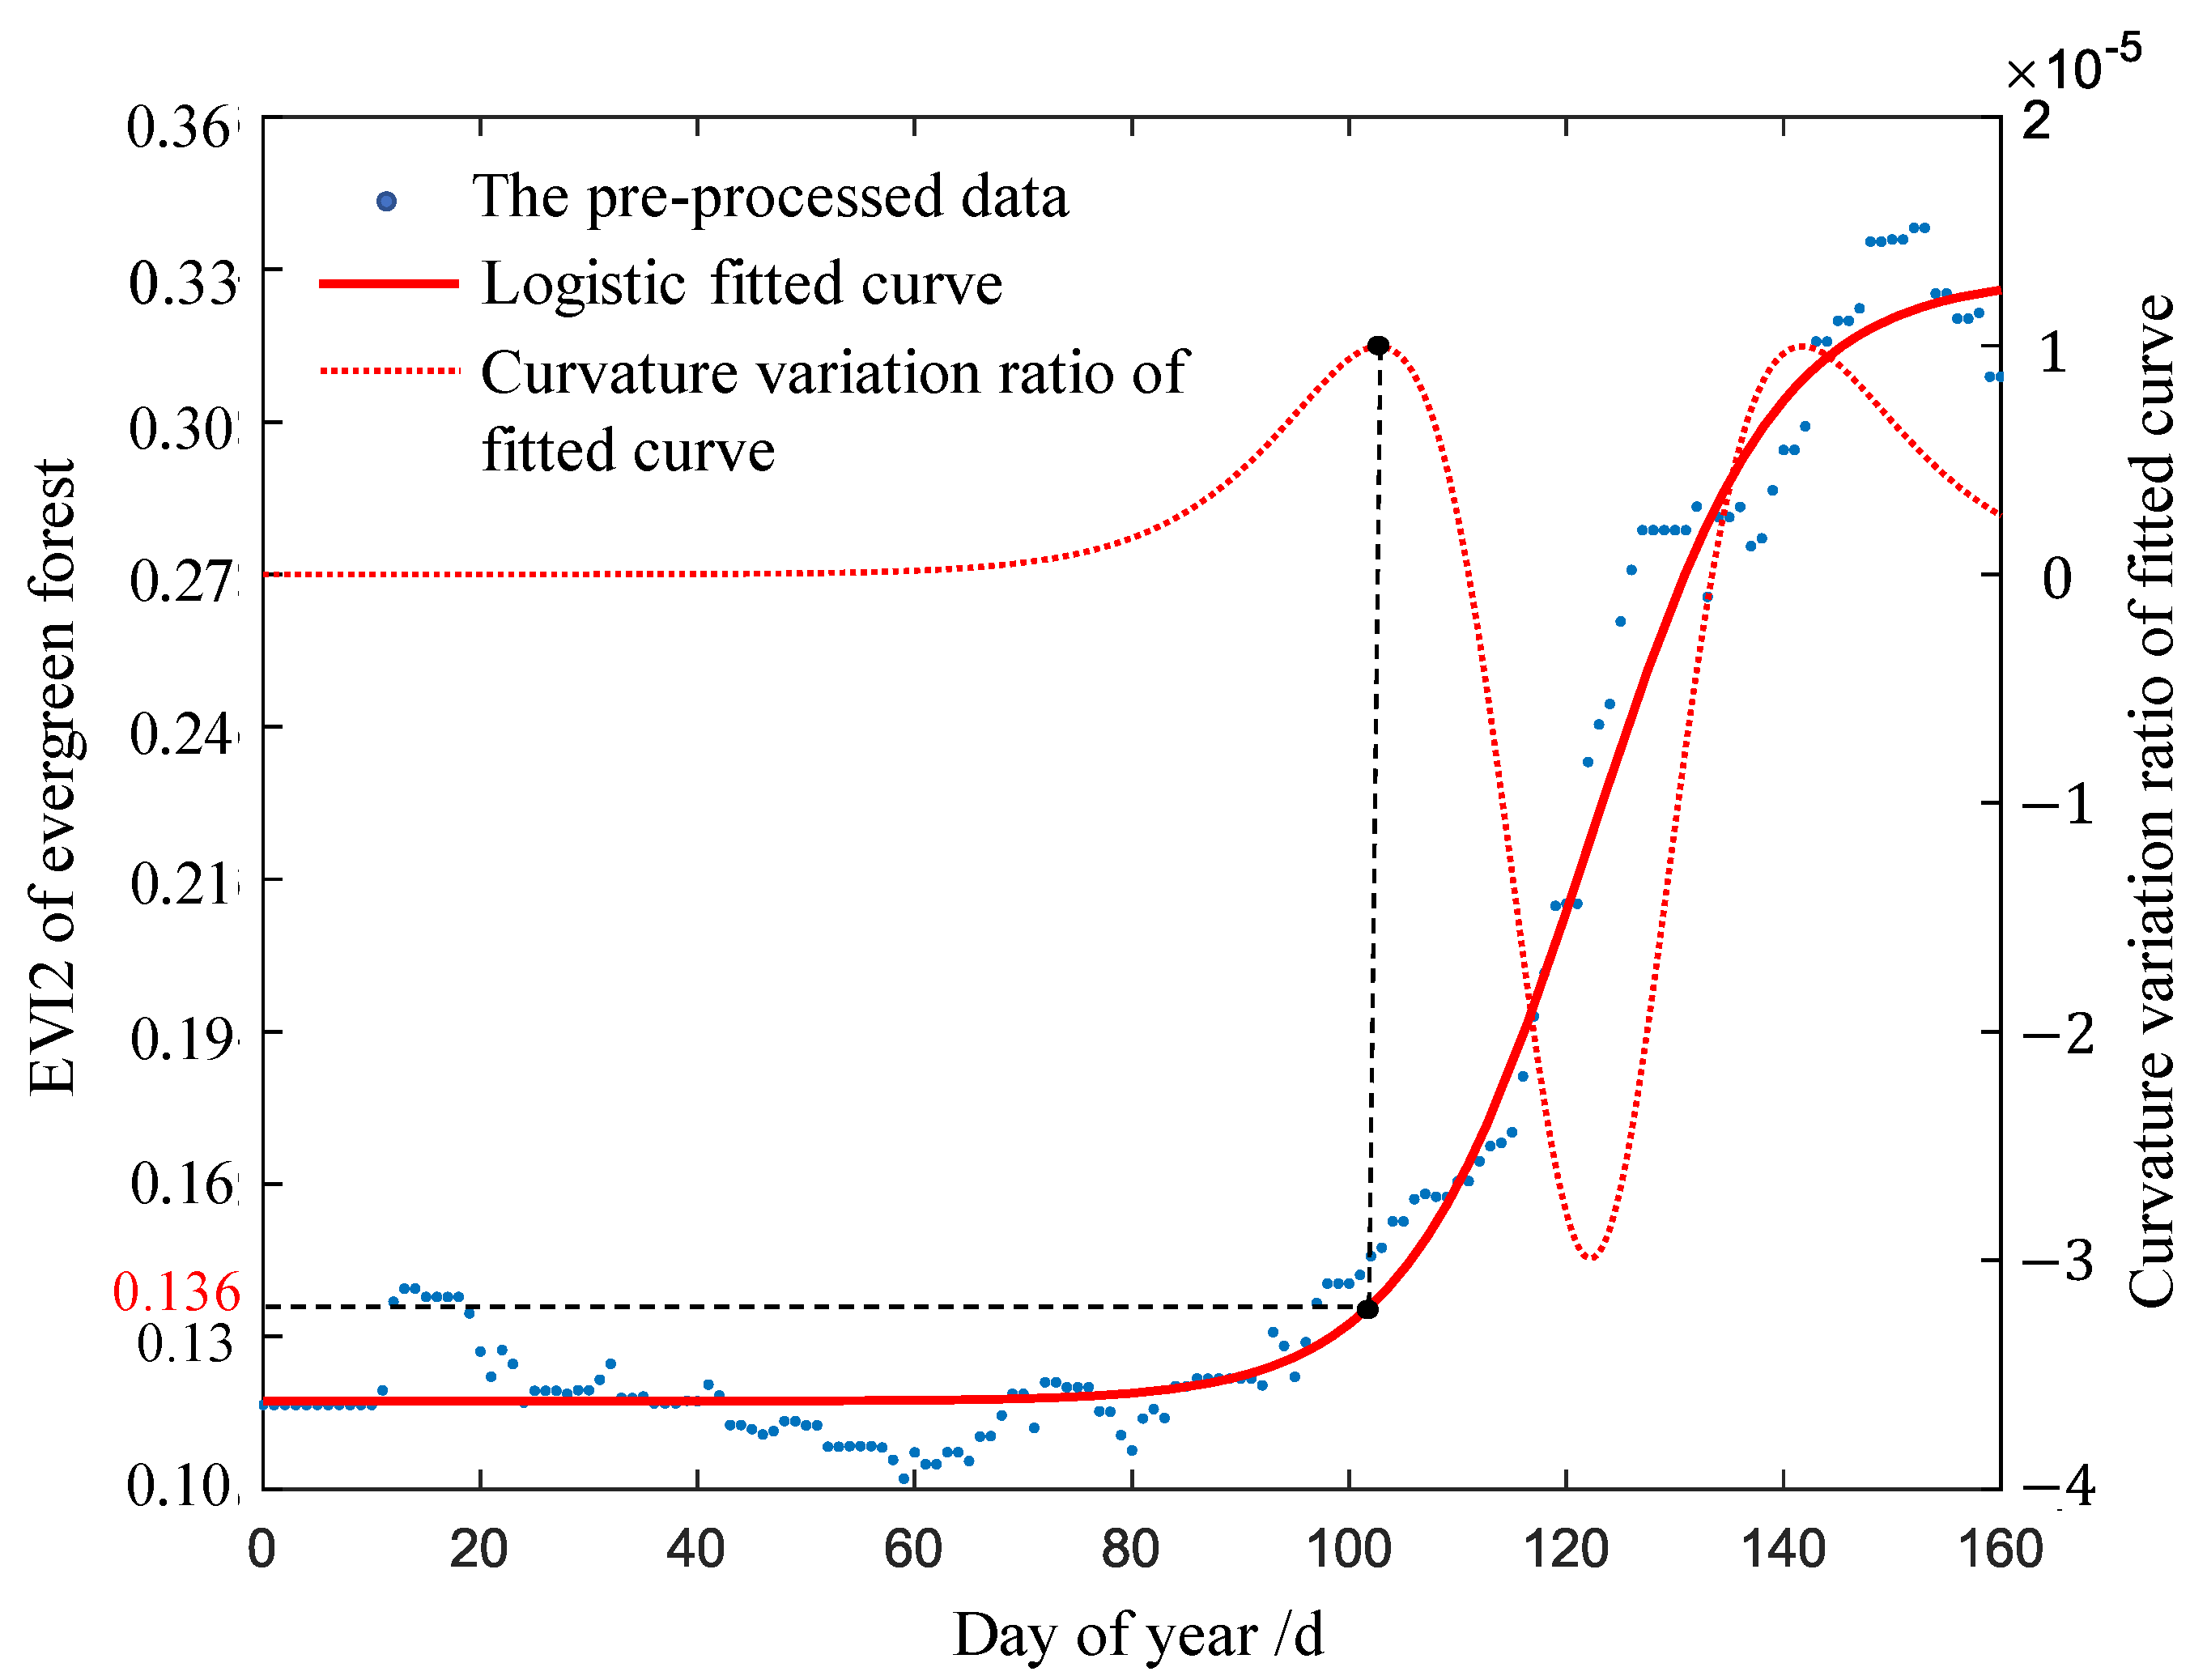
(1) The satellite-derived phenological characteristics of vegetation greenness are obvious during the early period of the spring pollen allergy outbreak in Beijing. The date of EVI2 in evergreen forest first reaching 0.138 can best reflect the outbreak date of pollen allergy in spring. Moreover, it has a specific phenological indication: the date of EVI2 in evergreen forest first reaching 0.138 in spring basically corresponds to the greenup date.
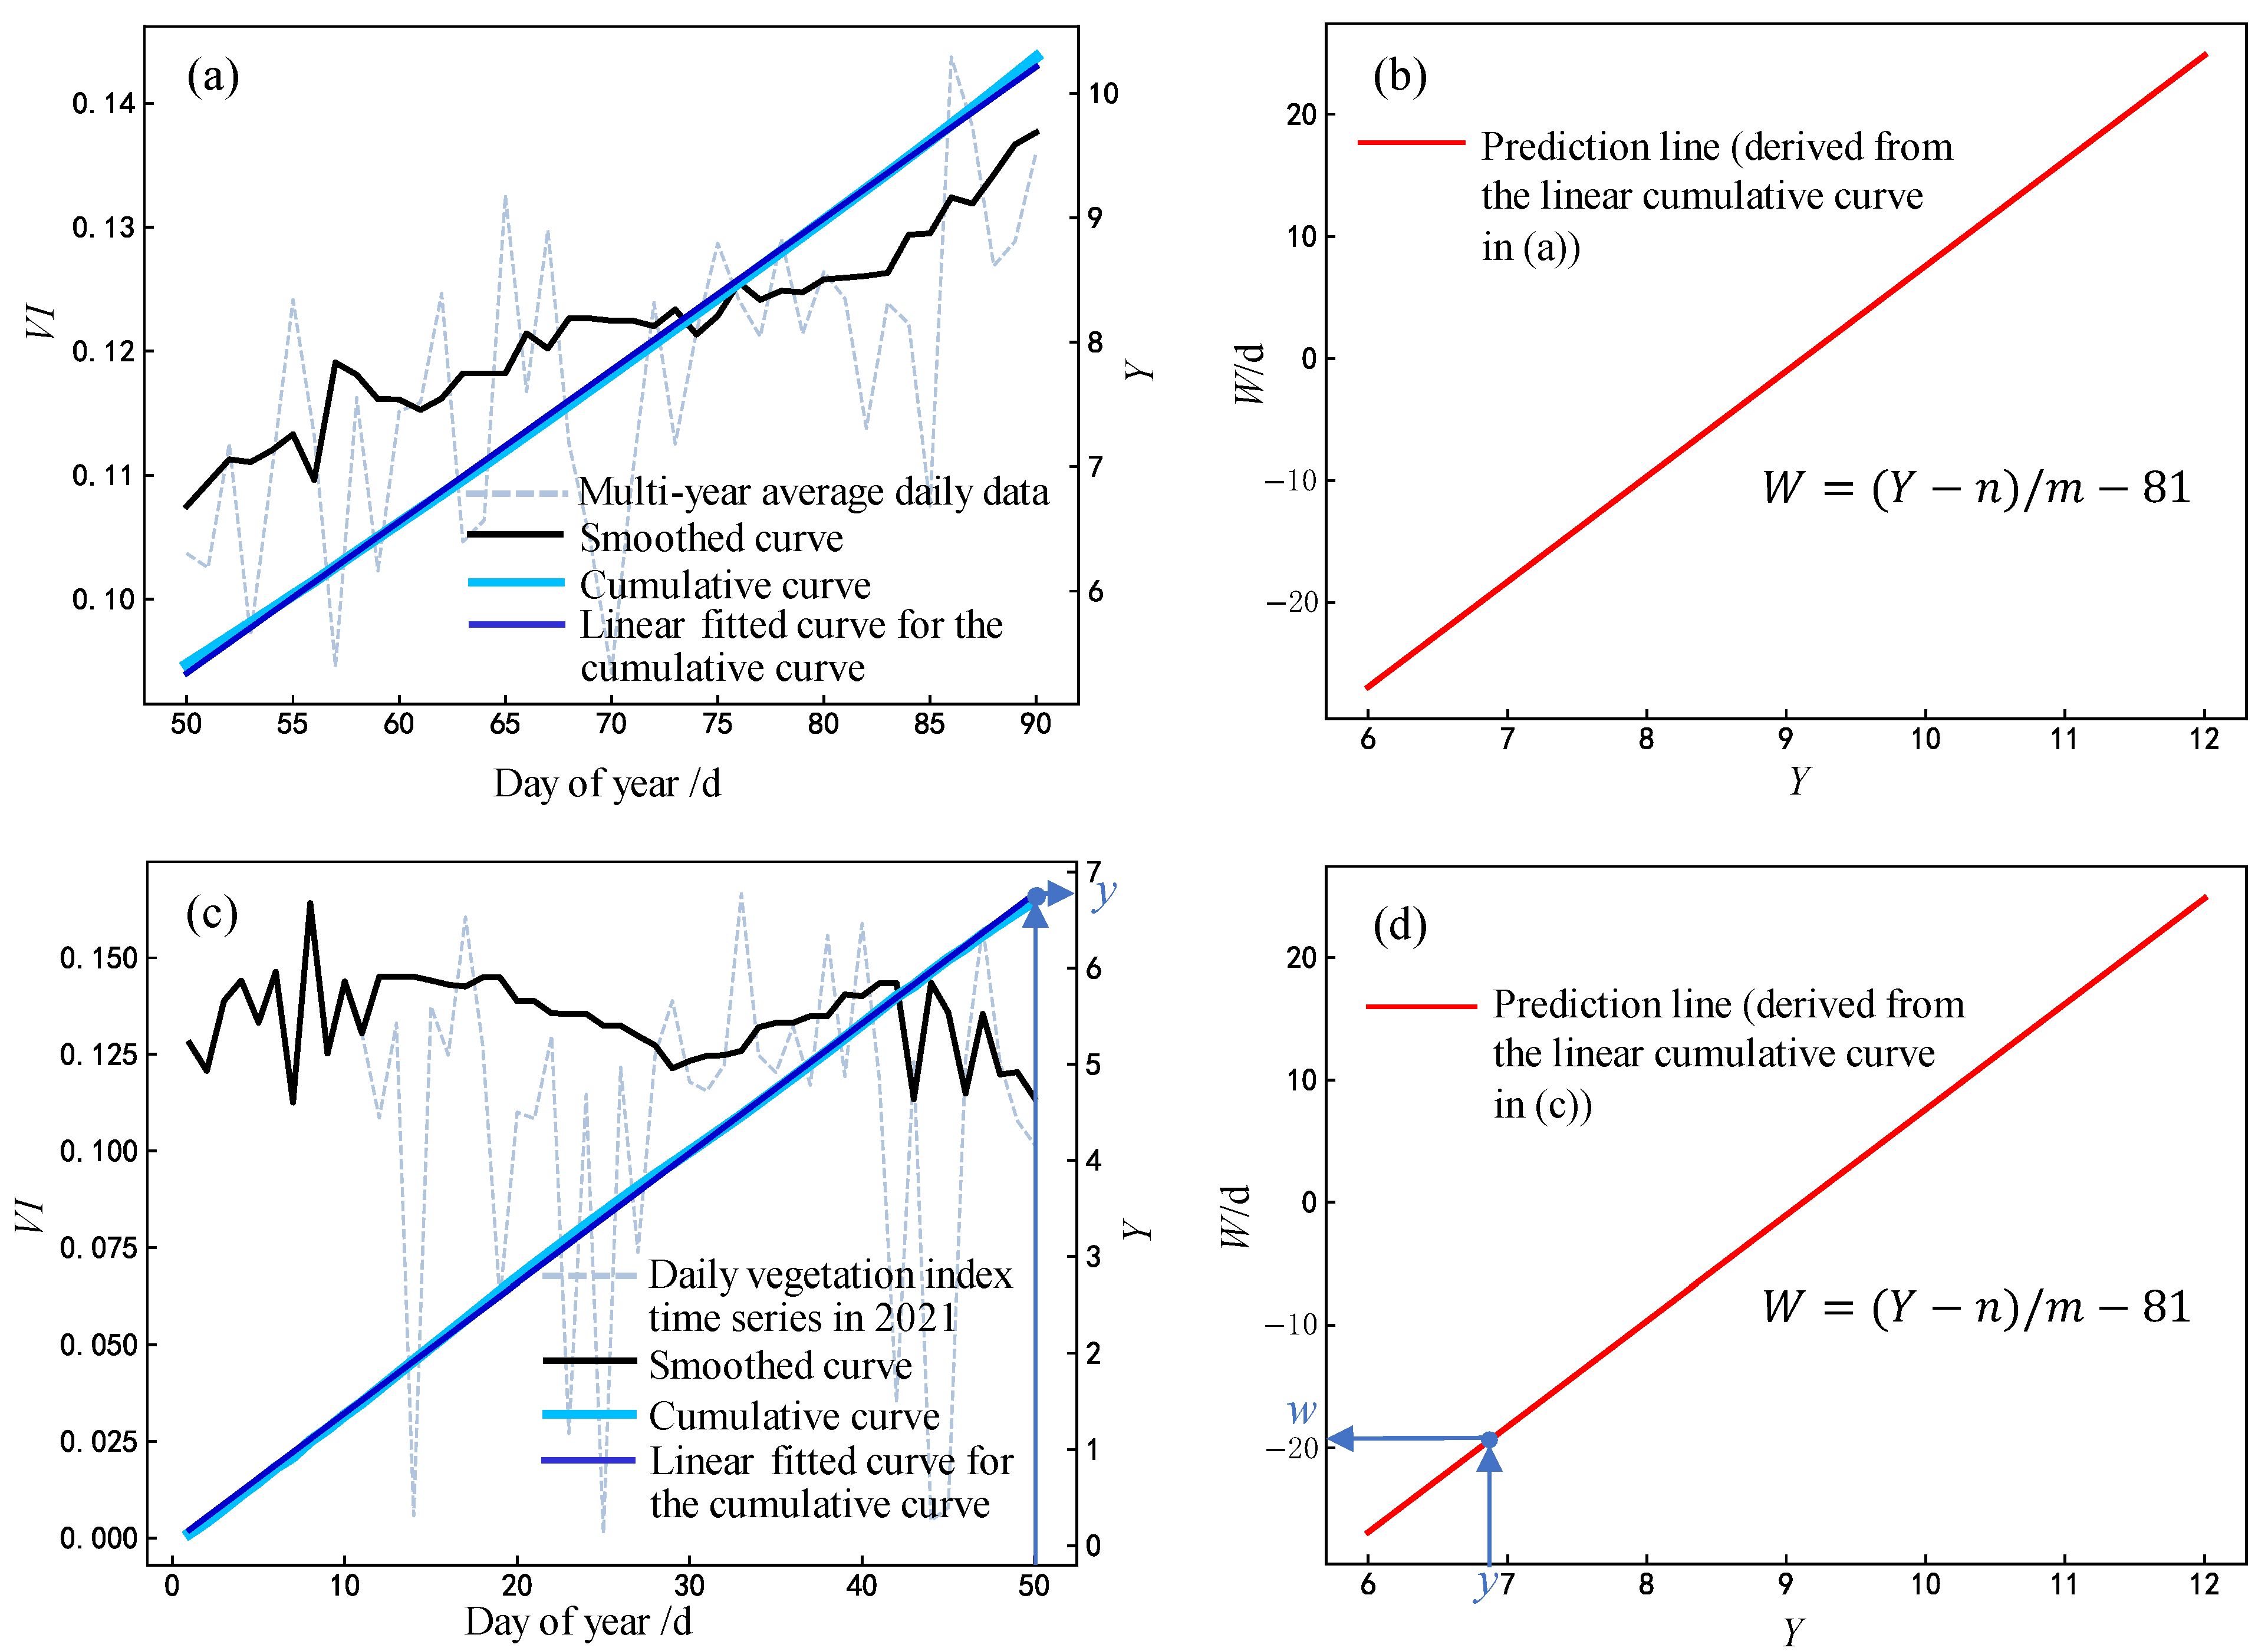
(2) The cumulative linear fit prediction model based on EVI2 of evergreen forest has a very good prediction ability for forecasting the spring pollen allergy outbreak date in Beijing, and it can predict 30 days in advance, with a low average RMSE of 3.6 days. The existing forecast models of pollen allergy outbreak are mainly based on indirect forecasting of pollen concentrations, while the newly developed model can forecast pollen allergy outbreak directly. It only requires the time-series data of remote sensing vegetation index before pollen allergy outbreak to achieve the forecast, which is more representative (directly reflecting pollen allergy rather than pollen concentration) and operable. However, the forecast accuracy of the cumulative linear fit prediction model is easily limited by the quality of remote sensing data, and if the study area is affected by cloud cover for a long time, which results in degradation of the quality of satellite remote sensing data, the forecast accuracy will be significantly reduced.


