Article

Geothermal Exploration in the Burwash Landing Region, Canada, Using Three-Dimensional Inversion of Passive Electromagnetic Data

by
Victoria Tschirhart
1,*,
Maurice Colpron
2,
James Craven
1,
Fateme Hormozzade Ghalati
3,
Randy J. Enkin
4 and
Stephen E. Grasby
5
1
Geological Survey of Canada Central Division, Natural Resources Canada, Ottawa, ON K1A 0E8, Canada
2
Yukon Geological Survey, Whitehorse, YT Y1A 0R3, Canada
3
Department of Earth Science, Carleton University, Ottawa, ON K1S 5B6, Canada
4
Geological Survey of Canada Pacific, Natural Resources Canada, Sidney, BC V8L 4B2, Canada
5
Geological Survey of Canada Calgary, Natural Resources Canada, Calgary, AB T2L 2A7, Canada
*
Author to whom correspondence should be addressed.
Remote Sens. 2022, 14(23), 5963; https://doi.org/10.3390/rs14235963
Submission received: 2 September 2022 / Revised: 28 October 2022 / Accepted: 22 November 2022 / Published: 25 November 2022
(This article belongs to the Special Issue Remote Sensing of Geothermal and Volcanic Environments)

Abstract

:
Sustainable development of Canada’s North requires an increased focus on renewable, zero-emission energy sources. Burwash Landing in Yukon is prospective for geothermal energy based on a high geothermal gradient, local occurrence of warm groundwater and proximity to the active, crustal-scale Denali fault. Uncertainties about the potential geothermal system include the nature and geometry of fluid pathways, and heat sources required to drive a hydrothermal system. In this study, we inverted three passive electromagnetic datasets—321 extremely low frequency electromagnetic, 33 audiomagnetotelluric and 51 magnetotelluric stations—to map the subsurface electrical structure to 8 km depth. Our new model reveals vertical conductive structures associated with the two main faults, Denali and Bock’s Creek, which we interpret to represent fluid-deposited graphite and hydrothermal alteration, respectively. Our model supports an interpreted releasing bend on the main Denali fault strand. This is associated with the deepest conductivity anomaly along the fault and potential for deeper penetration of fluids. Enigmatic conductive bodies from 1 to > 6 km depth are associated with intermediate to mafic intrusions. Fluids released from these bodies may advect heat and provide a possible heat source to mobilize hot fluids and sustain a geothermal system in the region.

1. Introduction

As Canada transitions to a low carbon economy, an increasing focus is being placed on the search for zero-emission, green energy sources. This is particularly important for sustainable development of Canada’s North where many communities disconnected from the North American energy grid rely on fossil fuels for power generation and heat. Geothermal energy can provide base-lode power while emitting little carbon and requiring minimal physical infrastructure for development making it an attractive alternative energy source for the Arctic [1]. As such, the Yukon Geological Survey is actively pursuing a geothermal energy research program not only for power generation but for district heating, greenhouses and aquaculture, and has identified Burwash Landing, one of four Yukon communities relying on diesel fuel, as a favorable environment for geothermal energy [2,3,4]. The Burwash Landing area (Figure 1) is deemed prospective based on an estimated geothermal gradient of 40 °C/km, local occurrences of warm groundwaters, and proximity to the active, crustal-scale, dextral strike-slip Denali fault [2,3,5,6].
For a region to be considered prospective for geothermal energy, high-temperature geothermal fluids need to ascend through the crust along faults and/or fractures and other zones of increased permeability to the near surface [8]. Geysers, hot springs and fumaroles are the surface expression of the ascension of hot fluids. While there are no known hot springs near Burwash Landing, there are known occurrences of warm water in groundwater wells locally [9], and further south along the Denali Fault at Jarvis River [10,11]. Detailed analysis of air photos [12], potential field data [3], and LiDAR elevation models [13] further identified a potential right-step in the eastern Denali fault system near Burwash Landing. A small pull-apart zone may be developed in this region, leading to extension, fracturing and increased permeability of the subsurface allowing for the movement of fluids was hypothesized by [3]. If present at Burwash Landing, a geothermal system would be similar to blind amagmatic, fault-controlled convective hydrothermal systems such as those found in the Great Basin Province of the western United States, where crustal extension and thinning cause high geothermal gradients (e.g., [14,15,16]). Although fault-controlled geothermal systems have been extensively explored and developed in the Great Basin Province, this study is amongst the first to evaluate this type of system in Canada. If a blind geothermal system does exist near Burwash Landing it may be obscured by a cold-water aquifer, may be a smaller system than a comparable geological setting (e.g., Alpine fault, New Zealand [17]), or be deeply buried [18].
Ref. [3]’s interpretations led to the development of a broader multi-disciplinary research program spearheaded by the Yukon Geological Survey, in collaboration with the Geological Survey of Canada and university researchers, to better understand the geothermal potential of the Burwash Landing area [19]. As part of this project, ground extremely low-frequency electromagnetic (ELF-EM), audiomagnetotelluric (AMT) and broadband magnetotelluric (MT) surveys were conducted over the Burwash Landing region in 2019, 2021 and 2022. Geophysical data offer invaluable insights on these types of blind geothermal systems (e.g., [15,20,21]) as they visualize the subsurface rock properties. Passive electromagnetic (EM) data, such as ELF-EM, AMT and MT, are particularly useful to map the subsurface resistivity (or its reciprocal conductivity) structure of geothermal systems. The electrical response can be correlated to a rock’s porosity or permeability; and it can indicate the presence of faults. Faulting can generate interconnected fracture networks to facilitate fracture-dominated permeability along fault zones that can be important conduits for transporting warm hydrothermal fluids [15,22,23,24]. Conductivity highs are often associated with fault and fracture systems filled with hot, saline fluids, and the clay alteration zones that cap a geothermal system (e.g., [8,16]); while resistivity highs can delineate the extents of the reservoir rock. EM data can also help locate the most permeable zones of the fault system that are the more likely to host the greatest volume of fluids.
Previous EM modelling of the ELF-EM data to 1500 m below surface [3] and airborne EM surveying [25] in the Burwash Landing area identified conductive zones associated with the Denali fault system; however, the models of the ELF-EM data were 2D models and with limited shallow frequency range (22 Hz to 720 Hz), therefore the broader geometry of the fault system and connection to potential geothermal reservoirs and deeper fluid sources remain unknown. To better understand the geothermal potential and subsurface geometry of the Denali fault system, this study presents resistivity models inverted using ELF-EM, AMT and MT data to map the electrical structure of the subsurface to 8 km depth. In EM, measurements at different frequencies are sensitive to resistivity variations at different depths, such that by combining ELF-EM, AMT and MT data we develop a comprehensive model of the shallow crust. This enhanced three-dimensional understanding of the Denali fault system will help guide and inform future exploration for geothermal resources in the region.

2. The Denali Fault

The Denali fault is one of a series of major Cenozoic dextral strike-slip faults that dissects the northern Cordilleran orogen (e.g., [5,26]) (Figure 1). It extends ca. 2100 km from northwestern British Columbia, Canada, to southwestern Alaska, USA, and juxtaposes the Insular and Intermontane superterranes in southwestern Yukon [27]. Estimates for Cenozoic (≤52 Ma) dextral displacement across the Denali fault zone range from ca. 370 to 480 km [28,29].
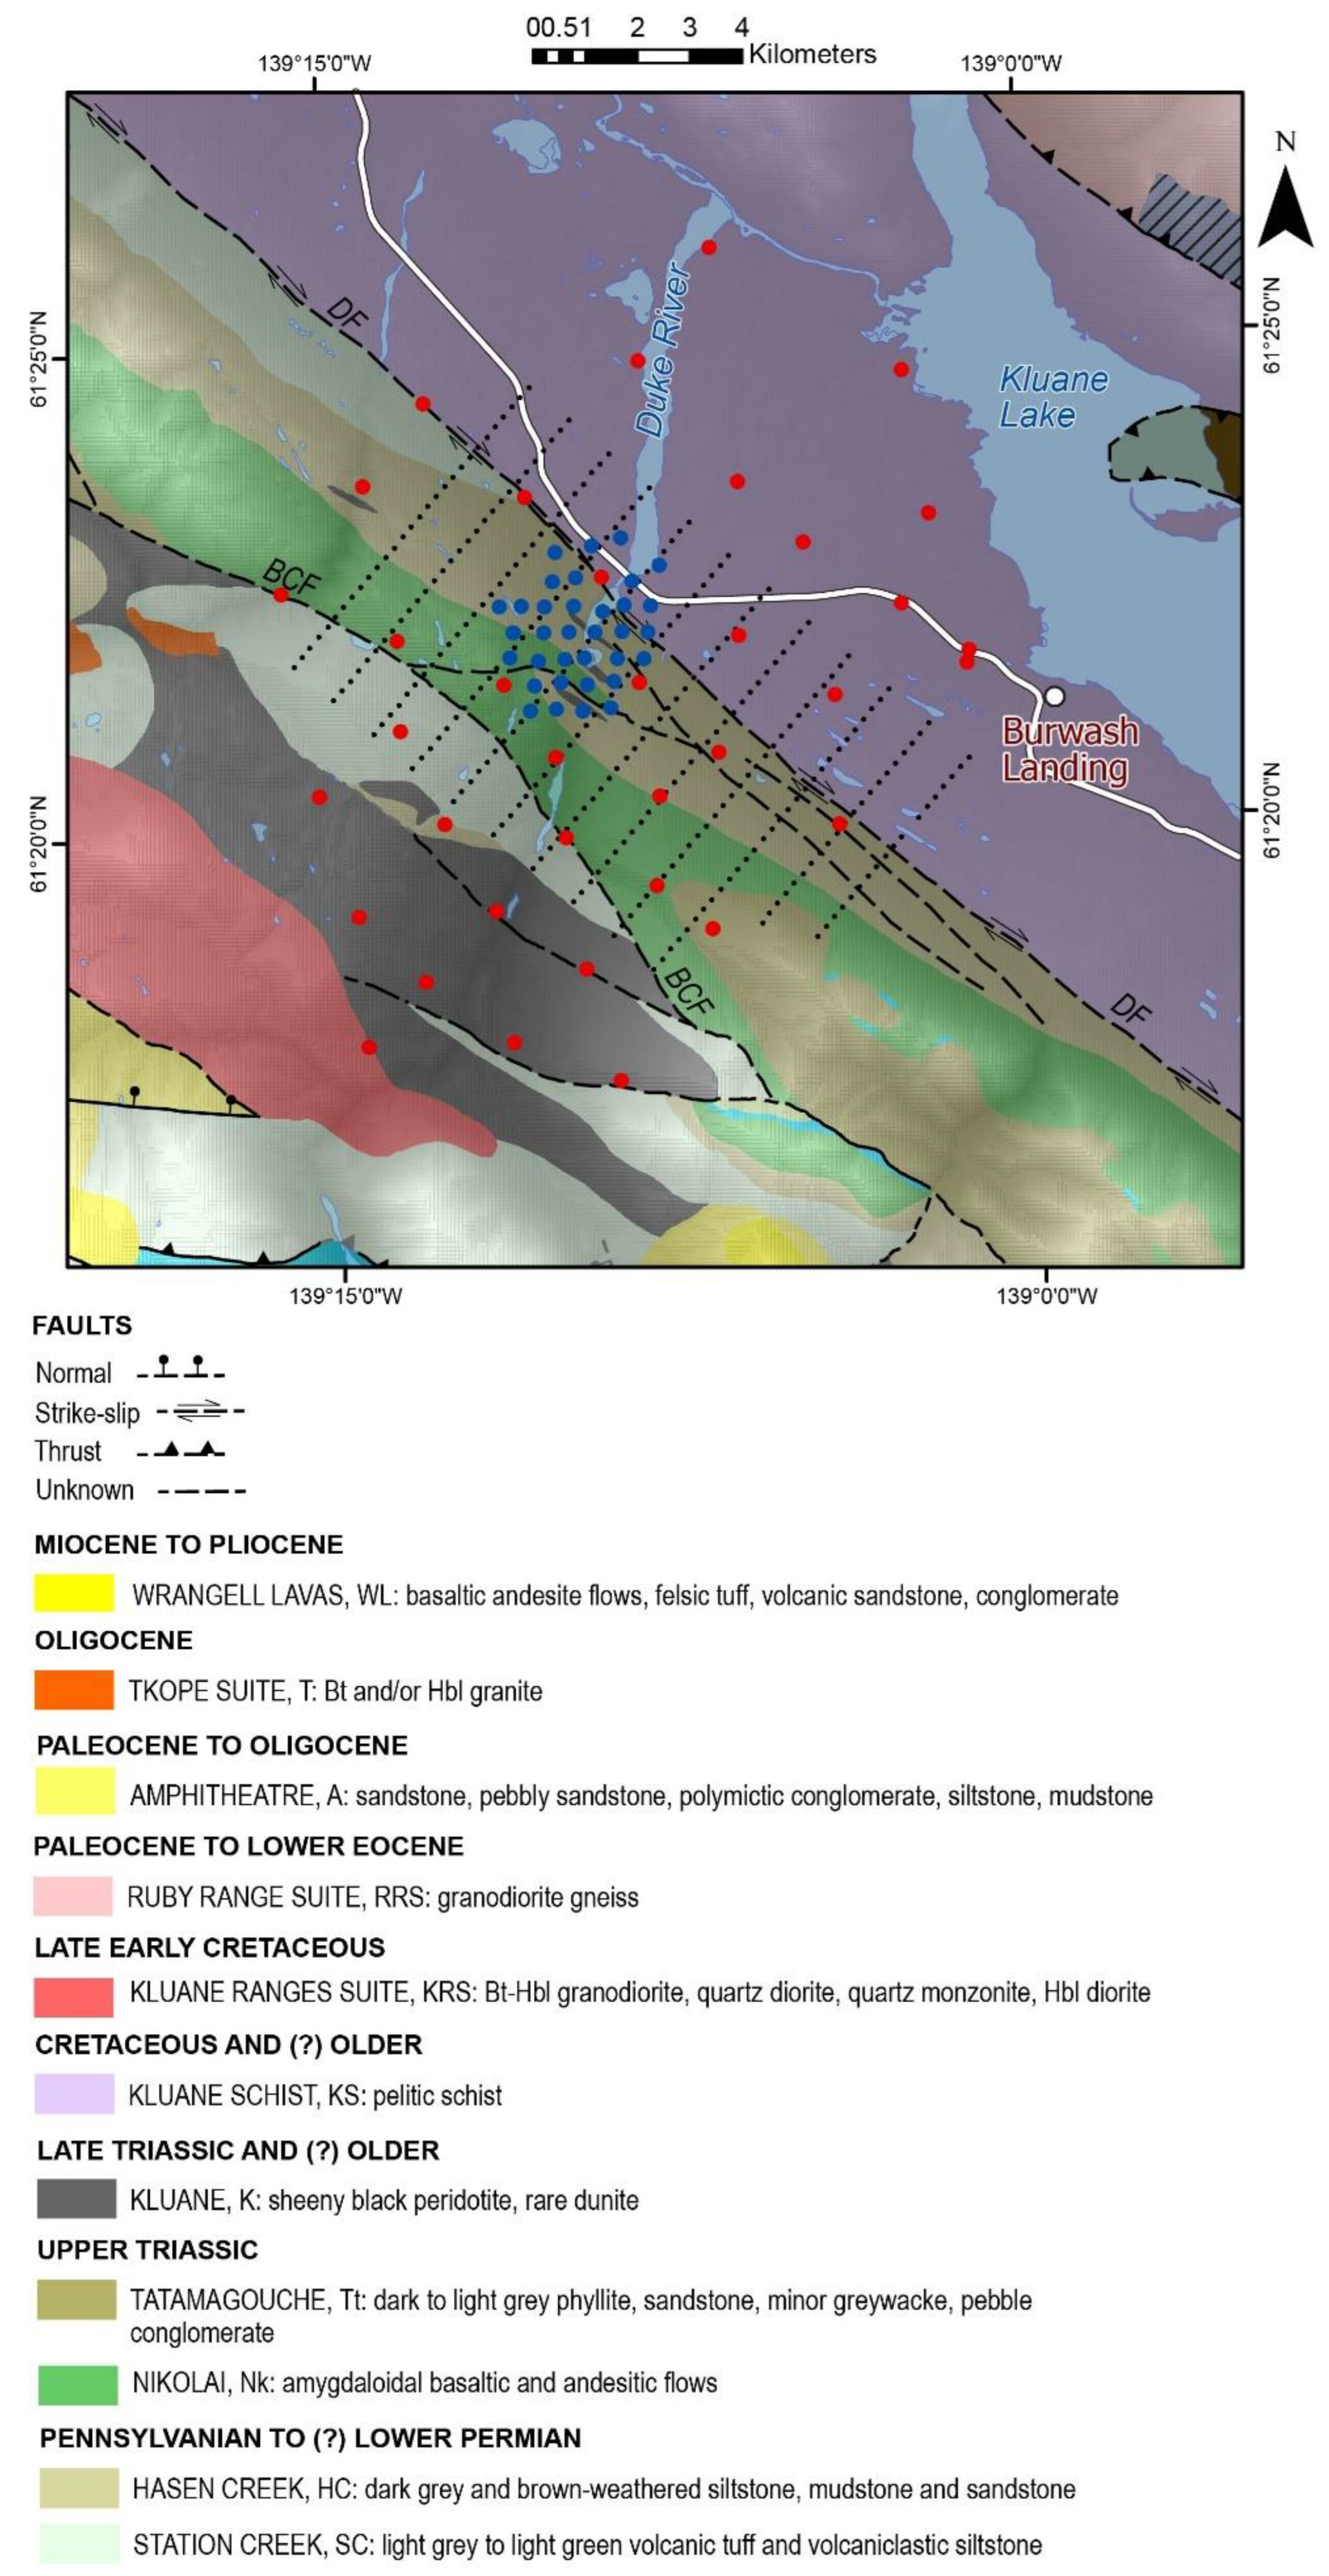
Near Burwash Landing, metapelites of the Upper Cretaceous Kluane Schist underlie the region northeast of the Denali fault (Figure 1 and Figure 2) [30,31,32,33]. The unit is composed mainly of quartz-mica schist, with local slivers of serpentinite and carbonate, and is variably carbonaceous. The rock is metamorphosed to greenschist and lower amphibolite facies with metamorphic grade decreasing to the northwest [30]. The Kluane Schist is pervasively foliated and affected by two phases of tight to isoclinal folds. The foliation strikes northwest and generally dips to the northeast. A series of late, open folds are superposed on the dominant foliation and have south-southeast-trending axes [33]. The Kluane Schist is intruded and structurally overlain by granitoids of the Paleocene Ruby Range batholith along its northeastern edge. The Kluane Schist is locally gneissic in proximity to the Ruby Range batholith [33].
Carboniferous to Upper Triassic rocks of Wrangellia occur to the southwest of the Denali fault (Figure 1 and Figure 2) [35,36,37]. Upper Paleozoic rocks of Wrangellia comprise the Skolai Group which includes a lower unit of volcanic and volcaniclastic rocks (Station Creek Formation) and an upper sedimentary unit of siltstone, mudstone, and sandstone (Hasen Creek Formation). These rocks are unconformably overlain by subaerial basalt flows of the Upper Triassic Nikolai formation which is in turn unconformably overlain by marine clastic rocks of the Tatamagouche succession (Upper Triassic to Lower Cretaceous?; [37]). The Upper Triassic Chitistone Limestone which conformably overlies the Nikolai formation elsewhere in the region is absent from the Burwash Landing area (Figure 2). The upper Paleozoic rocks of the Skolai Group are locally intruded by gabbro, pyroxenite, peridotite and dunite sills of the Late Triassic (ca. 232 Ma) Kluane ultramafic suite [38]. These mafic-ultramafic sills are interpreted to be feeders to the Upper Triassic Nikolai flood basalts [39]. Rocks of Wrangellia are intruded by quartz diorite and gabbro of the Early Cretaceous Kluane Ranges suite. Upper Paleozoic and Triassic rocks of Wrangellia are deformed by open to tight, northwest-trending folds, and dissected by steep faults, including splays of the Denali fault and the Bock’s Creek fault (Figure 2) [36,37].
The youngest rocks southwest of the Denali fault comprise Oligocene quartz-feldspar porphyry of the Tkope suite (ca. 27 Ma), terrestrial sediments of the Amphitheatre Formation, and intrusive and extrusive rocks of the Miocene Wrangell suite (ca. 15–16 Ma) [36,37].
Displacement along the Denali fault is thought to have occurred mostly since the Eocene and persists to the present (e.g., [6,29,40]). The fault is seismically active, with greater earthquake frequency and GPS velocities occurring on the central Denali fault in Alaska and more subdued seismic activity along the eastern Denali fault in Yukon [5]. Focal mechanisms for Yukon earthquakes indicate reverse-oblique slip and relatively low northeast-directed GPS velocities along the eastern Denali fault [5,41]. The Burwash Landing area lies within a relatively quiet seismogenic zone along the fault; in southwestern Yukon, greater earthquake activity is focused on the Duke River Fault (Figure 1).

3. The Magnetotelluric Method

Magnetotelluric models image the subsurface electrical resistivity (or its reciprocal, conductivity) structure of the lithosphere. Resistivity is related to lithology, porosity and permeability of the rock, composition, salinity and temperature of associated fluids, and metallic content (including sulfides) and graphite [42,43]. As a result, MT data are useful in geothermal studies as they image the regional relationships between fluid pathways and hydrothermal alteration.
Magnetotelluric and AMT surveys use a passive geophysical technique that measures oscillations of the Earth’s natural electric and magnetic fields induced by solar activity and distant electrical storms. An approximate depth (δ) of investigation for the induced electromagnetic fields is dependent on the oscillation period (T) through a relationship known as the skin-depth, which describes the exponential decay of EM fields as they diffuse into a homogenous medium with a resistivity of ρ [43]:
δ [m] = 500√ρT
In the MT method, the impedance tensor (Z) is related to the horizontal components of the earth’s electrical (E) and magnetic (H) components in the north (x) and east (y) directions by:
E x ω E y ω = Z x x ω Z x y ω Z y x ω Z y y ω H x ω H y ω
where Zxx, Zxy, Zyz and Zyy are components of the complex impedance tensor considering the angular frequency (ω). The apparent resistivity (ρa) and the phase (Φ) parameters are calculated from the elements of the impedance tensor as functions of frequency [43,44]. A relationship (K) between the vertical (Hz) and horizontal ( H x   a n d   H y ) components of the magnetic field and the horizontal components is expressed as:
H z ω = K x ω   K y ω H x ω H y ω
where Kx and Ky is are the vertical magnetic transfer functions [43,44]. Jointly inverting both the impedance tensor and the vertical magnetic transfer function data allows for improved mapping the subsurface electrical structure [43,44].

4. Geophysical Datasets

4.1. MT and AMT Data

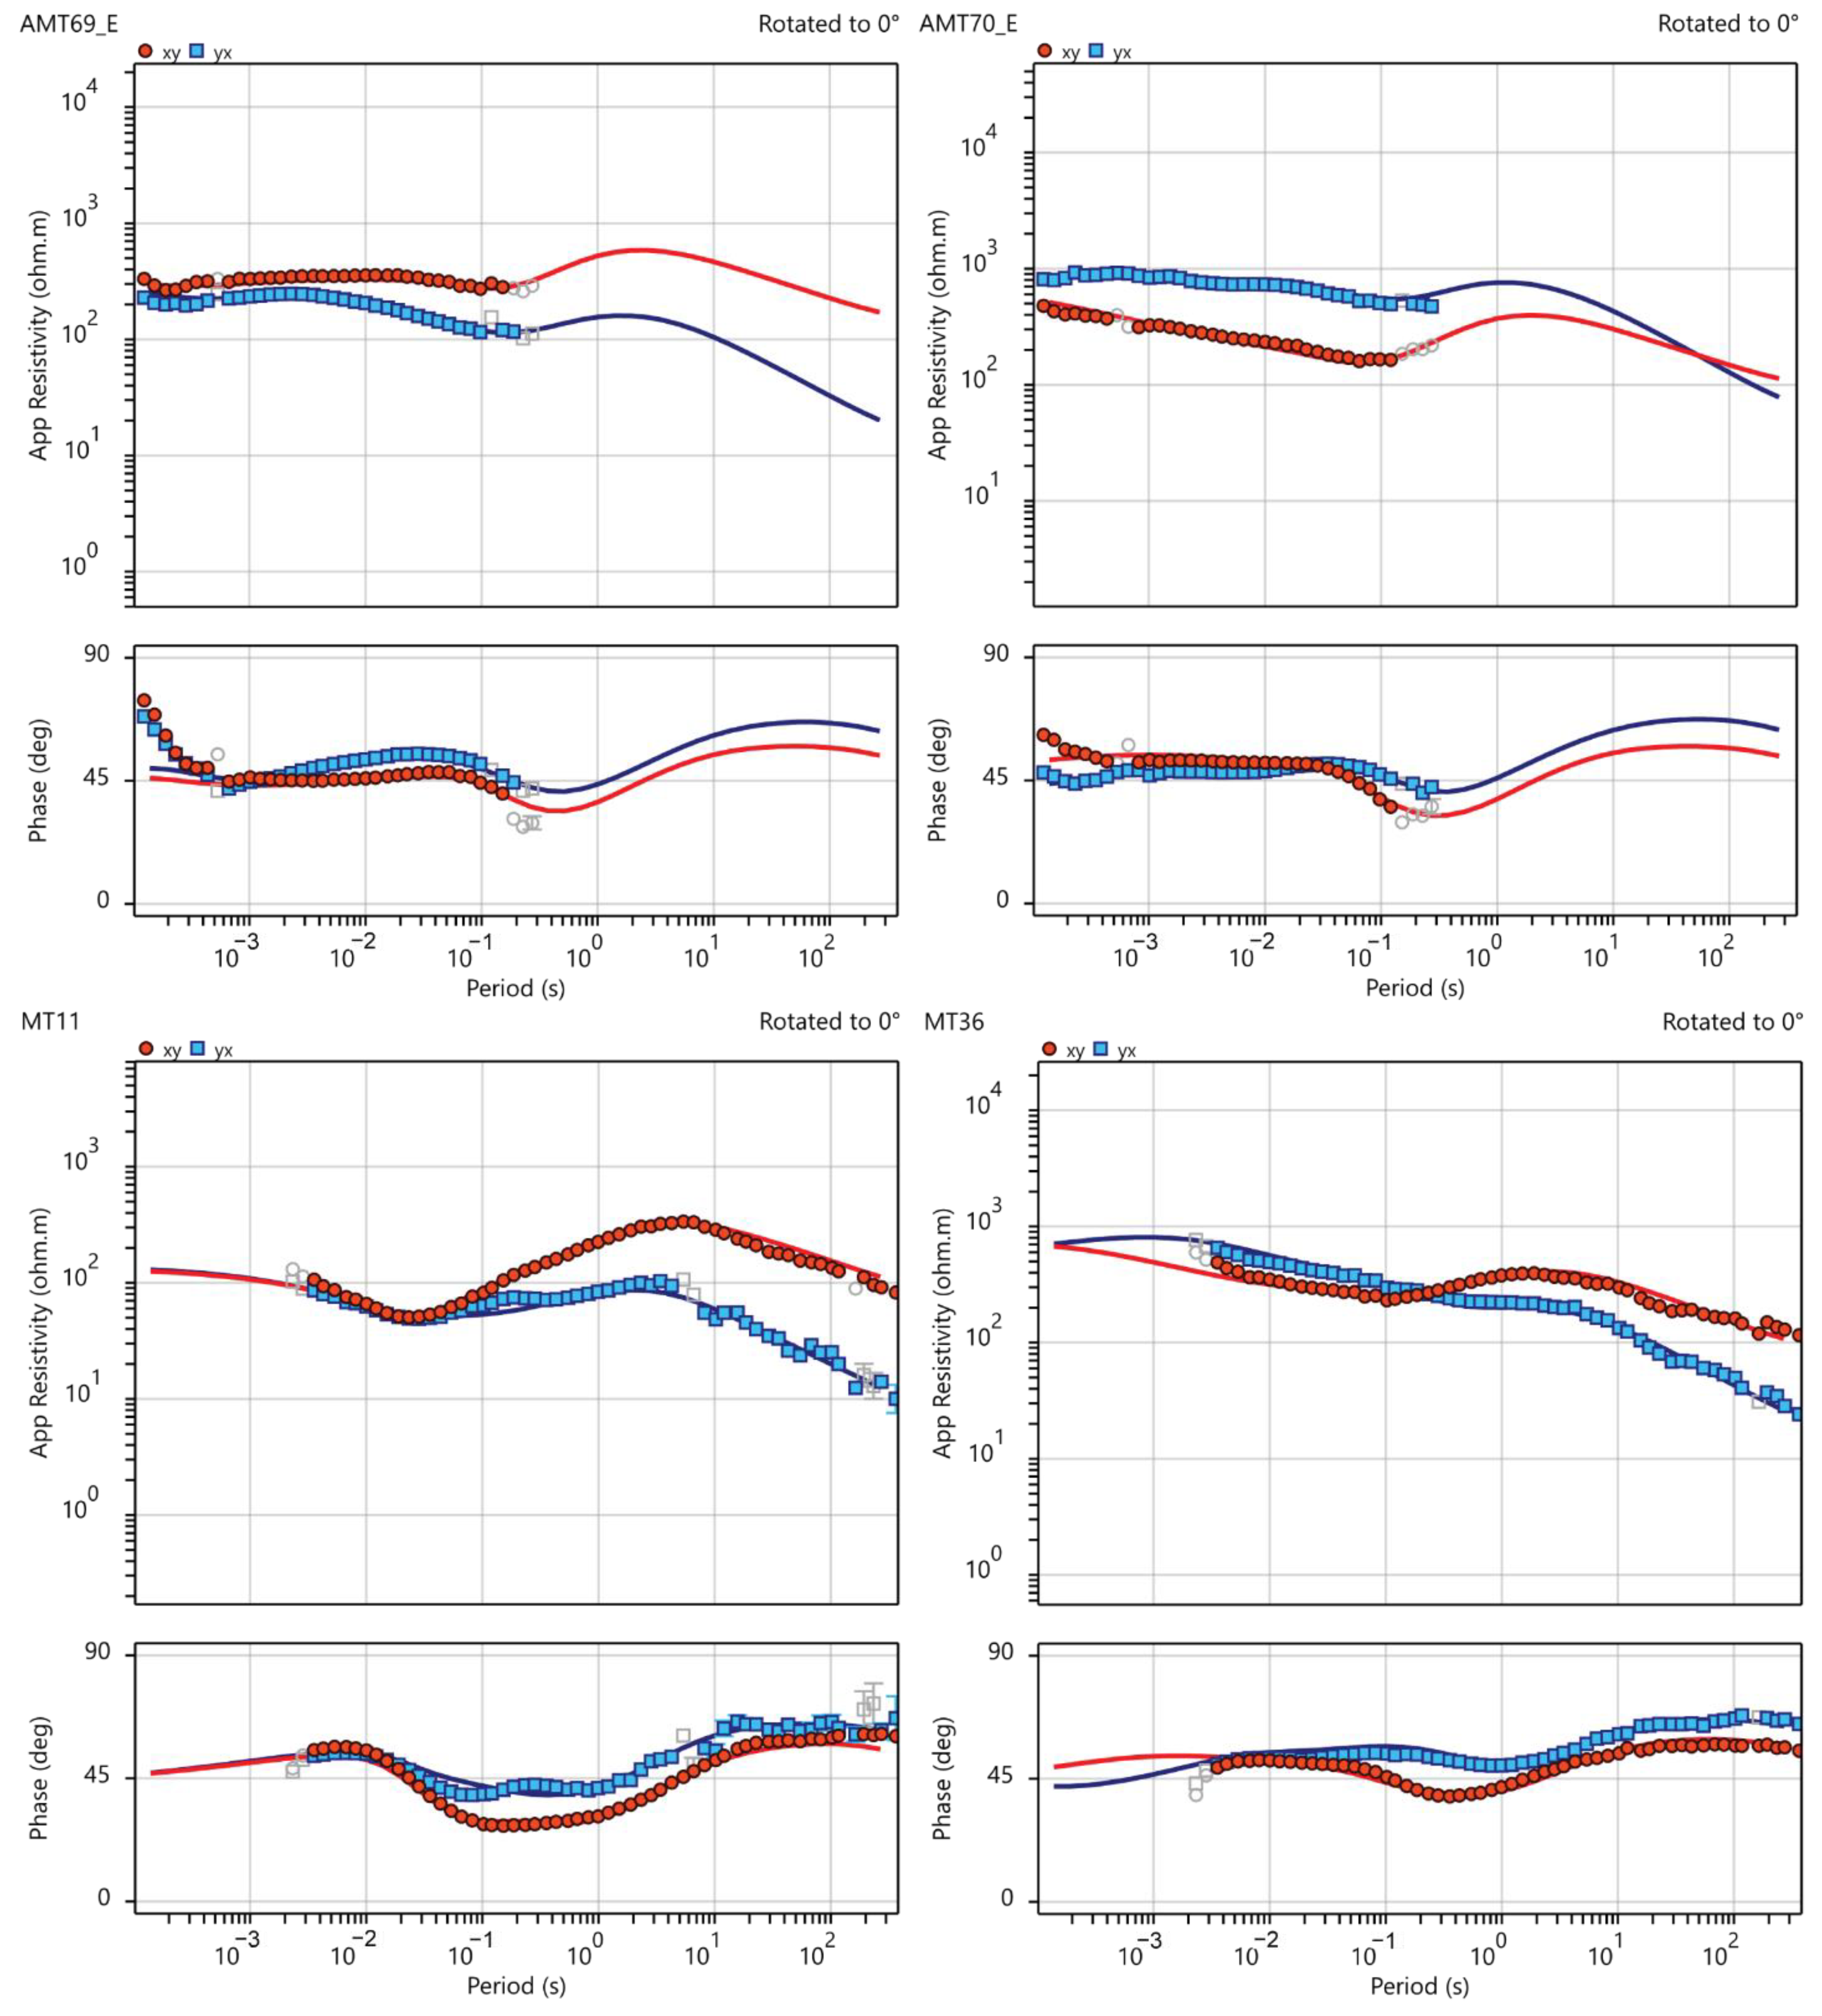
MT data can be collected in different bandwidths (commonly expressed in cycles per second (Hz) or its inverse, period (T)), to explore different depth ranges according to the skin effect alluded to above. Both Broadband MT, typically 400 Hz to 0.001 Hz, and AMT (20,000 Hz to 1 Hz) data were collected at 51 and 33 stations, respectively, (Figure 2) using Quantec’s SPARTAN MT system. The system consists of the QRT160 receiver, Geometrics G100K and EMI BF6 magnetic sensors for AMT recording, Phoenix MTC50 and MTC80 magnetic sensors for MT recording and specially coated steel plate electrodes that help prevent charge accumulation at long periods. One site early in the survey was collected with both plates and porous pots and no difference in response can be seen (Supplementary Information). Five components of the EM field including two electrical components (Ex, Ey) and three magnetic components (Hx, Hy, Hz) were recorded overnight and robustly processed [45] using remote referencing to produce impedance and vertical magnetic transfer functions at a bandwidth of <400 Hz for the MT stations and 1 Hz to 10,000 Hz for the AMT stations. The AMT stations were spaced 500 m apart, while the MT stations were spaced 2000 m (Figure 2). The data is generally of excellent quality (e.g., Figure 3).

4.2. ELF-EM Data

Extremely low frequency electromagnetic data are similar to AMT vertical magnetic field transfer function data as they do not represent the electric field, but rather only the magnetic field with three orthogonal coils [3]. An ELF-EM survey measures Z-axis tipper electromagnetic data and measurements were made using Aurora Geoscience’s proprietary system [3]. Average measurement time at each station was three minutes. Ground stations were spaced 250 m apart along twelve 7000 m long lines. Data was collected for eight frequencies ranging from 11 Hz to 1440 Hz (11, 22, 45, 90, 180, 360, 720 and 1440 Hz) [3], however the contractor removed most of the 11 Hz and 1140 Hz frequencies due to noise [3]. The similarities with AMT and MT vertical field data (Figure 4d) mean that the ELF-EM data could be analyzed and inverted alongside these datasets.

5. Methodology

5.1. Dimensionality Analysis

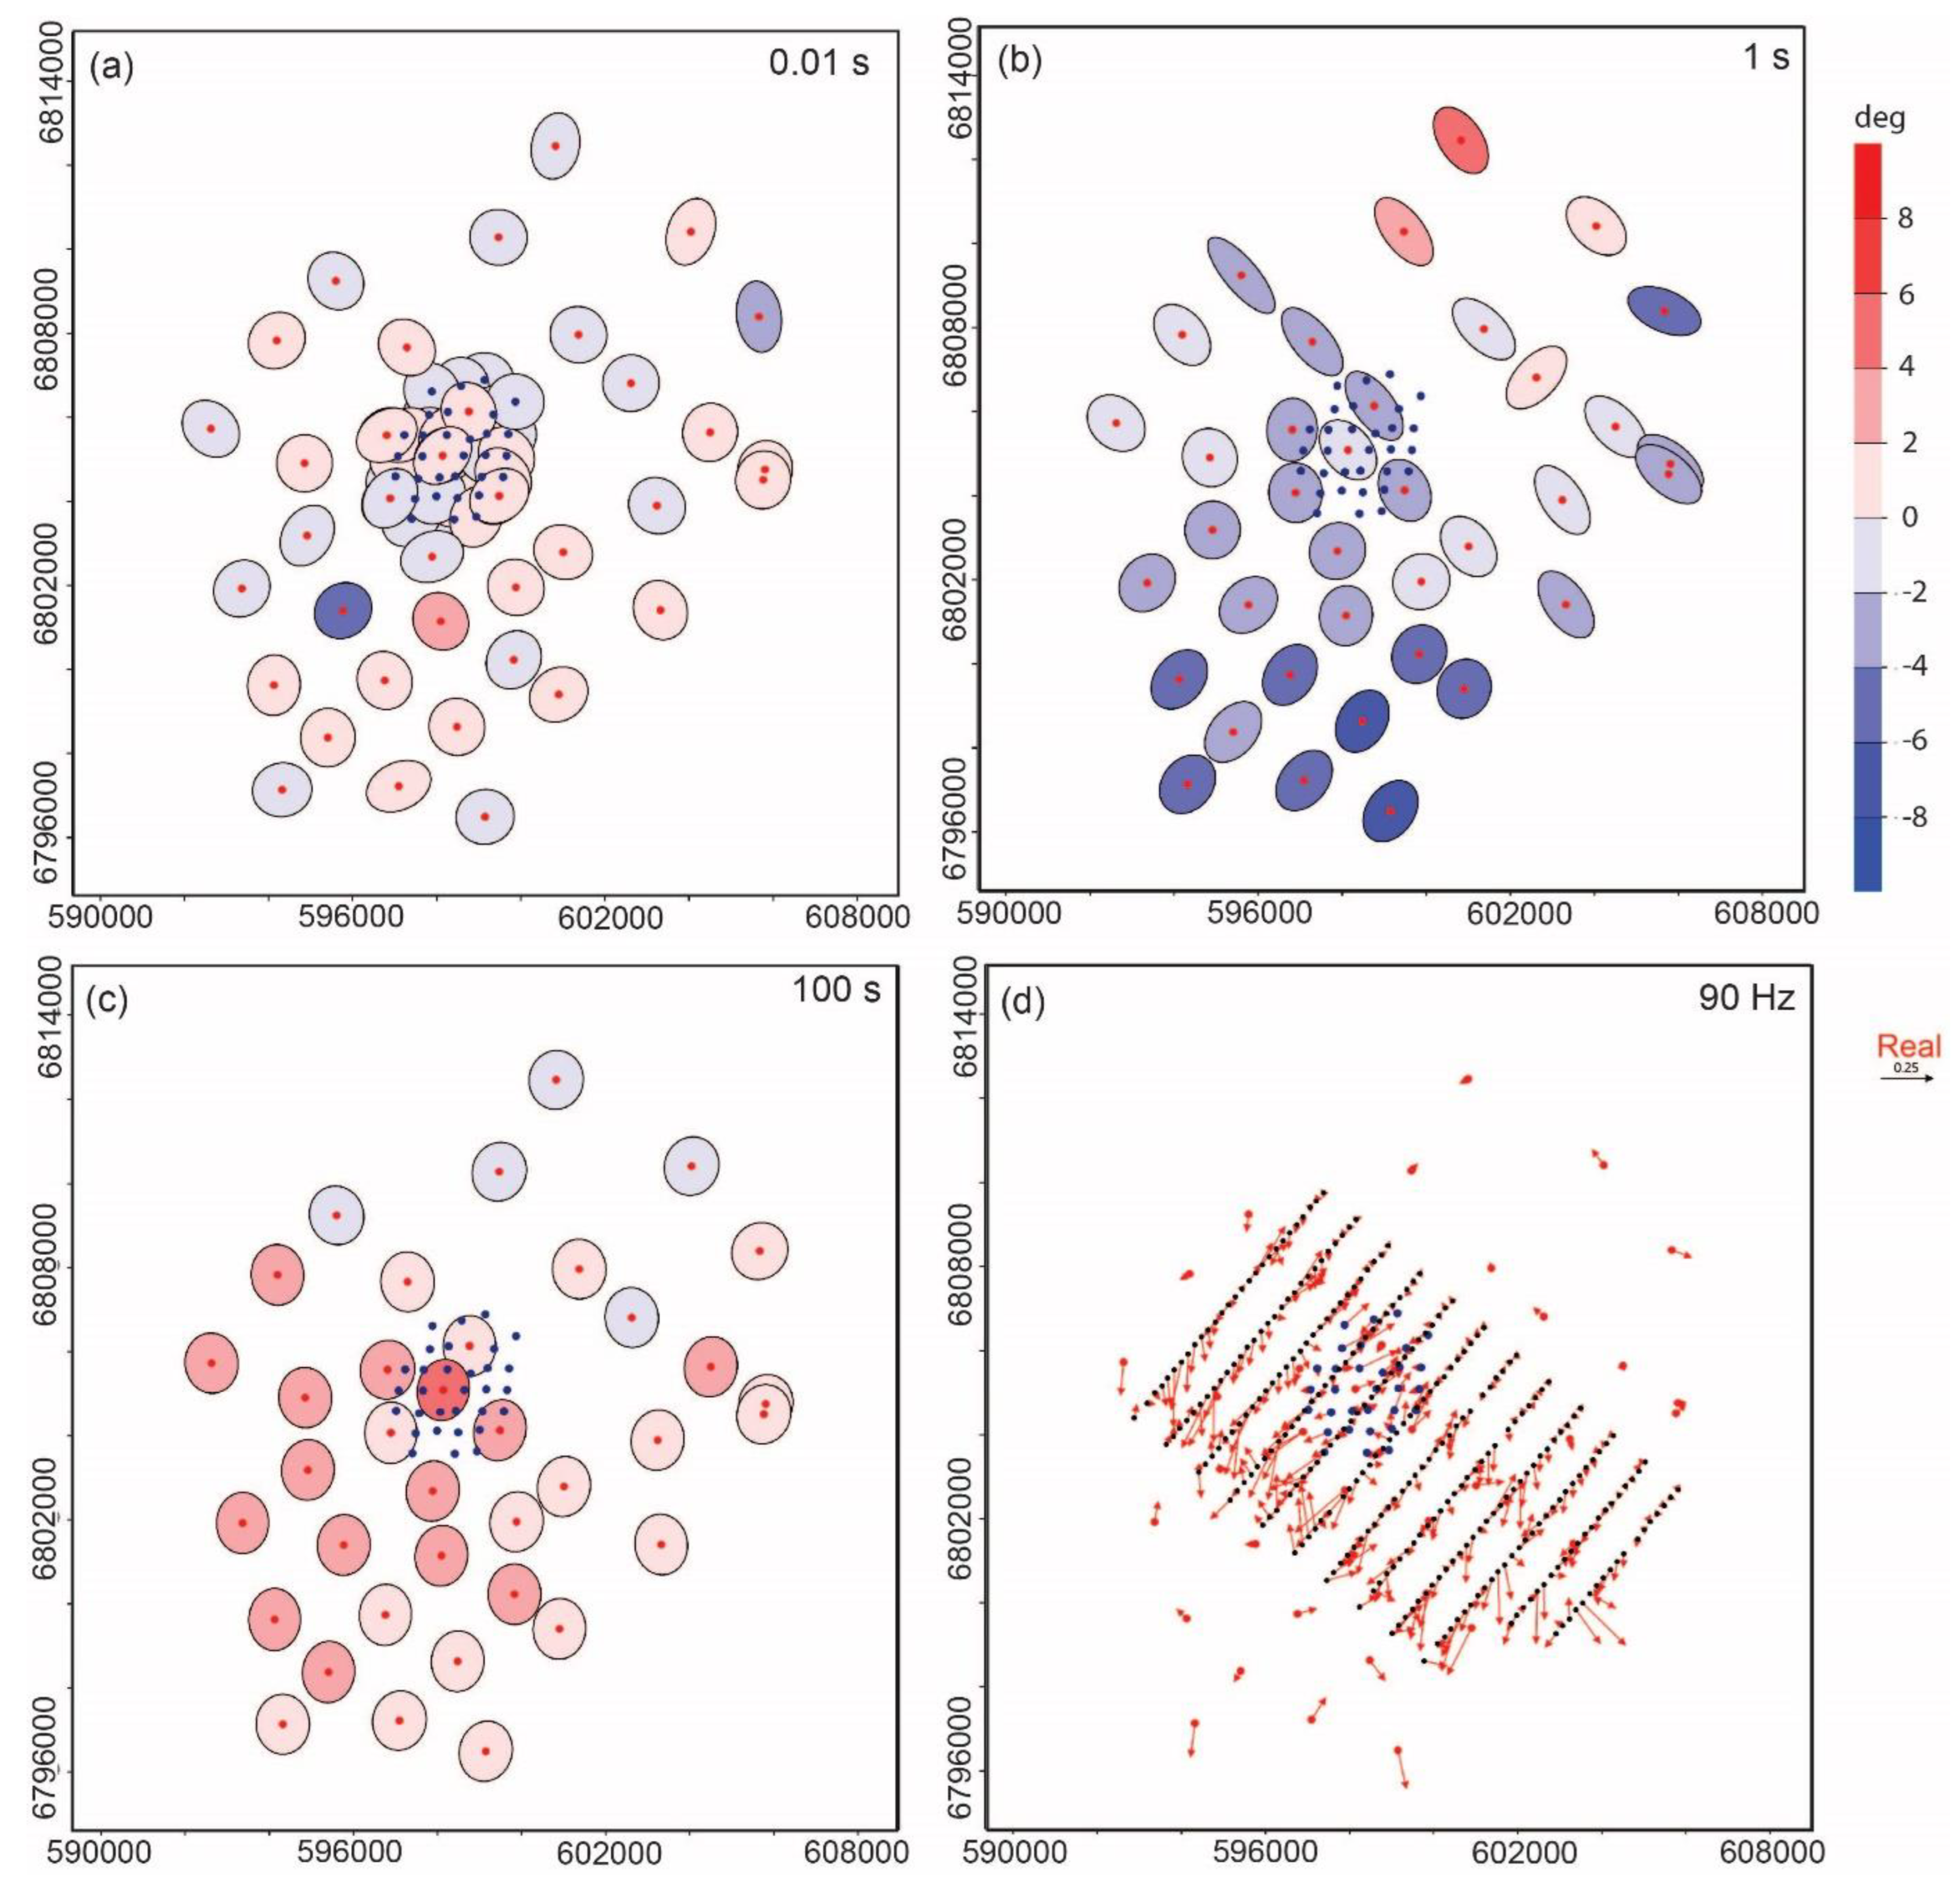
The dimensionality of the geoelectric structure was investigated using the phase tensor (PT) approach of [46]. Analysis of the PT skew (β) defines the asymmetry of the PT and is commonly used to determine the dimensionality of AMT and MT data, with |β| > 3° and large variation in ellipses from site to site being indicative of 3D structure [46,47]. For a 2D approach to be valid, not only does |β| need to be <3° the geoelectric strike must be consistent as a function of both space and period. Figure 4a–c shows the calculated PT for three periods—0.01 s, 1 s and 100 s. It can be seen that at for a period of 0.01 s (100 Hz), which is sensitive to near surface structure, the data are predominantly 1D or 2D with low β, and most of the sites are approximately 2D (or even 1D with weak 2D) at 100 s; however at 1 s, the southernmost MT sites are predominantly 3D (Figure 4b). The PT skew in the southwest at 100 s are rather large (Figure 4c), also indicating 3D structure. In light of this, and considering the 3D coverage of stations within the study area, we proceeded with 3D inversion.

5.2. 3D Inversion of Data

Impedance and vertical magnetic transfer function data were inverted in 3D using the RLM-3D inversion package [48,49]. RLM-3D uses a finite differences technique on staggered grids to solve Maxwell equations known as the Finite Integration Technique (FIT) [50]. It is formulated using a nonlinear conjugate gradient (NLCG) solver, which is a well-known optimization method that directly minimizes a non-quadratic objective function applied on rectilinear orthogonal cartesian grids [51]. RLM-3D handles topography by incorporating elevation data into the mesh.
Because of the variable station spacing (250 m for ELF-EM, 2000 m for MT and 500 m for AMT), and to capture the site to site variation of the highest resolution ELF-EM data, the model core was discretized into 100 m × 100 m horizontal blocks and was surrounded by 300 m by 300 m blocks (Figure 5a). Padding was calculated using a multiplicative factor of 1.5 in both directions. The model was discretized into 149 × 135 × 105 cells for a total of 2,112,075 cells.
We used 24 frequencies over a range of 9000–3.663 Hz in the AMT data and 36 frequencies over a range of 300–0.00274 Hz in the MT data, the eight ELF-EM frequencies over the range 1440–11 Hz however most of those were discarded [3] leaving mostly 720–22 Hz, for a total of 45 frequencies. Where available, vertical magnetic transfer function data was used to 2.0 s. Vertical magnetic transfer function data for periods >2.0 s were not used as they are likely related to a complex coast effect ~200 km away unrelated to the survey area. We first removed periods with low signal to noise from each station visually and one AMT and one MT station were discarded due to data quality issues. We tested a number of other inversions with different data configurations (MT-only, AMT-only, ELF-only, AMT + MT, etc.), model and regularization parameters using primarily RLM-3D but ModEM for the topography tests (Supplementary Information).
Previous models [3,52] used resistivities of 10 and 1000 Ωm for the ELF-EM and AMT-MT inversions, respectively. [53] recommended values close to the average resistivity of the dataset (=201 Ωm for all stations and all periods) as a suitable starting point. Our initial starting model used the AMT and MT data with a homogeneous half-space model with a background resistivity of 200 Ωm, no vertical magnetic transfer function, no distortion matrixes and minimum error floors of 5% of Z x x 2 + Z x y 2 for Z x x and Z x y , and 5% of Z y x 2 + Z y y 2 for Z y x and Z y y . This model was used as the starting model for an AMT-MT inversion including the vertical magnetic transfer function (Tz), which was then used as a starting model for an ELF-EM Tz inversion for 8 frequencies. The ELF-EM Tz inversion model was then used as the final starting model for the preferred inversion that included Z and Tz, and inverted for static distortion parameters [49] as a few of the sites showed evidence for static shift (e.g., MT35 vs. MT36). Topography was included in all inversions. This multi-stage process was necessary as RLM-3D was unable to invert all the datasets at once due to the limited frequency range of each ELF-EM station (generally only six usable frequencies) resulting in an excess of 50% missing frequencies of the 45 included for AMT and MT inversions. RLM-3D will not run with greater than 50% missing frequencies. The final normalized root mean square (nRMS) error decreased to 1.047. Most of the stations show a low nRMS (<1.0) and comparisons of some fits of the off-diagonal elements (XY and YX) are shown in Figure 3 and Figure S4.

6. Results and Interpretation

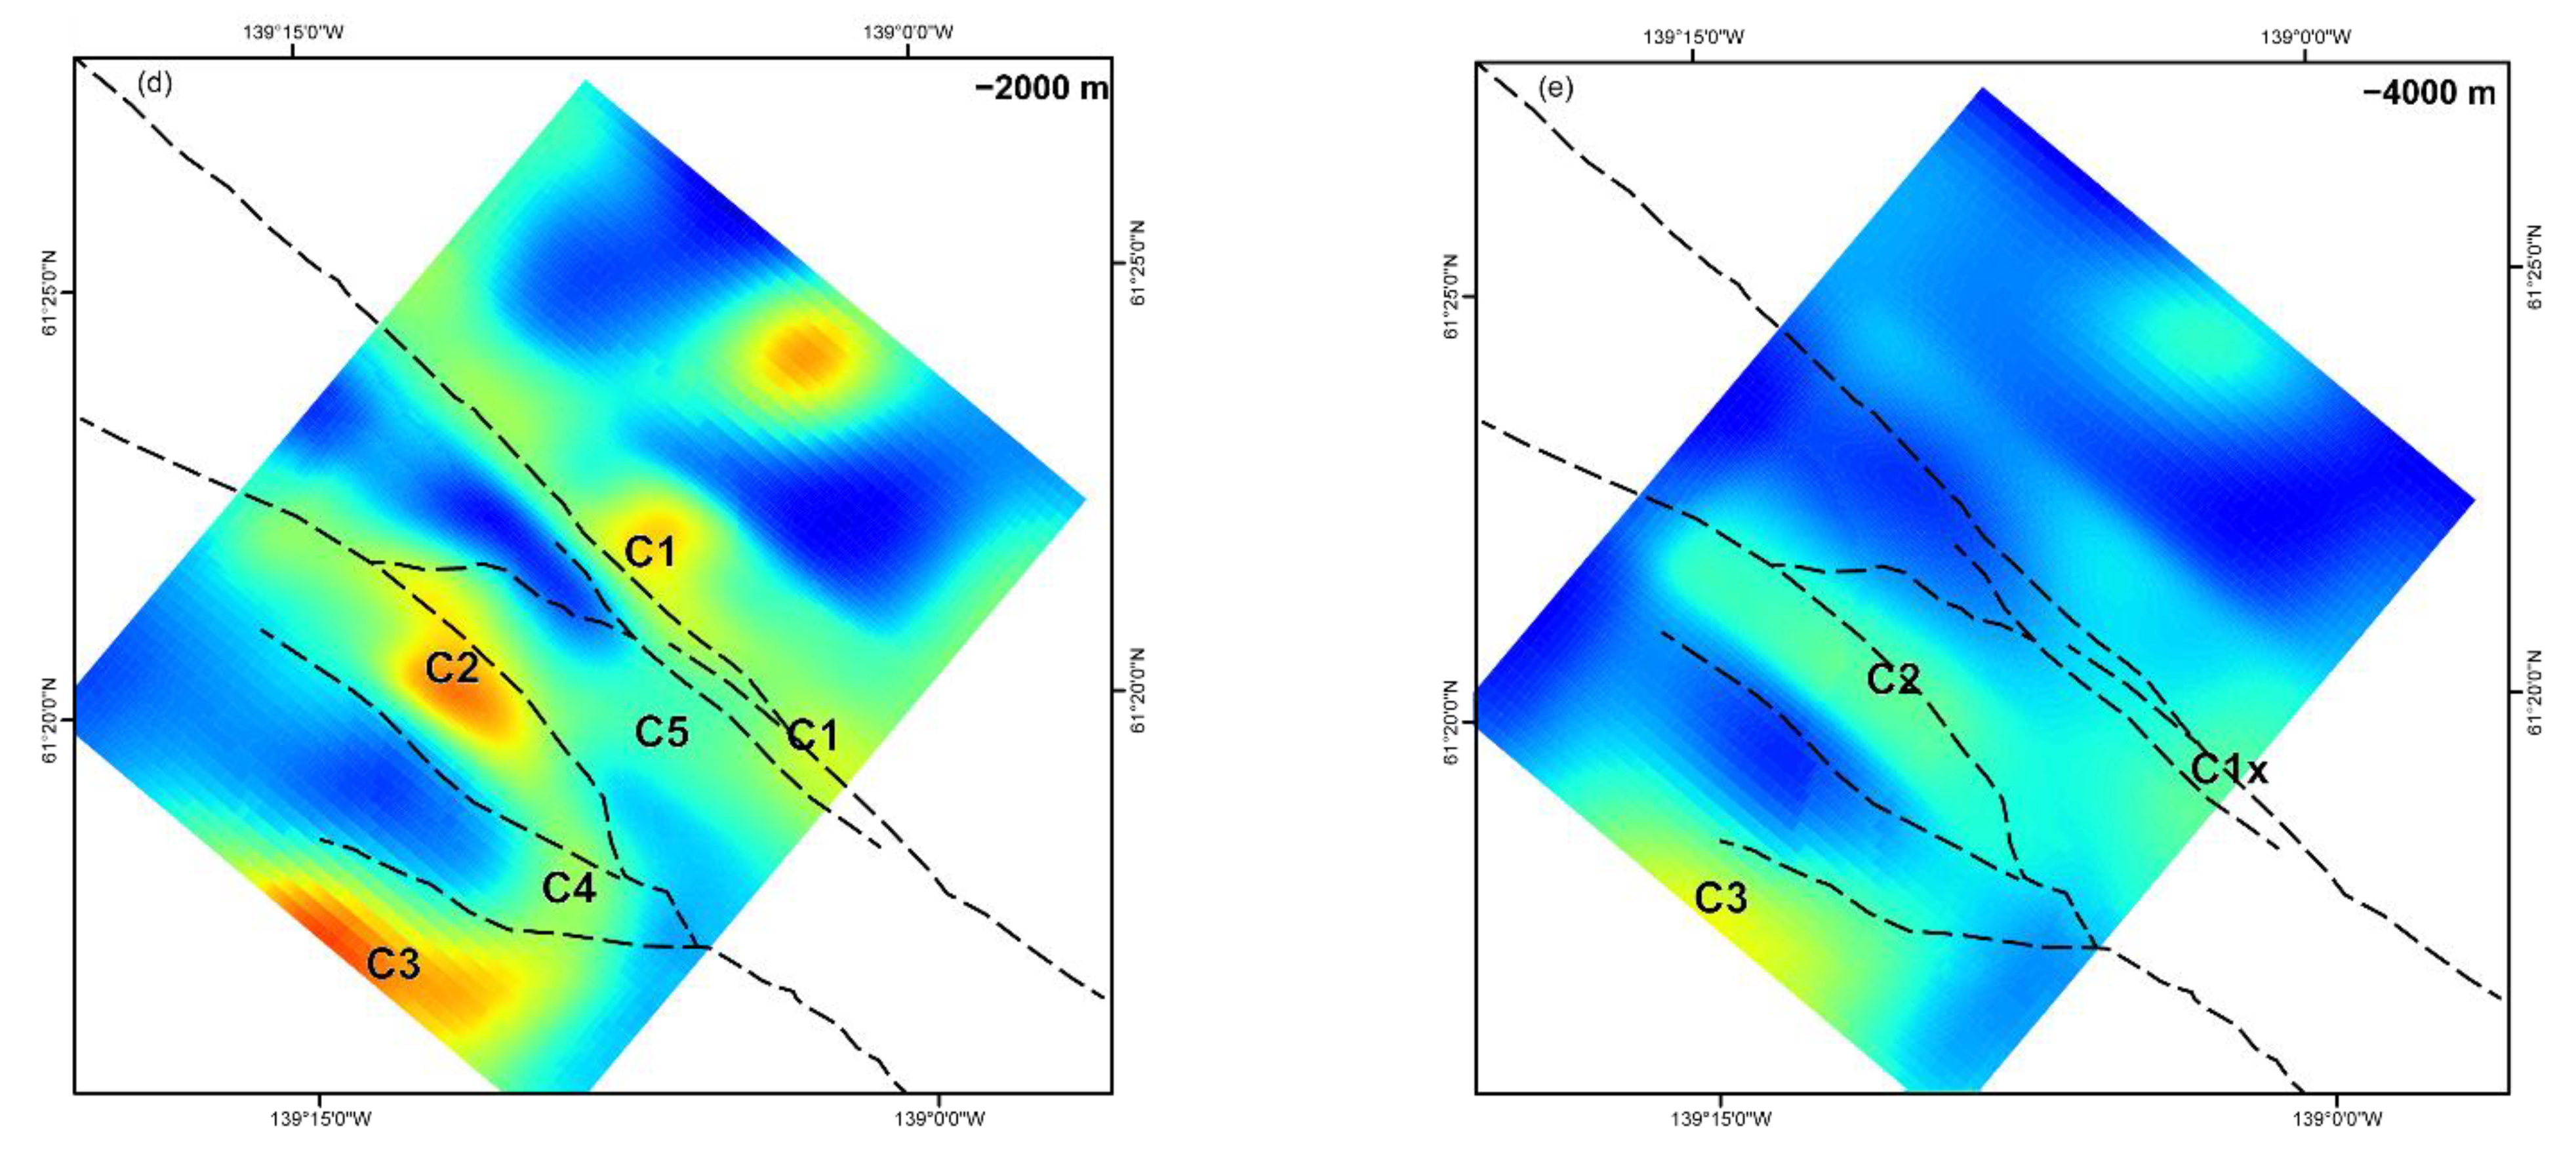
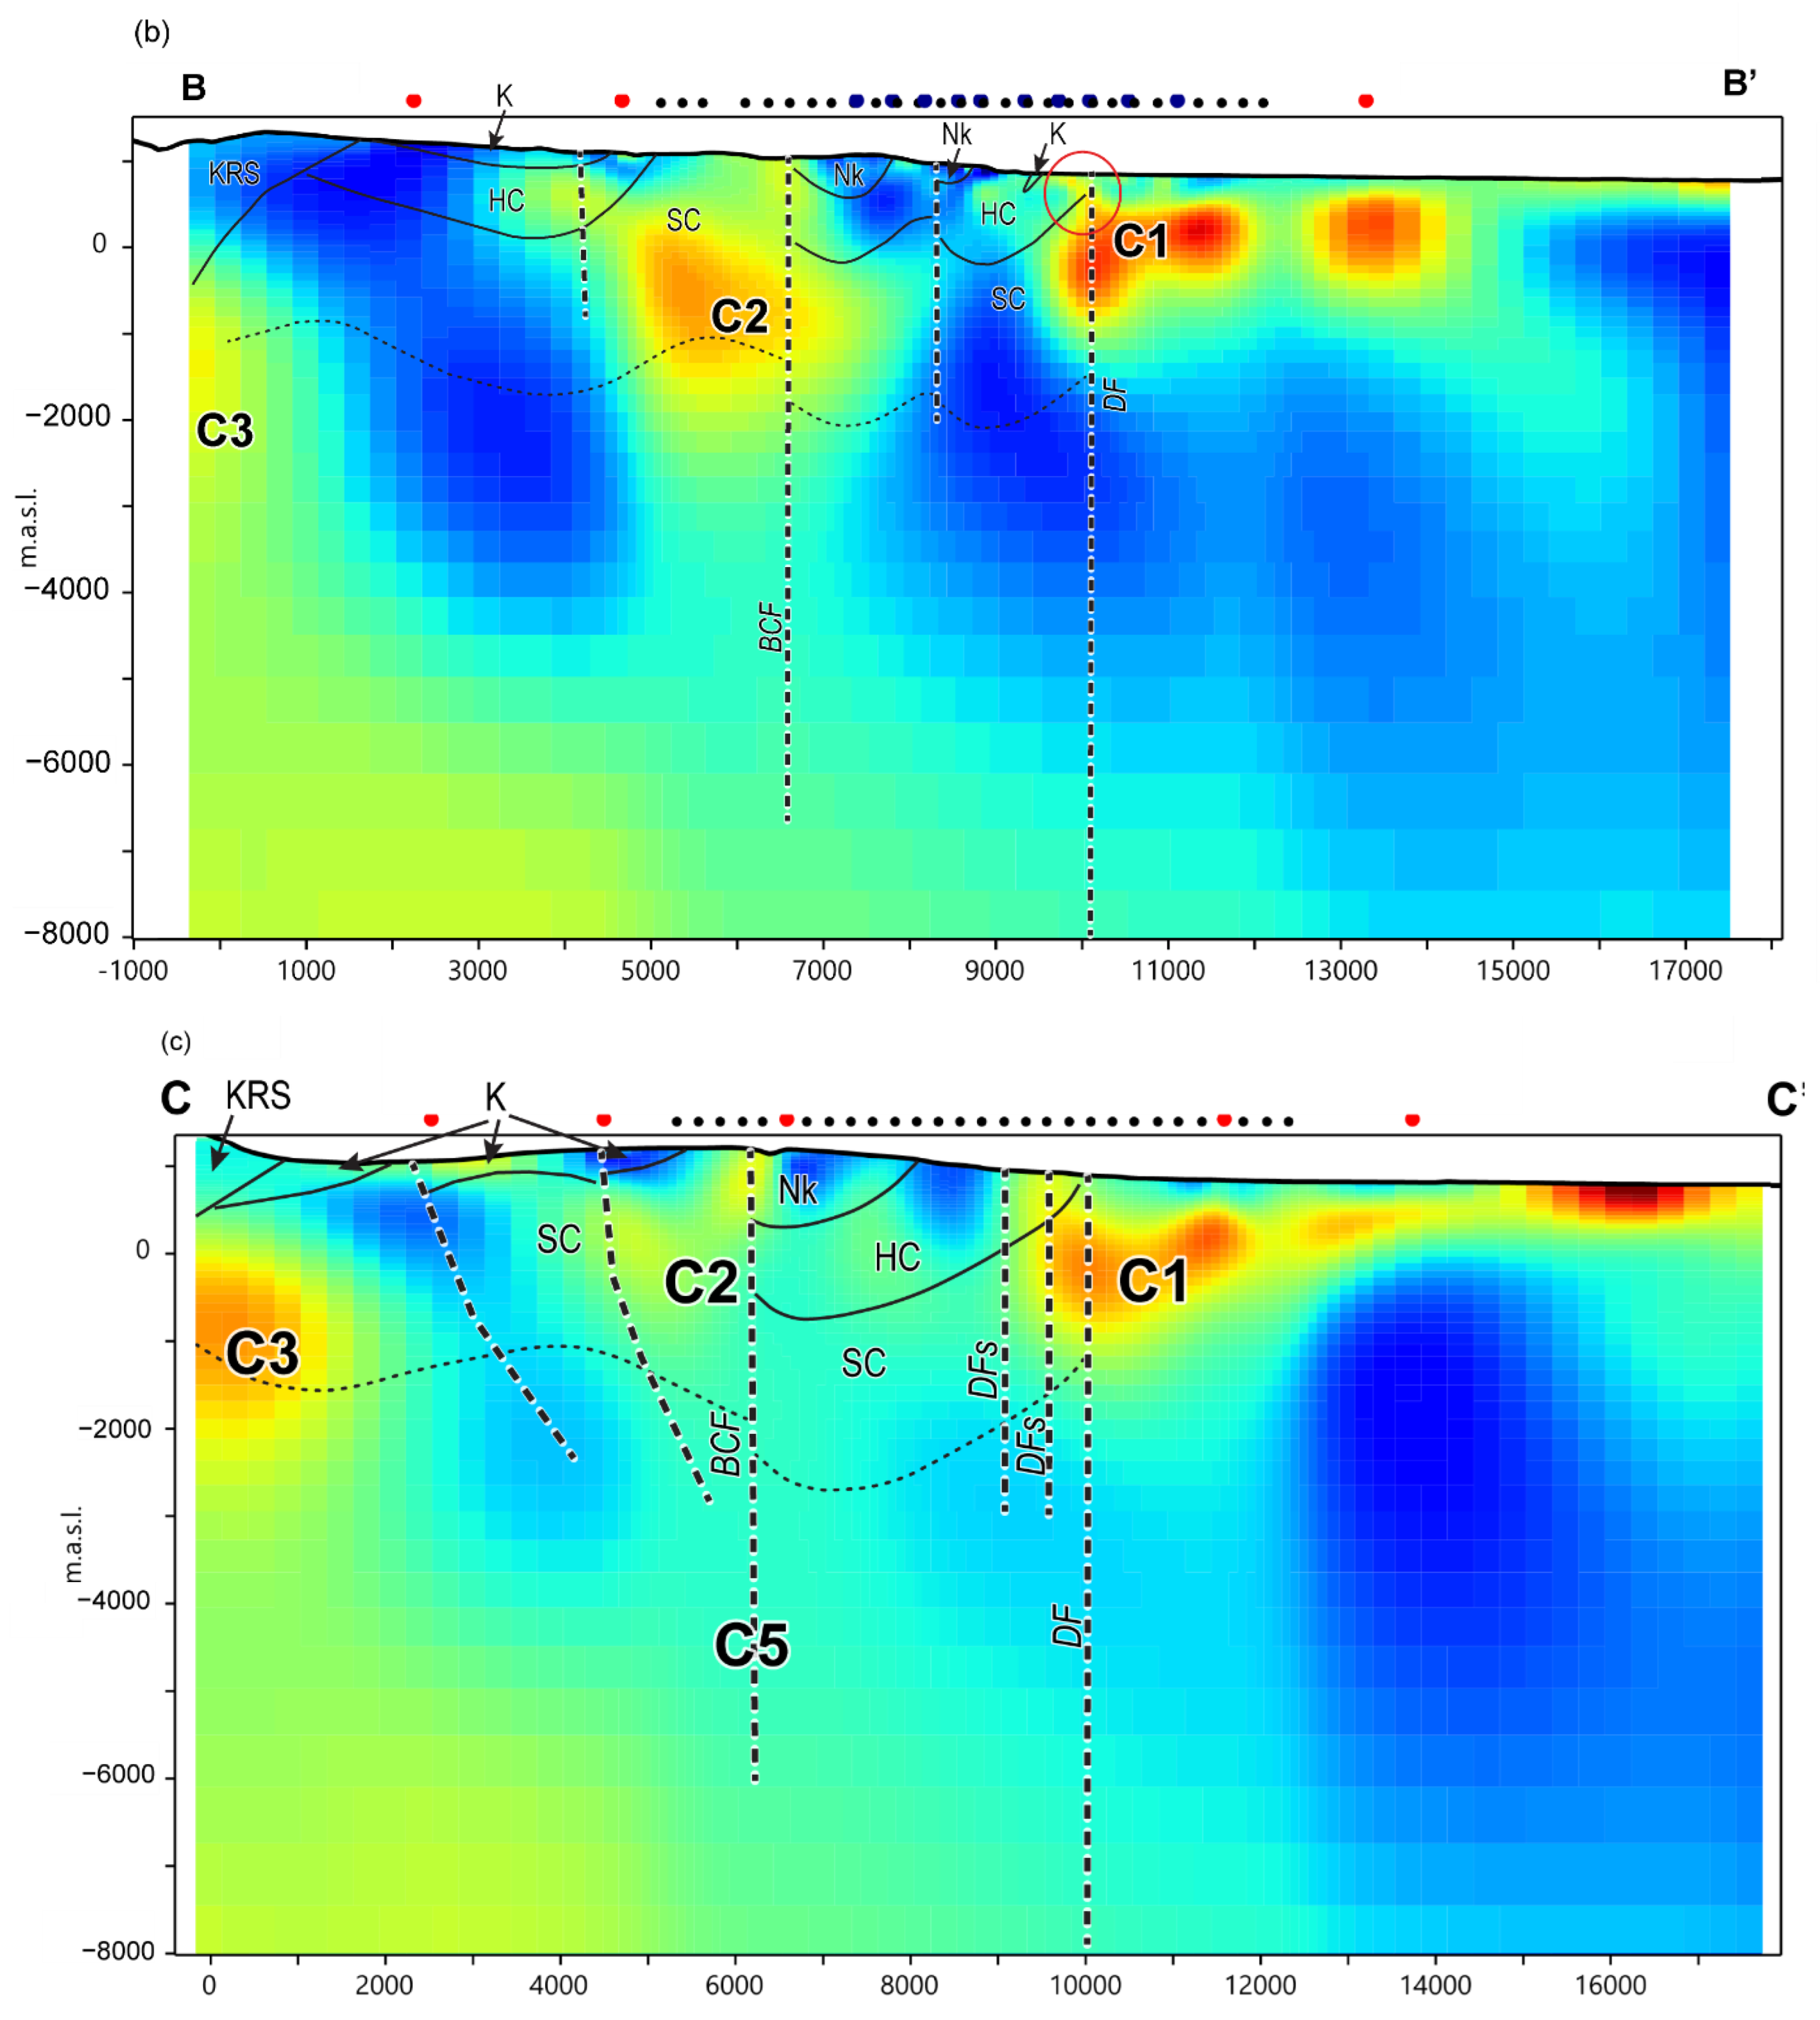
Plan view and cross-section slices of the preferred 3D electrical resistivity model are presented in Figure 5 and Figure 6. The most distinctive feature in the model is a northwest-southeast striking linear conductive zone (5–30 Ωm) corresponding to the surface trace of the Denali fault zone (Figure 5, C1). On the ELF-EM grids [3], which infer near surface structure due to the limited frequency range (1440 to 11 Hz), the Denali conductivity high is centered over the fault trace (Figure 7a). C1 cross-cuts the resistive Quaternary unit where fresh-water bearing glacial and alluvial Quaternary sediments overlie the Kluane Schist and the Station Creek Formation [3] (Figure 6). The feature can be traced ~1000 m below sea level and is located primarily northeast of the Denali fault zone, within the Kluane Schist. This C1 conductivity feature was present on all individually inverted datasets supporting its requirement by the data (Supplementary Information). Within the top ~1500–2000 m of the crust, the Kluane Schist is variably conductive on the plan view map and cross-sections (Figure 5 and Figure 6). This is consistent with [30]’s observations of the schist, which they described as graphite-bearing at low metamorphic grade, with decreasing amounts of graphite with increasing metamorphic grade. The absence of a conductive response at depth may signify decarbonation due to increasing P/T conditions.
Southwest of the Denali fault zone, Hasen Creek Formation sedimentary sequences overly Station Creek Formation dominantly volcanic tuff and volcaniclastic siltstone and subordinate basalt. Interpreted Hasen Creek rocks are generally resistive as expected from their dominantly high resistivity physical properties (Table 1); however conductive pathways seemingly cross-cut the sequence (e.g., Figure 6b,c) and are up to ~150 Ωm in places in our model (Figure 6b). On the cross-sections, they are often difficult to differentiate from underlying Station Creek Formation rocks that also have high resistivities (but also moderate conductivities (Table 1)) and cross-cutting conductive pathways (Figure 6b,c). Station Creek Formation rocks are interpreted to underlie most of the top 2000–3000 m in the study area and are intersected by the two major conductive faults—the Denali (C1) and Bock’s Creek (C2). Bock’s Creek fault movement is poorly constrained [37] and similarly presents as a conductivity high along the fault plane (Figure 5), intersecting predominantly volcanic rocks of Nikolai and Station Creek formations. Where outcropping, fault gauge and breccia were observed implying brittle movement [37]. On the potential field maps, the structure is a gravity and magnetic low in contrast with the physical property characteristics of these units—they are predominantly dense and in the case of the basalts, magnetic (Table 1, Supplementary Information)—suggesting a fairly significant damage zone and possible hydrothermal alteration. C2 is located primarily southwest of the structure (Figure 5) within predominately Station Creek Formation rocks, although conductive offshoots do transect the structure to the east in places at a variety of depths (Figure 5a,c,d C4). Station Creek Formation rocks are generally more conductive than the younger Nikolai Formation basalts (Table 1). Bock’s Creek fault’s low resistivity (C2) may be related to increased pore space due to brittle fracturing.
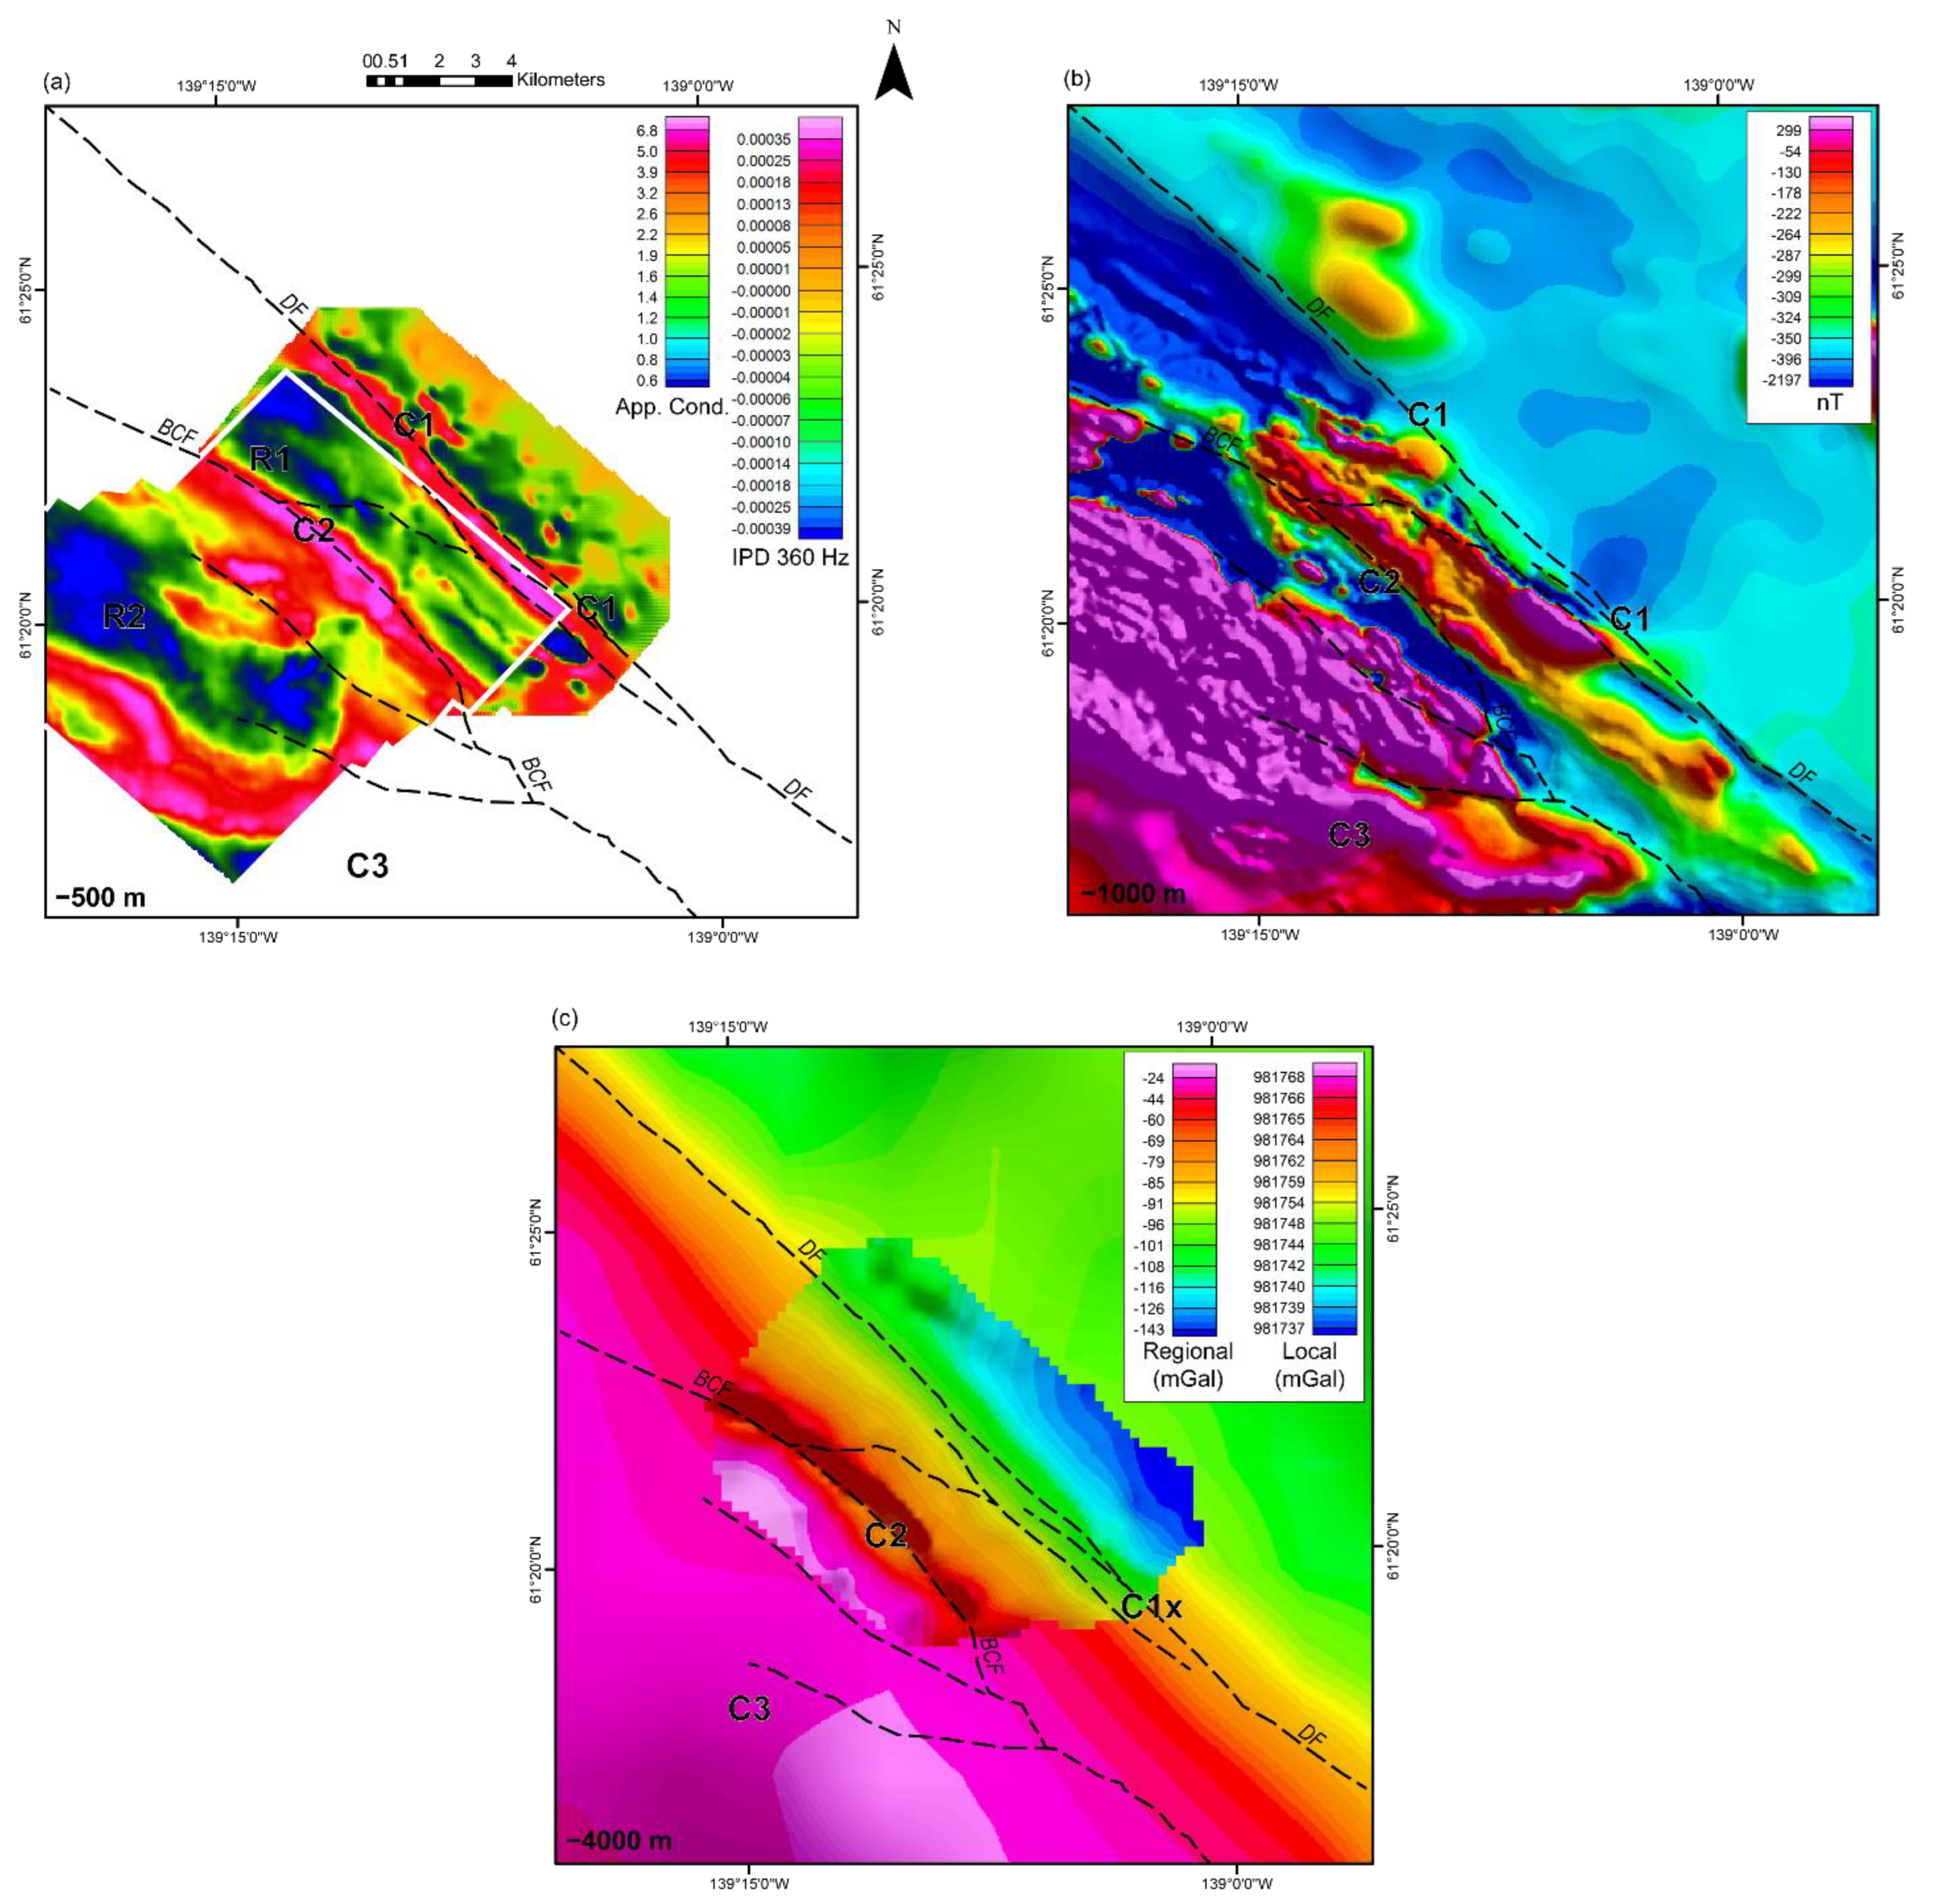
The mafic rocks of the Nikolai Formation basalt are visible on the potential field maps as linear magnetic and gravity highs (Figure 7b,c) and are one of two magnetic units sampled for rock properties in the study area (the other being one sample of magnetic Station Creek andesite; Table 1). On the resistivity model (Figure 5a), Nikolai Formation basalts correspond to resistivity highs (R1) in line with their measured resistivities averaging ~3322 Ωm (Table 1). Adjacent to the study area, [36,37] modelled the basalts as synforms with ~900 m thick limbs that in places correlate well with the modelled resistivity responses (Figure 6a–c).
The southwestern corner of the study area predominantly comprises the Kluane mafic-ultramafic complex and does not have a diagnostic resistivity response, but does correspond to the largest gravity and magnetic highs on the potential field grids (Figure 7b,c). Where mapped, the complex exists as 100–300 m sills infolded with Hansen and Station Creek formations rocks [36,37]. We interpret the near surface, flat-lying predominantly high to moderate resistivity zones along the cross-sections (Figure 5b (R2) and Figure 6a,b) as the mafic-ultramafic rocks.
A high conductivity feature (Figure 5 and Figure 6; C3) is present in the southern corner of the study area over the Kluane Ranges intermediate to mafic intrusive rocks. As only one MT station is located over the unit and it is at the edge of the mesh, it is difficult to ascertain if the conductivity high is related to the igneous suite, or an inversion artefact populating high conductivities at the margins of the core to fit the long period transfer function data. While not immediately in the study area, massive sulfide-hosted base and precious metal deposits including the Wellgreen deposit are found within pyritic mafic and ultramafic rocks of the Kluane ultramafic suite ([38], Yukon MINFILE 115G 024 in [55]). Additionally, the only two samples of the mafic-ultramafic intrusion record relatively moderate to high resistivities (438 and 1900 Ωm). Large conductors visible in the airborne electromagnetic map (Figure 7a) are co-located with the high amplitude magnetic high corresponding to the Kluane Ranges igneous suite reinforcing the interpretation that C3 may be real, and the induction arrows are pointing to large volumes of massive sulfide bodies within the intrusive suite. As modelled, C3 is generally present as close to surface as 1 km and as deep as 6 km.

7. Discussion

The purpose of this study was to gain an enhanced understanding of the geothermal potential of the Burwash Landing area. Although there is no known surface manifestation of a hydrothermal system in the region, occurrences of warm waters (16–18 °C) at Jarvis River and in wells at Haines Junction and Burwash Landing [9,10] coupled with an elevated geothermal gradient inferred from Curie point depth mapping [2] suggest the potential for blind geothermal systems in southwestern Yukon. Our study focused on the Denali fault zone and its potential to create increased permeability that could allow ascent of warm fluids to shallow crustal levels. In the following section, we discuss the electrical structure of the subsurface and its relationship to a potential geothermal system.
Our model over the Denali fault (C1) generally agrees with results obtained from other major strike-slip faults (e.g., [56,57,58]), including those prospective for geothermal energy (e.g., [16,17,21,59]), where these faults are associated with steeply to vertically dipping zones of increased conductivity. Previous MT surveys over the eastern Denali fault in Alaska [60,61,62] similarly modelled steeply to vertically dipping conductors north and/or beneath the fault; however, with some notable differences to our Denali model. While [61]’s body began at −9 km a.s.l., our study did not achieve this depth penetration and our deepest conductivity highs are related to C3 in the south. [61] were also not able to accurately resolve features in the top 3–5 km as we did and was a 2D study where only the transverse magnetic mode was fit. Our model has some similarities to [60] including a 10–50 Ωm conductivity high (C1) located north of the main strand of the Denali fault system, albeit the thickness of our body is only 1–1.5 km vs. their ~20 km thick conductor. [60], however, constructed their 2D inversion model by stitching a series of 1D inversion models which can be affected by multidimensional data [62] and had a much larger survey aperture to image deeper features [60]. While [61] attributed their conductor to aqueous fluids due to an accompanying seismic bright spot, [60] believed their conductor was related to carbon and/or metallic films. In our study, the linear, connected conductivity high along strike of the main Denali fault zone (C1) could similarly represent enhanced fluid content within the fault zone [56,58] or fluid-deposited graphite [57,63]. The main strand of the Denali fault bounds Kluane graphitic schist to the north, while the western strands intersect predominantly Hasen Creek non-graphitic sedimentary sequences (Figure 2). Migrating fluids could have picked up carbon from the schistose country rock that was then transported laterally along the active fault zone where carbon was precipitated from carbon-rich fluids [57]. Our preferred interpretation of C1 is fluid-deposited graphite scavenged from upper crustal metasedimentary rocks.
The previously interpreted southwestern strands of the Denali fault system [3,12] (Figure 2) were not resolvable conductive pathways in our model (Figure 5b,c). This agrees with [13] who, based on newly acquired LiDAR data, proposed only the main strand of the Denali was recently active. The localization of C1 near the active fault trace could be explained by graphite-bearing fluids moving along the fault during strike-slip displacement [57]. The dip of C1 corresponds to the upper surface of the graphite-bearing Kluane schist bedrock where it underlies surficial material. C1 daylights at surface on almost every cross-section as a notable, thin conductive pathway best visualized on Figure 6b (circled in red) where there is higher resolution AMT coverage along the cross-section. A subtle pathway is similarly present on Figure 6c,d and does not generally correspond with a fault strand (Denali Fault stand; DFs). In most cases, the thin pathways daylights in Hasen Creek rocks which may have enhanced permeability in comparison to the Kluane Schist and allow release of fluids migrating along the main fault zone. In such a case, these areas may be worthwhile to investigate with temperature probes.
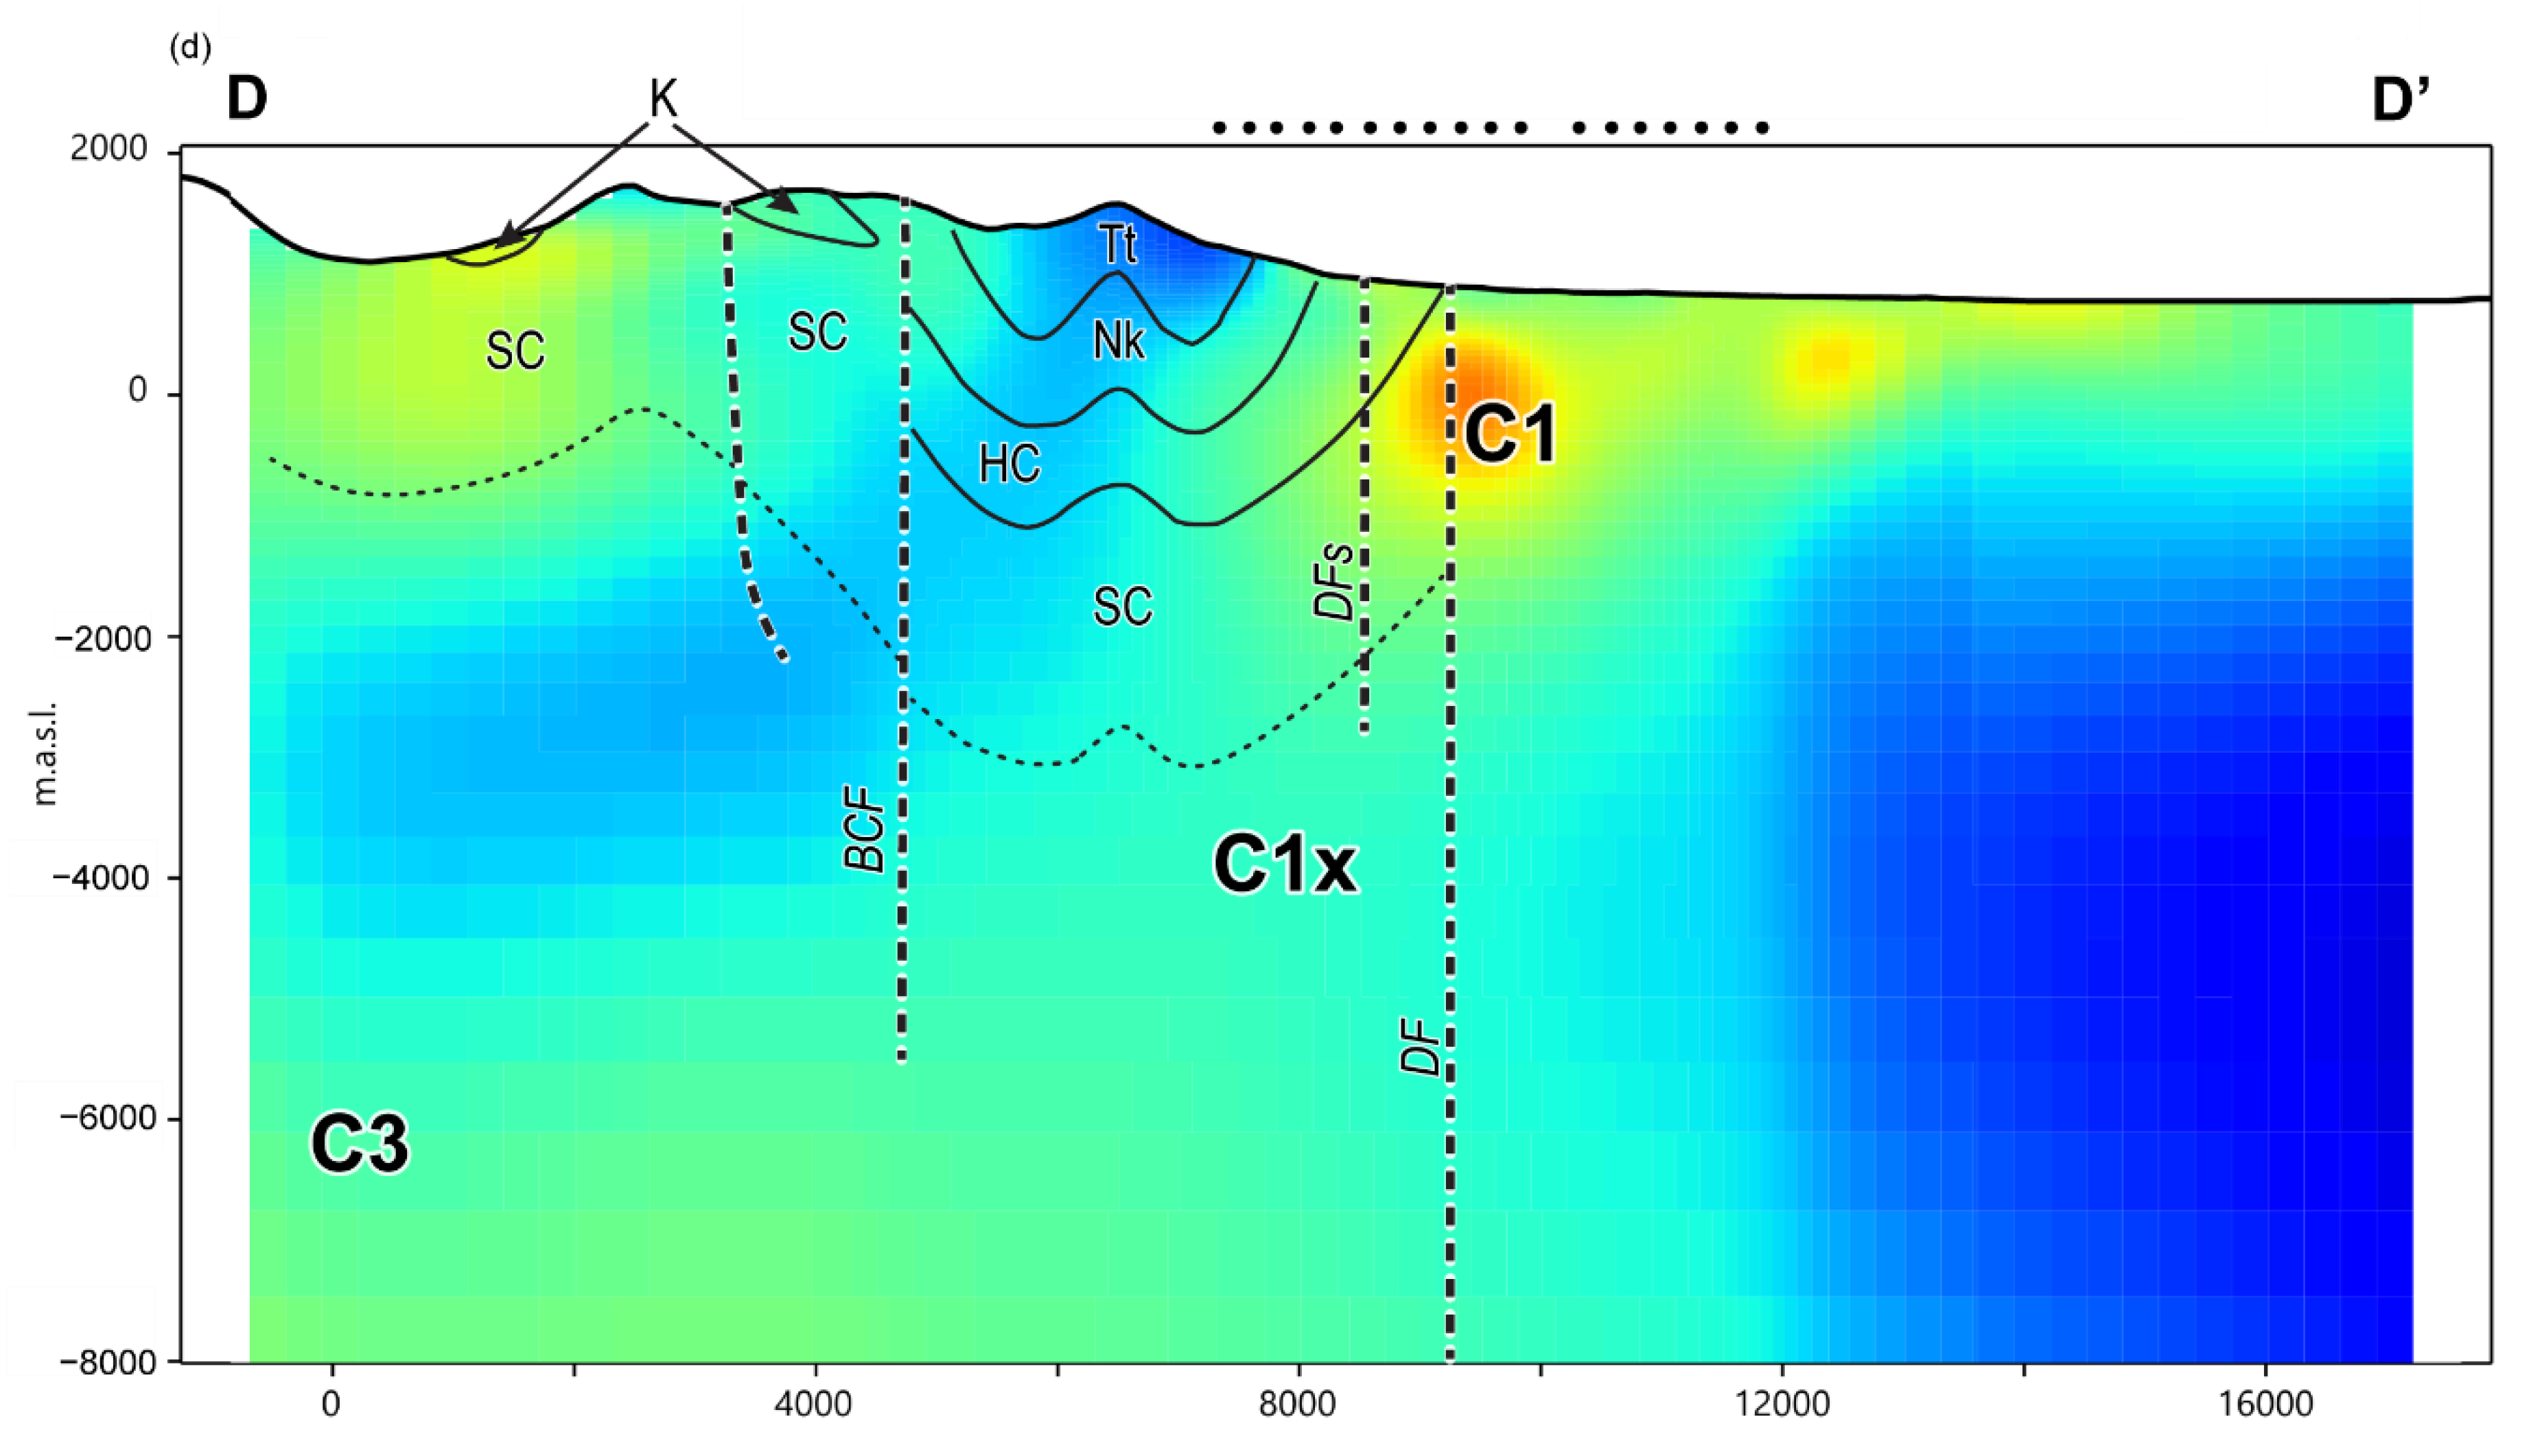
Multiple independent datasets including ELF-EM, gravity, magnetic, geological and topographic data [3,13] suggest the Denali fault system within the study area contains a pull-apart zone where transtension may provide a particularly favorable structural setting for geothermal activity. The joint ELF-EM/AMT/MT inversion modeling undertaken as part of this study partly supports this interpretation. Despite the entirety of the northeastern study area mapped as pelitic schist (Figure 2), C1 is fairly localized northeast of the fault trace (Figure 5 and Figure 6) with the exception of the LiDAR-interpreted right-stepping bend where C1 is localized along the fault trace (Figure 5) [13]. Releasing bends in strike-slip systems accommodate extension and are often complex sites of fracturing and associated high fluid flow [64], both of which can increase the conductivity [43]. Below −3600 m.a.s.l. all conductivity highs related to C1, with the exception of the interpreted releasing bend (Figure 5e C1x), are no longer present on our model, potentially eluding to significant fluid flow and/or fracturing along the releasing bend to have facilitated deeper fluid penetration. Additional MT acquisition southeast of the study area would provide more constraints on the presence or absence of C1x at depth.
Similar evidence for fluid movement and/or reactivation is found along the Bock’s Creek fault (C2) where brittle structures were mapped in outcrop [36]. A 20–70 Ωm conductivity high co-located with the fault plane extends from surface through the depth of the cross section—deeper than the Denali fault (Figure 5d,e)—through the length of the profile where it converges with a mid-crustal conductivity high. The medium to high conductivity response of the fault, gravity low (Figure 7c), and magnetic low (Figure 7b) suggests that brittle fracturing may have lead to an increase in permeability, which facilitated fluid flow and hydrothermal alteration. The Bock’s Creek fault may have also been in a trantensional regime related to the Denali and leading to an increase in accommodation space to create a fluid conduit.
One of the main unanswered questions related to the potential geothermal system near Burwash Landing is the heat source or mechanism responsible for driving hydrothermal fluid flow. In New Zealand, the elevated temperature gradient of the comparable Alpine fault is caused by rock advection during uplift and exhumation, and fluid advection from continued deep groundwater circulation and upwelling [17] manifested locally as an >8 km depth conductivity high below the fault trace [56]. However, the rate of movement of the Alpine fault is 10 times higher than the Denali fault [3] allowing for more circulation of warm fluids. The Great Basin geothermal system is related to crustal thinning and extension [15]. There, warm mafic magmas accumulated at the base of the thinned lithosphere and propagated hot saline fluids into the crust through the weakened brittle-ductile transition along pre-existing structures [16]. MT models have imaged this magmatic underplating below the geothermal systems [65,66] as accompanying near vertical conductive crustal structures that extend to the lower crust [16]. C1 generally only extends down to ca. −2300 m.a.s.l. and on most profiles only shows a subtle lower crustal connection (Figure 6a–c); however, on Figure 5e and Figure 6d we have more evidence for a lower crustal connection at the releasing bend. C1 seemingly connects with C3 (Figure 6d) but due to the small aperture of the survey area, the depth of this conductive pathway is pushing the resolving power limits of the MT data (Supplementary Information). Again, additional MT stations are needed to confirm the presence of this feature.
One interesting feature resulting from our model is the presence of C3 and its relationship to the Bock’s Creek fault (C2). C3 was present during the MT sensitivity testing and inversion of non-tipper datasets (Supplementary Information) suggesting it is a robust feature and required by the data. C3 is also seemingly connected to a broader conductive body at depth that also connects to C2 (Figure 5d, C4) through a ~350° striking conductivity high (Figure 5c,d) that is oblique to the main Denali fault strand along what would be the zone of extension in a dextral transtensional environment. Magmatic rocks of the 117–115 Ma Kluane Ranges intrusive suite [67] generated large volumes of intermediate to mafic rocks in the southwestern edge of the study area (Figure 2) that are visible as large positive gravity and magnetic highs (Figure 7b,c). The breadth of the regional gravity high suggests significant dense rocks have accumulated below the subsurface. The most recent magmatic activity in the Burwash Landing region is related to emplacement of granodiorite plutons and intermediate to felsic volcanic rocks of the Miocene Wrangell suite (Figure 2). Extensive volcanism can be associated with magmatic underplating [68]. Magmas located at the base of the lithosphere can release hot saline fluids that then travel up through the crust along zones of weakness driving geothermal systems [16]. Preliminary satellite data acquired by the last author identified a thermal anomaly over the Duke River eluding to a possible surface manifestation of the geothermal system. Considering Bock’s Creek fault intersects the Duke River additional studies may want to consider water temperature profiling both near and away from the Bock’s Creek fault.

8. Conclusions

As Canada transitions to a clean-energy economy, an increasing focus needs to be placed on renewable, low carbon energy sources such as geothermal energy. Search for such resources can be advanced using geophysical methods to help reduce the exploration risk associated with drilling costs. This is one of the first studies in Canada evaluating the geothermal potential along a major fault zone. This type of exploration is common in Nevada, USA, but so far geothermal studies in Canada have mostly focused on deep sedimentary aquifers and volcanic-associated systems. In this study, we evaluated and inverted 84 MT and AMT data alongside ELF-EM data to generate a subsurface electrical model of the eastern Denali fault system to −8000 m.a.s.l near Burwash Landing, Yukon. The region is prospective for blind geothermal resources based on a number of previous studies that evaluated the geothermal potential of communities across Canada’s Arctic [1]. This prospectivity was further corroborated Curie point depth modelling [2]. Our model is consistent with previous geological studies and revealed a vertical 5–30 Ωm conductive body (C1) extending from surface to ~1000 m depth along the length of the main Denali fault zone. The absence of conductors along its southwestern strands suggest only the main strand was recently active and an interpreted fluid release pathway was modelled by the higher resolution AMT data. The releasing bend is visible in our model and showed the largest depth extent, suggesting deeper penetration of fluids along the fault trace as expected in an extensional environment; however additional stations are needed to reinforce this interpretation. An additional 20–70 Ωm vertical conductor is associated with the Bock’s Creek fault (C2), which is seemingly connected by a conductive pathway that extends −7000 m.a.s.l. C2′s location with respect to nearby intermediate to mafic intrusions, and connection with a mid-crustal conductivity high raises more questions about its relationship to the main Denali fault system and potential hydrothermal regime.
While our models show evidence of fluid flow along the two major faults in the study area, the question remains as to the temperature of the fluids and whether they are suitable for geothermal exploitation. On-going studies are planned to expand the MT survey coverage to provide better constraints on the mid- to lower crustal conductivity response and relationship, if any, to lower crustal conductors. Planned drilling of a temperature gradient well and ground-temperature surveys will further constrain the geothermal potential of Burwash Landing.

Supplementary Materials

The following supporting information can be downloaded at: https://www.mdpi.com/article/10.3390/rs14235963/s1, Figure S1: (a) Apparent resistivity and phase curves for metal plates (red filled circles (xy) and blue filled squares (yx)) and porous pot electrodes (red outlined circles (xy) and blue outlined squares (yx)). (b) Apparent resistivity for plates for 24 h referenced site reprinted with permission from [69]. © 2021, Quantec Geoscience. (c) Apparent resistivity for pots for 24 h referenced site reprinted with permission from [69]. © 2021, Quantec Geoscience. Figure S2: Cross-section over B–B’ (Figure 6b) using various passive EM datasets. (a) ELF-EM; (b) AMT; (c) MT; and (d) AMT-MT inversion with no vertical magnetic field (Tz) data. Figure S3: Forward tests of 200 Ωm half-space models including: (a) and (b) no topography versus (c) and (d) topography in one AMT and one MT station (from Table S1). The estimated XY and YX components are represented by red and blue lines, respectively. Figure S4: Measured (red circles (XY) and blue squares YX) and calculated (lines) apparent resistivity and phase curves for XY (red) and YX (blue) for 12 typical sites. Error bars plotted over the data as red or blue lines. Measured tipper plotted as pink squares and calculated tipper plotted as pink lines. Masked data are plotted in grey. Figure S5: Normalized determinant phase pseudo-sections to assess the depth sensitivity of the model by introducing bodies with resistivities of 20 Ωm, 200 Ωm, and 1000 Ωm at: (a) −2 km, (b) −4 km, and (c) −6 km depth. The nRMS of each test is shown at the bottom of each corresponding model. Figure S6: Sensitivity test on C3 by replacement with 200 Ωm background resistivity. (a) SW-NE cross-section showing the C3 feature test. (b) Apparent resistivity and phase as functions of period for closest sites to the C3 test. Solid and dashed lines show the results of forward response of preferred inversion and forward response with C3 replaced with a 200 Ωm body. Figure S7: Resistivity versus porosity for samples from Table 1. Table S1: Model parameter testing. Bold values were used for the preferred model (Figure 5 and Figure 6).

Author Contributions

V.T.: data analysis and processing, investigation, methodology, data curation, writing—original draft preparation, writing—review and editing, conceptualization, visualization, formal analysis. M.C.: writing—original draft preparation, writing—review and editing, conceptualization, project administration, funding acquisition, resources. J.C.: writing—original draft preparation, writing—review and editing, conceptualization. F.H.G.: validation, writing—review and editing. R.J.E.: writing—review and editing, data curation. S.E.G.: writing—review and editing, resources. All authors have read and agreed to the published version of the manuscript.

Funding

This research was supported by funding from the Canadian Northern Economic Development Agency (1819-CN-000053) and Natural Resources Canada’s Emerging Renewable Power Program (ERPP-RA-08) to the Yukon Geological Survey, and by the Geomapping for Energy and Minerals Program of the Geological Survey of Canada.

Data Availability Statement

AMT and MT data collected in 2021 will be available through the Yukon Geological Survey’s integrated data system as Open File 2022-07 [52] at https://yukon.ca/en/geology-publications-data (accessed on 21 November 2022).

Acknowledgments

AMT and MT data were collected by Quantec Geoscience and ELF-EM data were collected by Aurora Geoscience. We thank the Kluane First Nation for support and access to their traditional lands. The authors are grateful to Eric Roots for constructive comments and providing his pymt code. A comprehensive internal review by Jon Liu, Carolyn Relf and anonymous constructive peer reviews further improved our manuscript. This is Geological Survey of Canada contribution number #20220264 and Yukon Geological Survey contribution #062.

Conflicts of Interest

The authors declare no conflict of interest.

References

  1. Majorowicz, J.; Grasby, S.E. Geothermal Energy for Northern Canada: Is it Economical? Nat. Resour. Res. 2014, 23, 159–173. [Google Scholar] [CrossRef]
  2. Witter, J.B.; Miller, C.A.; Friend, M.; Colpron, M. Curie Point Depths and Heat Production in Yukon, Canada. In Proceedings of the 43rd Workshop on Geothermal Reservoir Engineering, Stanford, CA, USA, 12–14 February 2018; Stanford University: Stanford, CA, USA, 2018. [Google Scholar]
  3. Witter, J.B. Early-Stage Exploration for Geothermal Energy Resources along the Denali Fault near Duke River, Yukon. Yukon Geological Survey, Open File; Government of Yukon: Yukon, YT, Canada, 2020; 70p. [Google Scholar]
  4. Fraser, T.A.; Colpron, M.; Relf, C. Evaluating geothermal potential in Yukon through temperature gradient drilling. In Yukon Exploration and Geology 2018; MacFarlane, K.E., Ed.; Yukon Geological Survey: Yukon, YT, Canada, 2019; pp. 75–90. [Google Scholar]
  5. Elliott, J.; Freymueller, J.T. A block model of present--day kinematics of Alaska and western Canada. J. Geophys. Res. Solid Earth 2020, 125, e2019JB018378. [Google Scholar] [CrossRef]
  6. McDermott, R.G.; Ault, A.K.; Caine, J.S. Dating fault damage along the eastern Denali fault zone with hematite (U-Th)/He thermochronometry. Earth Planet. Sci. Lett. 2021, 563, 116872. [Google Scholar] [CrossRef]
  7. Yukon Geological Survey. A Digital Atlas of Terranes for the Northern Cordillera: Yukon Geological Survey. 2022. Available online: https://data.geology.gov.yk.ca/Compilation/2 (accessed on 5 August 2022).
  8. Muñoz, G. Exploring for geothermal resources with electromagnetic methods. Surv. Geophys. 2014, 35, 101–122. [Google Scholar] [CrossRef]
  9. Tetra Tech. Overarching Yukon Source Water Supply and Protection Study—Summary Report. File: WTR.GWTR03022-04. 31 March 2017. Available online: https://open.yukon.ca/sites/default/files/env-overarching-yukon-source-water-supply-protection-study-summary-report.pdf (accessed on 5 August 2022).
  10. EBA Engineering Consultants Ltd. Resource Assessment for Heat Potential Study, Haines Junction, YT. EBA Project: 1240049; EBA Engineering Consultants Ltd.: Edmonton, AB, USA, 2004. [Google Scholar]
  11. Crandall, J.T.; Sadlier-Brown, T.L. Data on Geothermal Areas Cordilleran Yukon, Northwest Territories, and Adjacent British Columbia, Canada; Open File 427; Geological Survey of Canada: Ottawa, ON, Canada, 1977; 80p. [Google Scholar] [CrossRef]
  12. Bender, A.; Haeussler, P. Eastern Denali Fault Surface Trace Map, Eastern Alaska and Yukon, Canada; Open-File Report 2017–1049; U.S. Geological Survey: Reston, VA, USA, 2017; 10p. [CrossRef]
  13. Finlay, T.; Salomon, G.; Stephen, R.; Nissen, E.; Cassidy, J.; Menounos, B. Preliminary results and structural interpretations from drone LiDAR surveys over the Eastern Denali fault, Yukon. In Yukon Exploration and Geology; MacFarlane, K.E., Ed.; Yukon Geological Survey: Yukon, YT, Canada, 2022; pp. 83–105. [Google Scholar]
  14. Faulds, J.; Hinz, N. Favorable Tectonic and Structural Settings of Geothermal Systems in the Great Basin Region, Western USA: Proxies for Discovering Blind Geothermal Systems. In Proceedings of the World Geothermal Congress 2015, Melbourne, Australia, 19–25 April 2015. [Google Scholar]
  15. Craig, J.W.; Faulds, J.E.; Hinz, N.H.; Earney, T.E.; Schermerhorn, W.D.; Siler, D.L.; Glen, J.M.; Peacock, J.; Coolbaugh, M.F.; Deoreo, S.B. Discovery and analysis of a blind geothermal system in southeastern Gabbs Valley, western Nevada, USA. Geothermics 2021, 97, 102177. [Google Scholar] [CrossRef]
  16. Peacock, J.R.; Siler, D.L. Bottom-up and top-down control on hydrothermal resources in the Great Basin: An example from Gabbs Valley, Nevada. Geophys. Res. Lett. 2021, 48, e2021GL095009. [Google Scholar] [CrossRef]
  17. Townend, J.; Sutherland, R.; Toy, V.G.; Doan, M.L.; Célérier, B.; Massiot, C.; Coussens, J.; Jeppson, T.; Janku--Capova, L.; Remaud, L.; et al. Petrophysical, geochemical, and hydrological evidence for extensive fracture--mediated fluid and heat transport in the Alpine Fault’s hanging--wall damage zone. Geochem. Geophys. Geosystems 2017, 18, 4709–4732. [Google Scholar] [CrossRef] [Green Version]
  18. Dobson, P.F. A Review of Exploration Methods for Discovering Hidden Geothermal Systems. GRC Trans. 2016, 40, 695–706. [Google Scholar]
  19. Relf, C. Yukon Geological Survey 2021 overview. In Yukon Exploration and Geology 2021; McFarlane, K.E., Ed.; Yukon Geological Survey: Yukon, YT, Canada, 2022; pp. 1–15. [Google Scholar]
  20. Garg, S.K.; Pritchett, J.W.; Combs, J. Exploring for hidden geothermal systems. In Proceedings of the World Geothermal Congress, Bali, Indonesia, 25–30 April 2010. [Google Scholar]
  21. Wannamaker, P.E.; Moore, J.N.; Pankow, K.L.; Simmons, S.F.; Nash, G.D.; Maris, V.; Trow, A.; Hardwick, C.L. Phase II of play fairway analysis for the eastern Great Basin extensional regime. Utah Status Indic. Geothermal Res. Council Trans. 2017, 41, 2368–2382. [Google Scholar]
  22. Bense, V.F.; Gleeson, T.; Loveless, S.E.; Bour, O.; Scibek, J. Fault zone hydrogeology. Earth-Sci. Rev. 2013, 127, 171–192. [Google Scholar] [CrossRef]
  23. Grasby, S.E.; Hutcheon, I. Controls on the distribution of thermal springs in the southern Canadian Cordillera. Can. J. Earth Sci. 2001, 38, 427–440. [Google Scholar] [CrossRef]
  24. Grasby, S.E.; Ferguson, G.; Brady, A.; Sharp, C.; Dunfield, P.; McMechan, M. Deep groundwater circulation and associated methane leakage in the northern Canadian Rocky Mountains. Appl. Geochem. 2016, 68, 10–18. [Google Scholar] [CrossRef]
  25. Coyle, M.; Kiss, F.; Boulanger, O.; Oneschuk, D. Kluane Lake West Electromagnetic Survey, Parts of NTS 115G/5, 6, 11 and 12; Open File 2015-24, also Geological Survey of Canada, Open File 7937, scale 1:50 000; Yukon Geological Survey: Yukon, YT, Canada, 2005. [Google Scholar]
  26. Gabrielse, H.; Murphy, D.C.; Mortensen, J.K. Cretaceous and Cenozoic dextral orogen-parallel displacements, magmatism and paleogeography, north-central Canadian Cordillera. In Paleogeography of the North American Cordillera: Evidence for and Against Large-Scale Displacements; Haggart, J.W., Monger, J.W.H., Enkin, R.J., Eds.; Special Paper 46, 255-276; Geological Association of Canada: St. John’s, NL, Canada, 2006. [Google Scholar]
  27. Colpron, M.; Nelson, J.L. Northern Cordillera: Canada and Alaska. In Encyclopedia of Geology, 2nd ed.; Reference Module in Earth Systems and Environmental Sciences; Elias, S.A., Alderton, D., Eds.; Elsevier: Amsterdam, The Netherlands, 2021; pp. 93–106. [Google Scholar]
  28. Lowey, G.W. A new estimate of the amount of displacement on the Denali fault system based on the occurrence of carbonate megaboulders in the Dezadeash Formation (Jura-Cretaceous), Yukon, and the Nutzotin Mountains sequence (Jura-Cretaceous), Alaska. Bull. Can. Pet. Geol. 1998, 46, 379–386. [Google Scholar]
  29. Waldien, T.S.; Roeske, S.M.; Benowitz, J.A. Tectonic underplating and dismemberment of the Maclaren-Kluane Schist records Late Cretaceous terrane accretion polarity and ~480 km of post-52 Ma dextral displacement on the Denali fault. Tectonics 2021, 40, e2020TC006677. [Google Scholar] [CrossRef]
  30. Mezger, J.E.; Chacko, T.; Erdmer, P. Metamorphism at a late Mesozoic accretionary margin: A study from the Coast belt of the North American Cordillera. J. Metamorph. Geol. 2001, 19, 121–137. [Google Scholar] [CrossRef]
  31. Mezger, J.E.; Creaser, R.A.; Erdmer, P.; Johnston, S.T. A Cretaceous back-arc basin in the Coast belt of the northern Canadian Cordillera: Evidence from geochemical and neodynium isotope characteristics of the Kluane metamorphic assemblage, southwest Yukon. Can. J. Earth Sci. 2001, 38, 91–103. [Google Scholar] [CrossRef]
  32. Israel, S.; Cobbett, R.; Westberg, E.; Stanley, B.; Hayward, N. Preliminary Bedrock Geology Map of the Ruby Ranges, Southwest Yukon (Parts of 115G and 115H); Open File 2011-2, scale 1:150,000; Yukon Geological Survey: Yukon, YT, Canada, 2011. [Google Scholar]
  33. Israel, S.; Murphy, D.C.; Bennett, V.; Mortensen, J.K.; Crowley, J.L. New insights into the geology and mineral potential of the Coast Belt in southwestern Yukon. In Yukon Exploration and Geology; MacFarlane, K.E., Weston, L.H., Relf, C., Eds.; Yukon Geological Survey: Yukon, YT, Canada, 2011; pp. 101–123. [Google Scholar]
  34. Yukon Geological Survey. Yukon Digital Bedrock Geology: Yukon Geological Survey. 2022. Available online: https://datatest.geology.gov.yk.ca/Compilation/3 (accessed on 5 August 2022).
  35. Dodds, C.J.; Campbell, R.B. Geology of SW Kluane Lake Map Area (115G & F (East 1/2)); Open File 2188, scale 1:250,000; Geological Survey of Canada: Ottawa, ON, Canada, 1992. [Google Scholar]
  36. Israel, S.; Tizzard, A.M.; Major, J. Geological Map of the Duke River Area (Parts of NTS 115G/2, 3, 5, 6, 7); Open File 2005-11, scale 1:50,000; Yukon Geological Survey: Yukon, YT, Canada, 2005. [Google Scholar]
  37. Israel, S.; Tizzard, A.M.; Major, J. Bedrock geology of the Duke River area, parts of NTS 115G/2, 3, 4, 6 and 7, southwestern Yukon. In Yukon Exploration and Geology; Emond, D.S., Bradshaw, G.D., Lewis, L.L., Weston, L.H., Eds.; Yukon Geological Survey: Yukon, YT, Canada, 2006; pp. 139–154. [Google Scholar]
  38. Hulbert, L. Geology and metallogeny of the Kluane mafic-ultramafic belt, Yukon Territory, Canada: Eastern Wrangellia—A new Ni-Cu-PGE metallogenic terrane. Geol. Surv. Can. Bull. 1997, 506, 265. [Google Scholar]
  39. Greene, A.R.; Scoates, J.S.; Weis, D.; Katvala, E.C.; Israel, S.; Nixon, G.T. The architecture of oceanic plateaus revealed by the volcanic stratigraphy of the accreted Wrangellia oceanic plateau. Geosphere 2010, 6, 47–73. [Google Scholar] [CrossRef]
  40. Blais-Stevens, A.; Clague, J.J.; Brahney, J.; Lipovsky, P.S.; Haeussler, P.J.; Menounos, B. Evidence for Large Holocene Earthquakes along the Denali Fault in Southwest Yukon, Canada. Environ. Eng. Geosci. 2020, 26, 1–18. [Google Scholar] [CrossRef]
  41. Choi, M.; Eaton, D.W.; Enkelmann, E. Is the Eastern Denali fault still active? Geology 2021, 49, 662–666. [Google Scholar] [CrossRef]
  42. Archie, G.E. The electrical resistivity log as an aid in determining some reservoir characteristics. Trans. AIME 1942, 146, 54–62. [Google Scholar] [CrossRef]
  43. Chave, A.D.; Jones, A.G. The Magnetotelluric Method: Theory and Practice; Cambridge University Press: Cambridge, UK, 2002. [Google Scholar]
  44. Simpson, F.; Bahr, K. Practical Magnetotellurics; Cambridge University Press: Cambridge, UK, 2005. [Google Scholar] [CrossRef]
  45. Egbert, G.D. Robust multiple station magnetotelluric data processing. Geophys. J. Int. 1997, 130, 475–496. [Google Scholar] [CrossRef] [Green Version]
  46. Caldwell, T.G.; Bibby, H.M.; Brown, C. The magnetotelluric phase tensor. Geophys. J. Int. 2004, 158, 457–469. [Google Scholar] [CrossRef] [Green Version]
  47. Booker, J.R. The magnetotelluric phase tensor: A critical review. Surv. Geophys. 2014, 35, 7–40. [Google Scholar] [CrossRef]
  48. Mackie, R.; Soyer, W.; Miorelli, F.; Schifano, V.; Hallinan, S. 3D Inversion Modeling of Natural and Controlled Source EM in Complex Terrain; KEGS: Toronto, ON, Canada, 2020; pp. 1–5. [Google Scholar]
  49. Soyer, W.; Mackie, R.L.; Miorelli, F. Optimizing the Estimation of Distortion Parameters in Magnetotelluric 3D Inversion. In Proceedings of the 80th EAGE Conference and Exhibition, Copenhagen, Denmark, 11–14 June 2018. [Google Scholar]
  50. Mackie, R.; Watts, M.D. Detectability of 3-D sulphide targets with AFMAG. SEG 2012 Expanded Abstracts. In Proceedings of the 2012 SEG Annual Meeting, Las Vegas, NV, USA, 4–9 November 2012; pp. 1–4. [Google Scholar]
  51. Rodi, W.; Mackie, R.L. Nonlinear conjugate gradients algorithm for 2-D magnetotelluric inversion. Geophysics 2001, 66, 174–187. [Google Scholar] [CrossRef]
  52. Tschirhart, V.; Craven, J.; Colpron, M.; Quantec Geoscience. Audiomagnetotelluric and Broadband Magnetotelluric Data for Geothermal Exploration in the Burwash Landing Area; Open File 2022-07; Yukon Geological Survey: Yukon, YT, Canada, 2022. [Google Scholar]
  53. Robertson, K.; Thiel, S.; Meqbel, N. Quality over quantity: On workflow and model space exploration of 3D inversion of MT data. Earth Planets Space 2020, 72, 1–22. [Google Scholar] [CrossRef] [Green Version]
  54. Enkin, R.J.; Cowan, D.; Tigner, J.; Severide, A.; Gilmour, D.; Tkachyk, A.; Kilduff, M.; Baker, J. Physical property measurements at the GSC Paleomagnetism and Petrophysics Laboratory, including electric impedance spectrum methodology and analysis. Geol. Surv. Can. Open File 2012, 7227, 57. [Google Scholar]
  55. Yukon Geological Survey. Yukon MINFILE—A Database of Mineral Occurrences: Yukon Geological Survey. Available online: https://datatest.geology.gov.yk.ca/Compilation/24 (accessed on 14 August 2022).
  56. Ingham, M.; Brown, C. A magnetotelluric study of the Alpine Fault, New Zealand. Geophys. J. Int. 1998, 135, 542–552. [Google Scholar] [CrossRef] [Green Version]
  57. Wannamaker, P.E.; Jiracek, G.R.; Stodt, J.A.; Caldwell, T.G.; Gonzalez, V.M.; McKnight, J.D.; Porter, A.D. Fluid generation and pathways beneath an active compressional orogen, the New Zealand Southern Alps, inferred from magnetotelluric data. J. Geophys. Res. 2002, 107, ETG 6-1–ETG 6-20. [Google Scholar] [CrossRef] [Green Version]
  58. Bedrosian, P.A.; Unsworth, M.J.; Egbert, G. Magnetotelluric imaging of the creeping segment of the San Andreas Fault near Hollister. Geophys. Res. Lett. 2002, 29, 1. [Google Scholar] [CrossRef]
  59. Held, S.; Schill, E.; Pavez, M.; Diaz, D.; Morata, D.; Kohl, T. Effects of major fault zones on geothermal reservoirs—A case study at Villarrica Volcano, southern Chile. In Proceedings of the European Geothermal Congress, Strasbourg, France, 19–24 September 2016; pp. 1–5. [Google Scholar]
  60. Stanley, W.D.; Labson, V.F.; Nokleberg, W.J.; Csejtey, B.; Fisher, M.A. The Denali fault system and Alaska Range of Alaska: Evidence for underplated Mesozoic flysch from MT surveys. Geol. Soc. Am. Bull. 1990, 102, 160–173. [Google Scholar] [CrossRef]
  61. Fisher, M.A.; Ratchkovski, N.A.; Nokleberg, W.J.; Pellerin, L.; Glen, J.M.G. Geophysical Data Reveal the Crustal Structure of the Alaska Range Orogen within the Aftershock Zone of the Mw = 7.9 Denali Fault Earthquake. Bull. Seismol. Soc. Am. 2004, 94, S107–S131. [Google Scholar] [CrossRef]
  62. Fisher, M.A.; Pellerin, L.; Nokleberg, W.J.; Ratchkovski, N.A.; Glen, J.M.G. Crustal structure of the Alaska Range orogen and Denali fault along the Richardson Highway. In Tectonic Growth of a Collisional Continental Margin: Crustal Evolution of Southern Alaska; Ridgway, K.D., Trop, J.M., Glen, J.M.G., O’Neill, J.M., Eds.; Geological Society of America Special Paper 431; Geological Society of America: Boulder, CO, USA, 2007; pp. 43–53. [Google Scholar] [CrossRef]
  63. Murphy, B.S.; Huizenga, J.M.; Bedrosian, P.A. Graphite as an electrically conductive indicator of ancient crustal-scale fluid flow within mineral systems. Earth Planet. Sci. Lett. 2022, 594, 117700. [Google Scholar] [CrossRef]
  64. Cunningham, W.D.; Mann, P. Tectonics of strike-slip restraining and releasing bends. Geol. Soc. Lond. Spec. Publ. 2007, 290, 1–12. [Google Scholar] [CrossRef] [Green Version]
  65. Wannamaker, P.E.; Hasterok, D.P.; Doerner, W.M. Possible magmatic input to the Dixie Val-ley geothermal field, and implications for district-scale resource exploration, inferred from magnetotelluric (MT) resistivity surveying. Geo-Therm. Resour. Counc. Trans. 2006, 30, 471–475. [Google Scholar]
  66. Wannamaker, P.E.; Doerner, W.M.; Hasterok, D.P. Integrated dense array and transect MT surveying at Dixie Valley geothermal area, Nevada; structural controls, hydrothermal alteration and deep fluid sources. In Proceedings of the 32nd Workshop on Geothermal Reservoir Engineering, Stanford, CA, USA, 22–24 January 2007. [Google Scholar]
  67. Christopher, P.A.; White, W.H.; Harakal, J.E. K-Ar dating of the ‘Cork’ (Burwash Creek) Cu-Mo prospect, Burwash Landing area, Yukon Territory, Canada. Can. J. Earth Sci. 1972, 9, 918–921. [Google Scholar] [CrossRef]
  68. Thybo, H.; Artemieva, I.M. Moho and magmatic underplating in continental lithosphere. Tectonophysics 2013, 609, 605–619. [Google Scholar] [CrossRef]
  69. Quantec Geoscience. MT electrode comparison: Porous pots vs. steel plates. Unpublished report. 2021. [Google Scholar]
Figure 1. Terrane map of southwest Yukon showing location of the Denali fault and Burwash Landing (modified with permission from Ref. [7] © 2022, Government of Yukon). Inset shows location of southwest Yukon area in the northern Cordillera.
Remotesensing 14 05963 g001
Figure 2. Geological map of the Burwash Landing area (adapted with permission from Ref. [34]. © 2022, Government of Yukon). Faults plotted by black dashed lines. Locations of stations plotted as: MT = red circles; AMT = blue circles; and ELF-EM = black dots. Only geological units discussed in the text are shown in the legend. DF = Denali fault; BCF = Bock’s Creek fault.
Remotesensing 14 05963 g002
Figure 3. Measured (red circles (XY) and blue squares (YX)) and calculated (lines) apparent resistivity and phase curves for XY (red) and YX (blue) for four typical sites. Error bars plotted over the data as red or blue lines. Additional fits are found in Figure S4.
Remotesensing 14 05963 g003
Figure 4. Phase tensor ellipses at AMT (blue dots) and MT sites (red dots) for periods of (a) 0.01 s; (b) 1 s; and (c) 100 s. Ellipse color denotes the value of β. (d) Induction arrows at 90 Hz for ELF-EM (black dots), AMT and MT stations. UTM coordinates are in North American Datum 1983 UTM zone 7N.
Remotesensing 14 05963 g004
Figure 5. (a) Location of mesh and cross-sections from Figure 6 over DEM. Horizontal plan view maps of the preferred 3D electrical resistivity model at selected elevations of: (b) −500 m depth; (c) −1000 m depth; (d) −2000 m depth; and (e) −4000 m depth. The conductors (C1, C1x, C2, C3, C4, C5) and resistors (R1, R2) are explained in the text. Faults plotted as dashed lines.
Remotesensing 14 05963 g005aRemotesensing 14 05963 g005b
Figure 6. Cross-sections through the preferred 3D resistivity model. Locations of cross-sections (a) A-A’, (b) B-B’, (c) C-C’, and (d) D-D’ as plotted in Figure 5a and geological unit labels from legend in Figure 2. Red circle in (b) as discussed in text. Vertical exaggeration = 1. Color bar as in Figure 5.
Remotesensing 14 05963 g006aRemotesensing 14 05963 g006bRemotesensing 14 05963 g006c
Figure 7. (a) Apparent conductivity, channel 6, grid from airborne EM data [25] (outlined in white) displayed over 360 Hz ELF-EM in-phase divergence grid [3] with labels from 5b plotted; (b) Residual total field with labels from 5c plotted; and (c) Ground Bouguer gravity data (Local) from [3] over regional Bouguer gravity data (Regional) with labels from 5e plotted. Faults in the study area plotted as black dashed lines. Details on the acquisition and processing of ground gravity data are found in [3], apparent conductivity data in [25] and ELF-EM in-phase divergence data in [3].
Remotesensing 14 05963 g007
Table 1. Physical rock properties of the study area. Measurements made using the techniques described in [54] (Supplementary Information).
UnitDensity (g/cm3)Susceptibility (SI)Porosity (%)Resistivity (ohm-m)Min. ResistivityMax. Resistivityn
Tkope Suite2.500.000208.509298 1
Kluane mafic-ultramafic intrusion2.930.000821.09891243819002
Tatamagouche Formation2.760.000511.50062323610505
Nikolai Formation2.910.001201.1363322734192,00010
Hasen Creek Formation2.720.000320.4293898932141,00014
Station Creek Formation2.840.000600.578286926221,60012
Publisher’s Note: MDPI stays neutral with regard to jurisdictional claims in published maps and institutional affiliations.