1. Introduction
As a new type of industrial technology, UAV aerial photography is born in response to demand, develops rapidly, and is widely used in various fields. Due to their small size and flexible action, UAVs can survey and take pictures of areas that are inconvenient for humans to set foot in. For example, detecting and tracking enemy targets through UAV aerial images can significantly support military command in military surveillance. In earthquakes, plane crashes, and other disasters, the aerial images of drones are stitched into a real-time panorama, which can help rescuers quickly understand the disaster scene, search for trapped people, and reasonably plan rescue routes. In addition, in environmental governance, drone photography can be used to obtain images of the surrounding environment of the factory, to determine the source of pollution quickly, and then provide adequate assistance for law enforcement departments to investigate and visit. However, UAVs are limited by many factors, such as shooting height, angle, and UAV performance when shooting images, resulting in incomplete coverage of a single aerial image. It can be seen that the research on UAV aerial images is of great significance.
At present, among the many methods of aerial image stitching, the method based on image feature stitching occupies an important position. For the stitching of aerial images based on features, image registration and image fusion are two crucial steps, and the accuracy of registration will directly affect the quality of stitching. There are many methods for extracting image feature points. The Harris corner detection algorithm [
1] essentially uses a local window to detect grayscale information on the image. If the grayscale value changes greatly, there are corners in the window. This algorithm improves the accuracy and speed of the feature extraction algorithm, but the accuracy is very low when the image scale changes. The SIFT (Scale-Invariant Feature) algorithm [
2] is different from it. First, the feature points are detected in the constructed Gaussian difference image pyramid, and then the corresponding feature descriptors containing 128 dimensions are extracted. The algorithm solves the problem of scale invariance, but the overall time-consumption is still relatively long, and the implementation process is relatively complex. To solve the time-consuming problem of extracting feature points, Bay et al. proposed the SURF (Speeded Up Robust Features) algorithm [
3]; the algorithm detects feature points in the constructed Hessian matrix and reduces the 128-dimensional feature descriptor to a 64-dimensional feature descriptor, so the feature point extraction speed has been greatly improved. To further improve the speed of the feature extraction algorithm, Rublee et al. [
4] retained the advantages of the FAST feature point detection algorithm and the Brief feature point description algorithm, and on this basis comprehensively improved and proposed the ORB (Oriented Fast and Rotated Brief) algorithm. The algorithm outperforms the SURF algorithm in speed and is robust to illumination and scale. The ORB feature is a very representative real-time image feature at present. The algorithm based on the ORB feature is superior to several other popular algorithms in terms of speed while ensuring the feature points have rotation and scale invariance. The UAV image has the characteristics of a large amount of data, so the speed of the image processing algorithm is very strict [
5]. Considering the processing speed, this paper selects the ORB algorithm to extract the feature points of the aerial image.
Researchers have been making continuous efforts to optimize the stitching quality of aerial images by improving the accuracy of image matching, solving the problem of uneven distribution of feature points, and optimizing the quality of image stitching. The quadtree algorithm proposed by Mur-Artal et al. [
6,
7] focuses on the extraction and screening of feature points. By eliminating redundant feature points, the feature points of the entire aerial image are uniformly distributed; in 2017, Li et al. [
8] proposed a new dynamic programming algorithm for aerial image fusion. The algorithm first corrected the images so that the aerial images were located in the same coordinate system, thereby improving the quality of image fusion and solving the problem. For the spatial dislocation problem in the stitching of UAV images, in 2018, Zhang et al. [
9] designed and completed the overall work of UAV remote sensing image stitching based on the global stitching strategy optimized by Levenberg–Marquardt (L-M). Compared with the previous method, the drift problem of multi-frame image stitching is effectively improved; in 2019, Zhao et al. [
10] optimized the number of matchable feature points by dynamically setting the contrast threshold in the Gaussian scale space, but the algorithm left the problem of poor real-time performance. Based on the above basis, Xie et al. [
11] proposed a new projection plane selection strategy, which improved the influence of UAV flight posture changes on image stitching. In 2020, Xu et al. [
12] proposed a stitching method based on multi-region guided local projection deformation, which reduces ghosting caused by projection changes with viewpoint and parallax. In 2021, Fan et al. [
13] proposed a fast adaptive stitching algorithm for processing a large number of aerial images, by reducing the estimated reprojection error and the number of observed visual distortions, culling densely overlapping images from all images, improving the quality of the stitched image. Yuan et al. [
14] proposed a superpixel-based slitting strategy, Xue et al. [
15] proposed to identify and eliminate ghosting through multi-component collaboration, and Chen et al. [
16] proposed a stitching strategy based on optimal seams and half-projection warping in 2022; they all optimize the stitching quality of the images.
UAV aerial image stitching has become a key research issue. However, in previous research on aerial image stitching, most of them focus on the generation of panoramic images in static environments, and more attention was paid to improving the stitching speed. In low-altitude environments, the generation of panoramas with dynamic objects is a difficult problem. The traditional single static panorama generation method cannot effectively solve this problem [
17]. In dynamic panoramas, the movement of foreground objects will cause the feature points to be mismatched, which will lead to splicing misalignment and tears in the generated background image. In view of this, this paper uses the semantic segmentation method to process the image, and separates the dynamic foreground from the static background, so as to retain the semantic information of the foreground.
Semantic segmentation is one of the cornerstone technologies in image processing. Semantic segmentation achieves pixel-level classification by assigning labels to each pixel in the image. This label is predefined and represents the semantic category of things in the image. Generally speaking, the semantic segmentation of images is to distinguish the specific category and position of things in the image by pixel and give the same color to the things of the same category for representation. Since the 1980s and 1990s, researchers have manually segmented original images based on features, such as color, gray level, texture and shape. The traditional segmentation methods mainly include threshold segmentation, edge segmentation and superpixel-based segmentation. Although the traditional segmentation method has achieved good results, there are many shortcomings, such as time consumption, poor adaptability and so on, thus it has been difficult to make a breakthrough in the segmentation results.
In recent years, with the rapid development of artificial intelligence, deep learning has brought earth-shaking changes to many fields, and computer vision is no exception to introduce it into image semantic segmentation to obtain accurate prediction results. In 2006, Hinton et al. put forward the idea of deep learning. By exploring the rules and features of data, the combination between low levels is used to represent the feature categories of attributes, so that the machine has the ability to classify and learn text, video, image and other content. Deep learning methods include convolutional neural network (CNN) [
18] and recurrent neural network (RNN) [
19] and generative adversarial network (GAN) [
20]. Among them, the most typical convolutional neural network (CNN) has achieved far higher accuracy than the traditional method in international competitions.
The Lenet-5 [
18] network proposed by Le Cun et al., using only a simple five-layer network, pioneered convolutional neural networks and provided a new idea for future generations to innovate. In 2014, Simonyan K et al., the vision research group of Oxford University, proposed VGGNet [
21] network, which used 3 × 3 small convolution mode instead of large convolution mode, and divided into two essentially identical versions, VGG16 and VGG19, according to different network layers. In 2015, Google released 22 layers of GoogleNet [
22] to integrate modules and modify the network. The increase in network depth was obviously the main research direction of that era, but as the number of network layers reached the bottleneck, scientists found that only increasing the number of network layers would not make the correct rate stack, but also cause the problem of complex model convergence and so on. In 2016, He Kaiwen et al., proposed deep residual network ResNet [
23] based on this problem, designed residual blocks to link high–low input signals to solve network degradation and gradient dispersion problems. Compared with VGG, residual network has smoother forward and back propagation modes, so it gradually replaces VGG as the more commonly used backbone network. In 2015, Long et al. proposed the Fully Convolutional neural Network (FCN) in the International Conference on Computer Vision and Pattern Recognition [
24]. Compared with the traditional algorithm, it has achieved breakthrough results and opened the door based on deep learning. Since then, more and more excellent semantic segmentation algorithms have been emerging. In the FCN network, based on the VGG-16 network, codec network structure is adopted [
25,
26,
27]. The original fully connected layer of VGG network is discarded in encoder, and the upsampling classification network constructed by convolution layer is proposed. Meanwhile, deconvolution operation is adopted in decoder to upsample the feature map. Through the cross-layer connection strategy, the low-level rich location features are combined with high-level semantic features, and then end-to-end image semantic segmentation is realized. Although the FCN will lose part of the location information when the decoder is pooled, compared with the traditional method, it proves that the convolutional neural network can effectively segment the image, which points out the way for subsequent research of experts and scholars, so more and more researchers are trying new design ideas. This paper uses the classical FCN semantic segmentation network.
This paper proposes an aerial image stitching algorithm based on semantic segmentation and ORB. Firstly, the images to be spliced are semantically segmented through the FCN network to extract foreground objects. Meanwhile, the ORB algorithm is used to extract the feature points of the two images. If the feature points are in the foreground range, the culling operation is performed, and only the feature points in the background are retained to reduce the occurrence of mismatched pairs, thereby improving the quality of aerial image stitching.
2. Materials and Methods
The traditional ORB algorithm is mainly composed of two parts: the FAST feature point detection algorithm [
28] and the BRIEF feature point description algorithm [
29], but the feature points extracted by the traditional ORB algorithm will be unevenly distributed. As a result, the feature points in some areas are dense, while the feature points in some areas are extremely sparse, which affects the quality of image stitching. This paper solves the problem of uneven distribution of feature points by introducing the idea of quadtree decomposition and realizes the uniform distribution of feature points in the image. Furthermore, it is considered that the wrong matching of the feature points located on the dynamic objects in the image will lead to misalignment in the static background stitching. This paper first performs semantic segmentation on the images to be stitched, extracts the moving foreground objects, compares the foreground pixel coordinate values with the feature point coordinate values, removes the feature points distributed in the foreground, and then performs matching. This greatly reduces the probability of misalignment in the background stitching of aerial images caused by dynamic foregrounds and improves the quality of stitching.
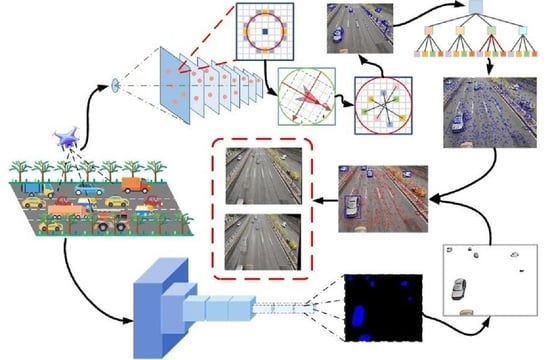
The process of this paper is shown in
Figure 1.
Figure 1 mainly consists of the first set of experimental images and their stitching results, as well as Figures 2, 3, 5, 6, 8, 12 and 13 in this paper. As indicated by the arrow in
Figure 1, the UAV is used to shoot the road with vehicles at low altitudes, and then the ORB algorithm based on quadtree is used to extract the feature points of the image. At the same time, semantic segmentation is performed on the image to extract the moving vehicle. Next, the semantic information on the vehicle is compared with the feature point information, and the feature points on the vehicle are eliminated, the result is shown in the green marked box in the upper right corner of
Figure 1. Finally, the images with the feature points on dynamic objects, such as vehicles, removed are spliced, and the splicing map and the contrast effect are shown in the red marked box.
2.1. Improved ORB Algorithm to Extract Feature Points
2.1.1. FAST Detection Algorithm
The original FAST feature point calculation is very fast, and its core idea is to find the distinctive point by comparing the difference between the pixel brightness. The FAST detection algorithm will first randomly select a pixel
p in the detection image and assume that its brightness value is
Ip. Then, a circle with radius of 3 will be drawn with this pixel
p as the center of the circle, on which 16 consecutive pixel points can be obtained. When the circumference radius is 3, the accuracy and efficiency of detection can be taken into account at the same time, and the detection effect is the best. Set the threshold
T at the same time. The upper limit is
Ip +
T, and the lower limit of brightness is
Ip −
T. If the brightness of
N consecutive points exceeds this range, then
p is defined as a feature point. The calculation formula is as follows:
In actual detection, if each feature point is detected, the difference between the 16 pixels on the circle and the center point
p must be calculated, which will affect the detection efficiency. To be more efficient, FAST adds a pre-detection operation. As shown in
Figure 2, take any pixel on the aerial image, and only detect the pixel located at the yellow square position on the circle. When three of these four pixels are out of range at the same time, the current pixel is the candidate feature point of the image, otherwise, it is directly excluded. This method greatly improves detection efficiency.
The feature points detected by FAST do not have rotation invariance. In order to make up for the deficiency, the gray centroid in the neighborhood of each feature point is calculated, then take the feature points as the starting point and the solved gray centroid as the endpoint to construct a vector, and this vector direction is the main direction of the FAST feature point. The grayscale centroid is shown in
Figure 3. Let
I (
x,
y) represent the gray value of each pixel point (
x,
y) in the image to be detected, then the neighborhood moment of the feature point is:
The centroid of the image moment can be found by the neighborhood moment:
Then the main direction of the FAST feature point is:
2.1.2. Image Pyramid
The image pyramid is a multi-scale representation of the image, and the image pyramid can be obtained by sampling the original image with different sampling rates. Therefore, an image pyramid is constructed for the image to be detected, which can achieve scale invariance. Set the scaling factor of the pyramid to 1.2, and downsample the image to be detected at a scaling ratio of 1/1.2 to obtain 8 pictures, and then perform feature extraction on each picture and record the number of layers of the pyramid where the feature points are located, to obtain the image feature points. As shown on the left side of
Figure 4, this paper constructs an eight-layer pyramid based on the above principles to be stitched, which solves the problem that the feature points do not have scale invariance.
In the process of constructing a pyramid of an image to extract feature points, the image scaling does not cause the position of the feature points to move vertically. Suppose there is a feature point
Fm on the mth layer, and its spatial position and the position of the camera center during aerial photography are
dm. According to the imaging characteristics of a “small objective lens”, if the patch corresponding to the feature point of the mth layer is of the same size as the patch corresponding to the 0th layer of the pyramid, the maximum object distance that is constant in scale is
dmax =
dm × 1.2
m. According to the imaging characteristics of “close-up image is large”, if you want to move the feature points of the current mth layer to the seventh layer, the real camera imaging image must be magnified by the original 1.2
7−m times, so it corresponds to the minimum object distance
dmin =
dm × 1.2
m−7. The right side of
Figure 4 shows the corresponding relationship between the feature point patches obtained after scaling the original image by 1/1.2
m times, and the relationship between the imaging distance of the aerial camera and the scene distance.
2.1.3. Brief Feature Description
The detected ORB feature points need to be characterized by the Brief algorithm. BRIEF is a binary descriptor whose description vector consists of 0s and 1s. The core idea is to select n point pairs in a specific pattern around the feature points and combine the comparison results of the point pairs as a descriptor. The basic description idea is shown in
Figure 5 below:
First, the image is processed by Gaussian filtering to reduce noise interference. In the
S ×
S pixel area centered on the feature point
p,
n point pairs are randomly selected for gray value comparison, and the following binary assignments are performed:
Through comparison, the n-dimensional binary feature descriptor can be obtained as:
Next, define a matrix Q of order
, which is expressed as:
Rotate the matrix
θ by the rotation matrix
Rθ corresponding to the main direction Q of the feature point to obtain a new matrix
Qθ:Finally, the descriptor with direction can be expressed as:
2.1.4. Uniform Feature Points Based on Quadtree
In the original algorithm, the FAST detection speed is breakneck. However, the extracted feature points are often too concentrated in the area with pronounced texture, while it is difficult to extract feature points in the area with weak texture. As a result, the uneven distribution of feature points occurs, leading to decreased matching accuracy. According to the idea of the quadtree, this paper removes redundant and invalid feature points in the picture so that the feature points can be distributed more evenly [
11].
Figure 6 shows the division idea of the quadtree. In simple terms, the concept of a quadtree is to divide each space into four small areas equally, and so on recursively, stop dividing after reaching a certain depth or meeting specific requirements.
As shown in
Figure 7, the distribution of feature points extracted from aerial images by the traditional ORB algorithm is not uniform. Therefore, based on the quad-tree idea, this paper again screened the feature points extracted by FAST on each layer of the pyramid. First, calculate the initial node to obtain the initial quad-tree structure, represented by four quadrants (UL, UR, BL, BR), and then map the feature points to the initialized quad-tree. The number of feature points in the initialized node is not 1. On this basis, the image is divided into four nodes, n1, n2, n3, and n4, which are mapped to the child nodes according to the position of the feature points. If the number of feature points in the node is greater than 1, each node continues to be split into four. When the number of feature points in the node is greater than the expected number of feature points, the splitting is stopped. Finally, each nodes’ feature points with the best quality are extracted. It can be seen from
Figure 7 that after processing, the feature points are evenly distributed on the aerial image.
2.2. Semantic Segmentation Extraction Foreground
To reduce the quality problem of aerial image stitching caused by the feature points of dynamic foreground, this paper separates the foreground and background of the image to be stitched through semantic segmentation to prepare for the removal of foreground feature points. This paper uses the classic semantic segmentation network FCN [
24]. FCN classifies the objects in the image by pixel-level classification of the image. Unlike the classic CNN, FCN has no specific requirement on the input image size. FCN replaces the final fully connected layer of CNN with a convolutional layer, uses the deconvolution layer to upsample the feature map of the last convolutional layer, and restores it to the same size as the input image. While preserving the spatial information of the original input image, a prediction is generated for each pixel. Finally, each pixel will be classified on the feature map of the upper sampling. As shown in
Figure 8, an urban street image taken by a drone at a low altitude is randomly selected. After the semantic segmentation network processes the image, the foreground object vehicle is separated and marked as gray, and the static background in the image is marked as black. A relatively perfect separation of foreground and background is achieved.
The feature map of the last layer is often too small, and many details are lost. If only the feature map of the previous layer is upsampled, the segmentation effect is not ideal. Therefore, the skip structure [
30] is one of the characteristics of FCN. Through this structure, the predictions of the last layer and the shallower layers can be combined, and global forecasts and local predictions can be performed simultaneously. As shown in
Figure 9 below, FCN-32s is a segmented image obtained directly after five convolution pooling and then through the several successive layers of convolution. At the same time, FCN-16s fuse the information of the underlying feature map based on FCN-32s, which can restore some details. The difference between FCN-8s and FCN-16s is that the underlying feature map information is fused twice. If the images of the three deconvolution results are combined, the accuracy can be improved to a certain extent.
2.3. Eliminate Foreground Feature Points and Delete False Matching Pairs
There are usually architectural backgrounds, fast-moving vehicles, ships, and other objects in the low-altitude aerial images of drones. While the architectural environment is static, things such as cars and boats in the foreground are often moving. If the image is not subjected to the foreground and background separation processing, the feature points are directly extracted and matched, and the homography matrix is used for splicing. Due to the motion of the foreground object, false matching pairs will appear, resulting in tearing and splicing misalignments in the spliced image. Therefore, in this paper, the feature points existing in the dynamic foreground are deleted to reduce the occurrence of mismatching to a certain extent, and then the mismatching pair is deleted.
This paper uses the RANSAC algorithm [
31] to remove false matching pairs. When the error rate of matching pairs exceeds 50%, the algorithm can terminate false matching pairs well, and the robustness is ideal. RANSAC is essentially an iterative process. First, four matching point pairs are randomly selected, in the obtained matching points, and the other pair are outer points. Then, the homography matrix is calculated according to the four pairs of inner points, tested other matching points according to this matrix, and set the threshold. If it exceeds the threshold, it is considered an outer point. If it is less than the threshold, it is regarded as an inner point, and the value of the inner point is recorded. Statistically update all interior points, and on this basis, repeat the above process, iterate M times, and finally obtain the model with the most interior points. At this time, the model is the optimal model. In this paper, the feature point pairs that cannot be matched correctly are used as outliers, the interior points are used to update the initial assumed model, and the initial number of iterations is set to 10,000 times. Finally, a model that meets the expectations is obtained, and the mismatches that do not fit the model are eliminated.
2.4. Image Fusion and Stitching
After completing the image registration, it is necessary to stitch the two images together to output a complete image [
32]. In this paper, based on the best matching feature point pair obtained by image registration, the homography matrix is calculated, and the corresponding relationship and spatial transformation model of the overlapping parts of the images to be spliced are determined. After calculating the size of the entire image, the two images are geometrically transformed and stitched together. However, there will be a noticeable gap after splicing, so image fusion is essential. Through image fusion processing, the crack of splicing can be eliminated. In this paper, the stitched images are fused by the weighted average method, and the stitching of the aerial images is completed.
In the fusion process, if
I1 and
I2 represent the two images to be spliced, and
I represent the spliced image, the image fused by this method can be described as follows:
In the formula,
w1 and
w2 represent the weight of the overlapping area, and 0 <
w1,
w2 < 1, they satisfy the following relationship with the width of the overlapping area:
In the overlapping area, w1 gradually changes from 1 to 0 and w2 from 0 to 1 so that the overlapping area I1 can be smoothly transitioned to I2 during the image fusion process. The images stitched by this method can effectively eliminate stitching gaps and achieve seamless stitching.
4. Discussion
The inspiration for the algorithm in this paper comes from practical engineering applications, mainly for the problems of traffic road network monitoring and urban traffic emergency management. Therefore, using drones to fly at low altitudes, equipped with cameras to take pictures of road conditions, and obtain real-time panoramic images after stitching processing, will be conducive to real-time supervision of urban traffic. Most traditional stitching algorithms are suitable for hollow or high-altitude remote sensing images. However, there is a big difference between hollow or high-altitude remote sensing images and low-altitude aerial photography images. Most hollow or high-altitude remote sensing images depict the general outline of the image and lack of details. As the vertical gradient decreases, the field of view of aerial images taken by drones becomes smaller, and the detailed information contained in aerial images becomes more and more abundant. The use of UAV low-altitude aerial photography to solve practical engineering problems will have a great application prospect. Using drones to supervise urban traffic problems belongs to the field of low-altitude remote sensing, so the algorithm in this paper is mainly aimed at the problem of image stitching in low-altitude environments.
Image registration is a crucial step in image stitching. Experiments have proved that when processing low-altitude aerial images, ORB feature extraction has obvious advantages of saving time compared with SIFT and SURF algorithms and can meet real-time performance requirements. It is fast and convenient for drones to obtain images. Still, the number of pictures is also large, and the processing time of the pictures must be as short as possible, so the ORB algorithm is selected for feature extraction. The feature points extracted by the classical ORB algorithm meet the requirements in terms of quantity and time, but there are sparse and uneven phenomena. Therefore, the idea of quadtree is introduced in this paper, and the extraction points of ORB are divided and screened, so that the feature points can be evenly distributed in the image, and the drawbacks of the classical ORB algorithm are removed.
Compared with hollow and high-altitude remote sensing imagery, low-altitude remote sensing images are more detailed. The experimental results show that moving vehicles can cause stitching dislocation and tearing problems when stitching static backgrounds, such as traffic lines. To increase the number of matching pairs, Zheng et al. [
34] have performed foreground and background separation experiments based on Grab Cut for indoor scene pictures. Still, the effect is completely different from this article. Different scenes have different definitions for foreground and background. For low-altitude aerial images, we define moving objects as foreground and static objects as background. In separation experiments based on semantic segmentation, dynamic vehicles are perfectly separated. According to the semantic information of the vehicle and the coordinate information on the image, all the feature points distributed on the vehicle are eliminated. From the comparison of (b) and (e), (c) and (f) in
Figure 13,
Figure 14 and
Figure 15, it can be seen that the algorithm in this paper has fully examined the dynamic factors of the foreground, removed the phenomenon of static background dislocation, and improved the stitching quality. The proposed algorithm greatly reduces the problem of background stitching caused by dynamic foreground.
The current data set of the algorithm in this paper is relatively simple, and the season, climate, and other factors are not fully considered. Due to the need for practical applications, to obtain as much picture detail information as possible, our UAV collects pictures at low altitudes and with a certain speed limit, which results in the difference between the pictures being not particularly large. At present, our experiments are mainly carried out on two images. Considering practical engineering problems, improving the quality of image stitching with large differences, and stitching multiple consecutive aerial images is one of the follow-up research directions.
5. Conclusions
The shooting environment of the drone and the height angle of the shooting are complex and changeable. Aerial drone photography covers a large field of view and can clearly depict the exact outline of things on the ground. However, in medium- to high-altitude environments, the aerial images contain a lack of detailed information about specific things. As the drone is lowered on the vertical gradient, the field of view becomes smaller and smaller, and the aerial images contain more and more detailed information about specific things on the ground, with dynamic objects clearly visible. In hollow and high-altitude environments, the details of the objects in the aerial image are not obvious. In contrast, in low-altitude settings, the dynamic objects in the image taken by the drone are visible. Therefore, the stitching of low-altitude aerial images will be affected by changes in the position of dynamic foreground objects, resulting in quality problems, such as stitching dislocation and tearing in the stitched image. Traditional algorithms cannot effectively solve this problem. A UAV aerial image stitching algorithm is proposed to solve this problem based on semantic segmentation and ORB. It combines the semantic information obtained by semantic segmentation with the traditional ORB stitching algorithm to achieve high-quality aerial image stitching.
This paper uses aerial images to perform the speed comparison test of SIFT, SURF, and ORB extraction features. The advantages and shortcomings of the three algorithms for extracting feature points are analyzed. Because the number and speed of feature points extracted by the ORB algorithm meet the experimental requirements, the ORB algorithm is selected for feature extraction of aerial images. However, in order to solve the problem of uneven distribution of feature points extracted by ORB, this paper introduces the idea of quadtree to filter the extracted feature points, so that the feature points are evenly distributed in the image. Then, to reduce the impact of dynamic moving objects on static background splicing, during image registration, semantic segmentation is performed on the images to be spliced, the foreground and background are separated, the semantic information of the foreground is obtained and compared with the feature point information, and the feature points located on the dynamic foreground were removed. Finally, the image splicing and fusion are realized based on the homography matrix and the weighted fusion algorithm.
This paper conducts stitching experiments based on two algorithms. The first one does not consider dynamic foreground factors to perform image stitching directly, and the second one is based on the algorithm of this paper for stitching experiments. According to the analysis of the experimental comparison results, both from the subjective visual evaluation and the objective data, the superiority of the algorithm in this paper is strongly proved. In addition to this, experiments have been carried out with conventional stitching algorithms based on the experimental data in this paper, and the stitching results have been compared with those of this paper. It is well demonstrated that the algorithm in this paper effectively reduces the problems of background image stitching caused by dynamic foregrounds, such as background stitching dislocation, and improves the quality of image stitching. It provides technical support for the broad application of images captured by UAVs at various heights or in complex environments.

 ,
, 


