4.1. Remote Sensing Results
For mapping alteration minerals and zones in the study area, BR, PCA, and LS-Fit techniques were implemented in Sentinel-2 and Landsat-7 remote sensing data. To characterize iron oxide/hydroxides (hematite, goethite, and jarosite), the VNIR spectral bands contain the most important information due to electronic transitions of Fe
3+/Fe
2+ in the VNIR region from 0.45 to 1.2 µm [
42,
43]. Accordingly, a 4/2 band ratio of Sentinel-2 and a band ratio of 1/3 of Landsat-7 were selected to highlight iron oxide/hydroxides. Hydroxyl-bearing (Al-OH) alteration and carbonates (muscovite, kaolinite, gypsum, calcite, and dolomite) show spectral absorption features in 2.1–2.5 µm due to overtones and combinations of the fundamental vibrations [
44], whereas their spectral reflectance typically occurs in 1.55–1.75 µm in the SWIR regions. These characteristics are matched with band 12 (2.100–2.280 µm) and band 11 (1.565–1.655 µm) of Sentinel-2, as well as band 7 (2.11–2.29 µm) and band 5 (1.57–1.65 µm) of Landsat-7, respectively. Therefore, the 11/12 band ratio of Sentinel-2 and 5/7 band ratio of Landsat-7 were used to map hydroxyl bearing alteration minerals and carbonates in the study area.
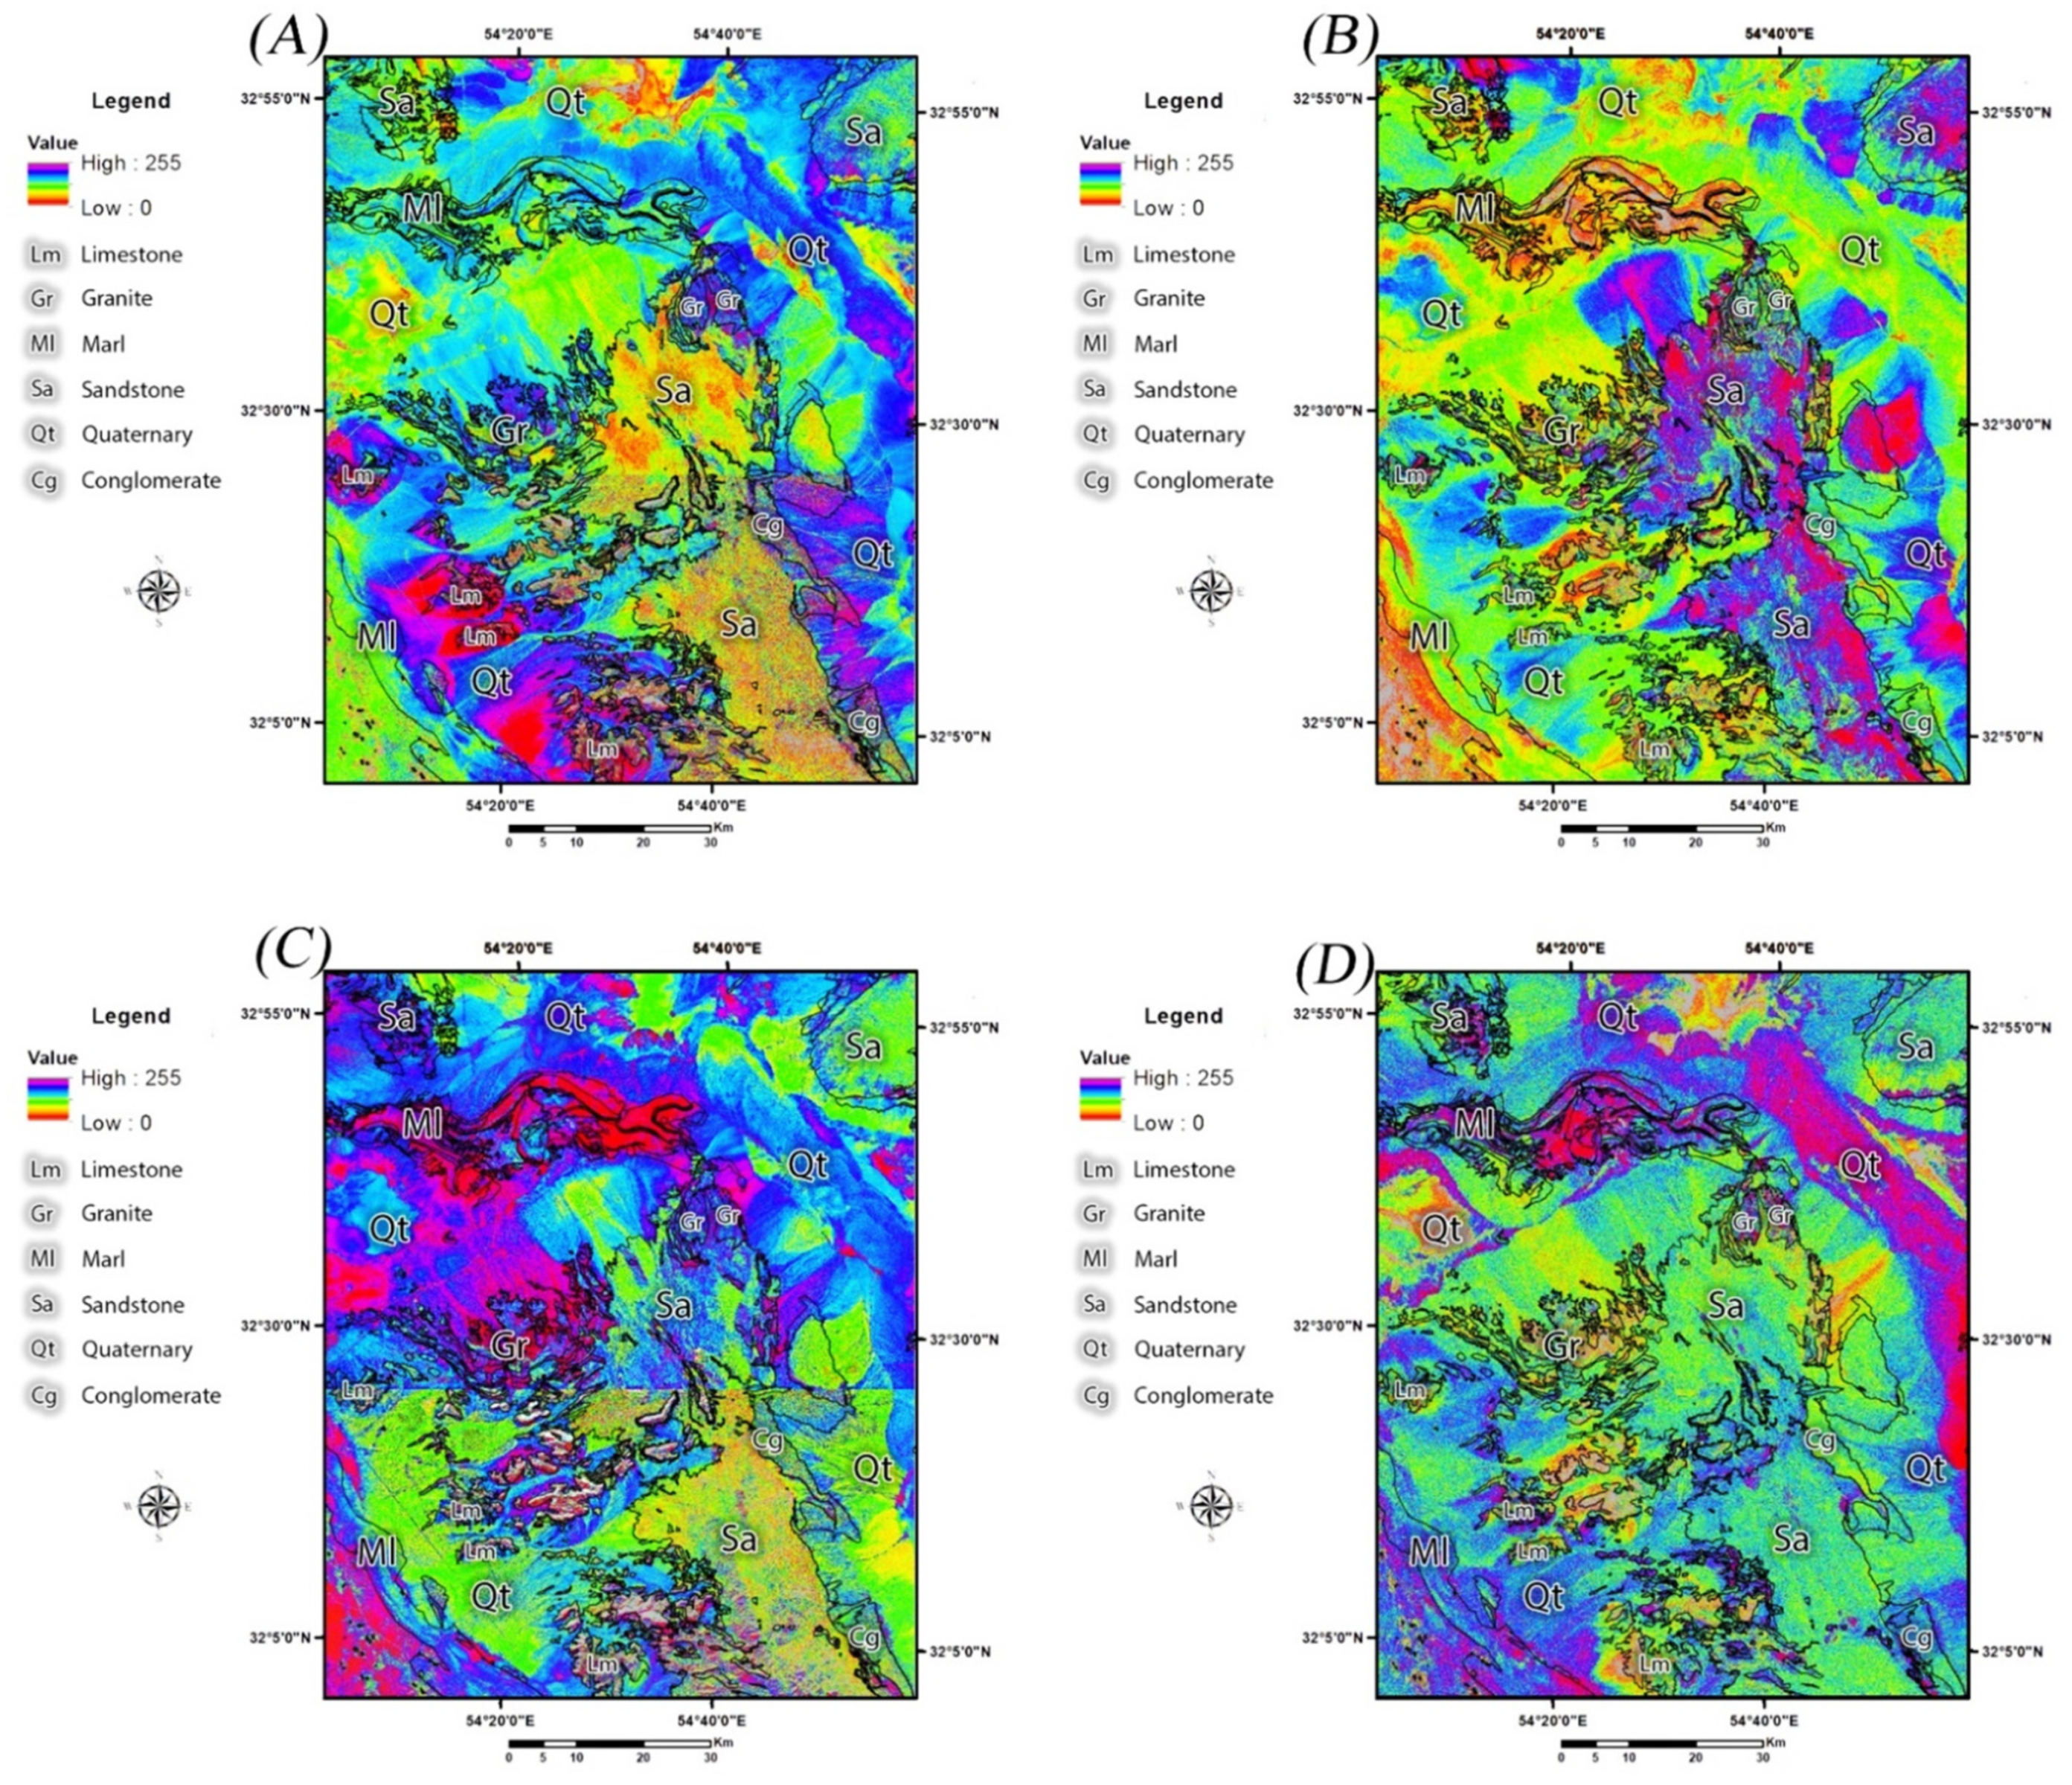
Figure 4A–D show the spatial distribution of iron oxide/hydroxides and hydroxyl-bearing (Al-OH) alteration and carbonates using the selected band ratios. Considering
Figure 4A,B, high to moderate surface distribution of iron oxide/hydroxides is typically mapped, associated with igneous rocks, the lithological units of sandstone, conglomerate, limestone, and marl. In addition, some parts of the Quaternary background showed high to moderate iron oxide/hydroxides. Regarding
Figure 4C,D, high to moderate spatial distribution of hydroxyl-bearing (Al-OH) alteration and carbonates are identified within igneous rocks, limestone, marl, sandstone, and some parts of the Quaternary background.
A PCA image with strong eigenvector loading for indicative reflection and absorption bands (in VNIR and SWIR regions) of a specific mineral or mineral groups (e.g., iron oxide/hydroxide minerals or clay minerals) with opposite signs detects that mineral/mineral groups as bright or dark pixels. If the eigenvector loading is positive in the reflection band of the target mineral the PCA image tone will be bright, and if it is negative, the PCA image tone will be dark for the target mineral [
26]. The information typically characterizes in a very small fraction of the total information content for the original bands. After implementing the PCA transformation, it is anticipated that the eigenvector loadings specify the spectral signature of the target mineral or mineral groups in the reflection and absorption bands [
21,
24,
26].
Analyzing the eigenvector loading derived from PCA (
Table 1, panels A and B) indicates that some PCA images contain useful information for mapping iron oxide/hydroxides and hydroxyl-bearing (Al-OH) alteration and carbonates. The statistical results for Sentinel-2 PCA images show that the PCA2 and PCA4 can map the target alteration minerals. Eigenvector loadings in PCA2 show strong values in band 2 (−0.41) and band 4 (0.44) with opposite signs. Hence, iron oxide/hydroxides can be mapped as bright pixels in the PCA2 image. Strong eigenvector loadings in band 11 (0.78) and band 12 (−0.61) signified that PCA4 can identify hydroxyl-bearing (Al-OH) alteration and carbonates as bright pixels.
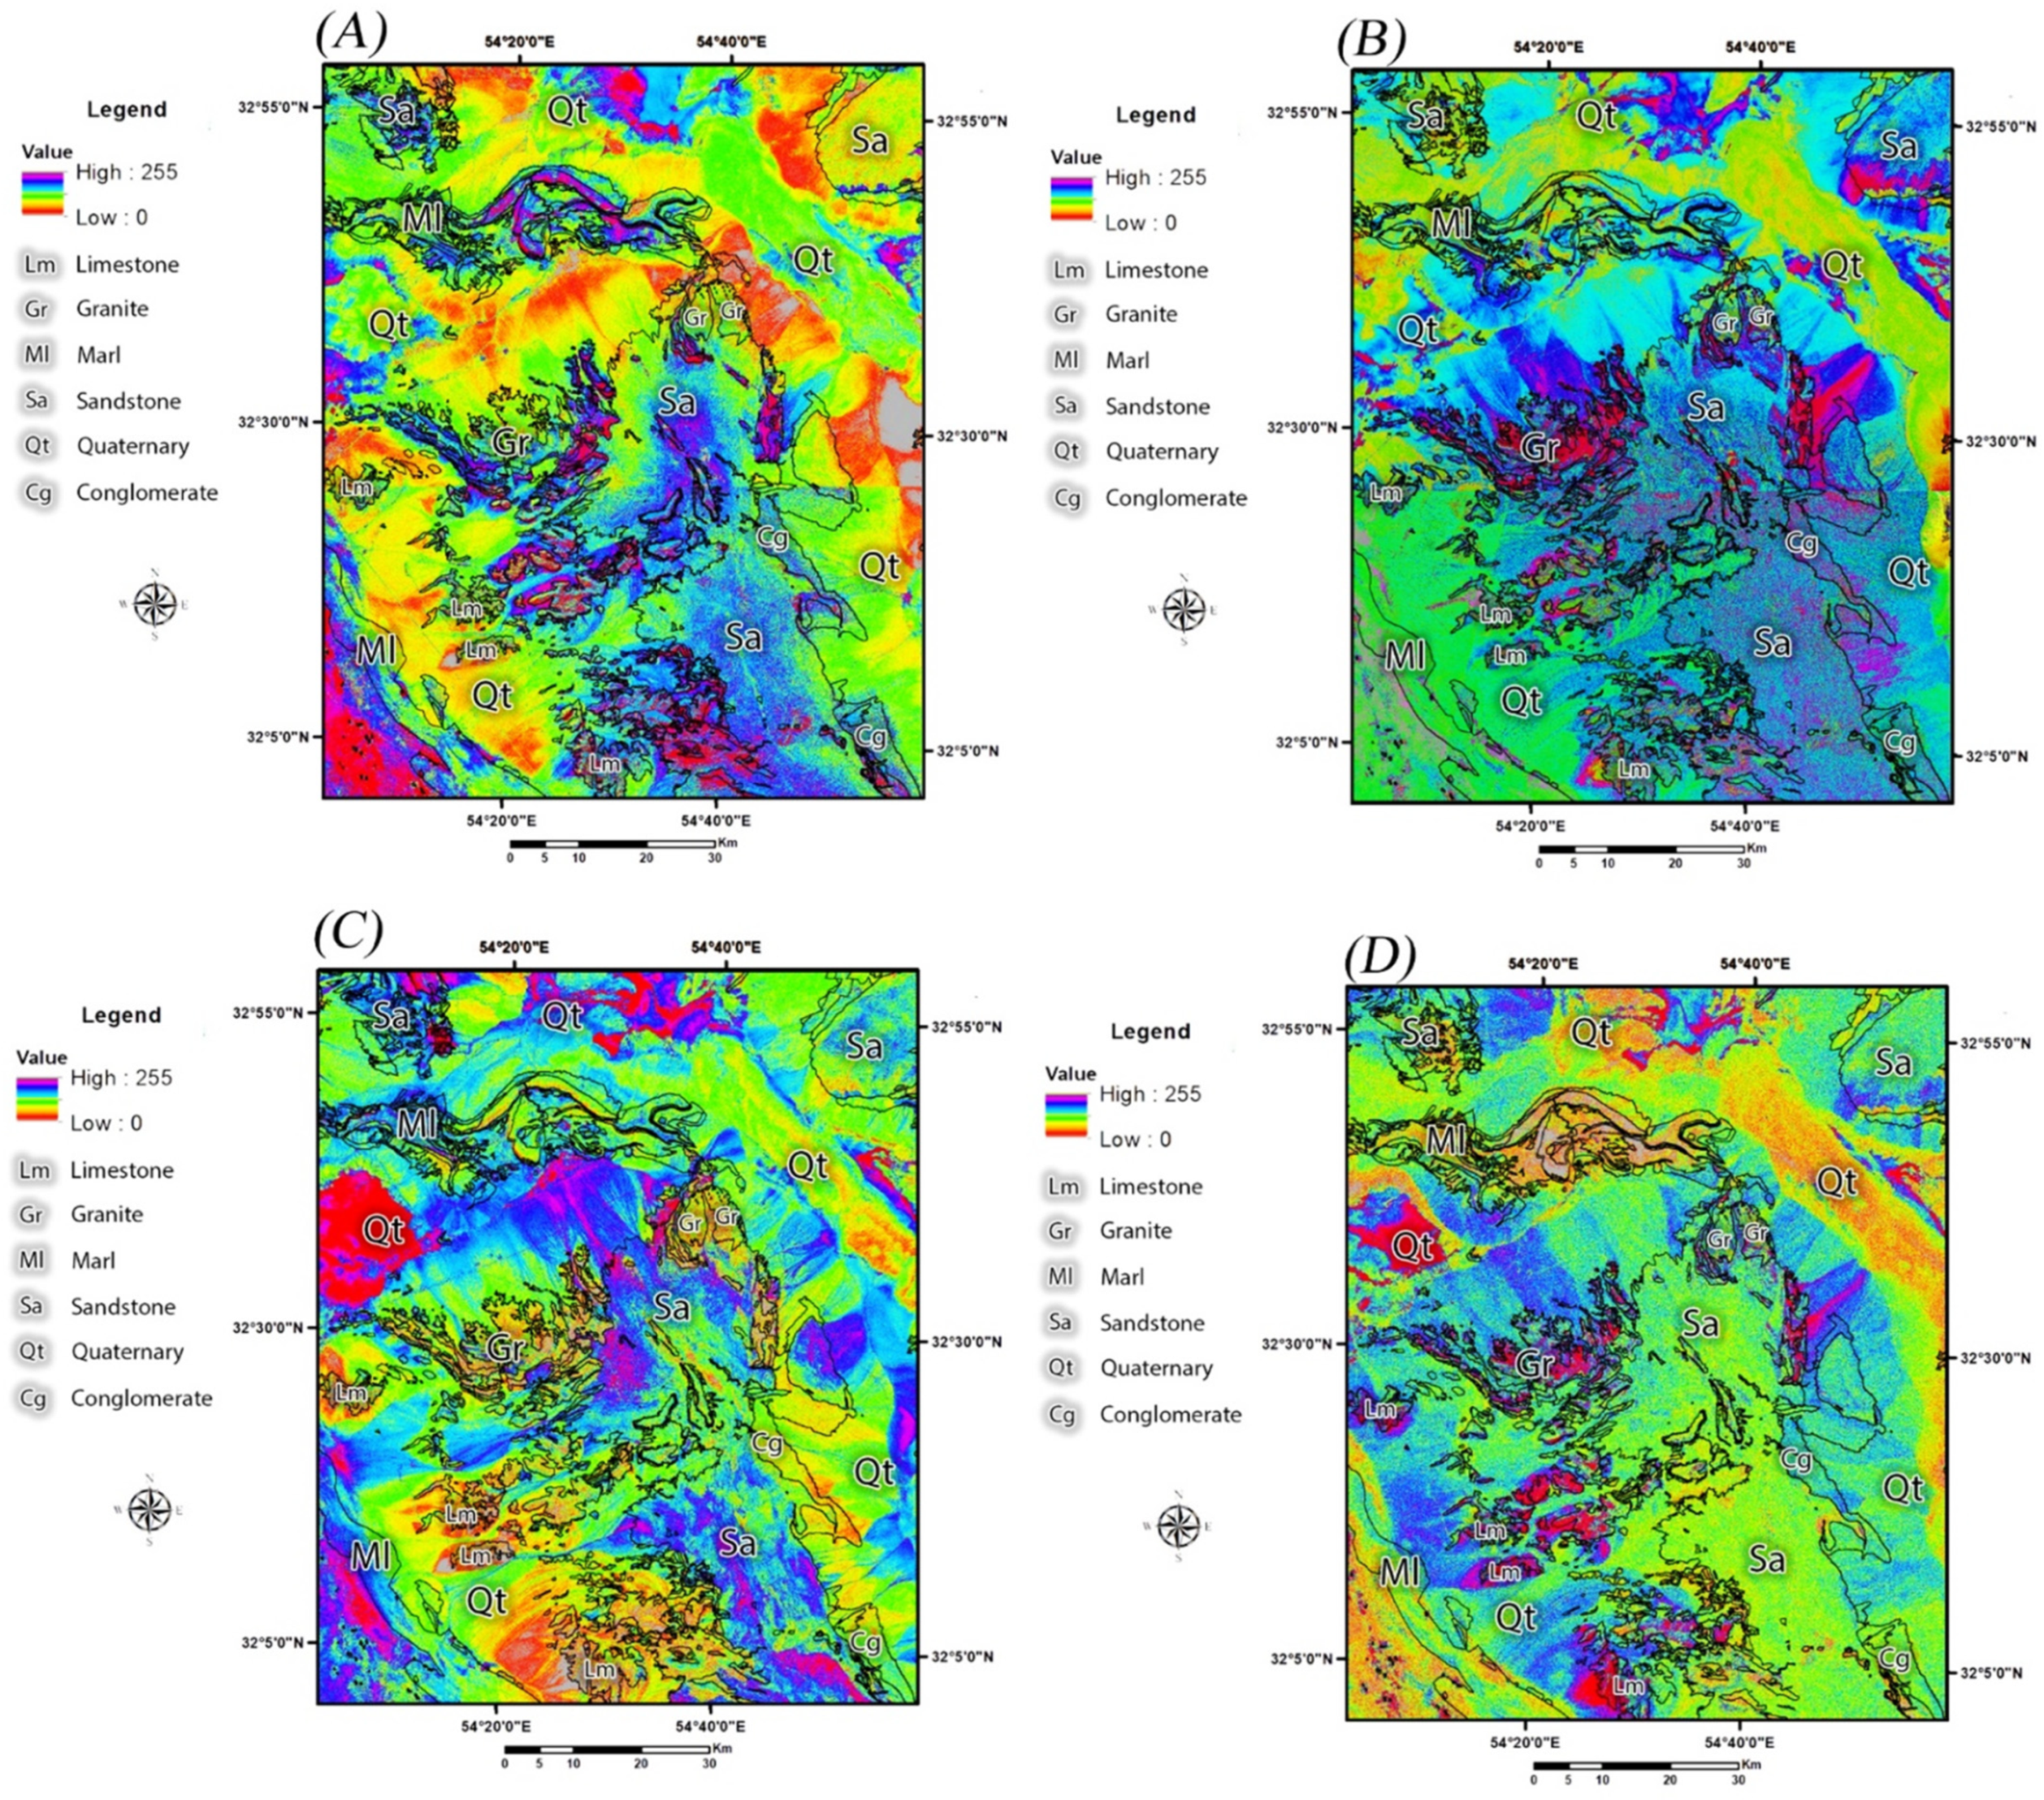
Figure 5A,B show the resultant images of PCA2 and PCA4 for Sentinel-2 as a pseudo-color ramp. High to moderate surface distribution of iron oxide/hydroxides is typically detected associated with sandstone, conglomerate, marl, and igneous rocks (
Figure 5A). On the other hand, high to moderate values of hydroxyl-bearing (Al-OH) alteration and carbonates are mapped with igneous rocks, limestone, sandstone, and some parts of the Quaternary background (
Figure 5B).
Analyzing eigenvector loadings for Landsat-7 PCA images indicates that the PCA3 and PCA4 (
Table 1B) contain desired information for detecting iron oxide/hydroxides and hydroxyl-bearing (Al-OH) alteration and carbonates in the study area. The PCA3 has strong loadings of band 1 (0.58) and band 3 (−0.65) with opposite signs; therefore, the PCA3 image maps iron oxide/hydroxides as bright pixels. Eigenvector loadings in PCA4 contain a strong contribution from band 5 (0.64) and band 7 (−0.56). It is evident that the PCA4 image can map hydroxyl-bearing (Al-OH) alteration and carbonates. The pseudo-color ramp for PCA3 and PCA4 images for Landsat-7 are shown in
Figure 5C,D. A high to moderate distribution of iron oxide/hydroxides is mapped in the Quaternary background, sandstone, some parts of igneous rocks, and marl (
Figure 5C). A high to moderate spatial distribution of hydroxyl-bearing (Al-OH) alteration and carbonates is identified associated with the limestone, igneous rocks, and some parts of the Quaternary background and sandstone (
Figure 5D). The PCA results are similar to BR outputs. Additionally, PCA mapped iron oxide/hydroxides and hydroxyl-bearing (Al-OH) alteration and carbonates with more details compared to BR (See
Figure 4 and
Figure 5).
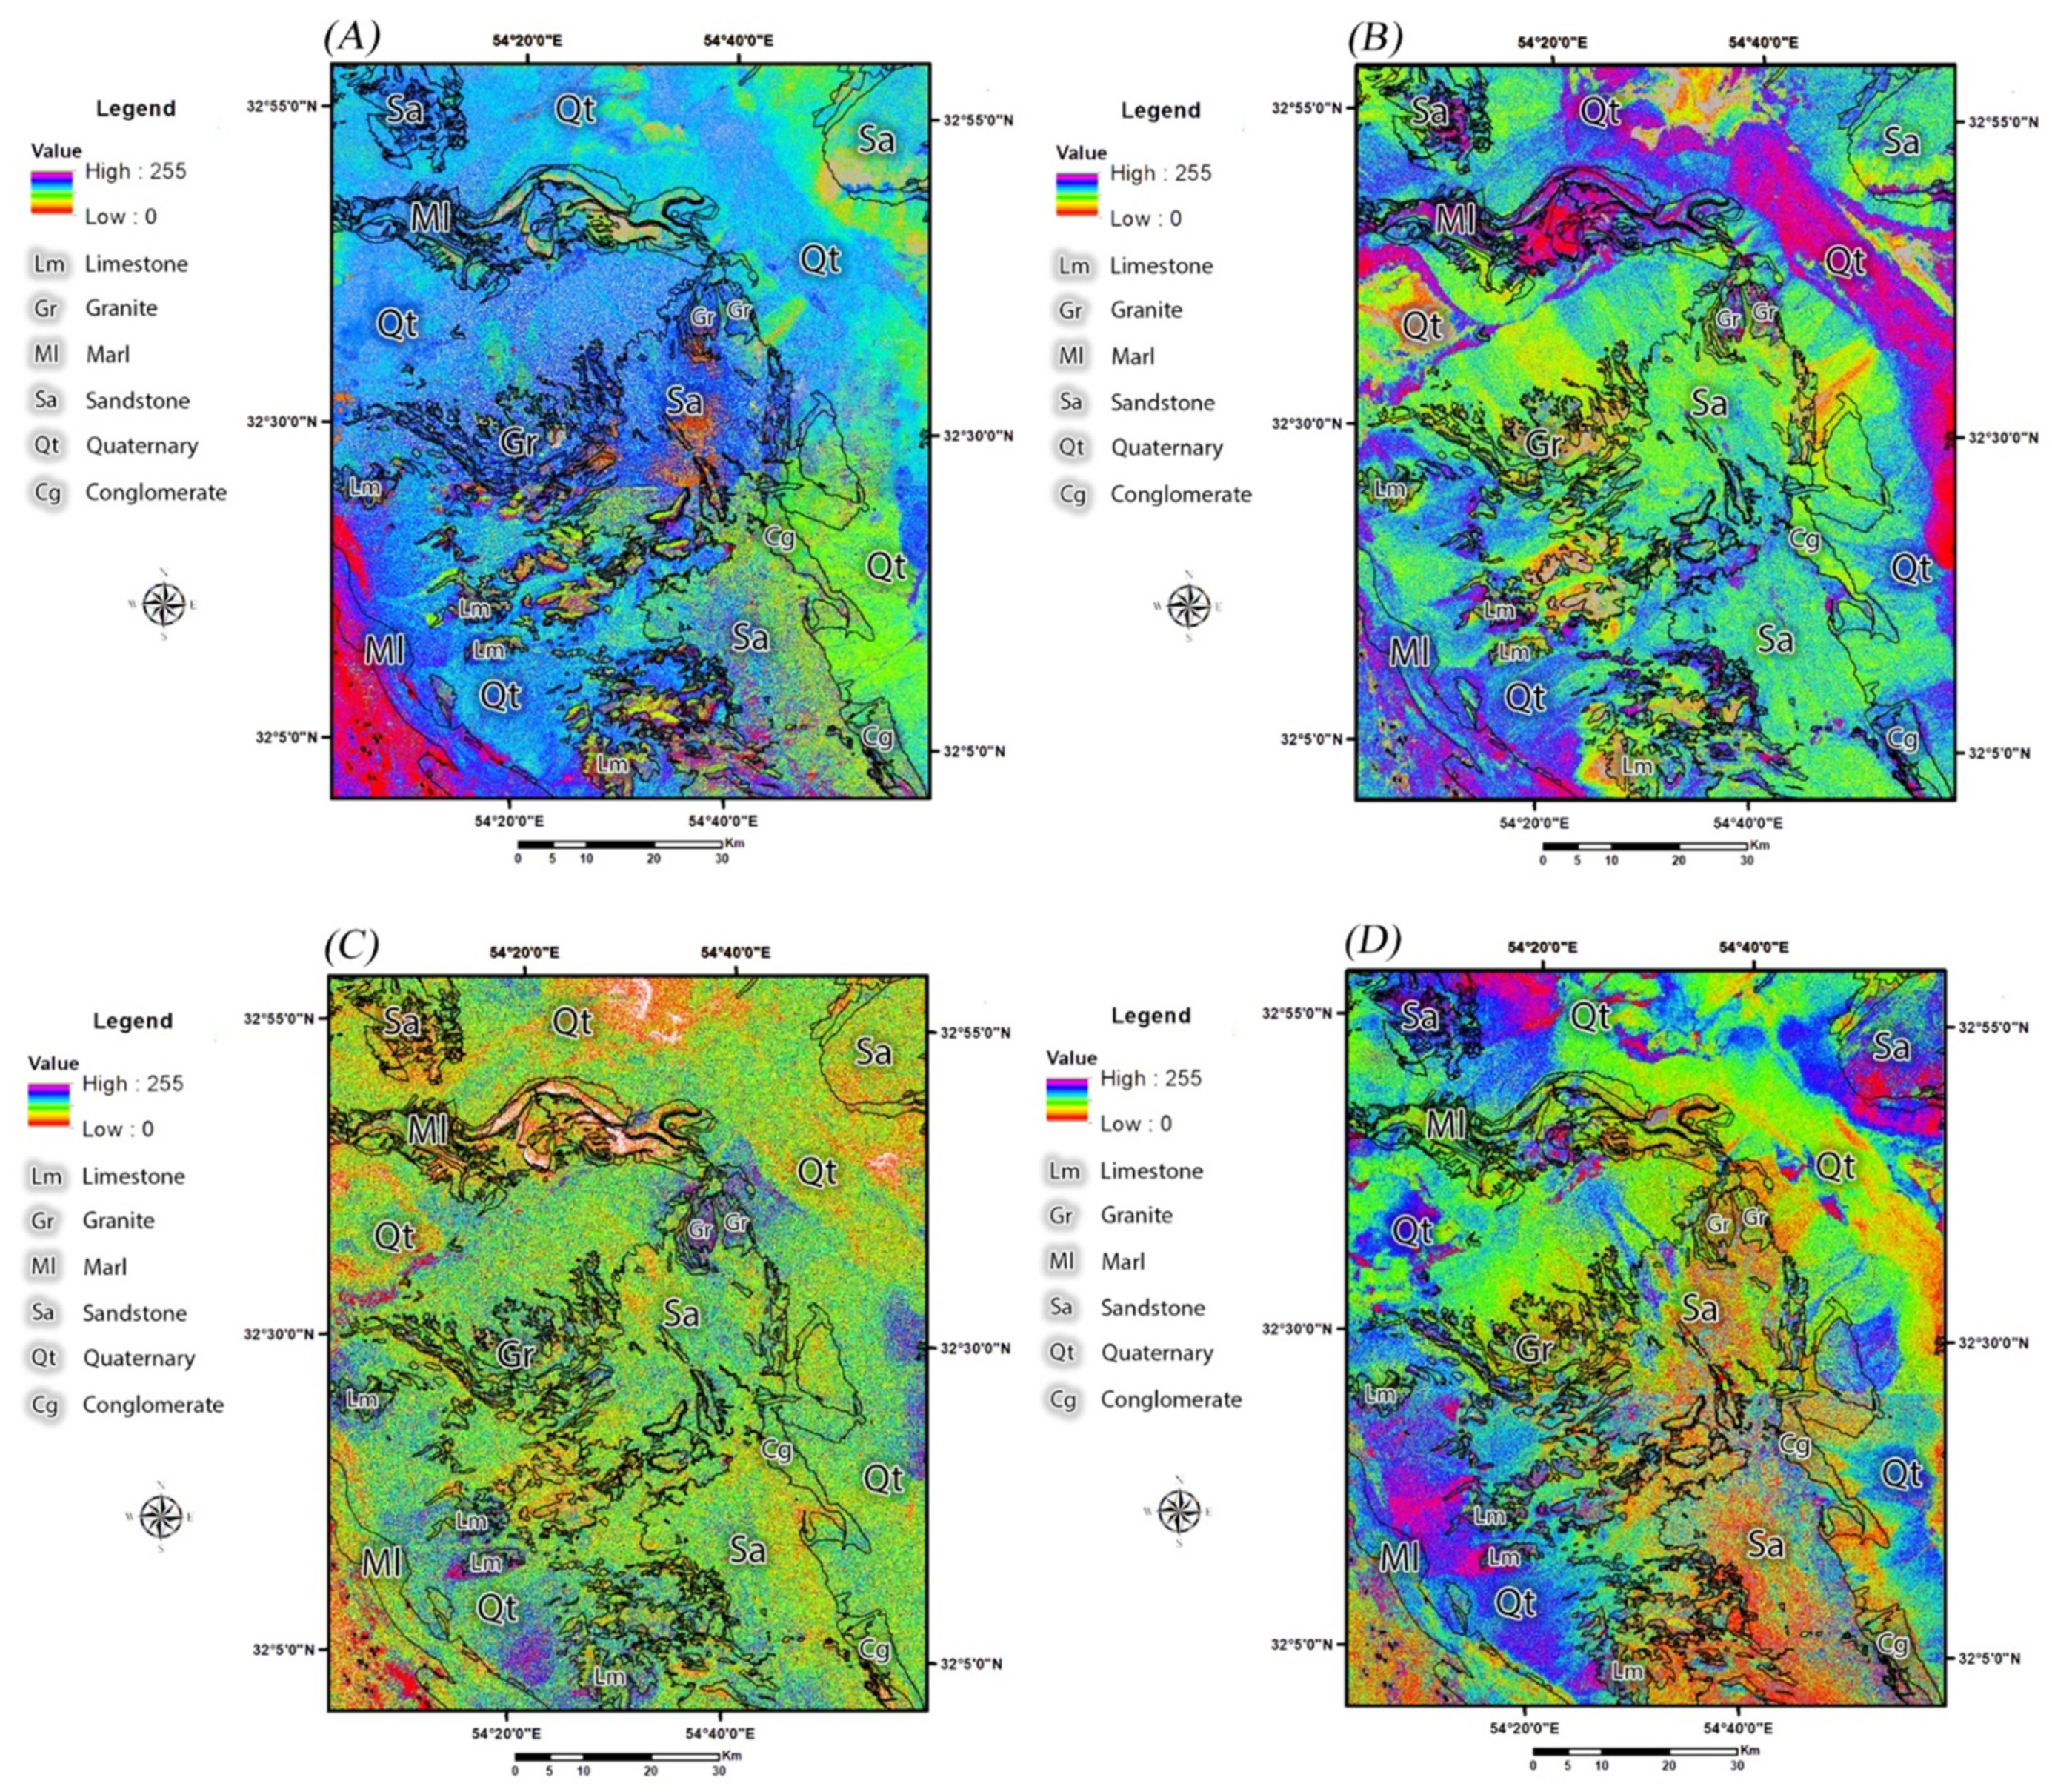
Figure 6A–D shows resultant images of the LS-Fit model as a pseudo-color ramp. The maps were generated using all selected bands of Sentinel-2 (1, 2, 3, 4, 11, and 12) and Landsat-7 (1, 2, 3, 4, 5, and 7) as input bands (predictor bands) and bands 4 and 12 (Sentinel-2) and bands 3 and 7 (Landsat-7) as modeled bands. These maps show the surface distribution of iron oxide/hydroxides and hydroxyl-bearing (Al-OH) alteration and carbonates as dark pixels. As a result, low to moderate values in the pseudo-color ramp show the surface distribution of the target alteration minerals.
Figure 6A shows LS-Fit residual band 4 (output) for Sentinel-2. The surface abundance of iron oxide/hydroxides is depicted in igneous rocks, sandstone, limestone, and some parts of the Quaternary background (
Figure 6A). The LS-Fit residual band 12 (output) for Sentinel-2 is shown in
Figure 6B. Hydroxyl-bearing (Al-OH) alteration and carbonates are mapped, associated with sandstone, igneous rocks, marl, and some parts of the Quaternary background (
Figure 6B).
Figure 6C shows LS-Fit residual band 3 (output) for Landsat-7. Iron oxide/hydroxides are detected with igneous rocks, sandstone, marl, and some parts of the Quaternary background (
Figure 6C). The LS-Fit residual band 7 (output) for Landsat-7 is displayed in
Figure 6D. The spatial distribution of hydroxyl-bearing (Al-OH) alteration and carbonates is typically mapped in sandstone, igneous rocks, and limestone (
Figure 6D). The results of the LS-Fit model are identical to the PCA and BR outputs. Accordingly, the spatial distribution of the alteration minerals with some of the lithological units in the study area is identified and verified using different image processing techniques. The alteration minerals are one of the most important indicators of ore mineralizations, especially where they are associated with igneous lithological units in the study area.
4.2. Aerial Magnetometry Results
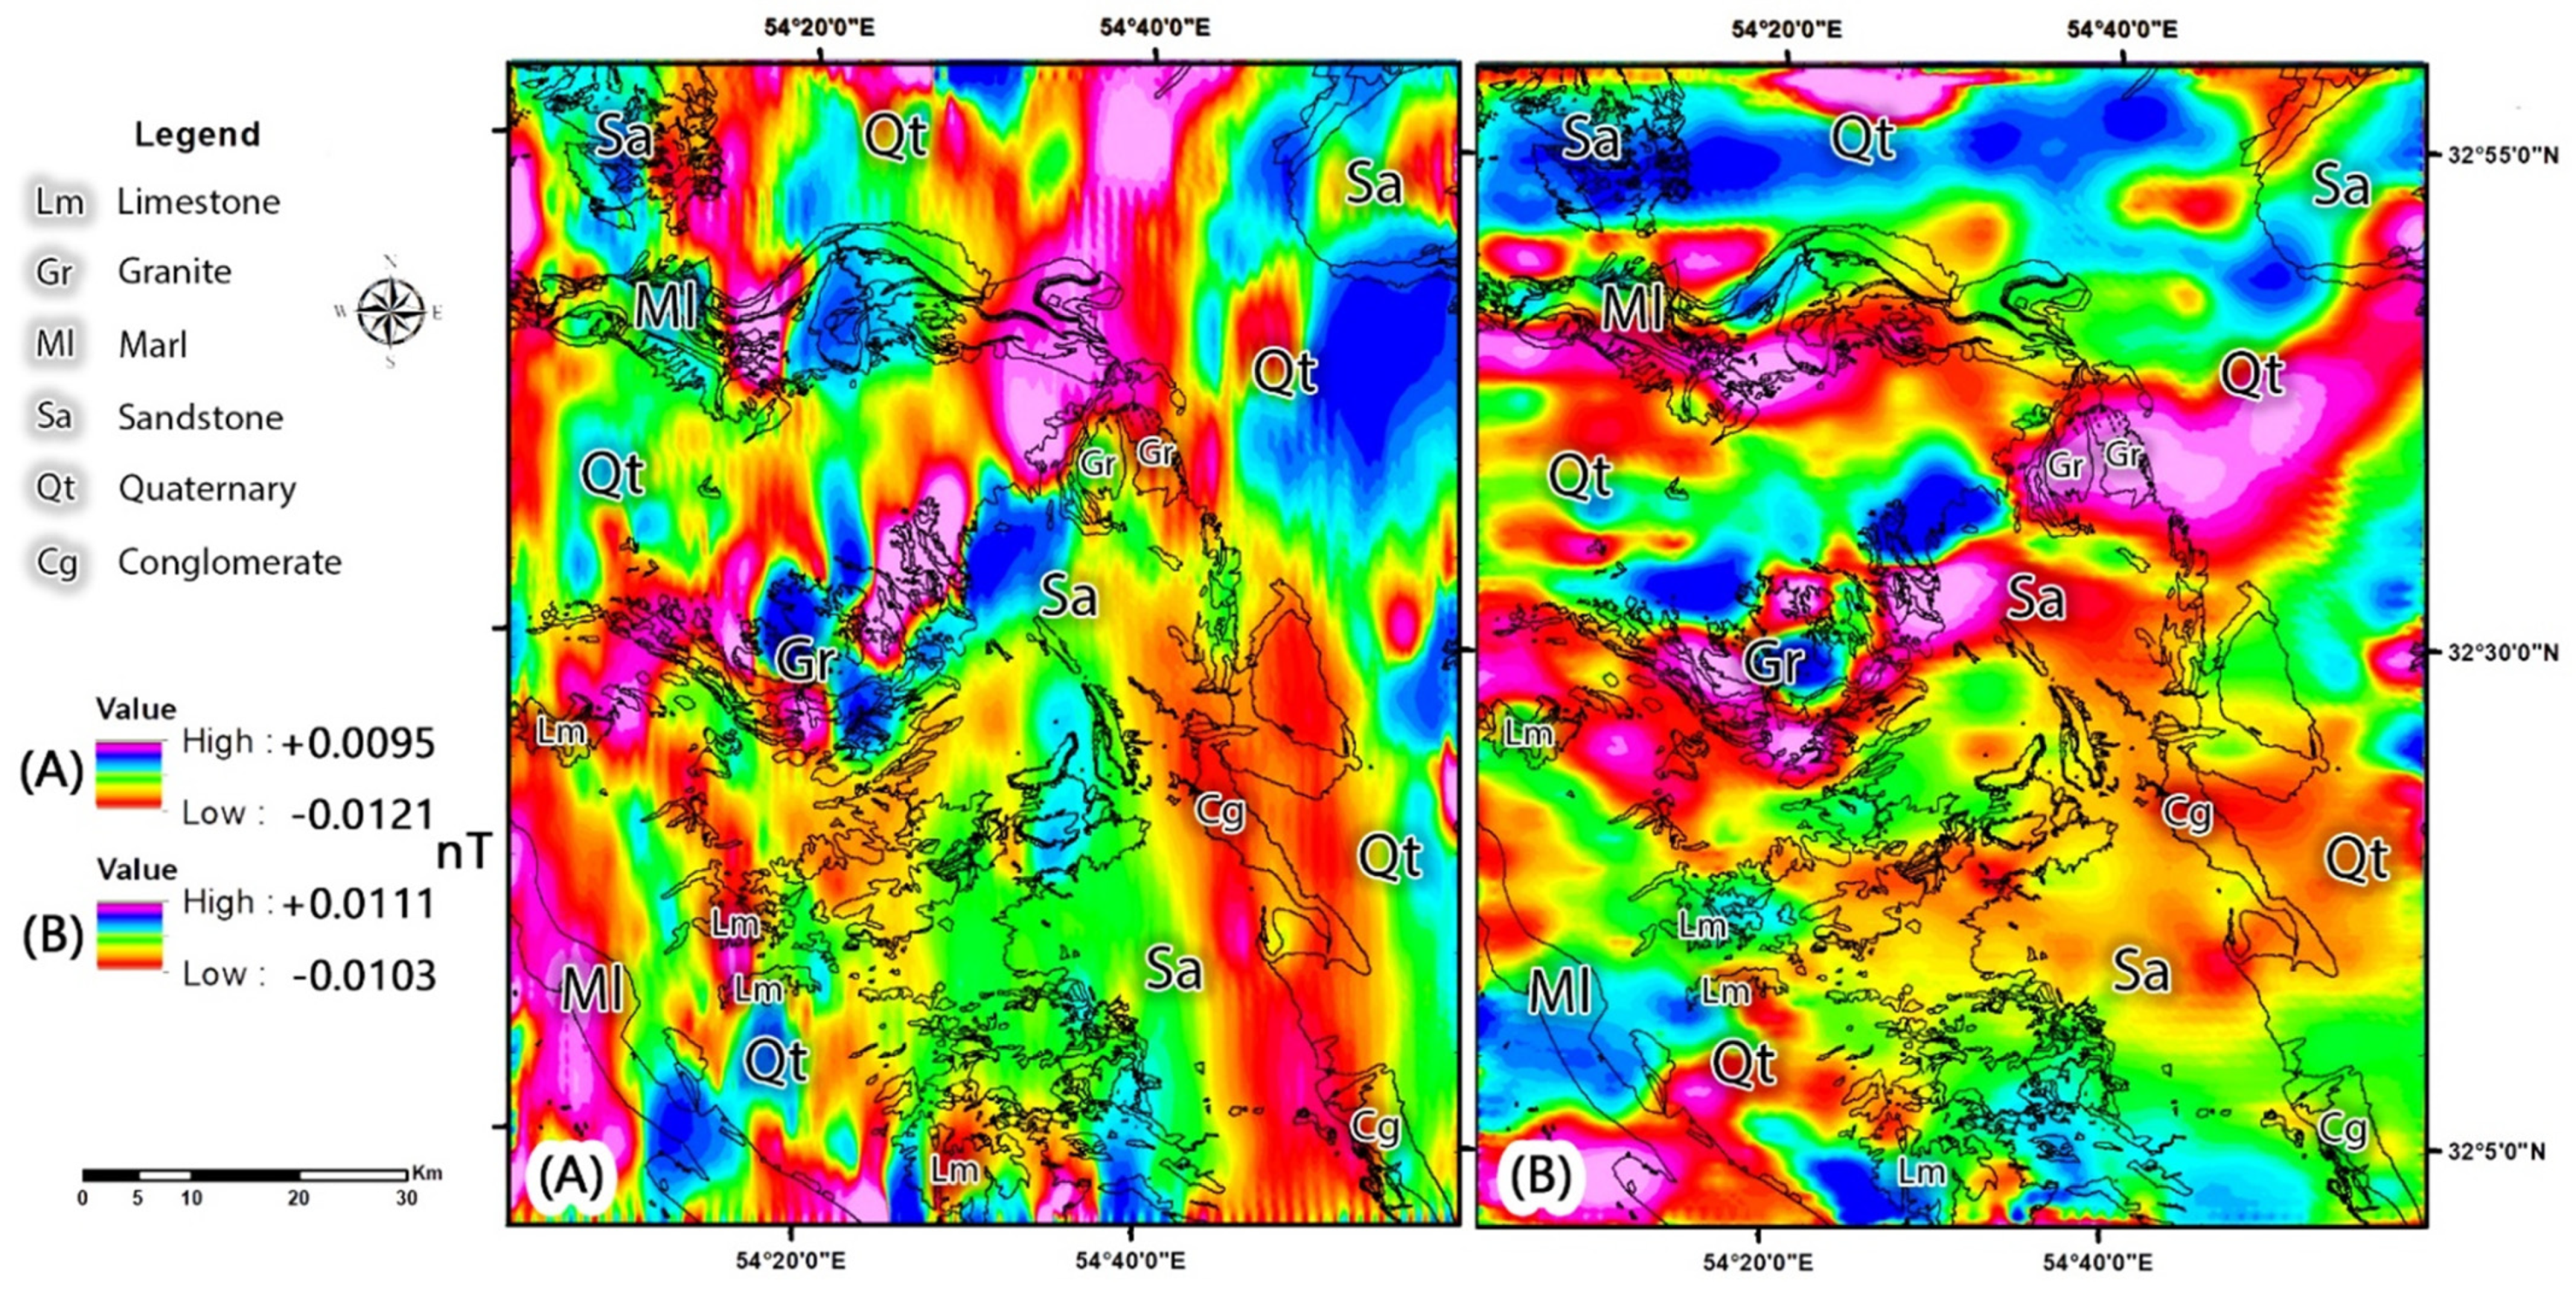
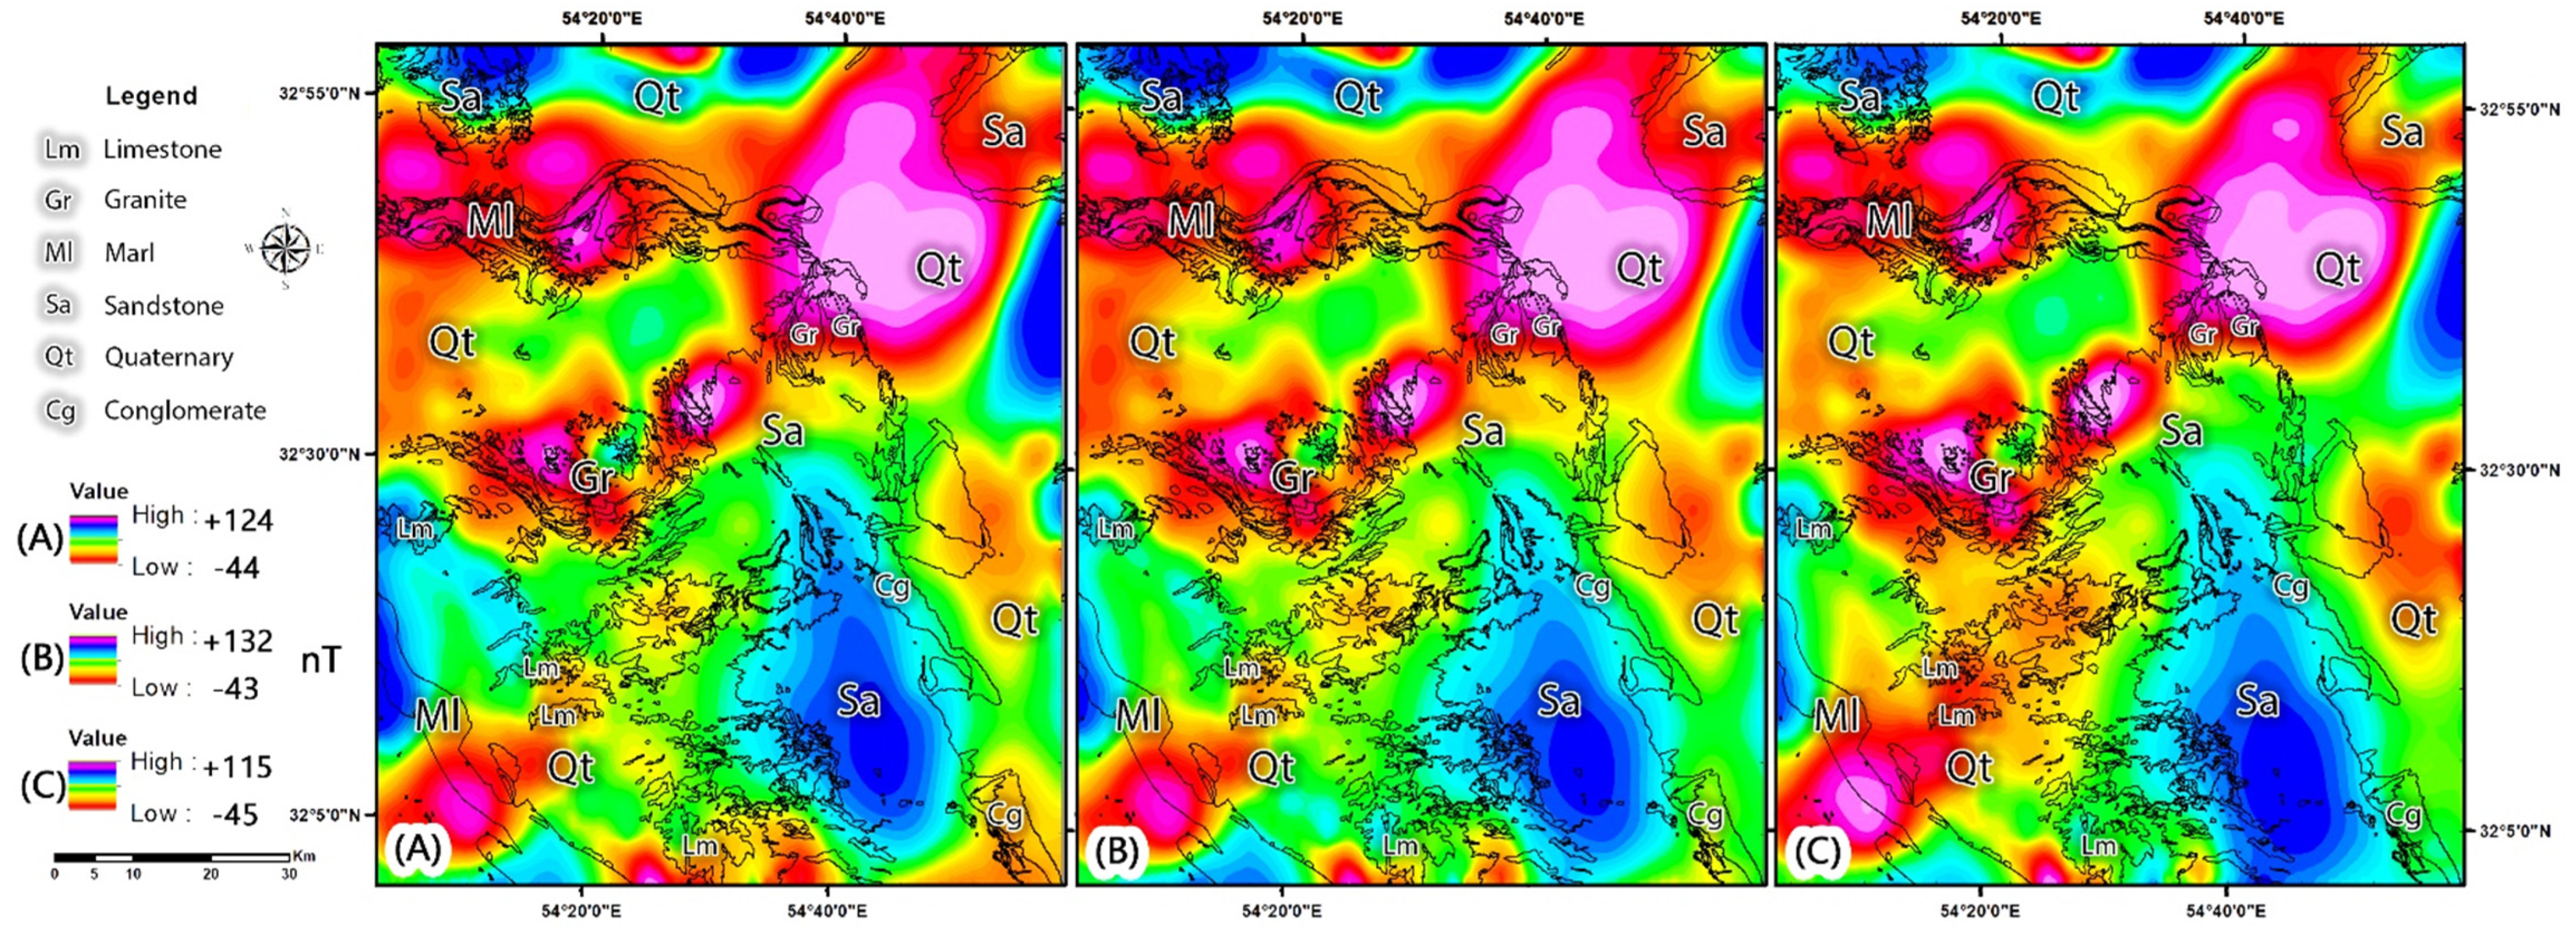
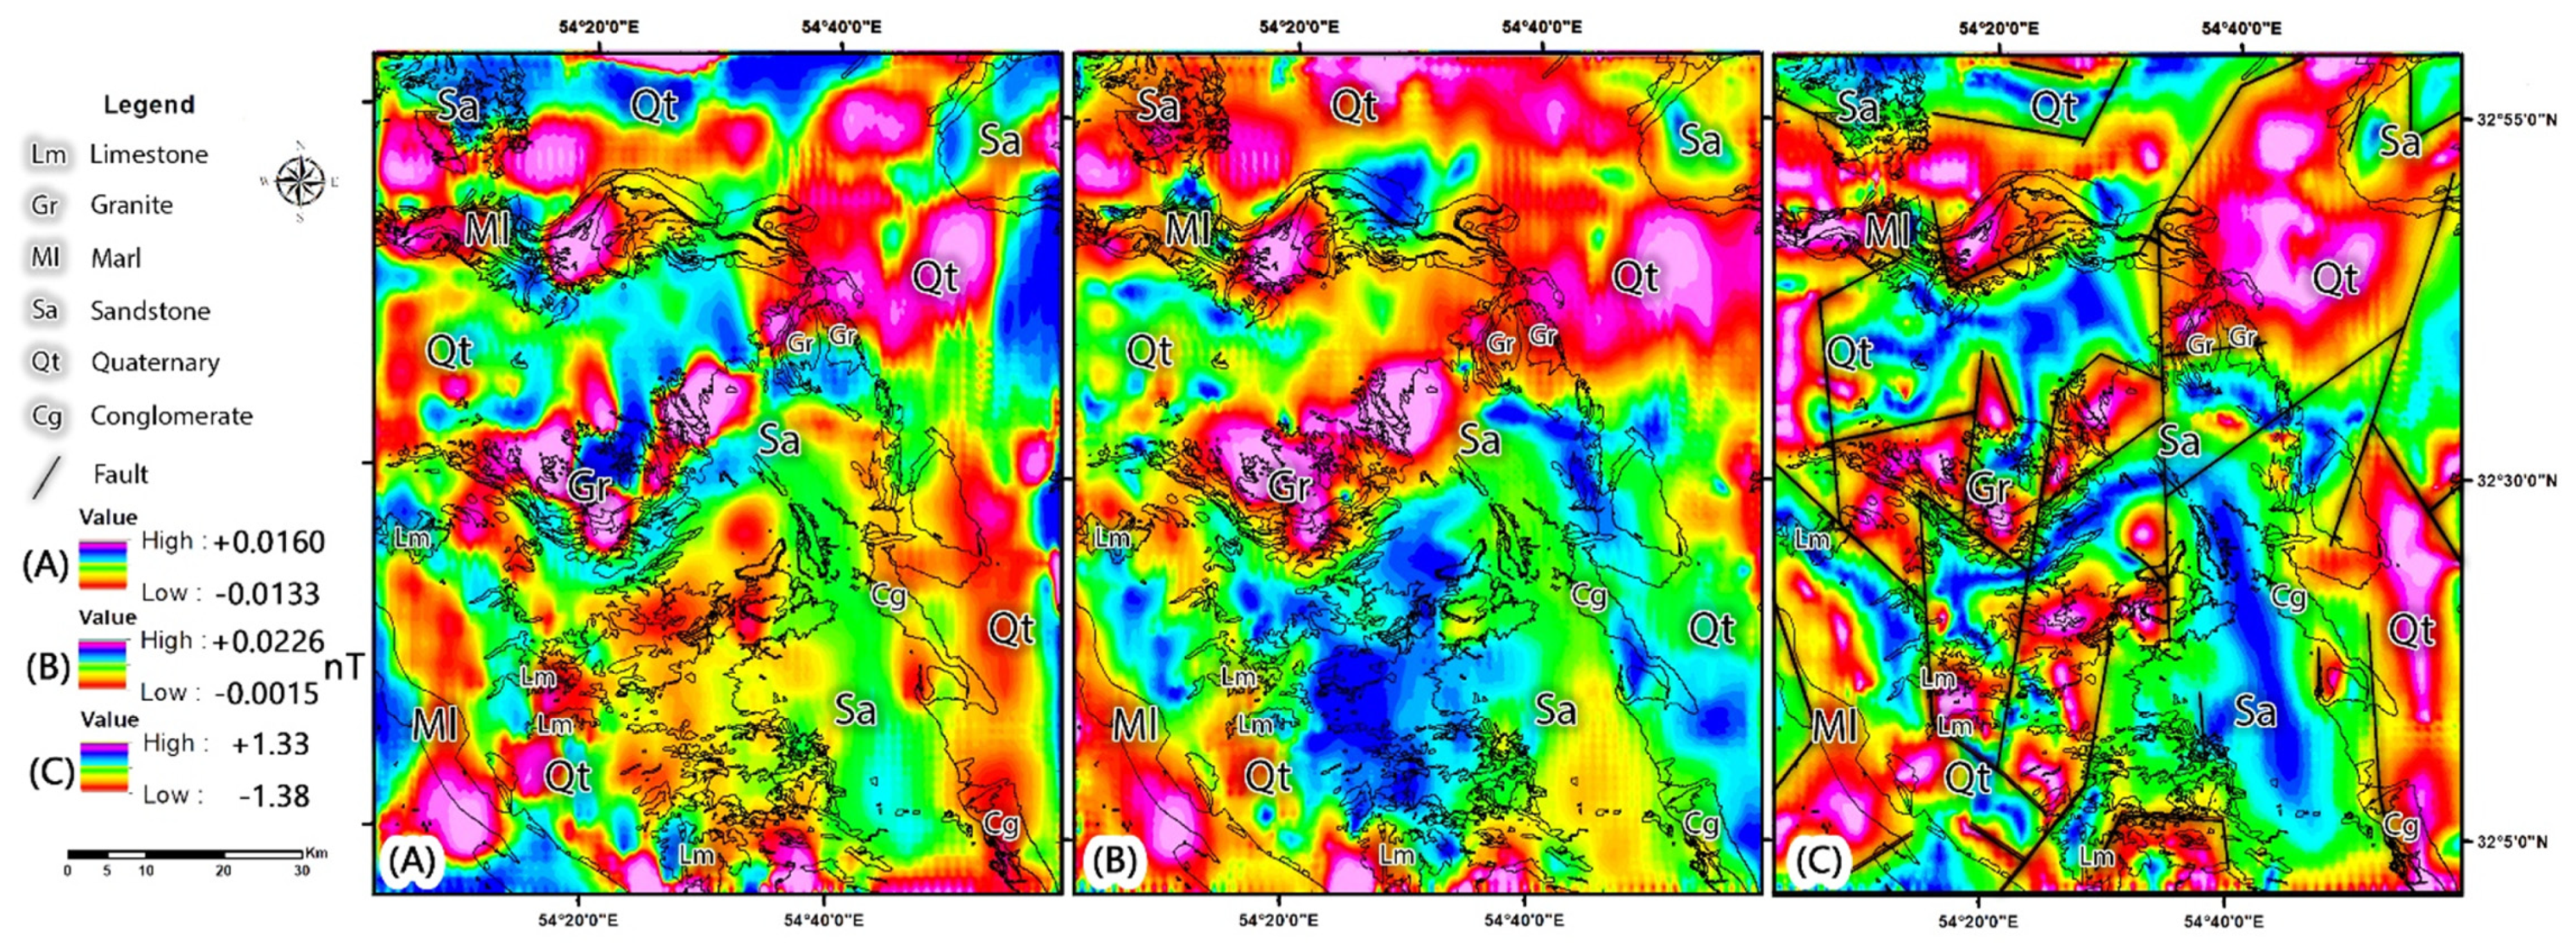
Figure 7A–C shows the residual map resulting from the application of the trend removal filter using the fit of a plate one-degree, two-degrees, and three-degrees for the study area, respectively. It should be noted that the zones having purple and blue shades in the maps indicate anomalous intrusive masses. In the zones where the dipoles are shaped, the anomalous masses are placed in the center of the dipoles.
Figure 7A shows the residual map obtained from the fitting of a first-degree level. This Figure shows some of the anomalous zones, especially in the northwestern, central, northeastern, and southeastern parts of the study area.
Figure 7B shows an almost similar result to the one-degree residual map. The map presented in
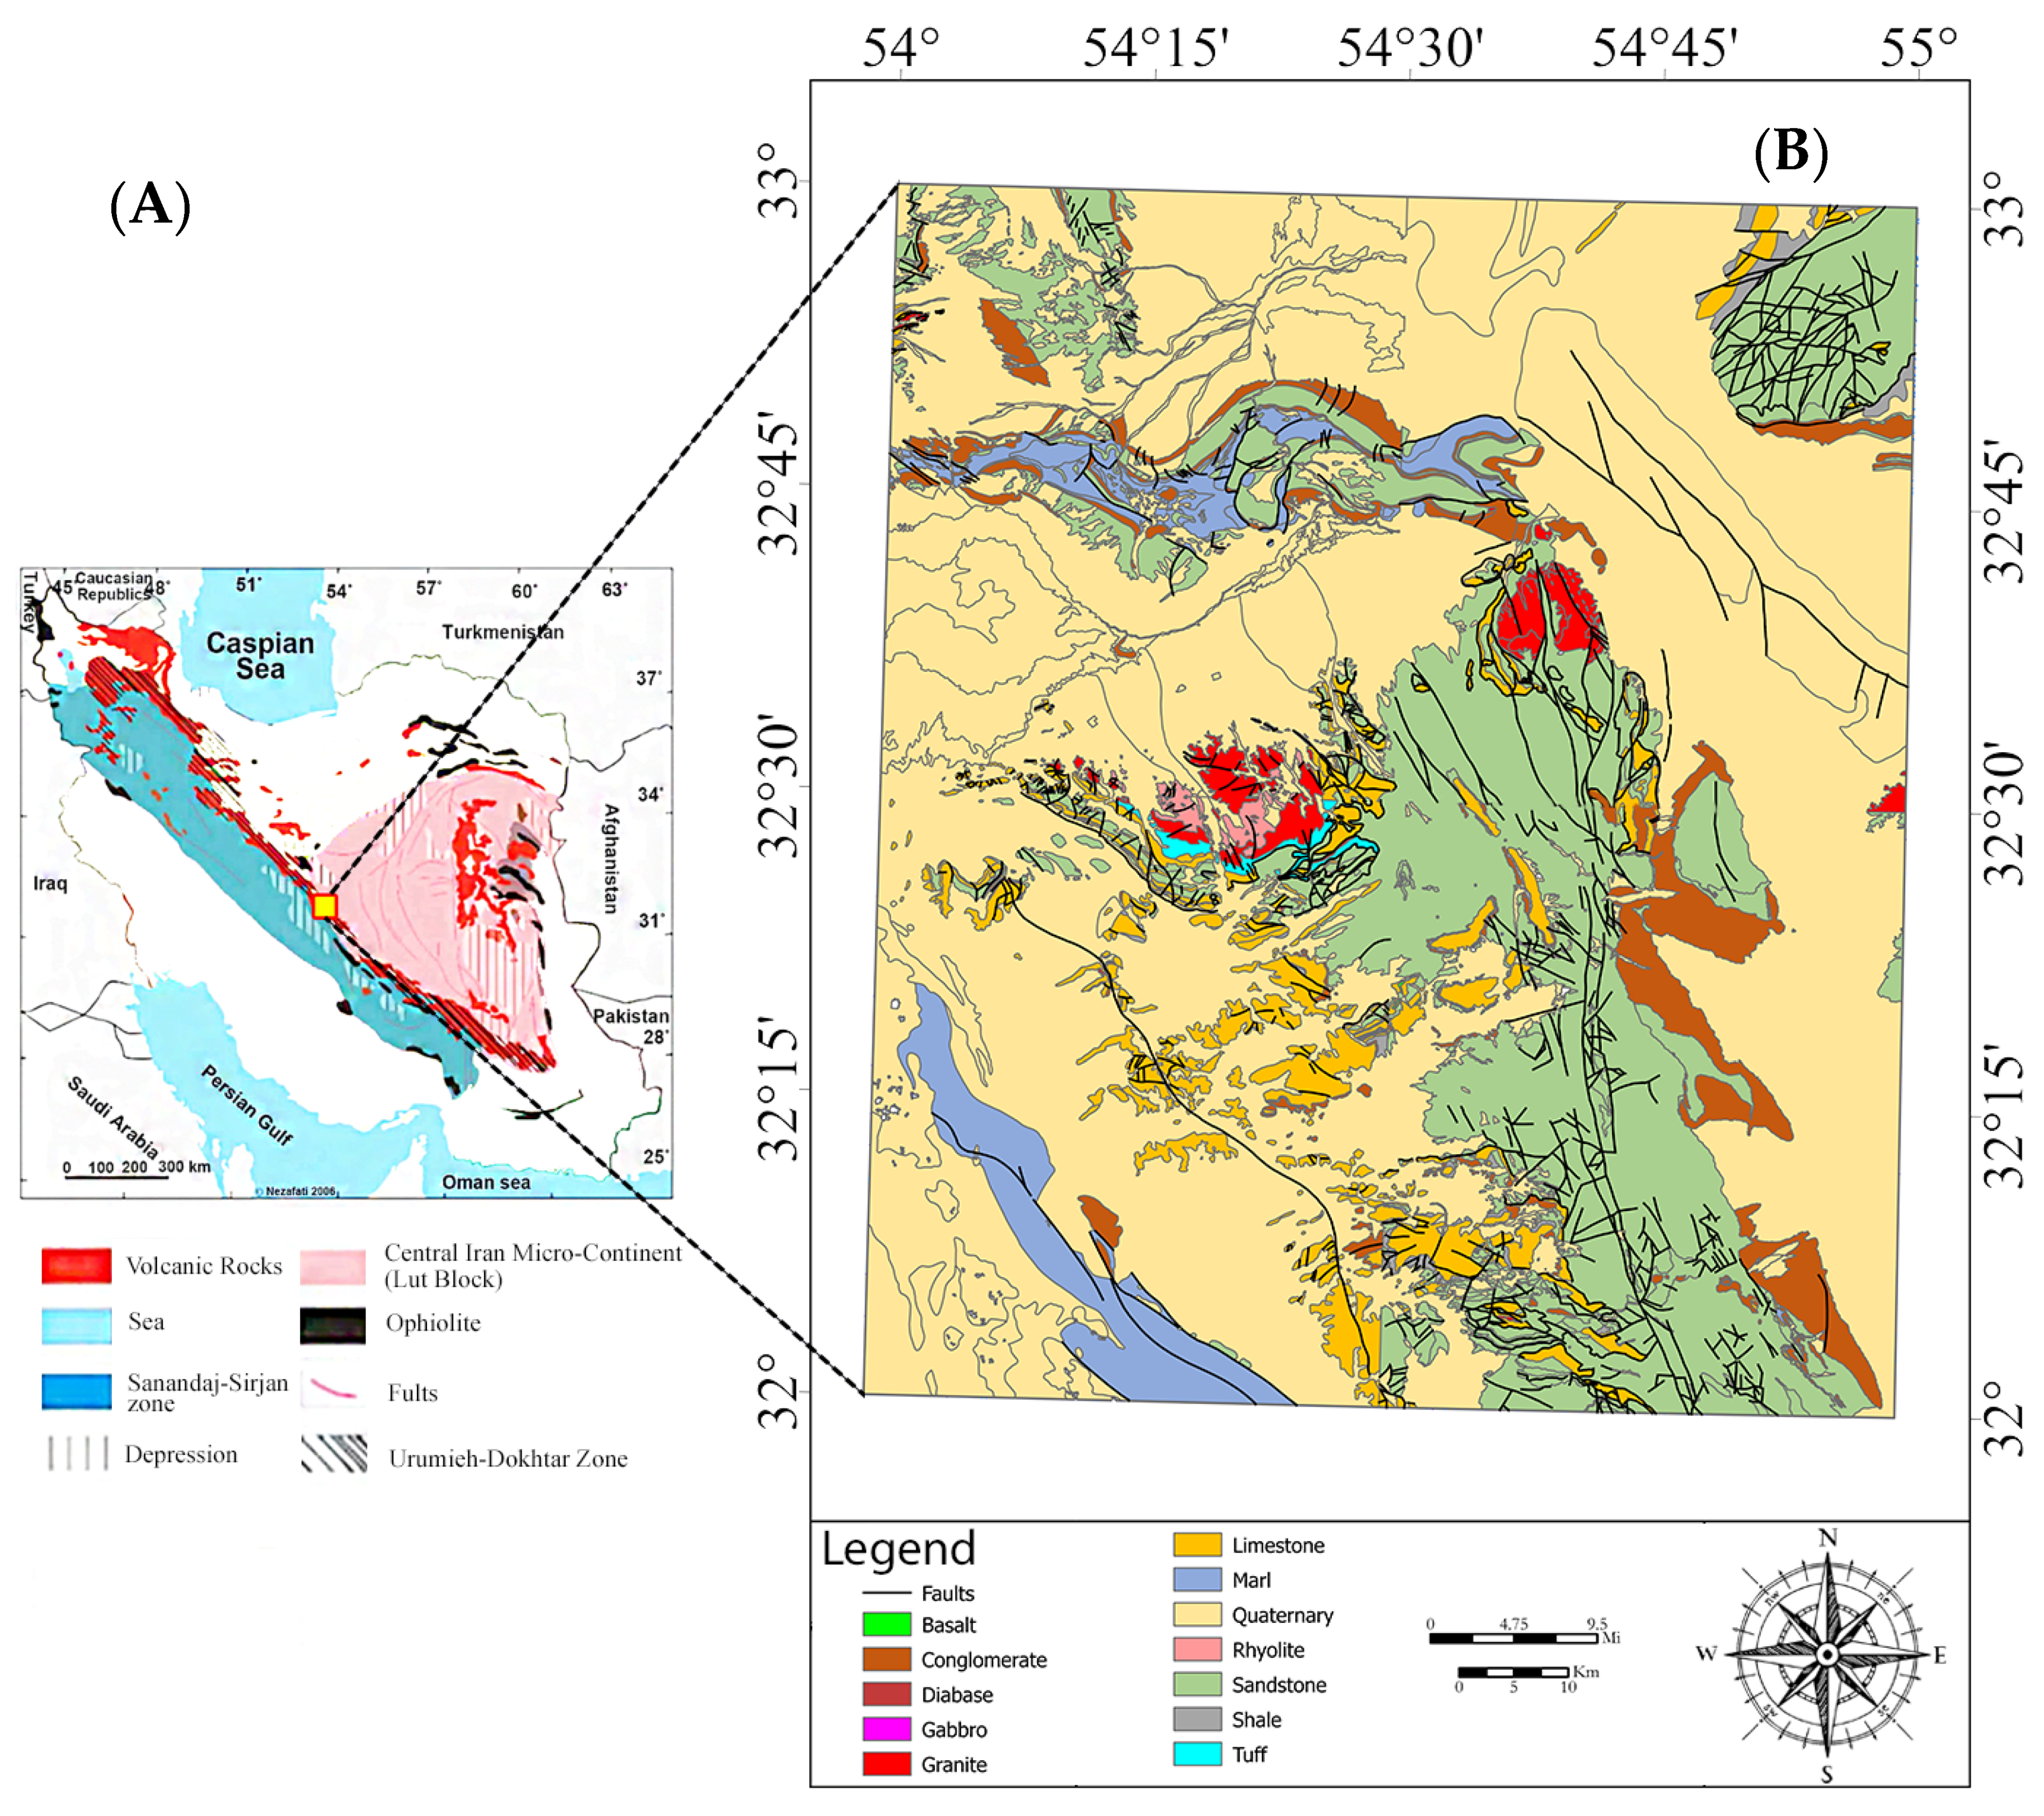
Figure 7C, which has the highest degree of fit of the curve to a third-degree level, shows the main and real anomalies that are closer to the surface more accurately. Regarding the geology map of the study area (see
Figure 1B), igneous rocks (granite, gabbro, and diabase) are mainly placed in the center of the anomalous dipoles. Additionally, the other lithological units such as sandstone and marl, along with some parts of the Quaternary background, showed some anomalous dipoles (
Figure 7C). These sedimentary lithological units might superimpose some intrusive masses.
The map obtained by applying the first vertical derivative filter to the magnetic data is shown in
Figure 8A. The vertical derivative maps amplify the high-frequency (low-wavelength) waves; therefore, surface anomalies become clearer, and the effect of deep anomalies will be reduced. As a result, high potential intrusive masses related to mineralization can be revealed. In this map, the analysis of magnetic masses can be observed due to the disappearance effect of large and deep anomalies. The anomalous dipoles are typically associated with igneous rocks (granite, gabbro, and diabase) and in northeastern, northwestern, and southwestern parts of the Quaternary background (
Figure 8A).
Figure 8B shows the resulting map derived from applying the analytical signal filter. This Figure indicates the presence of masses with multiple magnetic anomalies and highlights the approximate position of the edges of the magnetic masses in the study area. In
Figure 8B, the anomalous dipoles are mostly found with igneous rocks and the Quaternary background (northeastern, northwestern, and southwestern segments). The
TDX was used to identify deep lines and faults resulting from magnetic data.
Figure 8C shows the resultant map. Most of the long lineaments trend N–S, NW–SE, NE–SW in the study area. However, some short lineaments strike NE–SW, W–E, N–S are also mapped.
Furthermore, the horizontal derivative filter was used to identify fault systems in the study area. This filter was applied to the data in different directions.
Figure 9A,B shows the application of horizontal derivative filters in the azimuth direction of 45 and 135 degrees. Deep and hidden faults were identified using the horizontal derivative map and
TDX map. It also helped in identifying the orientation of the deep intrusive masses, which are mostly found in the central, northeastern, northwestern, and southwestern parts of the study area (
Figure 9A,B). Concerning the geology map of the study area (see
Figure 1), regardless of igneous units, the magnetic anomalous dipoles are mostly placed on sandstone and the Quaternary background. It might show the presence of deep intrusive masses that were covered by sedimentary units. Accordingly, the prevalence of existing structural discontinuities in the deep intrusive masses can build conduit systems for circulation and entrapment of hydrothermal fluids and consequent ore mineralization in the study area.
4.3. Fusion of Exploratory/Information Layers
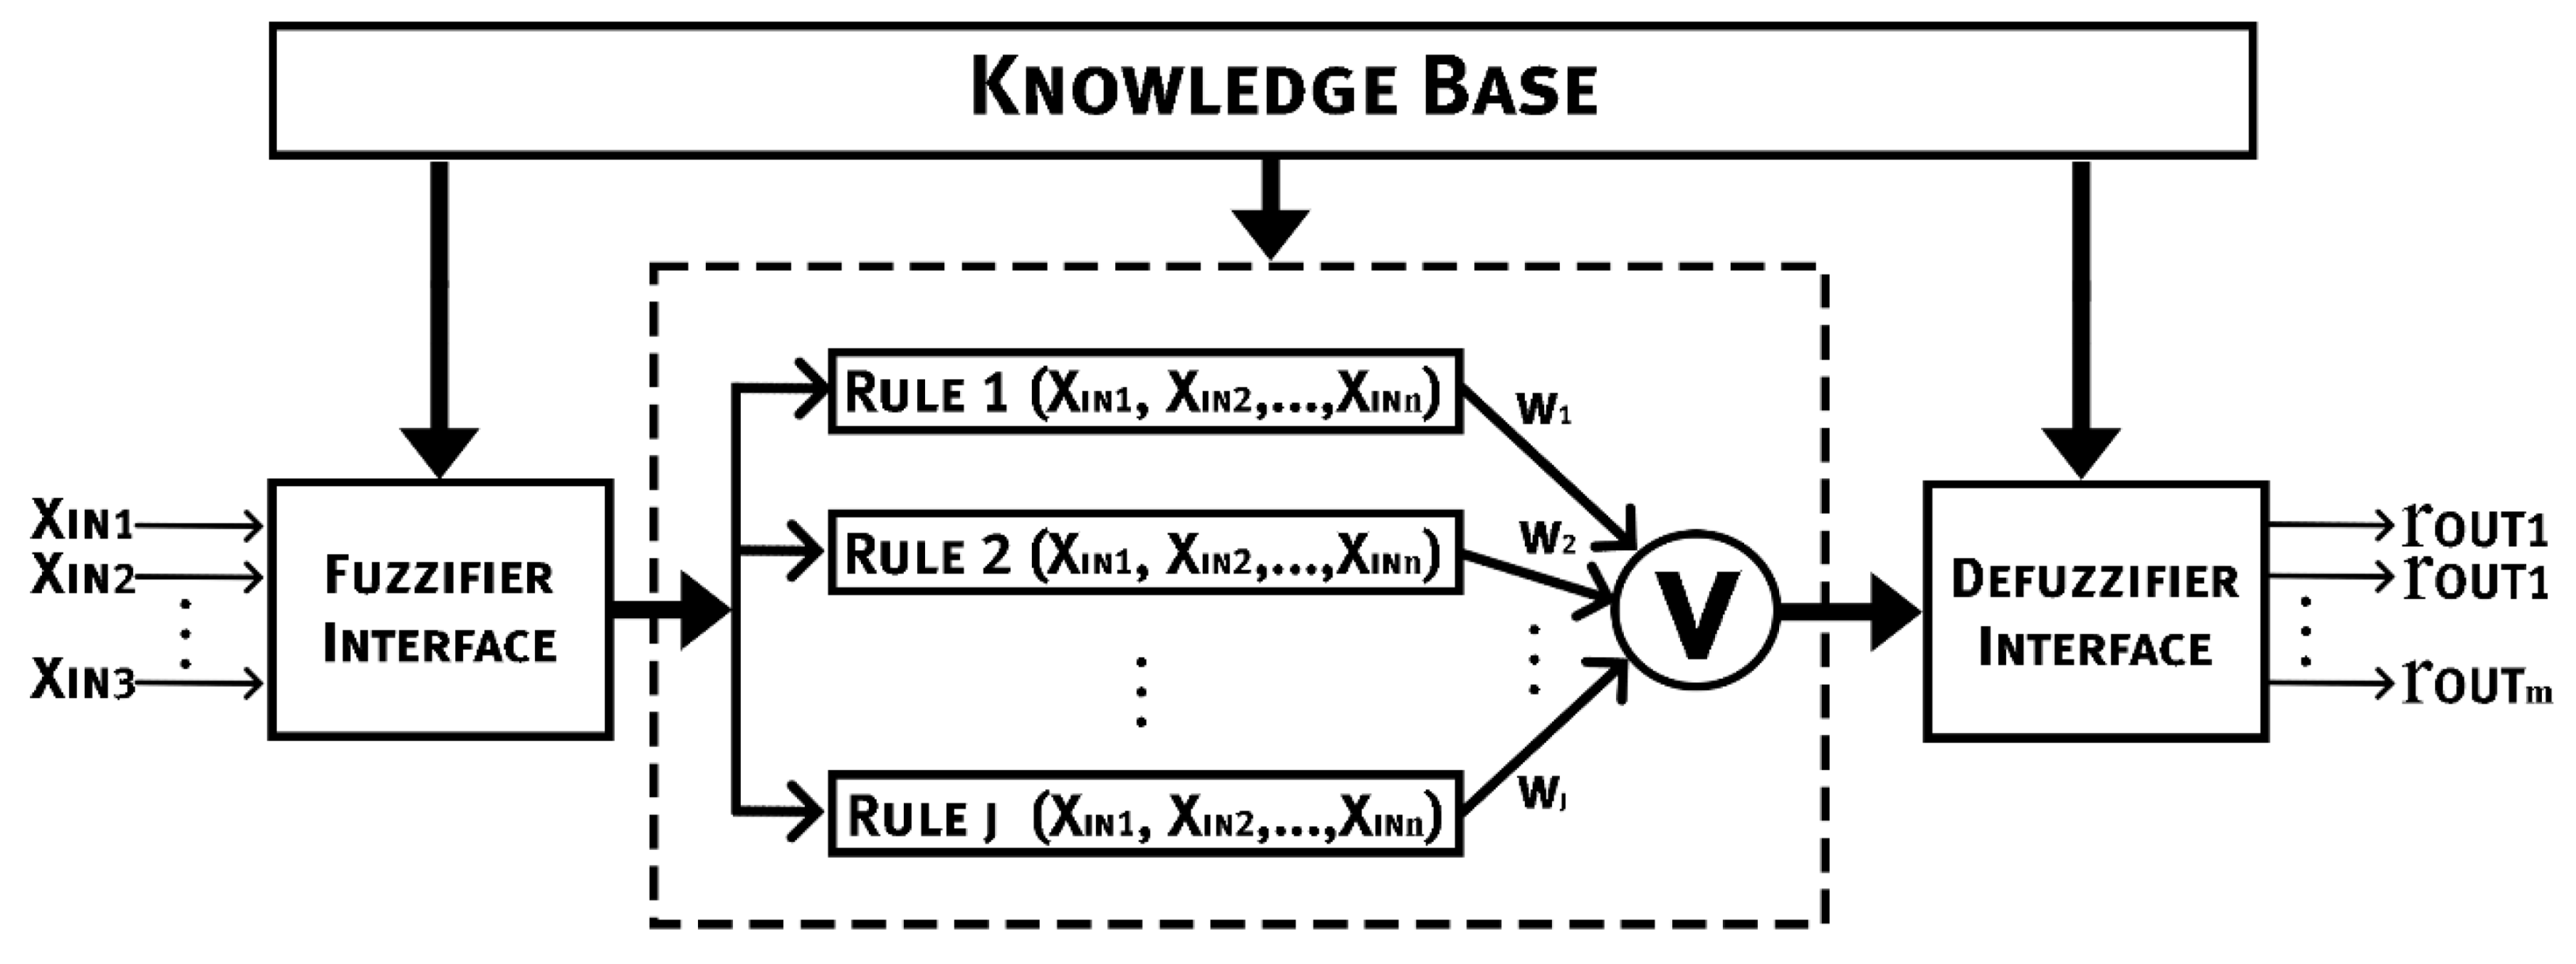
Fuzzy logic and index overlap methods were used for fusing the exploratory/information layers derived from remote sensing, magnetometry, and geological datasets. The fuzzy logic model was operated to pinpoint the potential zones in the study area. The maps were fused in pairs or in different stages to obtain the final potential maps. To achieve this goal, the importance of ore mineralization factors must be determined. All exploratory/information layers were weighted in this regard [
6,
45]. The types of layers and created classes, along with the weight of the classes, are presented in
Table 2. Subsequently, fuzzy sum and gamma operators were used. In this study, the geological, alteration, and intrusive data layers were fused using the fuzzy summative operator. The fuzzy gamma operator was applied to the fault density layer. Gamma values of 0.8 and 0.9 were utilized to ensure model quality. The geological, remote sensing, and aerial magnetometry were fused using the algebraic addition fuzzy operator, and then, the results were merged with two gamma values of 0.8 and 0.9 with the fault density map.
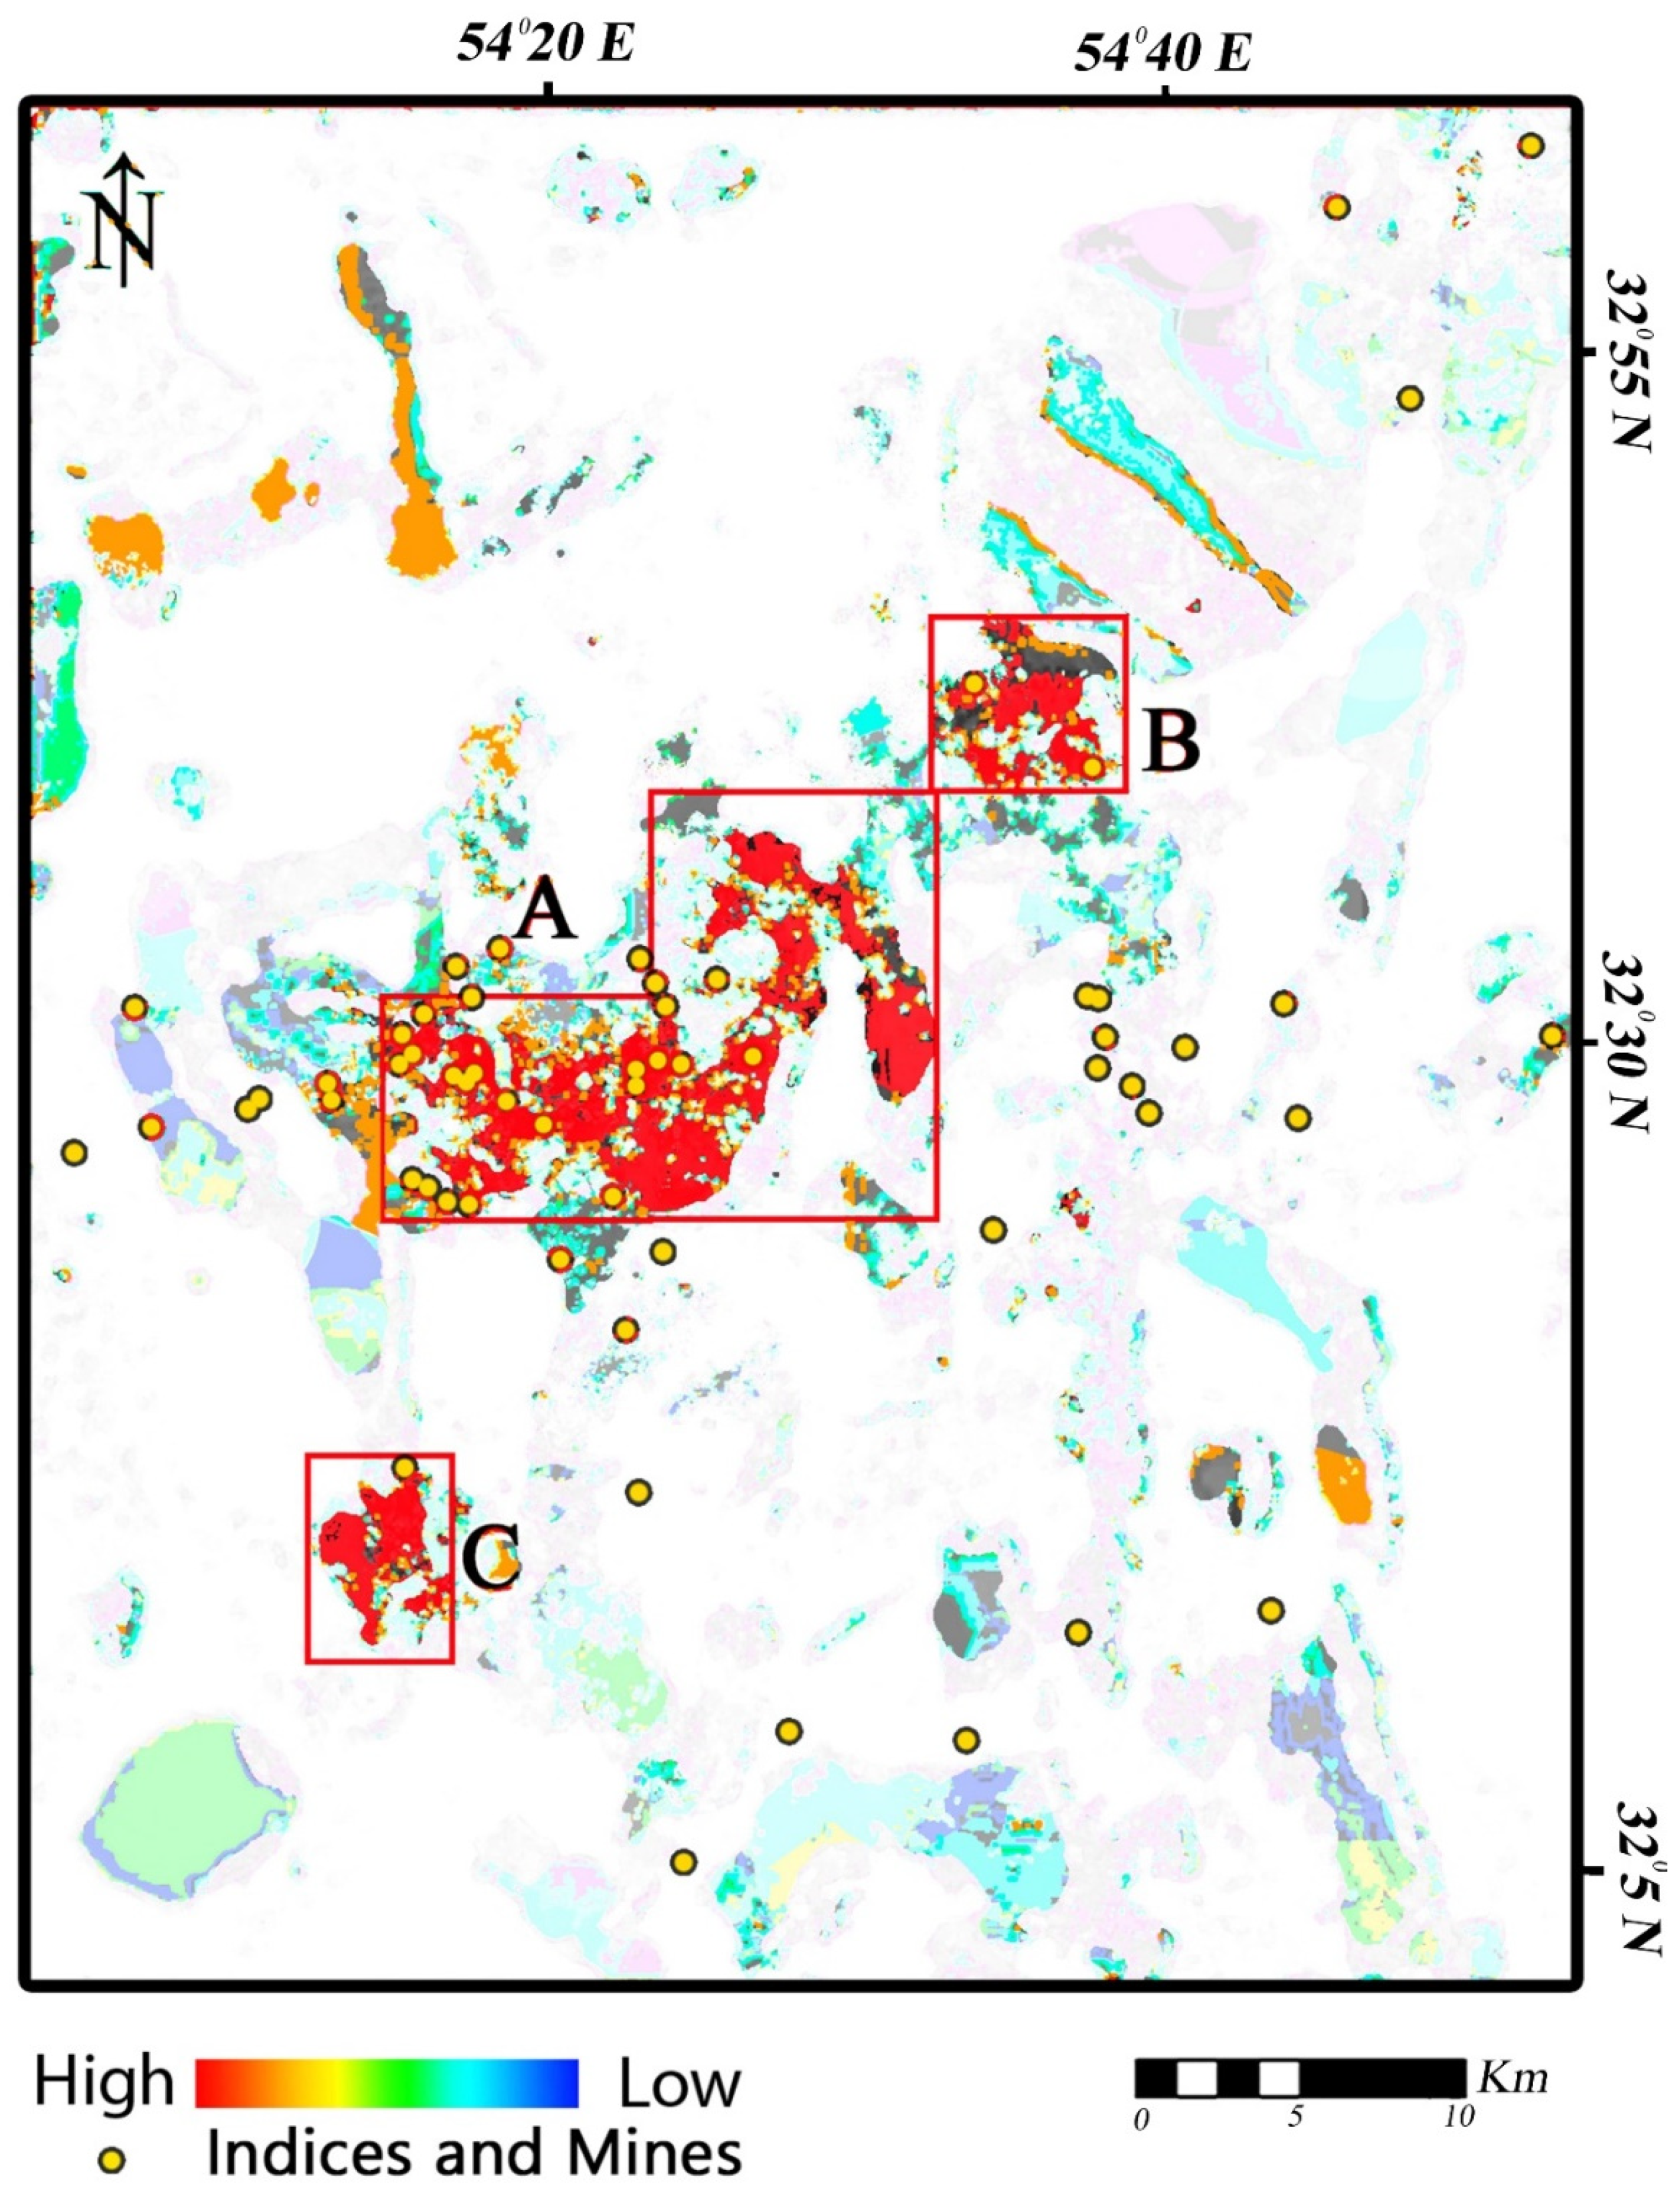
Figure 10 shows the potential map for the study area derived from the fuzzy logic model. Three high potential zones (A–C) were identified, which were typically placed in the central and southwestern parts of the study area (
Figure 10). Most of the documented mineralization precincts in the study area are located in high potential zones.
The multi-class overlap index method was also applied to the exploratory/information layers. To analyze the status of the lineaments and the role of these layers in the mineralization, they were classified into six groups according to the attributes in
Table 3. Intrusive masses (detected using aerial magnetometry) were classified into four classes and scored (
Table 4). Furthermore, the maps obtained from remote sensing (alteration minerals) were prepared in two classes. The scoring of the layers was implemented based on previous studies [
36,
40] and expert’s opinion. The areas containing iron oxide/hydroxides and hydroxyl-bearing (Al-OH) alteration and carbonates were given a score of 10, and the other points were given a score of zero. The characteristics of rock units and their relationship with ore mineralization in the study area were also assumed.
Table 5 shows geological layer classification for integration by multi-class index overlap method.
For implementing the multi-class overlap index method, the iron oxide/hydroxides layer was assigned the highest weight of 8 (i.e., 8 out of 10), the importance of the fault layer was weighted at 6, and the layer of intrusive masses was given the weight of 5, the geological layer and the type of principal rocks (rhyolite granite, etc.) were weighted at 3, respectively. Finally, the hydroxyl-bearing (Al-OH) and carbonates alteration layer was weighted at 1. After weighting the exploratory layers, these layers were fused using the multi-class index overlap method, and a potential map was generated for the study area (
Figure 11). In this map, six high potential zones (A–E) were identified, which were mostly located in the central, southwestern, and northeastern part of the study area (
Figure 11). Several documented mineralization points were delineated in the high potential zones that were identified using the multi-class index overlap method. The analysis of mineral potential maps derived from the fuzzy logic model and the multi-class index overlap method shows that the central and southwestern parts might be high prospective zones for the next stage of the mineral exploration campaign. The mineral potential map derived from the multi-class index overlap method shows more (high to moderate) mineral potential zones in the study area compared to the fuzzy logic model outputs (see
Figure 10 and
Figure 11). The zones of C and E were only found as high potential zones in the multi-class index overlap method output (see
Figure 11). It might show that the mineral potential map derived from the multi-class index overlap method is more sensitive to mineral exploration factors by considering uncertainty and predicting intervention.
4.4. Geology and Fieldwork Results
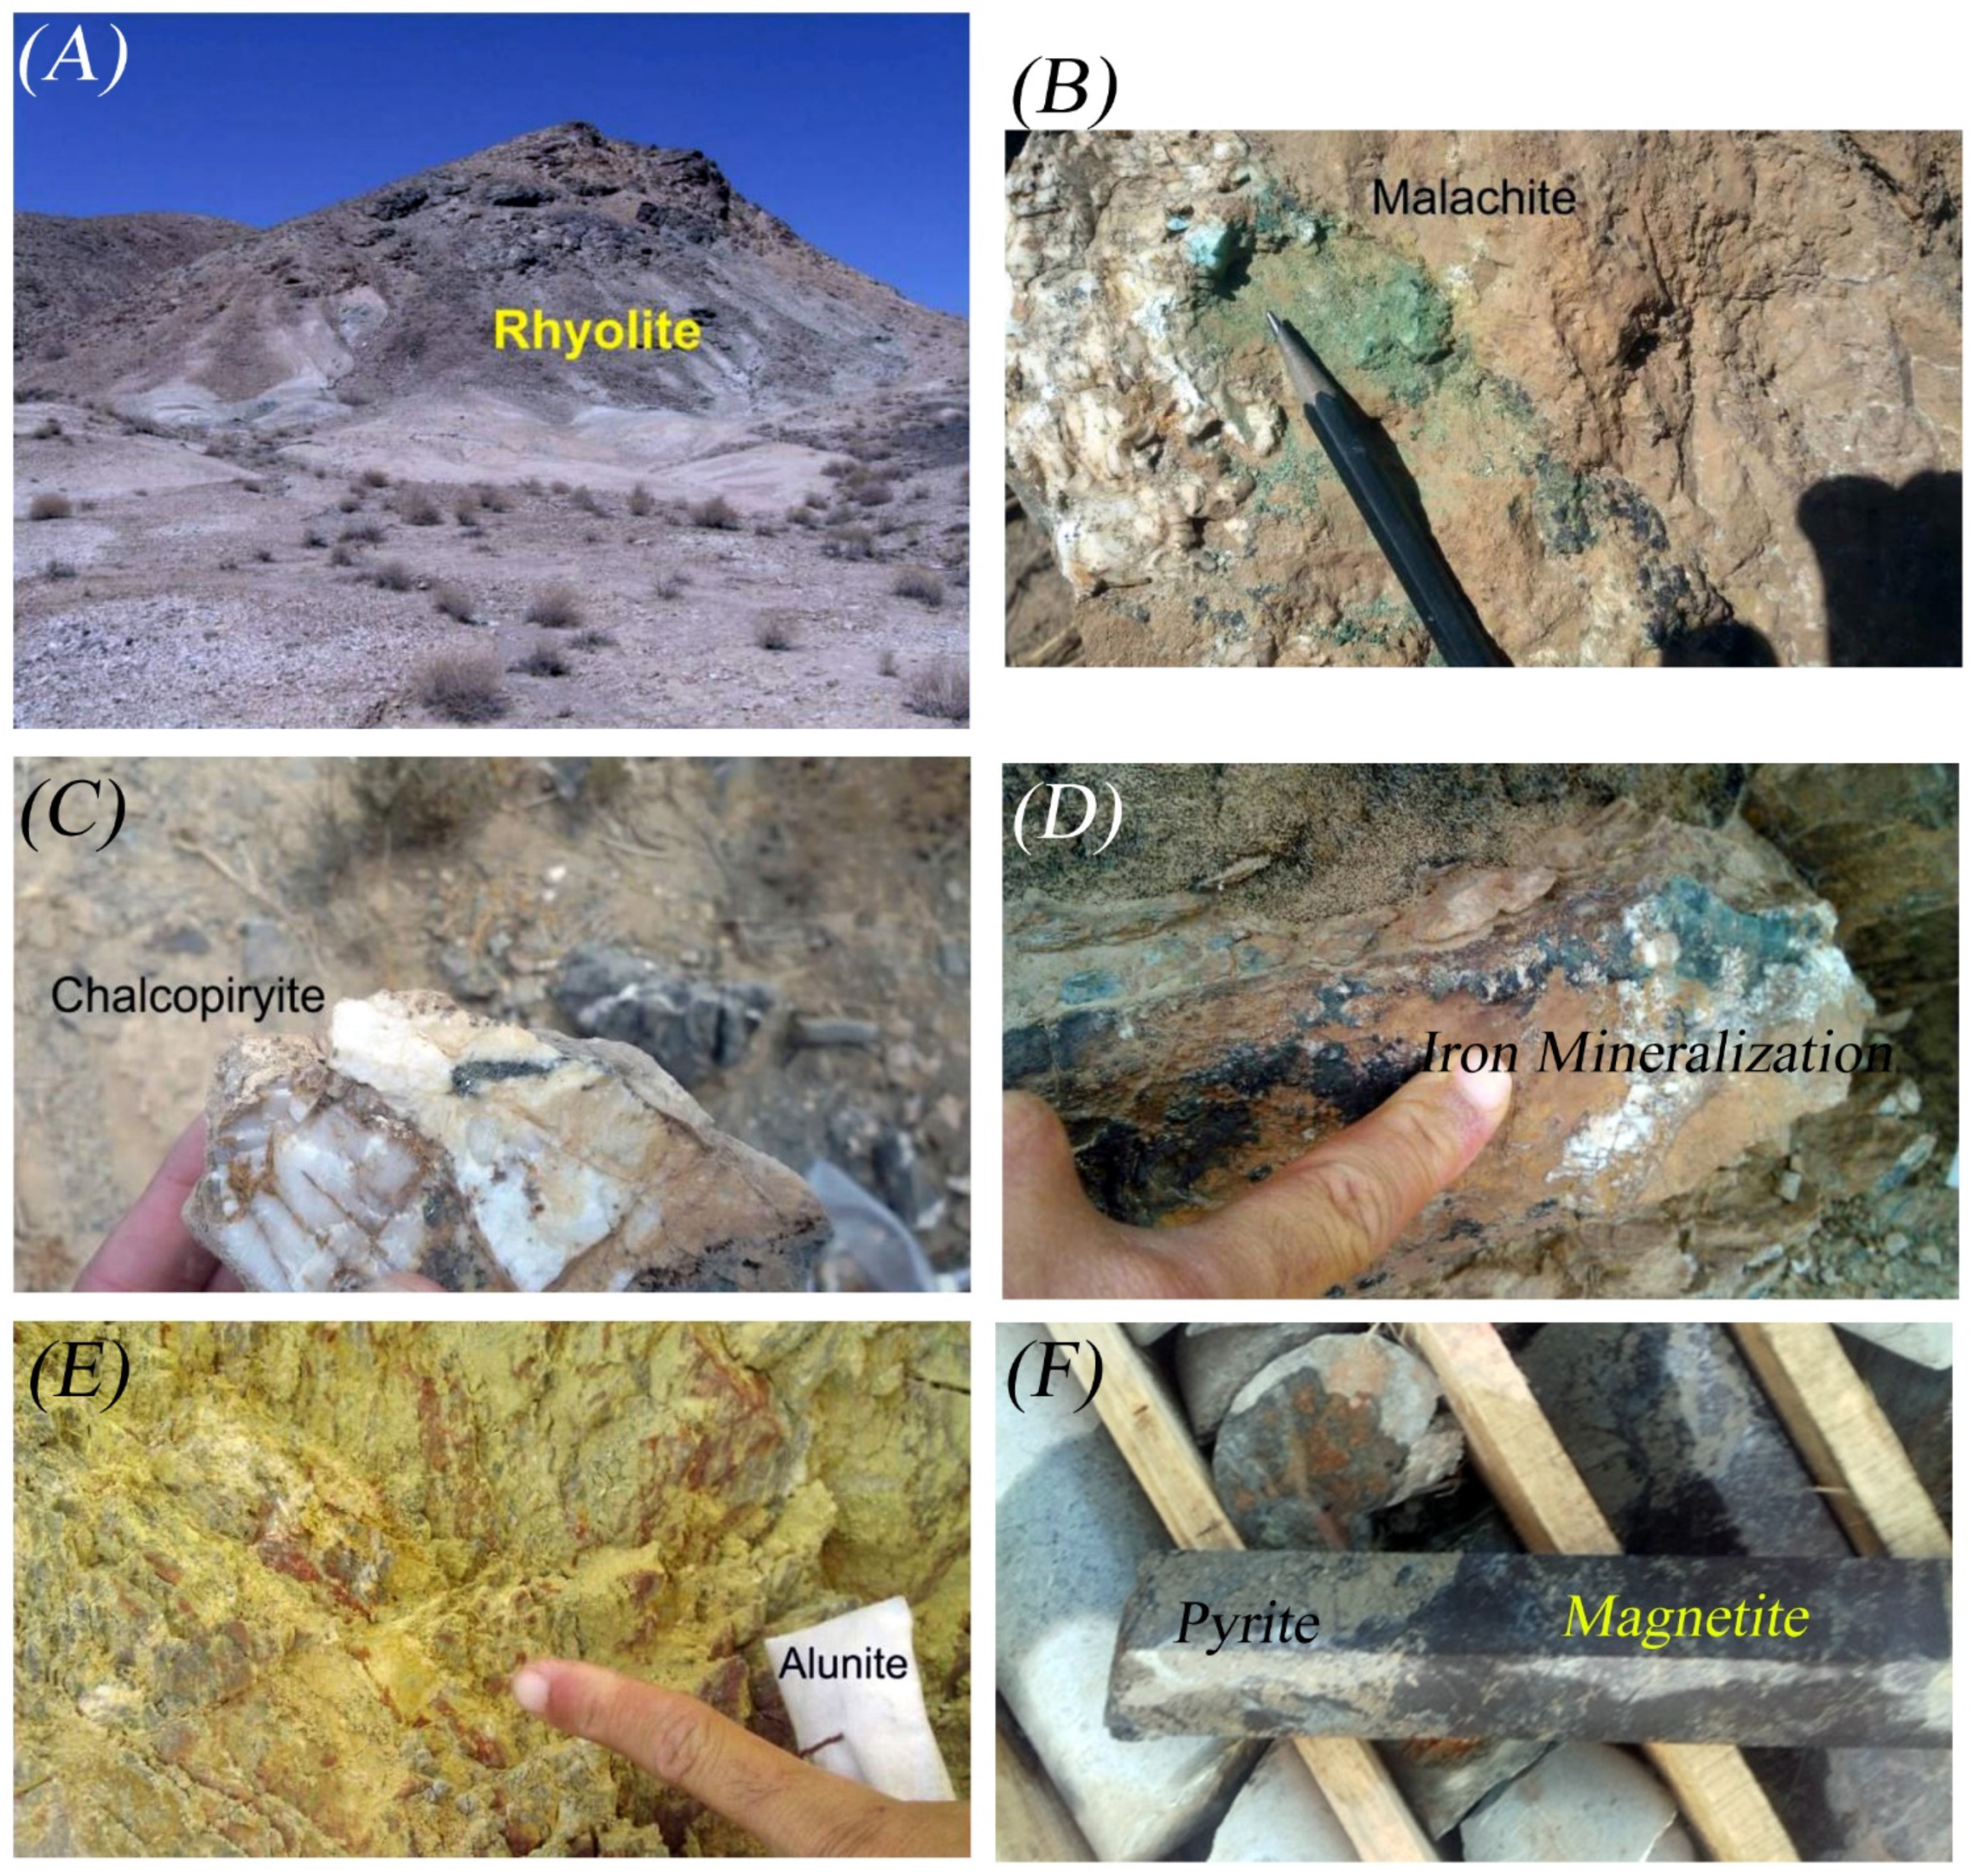
The general trend of mineralization in the region is controlled by geological structural features. Mineralization in the study area consists of copper, iron, barite veins, kaolinite, and lead, which are locally mined. Mineralization zones and hydrothermal alterations in the study area were checked during fieldwork. One of the potential zones contains iron mineralization, which is hosted in a volcano-sedimentary unit (Rizo Formation). Rhyolitic tuffs comprise the alterations zones associated with red iron oxides and feldspars. The altered rhyolites are red in areas with high amount of iron oxides, whereas they are white in areas with high content of feldspars (
Figure 12A). Rhyolitic tuffs are intruded by andesitic dykes with a thickness of 5 to 10 m.
Copper mineralization veins were found with dolomitic units in the central and eastern parts of the study area. These copper veins are formed along the fractures and faults of the host rock. Malachite and chalcopyrite, which were found as the surface expression of copper mineralization, belong to the oxidation zone (
Figure 12B,C). Therefore, the possibility of an enriched mineral zone or supergene zone at the lower level of the veins is feasible. Iron oxide veins and lenses were found in the rhyolites. The thickness of these lenses reached 10 m, and their length reached 30 m. Iron mineralization also replaced dolomites, and it was found as interlayer within rhyolites and acidic tuffs (
Figure 12D). Both the presence of alunite and jarosite in the study area and the secondary iron oxides (goethite and limonite) indicate acid leaching (
Figure 12E). Based on the drilling boreholes up to an average depth of 13 m, there are argillic and propylitic alterations, followed by phyllic and potassic alterations and metal mineralization zones. Pyrite and magnetite mineralization are observable in the cores (
Figure 12F).
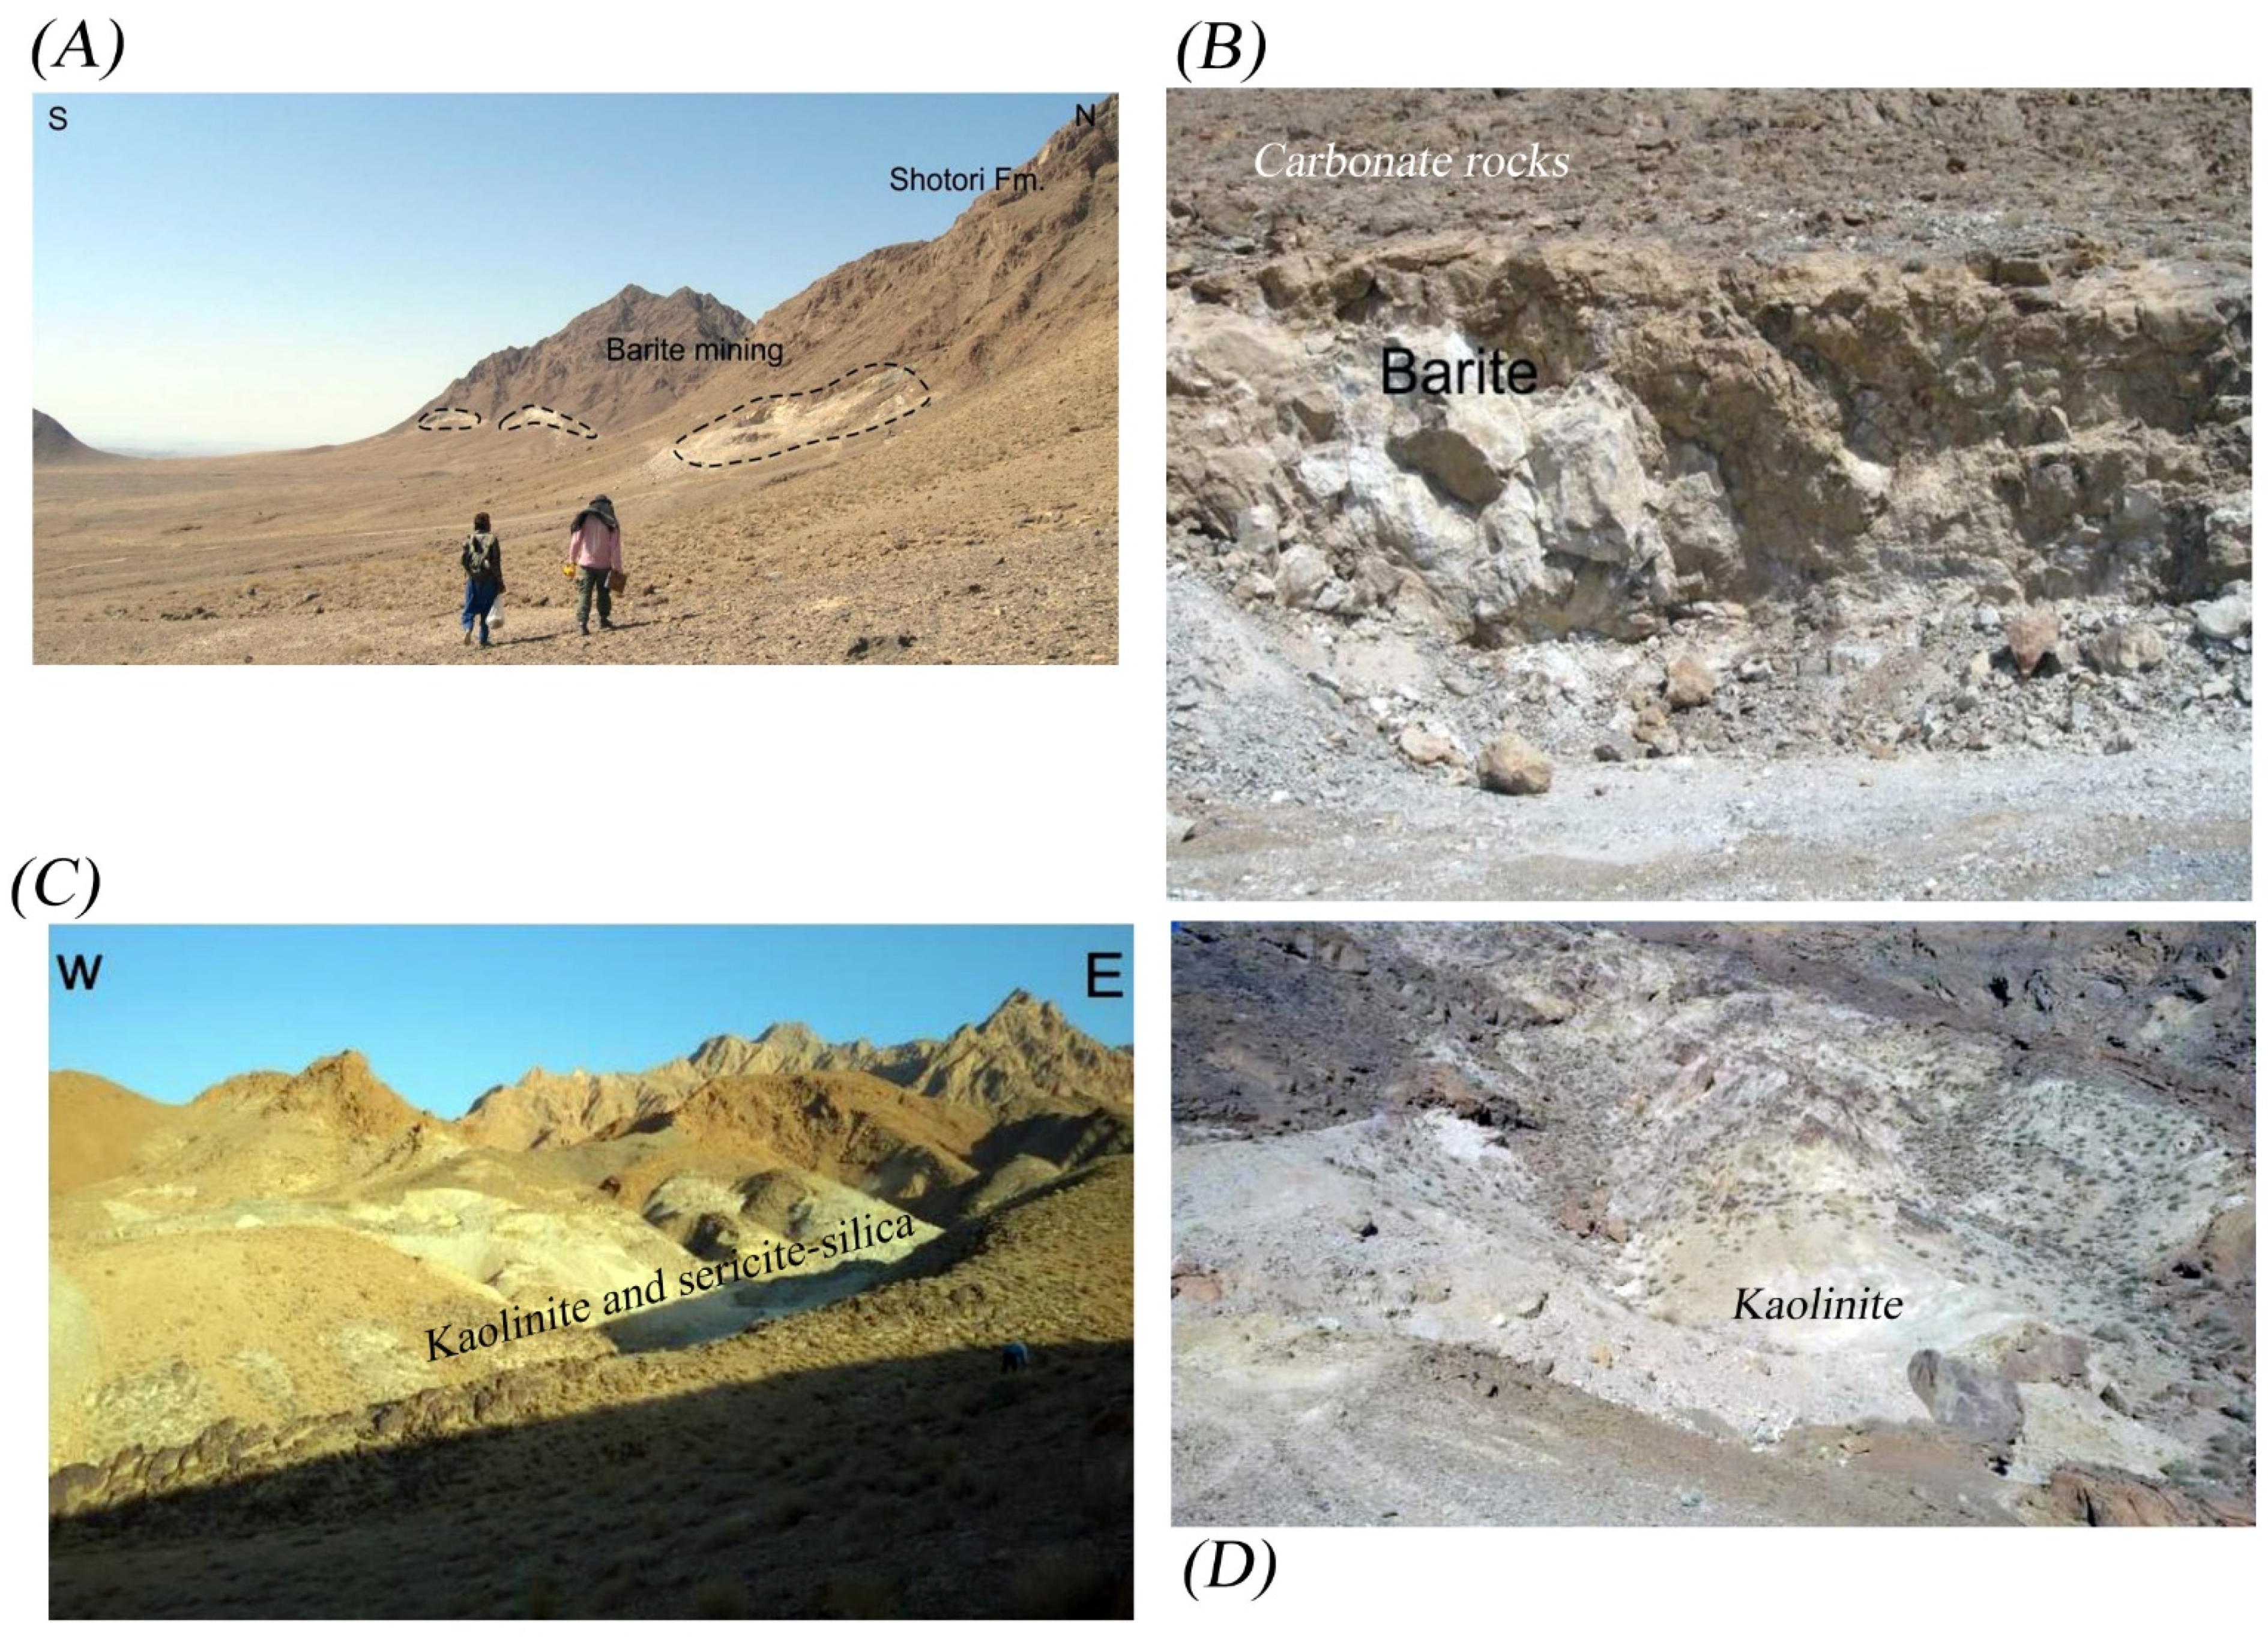
Moreover, lenticular bodies, thin and scattered veins of barite, are hosted in the Paleozoic sedimentary rocks. The thickness of the lenticular bodies and veins is up to several centimeters and their length in some cases reaches 30 m (
Figure 13A). Barite veins, filled along the main fractures and faults, are found within carbonate rocks (
Figure 13B). Surface expression of the argillic alteration zone, as industrial soil mine (kaolinite) and sericite-silica veins associated with the mineralization of pyrite and galena, were found in many parts of the study area (
Figure 13C,D).
A confusion matrix (error matrix) and kappa coefficient [
46,
47,
48] were calculated for the mineral potential maps versus field data. The comparison of the mineral potential maps with field data using a confusion matrix approach and the kappa coefficient shows a very good match, which indicates the overall accuracy of 73% and the kappa coefficient of 0.60, respectively (
Table 6). The producer’s accuracy (omission error) indicates the number of correct classified samples of a class (X) that is divided by the total number of reference samples of class (X) (column total). The resulting percentage accuracy indicates the probability that a reference (ground) sample will be correctly classified. The user’s accuracy (commission error) shows the number of correctly classified samples of class (X) are divided by the total number of samples that were classified in class (X) (row total). The resulting percentage accuracy is indicative of the probability that a sample from the classified image/map represents that class on the ground [
47]. The highest producer’s accuracy (80%) was obtained for the high potential class and the highest user’s accuracy (93%) was achieved for the low potential class. It shows less possibility of confusion between the high potential class and low potential class. For the moderate potential class, the producer’s accuracy, and user’s accuracy both were 65% (
Table 6). It might indicate that the moderate potential class has the capability to be confused with the high or low potential classes. Looking at the user’s accuracy for all classes shows that the possibility of confusion between the high potential (66%) and moderate potential (65%) classes is more feasible compared to the low potential class (93%) (
Table 6).


 ,
, 


