Technical Note

Investigating the Performance of Carbon Monoxide and Methane Observations from Sentinel-5 Precursor in China

1
Information Materials and Intelligent Sensing Laboratory of Anhui Province, Institutes of Physical Science and Information Technology, Anhui University, Hefei 230601, China
2
School of Environmental Science and Optoelectronic Technology, University of Science and Technology of China, Hefei 230026, China
3
Key Laboratory of Environmental Optics and Technology, Anhui Institute of Optics and Fine Mechanics, HFIPS, Chinese Academy of Sciences, Hefei 230031, China
4
State Environmental Protection Key Laboratory of Sources and Control of Air Pollution Complex, Beijing 100084, China
5
Institute of Atmospheric Physics, Chinese Academy of Sciences, Beijing 100029, China
6
Department of Precision Machinery and Precision Instrumentation, University of Science and Technology of China, Hefei 230026, China
7
Center for Excellence in Regional Atmospheric Environment, Institute of Urban Environment, Chinese Academy of Sciences, Xiamen 361021, China
*
Author to whom correspondence should be addressed.
Remote Sens. 2022, 14(23), 6045; https://doi.org/10.3390/rs14236045
Submission received: 31 October 2022 / Revised: 23 November 2022 / Accepted: 28 November 2022 / Published: 29 November 2022

Abstract

:
Since its launch on 13 October 2017, the TROPOspheric Monitoring Instrument (TROPOMI) on board the Sentinel-5 Precursor (S5P) mission has been measuring the solar radiation backscattered by Earth’s atmosphere and surface. In this study, we evaluate the TROPOMI operational methane (CH4) and carbon monoxide (CO) products’ performance results covering about 3 years using the only two global Total Carbon Column Observing Network (TCCON) sites in China, i.e., the Hefei site and the Xianghe site. These two sites have recently joined the TCCON, and this study uses the both sites simultaneously to validate the TROPOMI products over China for the first time. We found that the systematic bias with rescaling between the TROPOMI CO products and the Hefei site is on average 1.78 ± 6.35 ppb or 1.18 ± 5.35%. The systematic bias with rescaling between the TROPOMI CO products and the Xianghe site is on average 5.33 ± 14.24 ppb or 3.85 ± 10.30%. Both the stations show a correlation above 0.9. The TROPOMI CO data are systematically higher than the two TCCON sites measurements in China. We found that the systematic bias with rescaling between the TROPOMI CH4 products and the Hefei site is on average −4.13 ± 11.65 ppb or −0.22 ± 0.62%. The systematic bias between the TROPOMI CH4 products and Xianghe site is on average −7.25 ± 10.72 ppb or −0.39 ± 0.57%. Both the stations show a correlation above 0.9. The TROPOMI CH4 data are systematically lower than the two TCCON sites measurements in China. We found that the bias between the TROPOMI and the two sites’ data as a function of the coincident radius around the two sites is mostly affected by localized emissions for both CO and CH4. We also observe a CO decreasing trend and a CH4 increasing trend in the year-to-year relative changes from 2019 to 2021. Validating against reference from Hefei and Xianghe TCCON site demonstrates the high quality of TROPOMI CO and CH4 data over China.

1. Introduction

Launched in 2017, the TROPOMI onboard the S5P satellite maps atmospheric carbon monoxide (CO) and methane (CH4) column data, initially providing a spatial resolution of 7 × 7 km2 and later increasing the resolution to 7 × 5.6 km2 [1]. The TROPOMI measurements provide new opportunities for the monitoring of natural and anthropogenic CO and CH4 emission sources and sinks thanks to the high radiometric performance and daily worldwide coverage [2,3,4,5,6].
Atmospheric CO is an important trace gas and one of the key atmospheric pollutants in urban or industrial regions. Incomplete combustions from traffic, industrial processes, and residential and biomass burning are the main sources of CO, which determine the atmospheric concentration of CO [7,8]. The major atmospheric sink of CO is largely destruction through the reaction with the atmospheric hydroxyl radical (OH) [9]. Therefore, CO is regarded as an indirect greenhouse gas. As one of the most critical atmospheric pollutants, CO not only plays a vital role in atmospheric chemistry, e.g., it controls the abundance and distribution of OH radicals, but also threatens human life and health. With a low concentration of ~80 ppb in the background atmosphere and a long residence time of several weeks to months [10], CO is established as a key tracer for atmospheric pollution transport and can be used for emission estimation from pollution point sources [9,10].
The most significant anthropogenic greenhouse gas after carbon dioxide is methane. The global warming potential of CH4 is about 28 times larger than carbon dioxide over one hundred years [11,12]. Equally significant is CH4′s atmospheric chemistry, which reacts with and regulates the number and distribution of OH radicals, giving the gas an atmospheric lifetime of around 9 years. The atmospheric concentration of CH4 is controlled by emissions from anthropogenic sources such as livestock, oil and gas systems, coal mining, landfills, wastewater treatment, and rice farming [13]. Reduced methane emissions have the potential to reduce global greenhouse warming because of its short lifetime [14].
Continuously taking precise and accurate global measurements of CO and CH4 is essential for the long-term monitoring and use of these gases in order for the inferred surface fluxes to be correctly constrained by inverse models [15]. In the initial validation stage, the TROPOMI CO product is verified to be in good agreement with the TCCON measurements at nine selected observation sites with a small bias of 6.0 ppbv and 1-σ standard deviations (STD) of 3.90 and 2.40 ppbv for clear sky and cloudy measurement scenarios, respectively. Meanwhile, the TROPOMI CO product also agrees well with the European Centre for Medium-Range Weather Forecasts Integrated Forecasting Systems (ECMWF-IFS) analysis data [16]. The high quality of TROPOMI CO and CH4 products are further consolidated in the latest validation study by [15]. Over China, there have been reports of significant uncertainties in CO estimates obtained from MOPITT [17,18] found that the largest biases in column-averaged dry-air mole fraction of CH4 between GOSAT (the Greenhouse Gases Observing Satellite) and the global chemistry transport model TM5 (Tracer Model 5, version TM5-chem-v3.0) are up to 3% over China due to limited coverage of in situ observations available for the validation and inconsistency in the potential emission scenario. The performance evaluation of the TROPOMI CH4 and CO products is the primary topic of this work, which involves validating the total columns of these products using reference data from two TCCON sites in China. The Hefei site is used as a reference for TROPOMI validation for the first time. Based on about three years of TROPOMI data, the prerequisites for systematic and random error of the CO and CH4 products are examined, and potential explanations are provided.
This study shows the TROPOMI CO and CH4 products’ performance in China. Section 2 describes the dataset and usage criteria and Section 3 gives the details of the validation by the two ground-based (g-b) Fourier-Transform Infra-Red (FTIR) Spectrometer measurements (Hefei site and Xianghe site). Section 4 summarizes our results and conclusions.

2. Materials and Methods

2.1. S5P Carbon Monoxide and Methane Dataset

The TROPOMI CO and CH4 products used in the present work cover about three years of Sentinel-5 Precursor (S5P) operations including the commissioning phase lasting until April 2018. The S5P operations scenario improved the spatial resolution of the measurements with satellite nadir geometry along the track from 7 km × 7 km to 7 km × 5.6 km since August 2019.
The TROPOMI retrieves CO total column from nominal Earth radiance and solar irradiance observations in the 2.3 μm spectral range. The total columns of CO together with the interfering gases, effective optical thickness and cloud height are retrieved using the Shortwave Infrared Carbon Monoxide Retrieval (SICOR) algorithm [19]. In this work, we use the Near Real Time (NRTI) and Offline (OFFL) timeliness data products, which provide CO total column Level 2 data products (https://sentinel.esa.int/documents/247904/3541451/Sentinel-5P-Carbon-Monoxide-Level-2-Product-Readme-File, last accessed 1 October 2022). The SICOR algorithm scales the a priori profiles iteratively to produce modelled spectra until the measured spectrum is best fitted by the modelled spectrum [19]. By considering atmospheric scattering and interfering absorption in the forward model, the SICOR algorithm allows the retrieval of CO total column together with the interfering gases of H2O, HDO, and CH4 and the effective optical thickness and cloud height. A detailed description of the algorithm settings and implementation can be found in [19]. The SICOR algorithm kept some observations taken in low-level cloudy conditions which increased the number of available observations without decreasing the ability of detecting small-scale sources. The SICOR algorithm uses the a priori profiles of CH4 from TM5 model simulations to determine effective cloud information from the shortwave infrared spectra. An error in these effective cloud properties used for atmospheric scattering and light path adjustments can eventually propagate into the CO retrieval. For the TROPOMI CO products, we establish specific criteria to eliminate the outliers. The study only included measurements that met the following criteria: For measurements under clear-sky conditions (over land), an aerosol optical thickness (τaer) of less than 0.5 and a cloud height (zcloud) of less than 500 m should be used; for measurements under low-cloud atmospheric conditions (over land and ocean), an aerosol optical thickness (τaer) of larger than 0.5 and a cloud height (zcloud) of less than 5 km should be used [16]. Furthermore, the most westward pixels were masked due to unresolved calibration issues [18]. The columnar CO data obtained from the TROPOMI L2 product consisted of stripes occurring in the flight direction. These stripe patterns are deemed erroneous (<5%) [16,18]. It was noted that the false elongated pattern of the stripes could hamper the plume detection, therefore we corrected this by applying a median filter as suggested by [20]. The precision requirement for TROPOMI CO product is <10% and the accuracy requirement is <15%.
The TROPOMI retrieves column averaged dry-air mole fraction (XCH4) using nominal Earth radiance and solar irradiance observations in the 2.3 and 0.7μm spectral range from the shortwave infrared (SWIR) and near-infrared (NIR) band by the RemoTeC full-physics algorithm [21,22]. The global budget of sources and sinks of CH4 depends critically on the precision and accuracy of the satellite measurements. In this work, we use the TROPOMI CH4 Level 2 data available from the Offline (OFFL) and Near Real Time (NRTI) timeliness products. The current TROPOMI CH4 products only allow processing of the cloud free measurements over land. For all TROPOMI CH4 products, we establish specific criteria to eliminate the outliers as recommended by the product file (https://sentinel.esa.int/documents/247904/3541451/Sentinel-5P-Methane-Product-Readme-File, last accessed 1 October 2022). The study only included measurements that met the following criteria: for clear-sky observation conditions (over land), measurements are performed with solar zenith angle less than 70°, viewing zenith angle less than 60° and surface albedo larger than 0.02. The precision requirement for TROPOMI CH4 product is <1% and the accuracy requirement is <1.5%.

2.2. Ground-Based FTIR Dataset

A network of ground-based Fourier-Transform Infra-Red (FTIR) spectrometers known as the Total Carbon Column Observing Network (TCCON) collect direct sunlight spectra in the near-infrared band. Column-averaged abundances of CO2, CH4, N2O, HF, CO, H2O, and HDO are accurately and precisely retrieved and recorded from the region. For each species, a specific scaling factor is applied to tie the measurements to the World Meteorological Organization (WMO) in situ scale [23]. In this study, we compare the TCCON XCO and XCH4 data from two FTIR measurements at Hefei and Xianghe with the TROPOMI to investigate the performance of the TROPOMI in China. Accurate and precise TCCON XCO and XCH4 products are retrieved in the NIR spectra by using the GGG2020 (the current standard TCCON retrieval code) retrieval code. A non-linear least-squares fitting algorithm (GFIT), the conversion from the interferogram to spectra with the DC correction, and a post-correction to scale XCO and XCH4 to the WMO standards are all included in the GGG2020 retrieval code (https://tccon-wiki.caltech.edu/Main/DataDescriptionGGG2020 (last accessed: 1 September 2022)), which is an update from the previous version GGG2014. The Xianghe site (39.8N, 116.96E, 36 masl) is situated at the Xianghe Observatory of the Whole Atmosphere, Institute of Atmospheric Physics, Chinese Academy of Sciences, which is about 50 km southeast of Beijing. More information about the Xianghe FTIR site is available from [24,25]. The Hefei site (31.9N, 117.17E, 30 masl) is operated by the institutes of Optics and Fine Mechanics, Chinese Academy of Sciences, which is situated in the western suburbs of central-eastern Chinese city of Hefei. More detail about the Hefei FTIR site can be found in [26,27]. Similarly to the SICOR algorithm, GFIT is also based on a scaling scheme which scales the a priori profiles iteratively to produce modelled spectra until the measured spectrum is best fitted by the modelled spectrum. Retrieval spectral windows together with the interfering gases for NIR retrievals follow the standard conventions of TCCON (https://tccon-wiki.caltech.edu/Main/DataDescriptionGGG2020 (last accessed: 1 September 2022)). The retrieval errors for the TCCON XCO time series are less than 4% and decrease with SZA. The retrieval errors for the TCCON XCH4 time series are below 0.5 % for SZAs below 85°. The public TCCON data are available via https://tccondata.org/ (last accessed: 1 September 2022).

2.3. Validation Methodology

Here, the comparisons between TROPOMI and g-b FTIR XCO/XCH4 datasets are performed on a daily basis. In order to minimize the difference in space-time, we use TROPOMI data co-located with the FTIR sites within a radius of 20 km from the same day, and the average for FTIR products is conducted from 11:00 to 15:00 local time (LT), that is within ±2 h of TROPOMI overpass time (about 13:00 LT). As the a priori profile and vertical resolution of TROPOMI differ from the FTIR observation, we have performed a smoothing correction before comparison [28]. Firstly, the TROPOMI and FTIR data were adjusted to a common priority to compensate for the contribution to the smoothing equation a priori. The TROPOMI corresponding individual column averaging kernel was then used to reproduce the TROPOMI observations using the FTIR measurements assumed as an estimate of the truth. Finally, the adjusted TROPOMI CO/CH4 data and the smoothed FTIR CO/CH4 data were compared [27].

3. Results

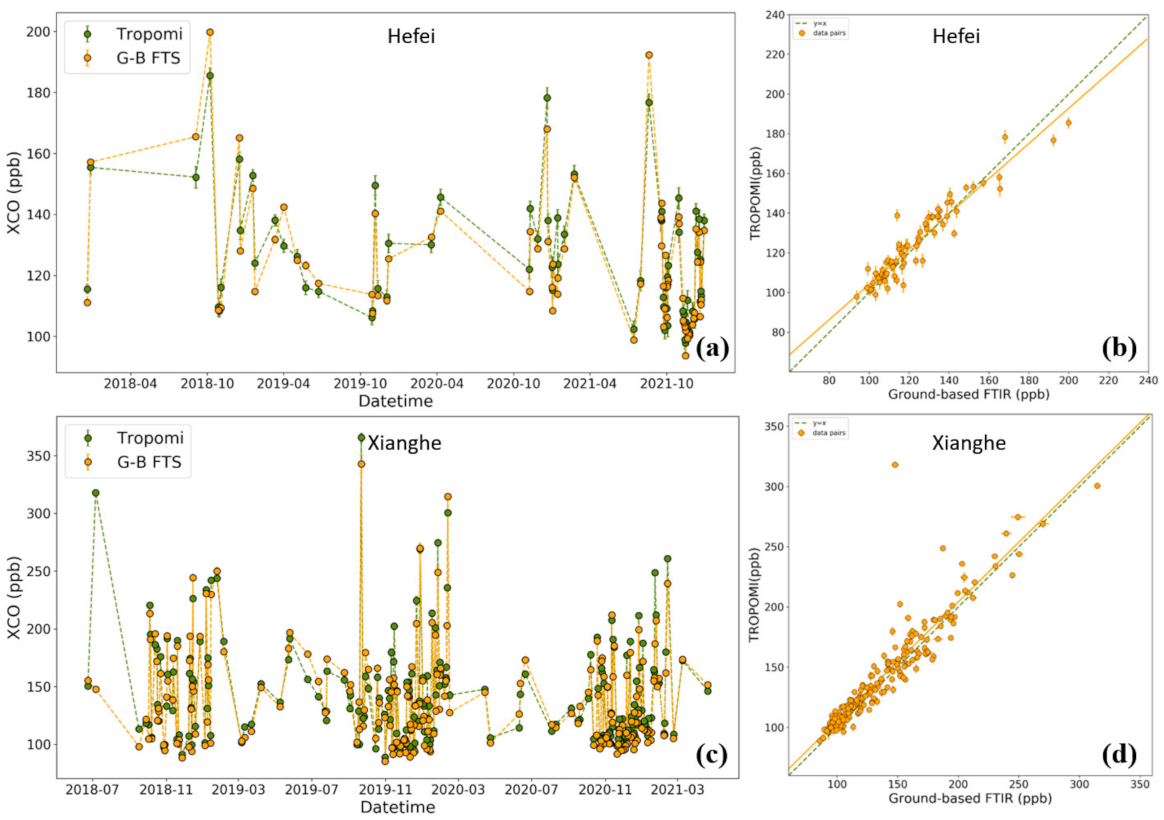
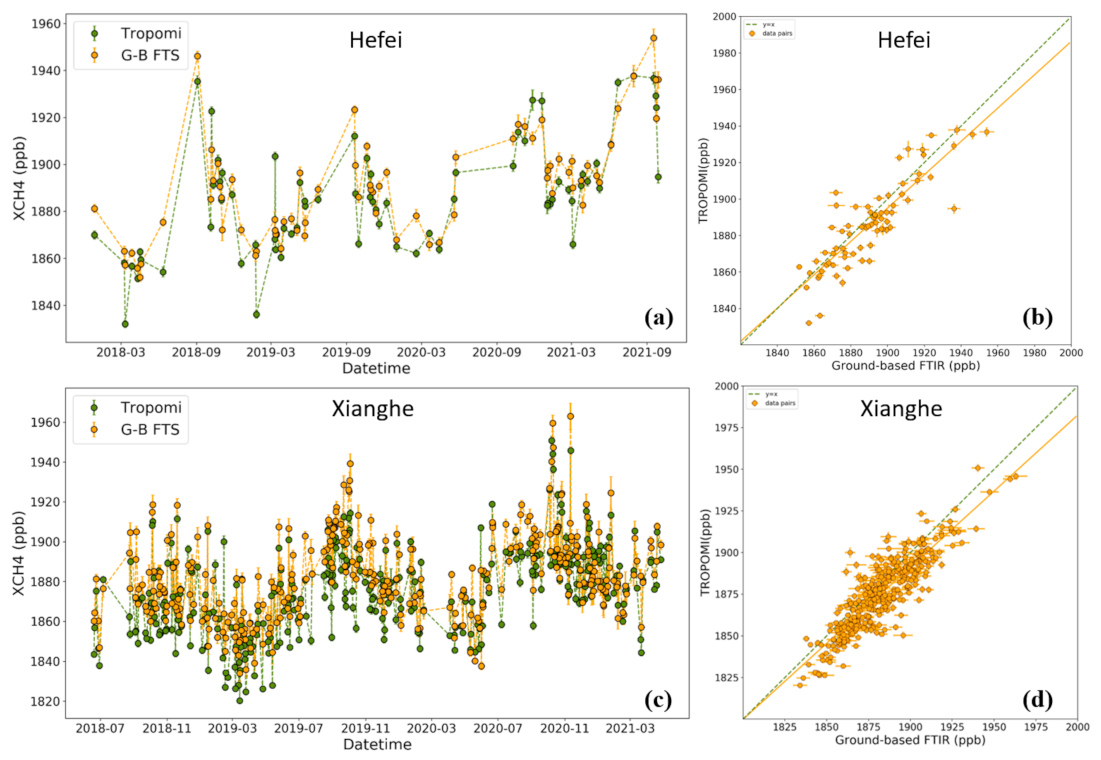
3.1. Validation with TCCON Measurements

The validation of the TROPOMI carbon monoxide observations with two TCCON sites (Hefei and Xianghe) in China is discussed in this section. By restricting the coincident radius to 20 km, the daily mean time series of the TROPOMI XCO data compared with the Hefei and Xianghe site measurements are shown in Figure 1a–d, respectively. For the Hefei site, a peak value on 7 October 2018 was captured by both the TROPOMI and the FTIR observations in Figure 1a, indicating that TROPOMI observations have the potential to capture air pollution accumulation and dissipation process on daily basis. Figure 1b shows the correlation scatter diagram between the TROPOMI and the FTIR data over Hefei based on Figure 1a. The average bias of the TROPOMI XCO data to the FTIR XCO data (TROPOMI–FTIR) is 1.78 ± 6.35 ppb or 1.18 ± 5.35%, which is comparable to the comparisons over other TCCON sites [15,16]. The TROPOMI observations can well reproduce the day-to-day and seasonal variabilities of CO observed by the FTIR with a correlation coefficient of r = 0.97. For the Xianghe site, a peak value on 21 September 2019 was captured by both the TROPOMI and the FTIR observations in Figure 1c, possibly because of the large amount of CO emissions during the joint drill activities (includes fireworks, etc.) for the 70th anniversary of the National Day from 19 September to 23 September 2019. Figure 1d shows the correlation scatter diagram between the TROPOMI and the FTIR data over the Xianghe site based on Figure 1c. The average bias of the TROPOMI data to the FTIR data (TROPOMI–FTIR) is 5.33 ± 14.24 ppb or 3.85 ± 10.30%, which is comparable to the comparisons over other TCCON sites but with a slightly larger STD. The TROPOMI observations over the polluted region can well reproduce the day-to-day and seasonal variabilities of CO observed by the FTIR with a correlation coefficient of r = 0.99.
The validation of TROPOMI methane observations with two TCCON sites (Hefei and Xianghe) in China is discussed in this section. By restricting the coincident radius to 20 km, the daily mean time series of the TROPOMI compared with the Hefei and Xianghe sites for XCH4 are shown in Figure 2a–d, respectively. For the Hefei site, the average bias of the TROPOMI XCH4 to the FTIR XCH4 (TROPOMI–FTIR) is −4.13 ± 11.65 ppb or −0.22 ± 0.62%, which is comparable to the comparisons over other TCCON sites. Figure 2b shows the correlation scatter diagram between the TROPOMI and the FTIR data over Hefei based on Figure 2a. The TROPOMI observations can well reproduce the day-to-day and seasonal variabilities in CH4 observed by the FTIR with a correlation coefficient of r = 0.93. For the Xianghe site, the average bias of the TROPOMI data to the FTIR data (TROPOMI–FTIR) is −7.25 ± 10.72 ppb or −0.39 ± 0.57%, which is comparable to the comparisons over other TCCON sites. Figure 2d shows the correlation scatter diagram between the TROPOMI and the FTIR data over the Xianghe site based on Figure 2c. The TROPOMI observations over the polluted region can well reproduce the day-to-day and seasonal variabilities in CH4 observed by the FTIR with a correlation coefficient of r = 0.95.

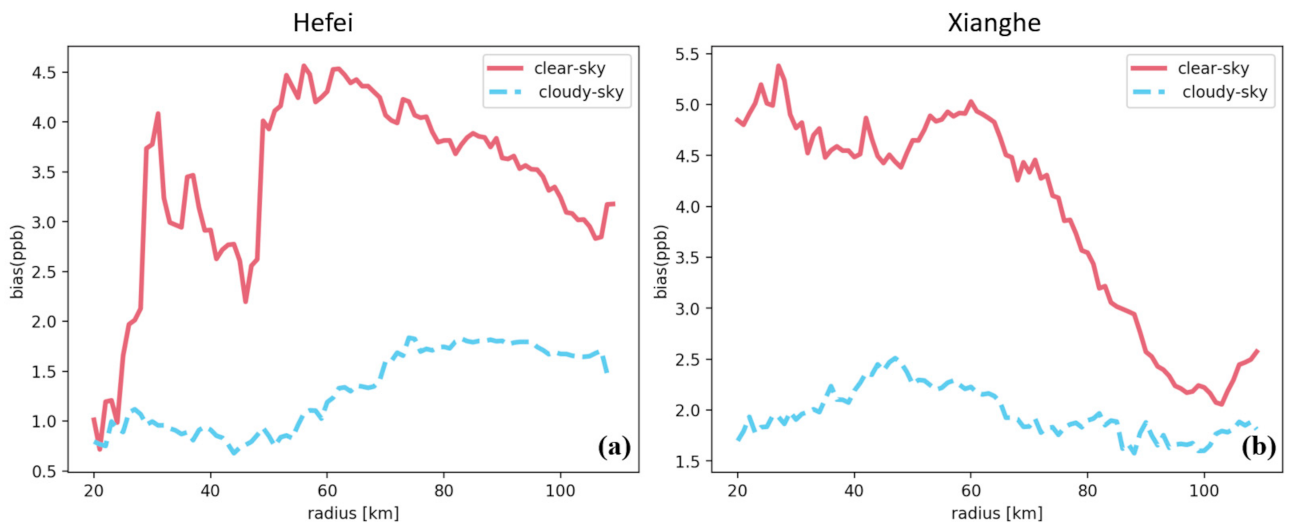
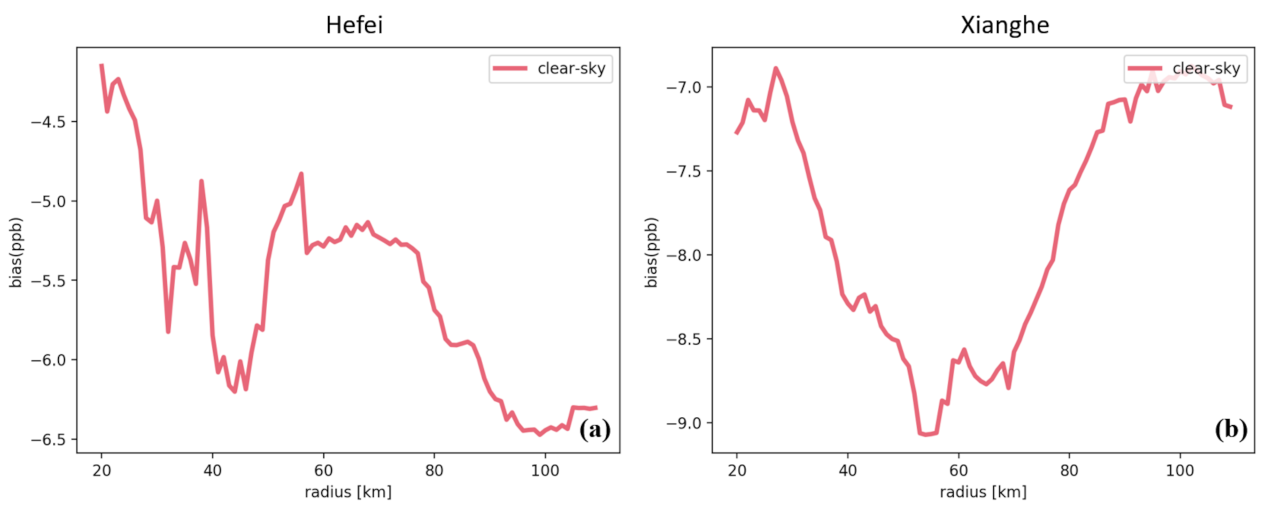
3.2. The Coincident Radius Dependence Relative to TCCON

Furthermore, the bias between the TROPOMI and the FTIR data (TROPOMI–FTIR) as a function of the coincident radius around the observation site for XCO and XCH4 is discussed. Figure 3 shows the bias of XCO between the TROPOMI and the FTIR data (TROPOMI–FTIR) as a function of the coincident radius around the FTIR observation sites for both clear-sky and cloudy conditions, i.e., different spatial coverage of TROPOMI observation relative to the FTIR site are averaged for comparison. We found that the bias between TROPOMI and the FTIR data significantly changes with an increased radius of the coverage for clear sky observations for both Hefei and Xianghe sites, but the bias is kept at ~1% and is independent of the radius for cloudy observations [6] obtained similar results for the polluted FTIR site in Mexico City. In cloudy conditions, the TROPOMI cannot well resolve the CO portion underneath the cloud/aerosol, which results in CO total column lower than in clear condition. By studying the same pollution event for clear-sky circumstances and various cloud heights, the cloudy data can be utilized to analyze the vertical distribution of CO pollution. It reveals how the pollution from cities has been vertically extended into the atmosphere. For both clear sky and cloudy observations, the bias is less than 5% for the coincident radius of less than 100 km. Figure 4 shows the bias of XCH4 between the TROPOMI and FTIR data (TROPOMI–FTIR) as a function of the coincident radius around the observation sites for clear-conditions only. The bias between the TROPOMI and the FTIR data as a function of the coincident radius around the FTIR sites is mostly affected by localized emissions for both XCO and XCH4, which indicates the significance of the spatial resolution of TROPOMI for comparison.

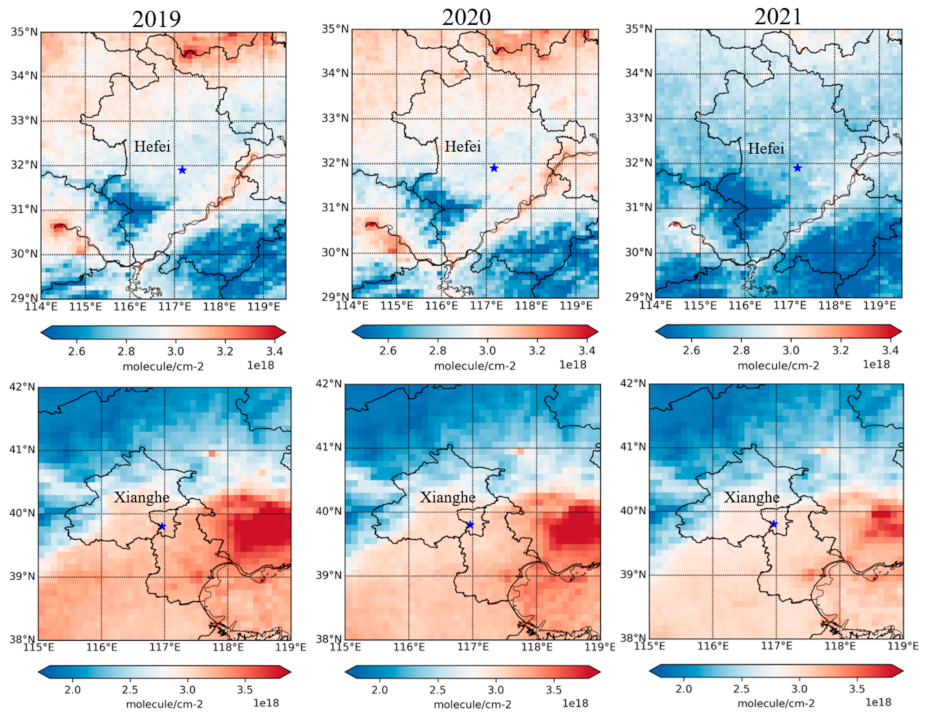
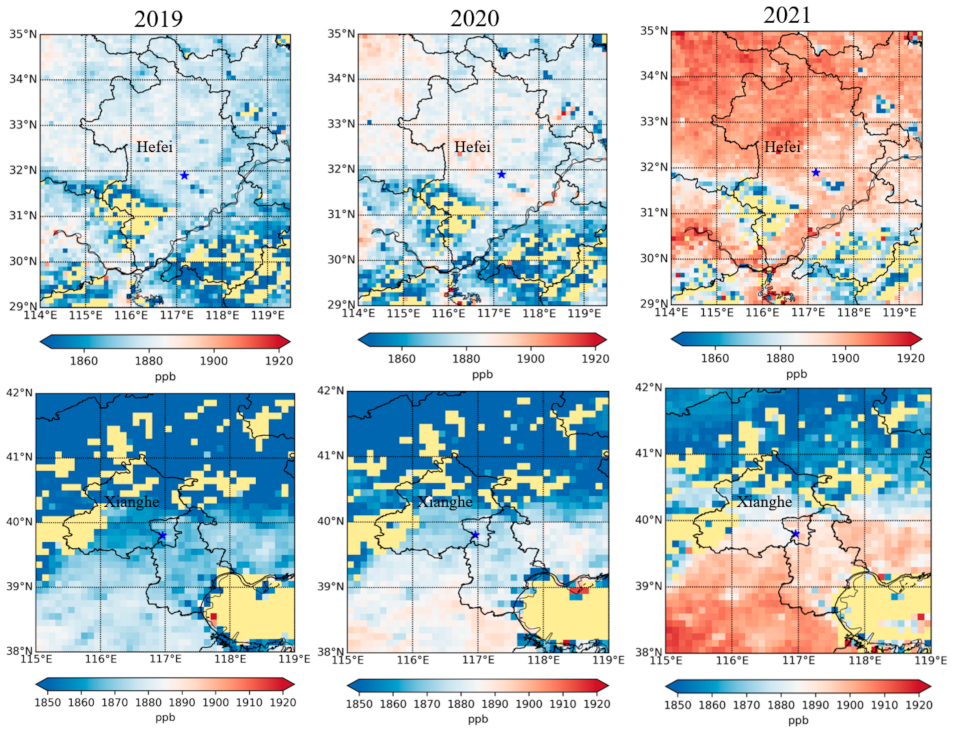
3.3. Distributions and Trends of Annual Means around Sites

In this section, we show the distributions and variations in the annual means of CO total columns and XCH4 around Hefei and Xianghe from 2019 to 2021. The CO level continued to decline since the beginning of the FTIR data records. This is further verified by the TROPOMI data. Figure 5 indicates that the CO total column annual means in 2021 is significantly lower than the last two years. In the present work, the statistical bootstrap resampling method to identify the annual trends and intra-annual variations is implemented. Following [27], we employed a second-order Fourier series along with a linear component to identify the annual trends and intra-annual changes of CO and CH4. Overall, the annual average of CO at the Hefei site showed a decreasing trend of −1.90 ± 1.13% yr−1 during 2015–2021. The annual average of CO at the Xianghe site showed a decreasing trend of −1.61 ± 2.16% yr−1 during 2018–2021. However, the CH4 level continued to increase since the beginning of the FTIR data records. This is further verified by the TROPOMI data shown in Figure 6. The annual average of CH4 at the Hefei site showed an increasing trend of 0.50 ± 0.90% yr−1 during 2015–2021. The annual average of CH4 at the Xianghe site showed an increasing trend of 0.57 ± 1.22% yr−1 during 2018–2021. The year-to-year relative changes of TROPOMI CO total column over Eastern China are −0.26% for 2019–2020 and −4.93% for 2020–2021.The year-to-year relative changes of TROPOMI CH4 total column over Eastern China are 0.28% for 2019–2020 and 0.99% for 2020–2021.

4. Discussion and Conclusions

In this study, we have performed the validation of TROPOMI carbon monoxide and methane products using two TCCON stations (Hefei and Xianghe) in China. The Hefei site is used as a reference for TROPOMI validation for the first time. We found that the systematic bias between the TROPOMI CO products and the Hefei site data is on average 1.78 ± 6.35 ppb or 1.18 ± 5.35%. The systematic bias between the TROPOMI CO products and the Xianghe site data is on average 5.33 ± 14.24 ppb or 3.85 ± 10.30%. The bias and random error of the Beijing site area are both larger than Hefei site but with better correlation. Both the stations show a correlation above 0.9. The TROPOMI CO data are systematically higher than the two TCCON datasets in China. The bias for TROPOMI CO data is well within the mission criteria (systematic error) of 15% and the random error is well below the mission criteria of 10%. We found that the systematic bias between the TROPOMI CH4 products and the Hefei site is on average −4.13 ± 11.65 ppb or −0.22 ± 0.62%. The systematic bias between the TROPOMI CH4 products and the Xianghe site data is on average −7.25 ± 10.72 ppb or −0.39 ± 0.57%. Both of the stations show a correlation above 0.9. The TROPOMI CH4 data are systematically lower than the two TCCON data in China. The bias for TROPOMI CH4 data is well within the mission criteria (systematic error) of 1.5% and the random error is well below the mission criteria of 1%.
Furthermore, the bias between the TROPOMI and TCCON data (TROPOMI–FTIR) as a function of the coincident radius around the observation site for CO and CH4 is discussed. We observed that the TROPOMI cannot well resolve the CO portion underneath the cloud/aerosol condition, which results in the CO total column being lower than the clear conditions. The bias is still less than 5% for the coincident radius of less than 100 km for both clear sky and cloudy observations. By studying the same pollution event for clear-sky circumstances and various cloud heights, the cloudy observations can be utilized to analyze the vertical distribution of CO pollution. It reveals how the pollution from cities has been vertically extended into the atmosphere. We found that the bias between the TROPOMI and FTIR data as a function of the coincident radius around FTIR sites is mostly affected by localized emissions for both XCO and XCH4, which indicates the significance of the spatial resolution of TROPOMI for comparison.
We found that the average annual atmospheric CO total column over the eastern China region exhibited a decreasing trend from 2018 to 2021, which was consistent with the negative trends of the average CO mixing ratios retrieved from two TCCON stations with −1.90 ± 1.13% yr−1 for Hefei and −1.61 ± 2.16% yr−1 for Xianghe. Whereas, the average annual atmospheric CH4 mixing ratios over the northern China region exhibited an increasing trend from 2018 to 2021, which was consistent with the positive trends of the average CH4 mixing ratios retrieved from two TCCON stations with 0.50 ± 0.90% yr−1 for Hefei and 0.57 ± 1.22% yr−1 for Xianghe. We will investigate the systematic deviations between the TROPOMI and FTIR data in further work. The systematic bias is partly due to the different spectral windows and spectroscopic information on absorption line parameters in the TCCON and TROPOMI retrievals. Attention should be paid to these systematic deviations when using TROPOMI CO and CH4 products for quantitative analysis. Validating against reference data from the Hefei and Xianghe TCCON sites demonstrates the high quality of TROPOMI CO and CH4 data for China.

Author Contributions

Y.T. and C.L. conceived and designed the experiments; Y.T. performed the experiments; Y.T., X.H. and C.S. analyzed the data; Y.S., W.W., M.Z. P.W. and P.L. contributed reagents/materials/analysis tools; Y.T. wrote the paper. All authors have read and agreed to the published version of the manuscript.

Funding

This research was funded by the National Natural Science Foundation of China, grant number 42205151 and 41941011, the Natural Science Foundation of Anhui Province, grant number 2008085QD180, the Doctoral Scientific Research Foundation of Anhui University, grant number S020118002/008, the open fund of the Key Laboratory of Environmental Optics and Technology, Chinese Academy of Sciences, grant number 2005DP173065-2019-05.

Data Availability Statement

The public release of TROPOMI CO and CH4 products are available via https://scihub.copernicus.eu/ (last access: 1 April 2022). The public release of TCCON data are available via https://tccondata.org/ (last access: 1 September 2022).

Acknowledgments

We thank the TROPOMI team for providing satellite products. We thank the TCCON team for providing the reference data used for the validation in this study.

Conflicts of Interest

The authors declare no conflict of interest.

References

  1. Veefkind, J.; Aben, I.; McMullan, K.; Förster, H.; de Vries, J.; Otter, G.; Claas, J.; Eskes, H.; de Haan, J.; Kleipool, Q.; et al. TROPOMI on the ESA Sentinel-5 Precursor: A GMES mission for global observations of the atmospheric composition for climate, air quality and ozone layer applications. Remote Sens. Environ. 2012, 120, 70–83. [Google Scholar] [CrossRef]
  2. Tian, Y.; Sun, Y.; Borsdorff, T.; Liu, C.; Liu, T.; Zhu, Y.; Yin, H.; Landgraf, J. Quantifying CO emission rates of industrial point sources from Tropospheric Monitoring Instrument observations. Environ. Res. Lett. 2022, 17, 014057. [Google Scholar] [CrossRef]
  3. Tian, Y.; Liu, C.; Sun, Y.; Borsdorff, T.; Landgraf, J.; Lu, X.; Palm, M.; Notholt, J. Satellite observations reveal a large CO emission discrepancy from industrial point sources over China. Geophys. Res. Lett. 2022, 49, e2021GL097312. [Google Scholar] [CrossRef]
  4. Pandey, S.; Gautam, R.; Houweling, S.; van der Gon, H.D.; Sadavarte, P.; Borsdorff, T.; Hasekamp, O.; Landgraf, J.; Tol, P.; van Kempen, T.; et al. Satellite observations reveal extreme methane leakage from a natural gas well blowout. Proc. Natl. Acad. Sci. USA 2019, 116, 26376–26381. [Google Scholar] [CrossRef] [PubMed]
  5. Borsdorff, T.; de Brugh, J.A.; Pandey, S.; Hasekamp, O.; Aben, I.; Houweling, S.; Landgraf, J. Carbon monoxide air pollution on sub-city scales and along arterial roads detected by the Tropospheric Monitoring Instrument. Atmos. Chem. Phys. 2019, 19, 3579–3588. [Google Scholar] [CrossRef] [Green Version]
  6. Borsdorff, T.; Reynoso, A.G.; Maldonado, G.; Mar-Morales, B.; Stremme, W.; Grutter, M.; Landgraf, J. Monitoring CO emissions of the metropolis Mexico City using TROPOMI CO observations. Atmos. Chem. Phys. 2020, 20, 15761–15774. [Google Scholar] [CrossRef]
  7. Connors, V.S.; Gormsen, B.B.; Nolf, S.; Reichle, H.G., Jr. Spaceborne observations of the global distribution of carbon monoxide in the middle troposphere during april and october 1994. J. Geophys. Res. Atmos. 1999, 104, 21455–21470. [Google Scholar] [CrossRef]
  8. Dekker, I.N.; Houweling, S.; Pandey, S.; Krol, M.; Röckmann, T.; Borsdorff, T.; Landgraf, J.; Aben, I. What caused the extreme CO concentrations during the 2017 high-pollution episode in India? Atmos. Chem. Phys. 2019, 19, 3433–3445. [Google Scholar] [CrossRef] [Green Version]
  9. Spivakovsky, C.M.; Logan, J.A.; Montzka, S.; Balkanski, Y.; Foreman-Fowler, M.; Jones, D.B.A.; Horowitz, L.; Fusco, A.C.; Brenninkmeijer, C.A.M.; Prather, M.J.; et al. Three-dimensional climatological distribution of tropospheric OH: Update and evaluation. J. Geophys. Res. Atmos. 2000, 105, 8931–8980. [Google Scholar] [CrossRef]
  10. Holloway, T.; Levy, H.; Kasibhatla, P. Global distribution of carbon monoxide, Journal of Geophysical Research. Atmospheres 2000, 105, 12123–12147. [Google Scholar] [CrossRef]
  11. Stocker, T.F.; Qin, D.; Plattner, G.-K.; Tignor, M.; Allen, S.K.; Boschung, J.; Nauels, A.; Xia, Y.; Bex, V.; Midgley, P.M. International Panel on Climate Change (2013). In Climate Change 2013: The Physical Science Basis. Contribution of Working Group I to the Fifth Assessment Report of the Intergovernmental Panel on Climate Change; IPCC: New York, NY, USA; Cambridge University Press: Cambridge, UK, 2013. [Google Scholar]
  12. Alvarez, R.A.; Zavala-Araiza, D.; Lyon, D.R.; Allen, D.T.; Barkley, Z.R.; Brandt, A.R.; Davis, K.J.; Herndon, S.C.; Jacob, D.J.; Karion, A.; et al. Assessment of methane emissions from the U.S. oil and gas supply chain. Science 2018, 361, 186–188. [Google Scholar] [CrossRef] [PubMed]
  13. Saunois, M.; Bousquet, P.; Poulter, B.; Peregon, A.; Ciais, P.; Canadell, J.G.; Dlugokencky, E.J.; Etiope, G.; Bastviken, D.; Houweling, S.; et al. The global methane budget 2000–2012. Earth Syst. Sci. Data 2016, 8, 697–751. [Google Scholar] [CrossRef] [Green Version]
  14. International Energy Agency. World Energy Outlook 2017; OECD Publishing: Paris, France, 2017. [Google Scholar]
  15. Sha, M.K.; Langerock, B.; Blavier, J.-F.L.; Blumenstock, T.; Borsdorff, T.; Buschmann, M.; Dehn, A.; De Mazière, M.; Deutscher, N.M.; Feist, D.G.; et al. Validation of methane and carbon monoxide from Sentinel-5 Precursor using TCCON and NDACC-IRWG stations. Atmos. Meas. Tech. 2021, 14, 6249–6304. [Google Scholar] [CrossRef]
  16. Borsdorff, T.; de Brugh, J.A.; Hu, H.; Hasekamp, O.; Sussmann, R.; Rettinger, M.; Hase, F.; Gross, J.; Schneider, M.; Garcia, O.; et al. Mapping carbon monoxide pollution from space down to city scales with daily global coverage. Atmos. Meas. Tech. 2018, 11, 5507–5518. [Google Scholar] [CrossRef] [Green Version]
  17. Liu, D.; Di, B.; Luo, Y.; Deng, X.; Zhang, H.; Yang, F.; Grieneisen, M.L.; Zhan, Y. Estimating ground-level CO concentrations across China based on the national monitoring network and MOPITT: Potentially overlooked CO hotspots in the Tibetan Plateau Atmos. Chem. Phys. 2019, 19, 12413–12430. [Google Scholar] [CrossRef] [Green Version]
  18. Landgraf, J.; de Brugh, J.A.; Borsdorff, T.; Houweling, S.; Hasekamp, O.P. Algorithm Theoretical Baseline Document for Sentinel-5 Precursor: Carbon Monoxide Total Column Retrieval; Sorbonnelaan 2, 3584 CA Utrecht; SRON: Leiden, The Netherlands, 2016; Available online: https://sentinel.esa.int/documents/247904/2476257/Sentinel-5P-TROPOMI-ATBD-Carbon-Monoxide-Total-Column-Retrieval.pdf (accessed on 1 September 2022).
  19. Landgraf, J.; de Brugh, J.A.; Scheepmaker, R.; Borsdorff, T.; Hu, H.; Houweling, S.; Butz, A.; Aben, I.; Hasekamp, O. Carbon monoxide total column retrievals from TROPOMI shortwave infrared measurements. Atmos. Meas. Tech. 2016, 9, 4955–4975. [Google Scholar] [CrossRef] [Green Version]
  20. Landgraf, J.; de Brugh, J.A.; Scheepmaker, R.; Borsdorff, T.; Houweling, S.; Hasekamp, O. Algorithm Theoretical Baseline Document for Sentinel-5 Precursor: Carbon Monoxide Total Column Retrieval. 2018. Available online: https://sentinel.esa.int/documents/247904/2476257/sentinel-5p-tropomi-atbd-carbon-monoxide-total-column-retrieval (accessed on 1 September 2022).
  21. Hasekamp, O.; Lorente, A.; Hu, H.; Butz, A.; de Brugh, J.A.; Landgraf, J. Algorithm Theoretical Baseline Document for Sentinel-5 Precursor Methane Retrieval. 2019. Available online: https://sentinel.esa.int/documents/247904/2476257/Sentinel-5P-TROPOMI-ATBD-Methane-retrieval (accessed on 1 September 2022).
  22. Hu, H.; Hasekamp, O.; Butz, A.; Galli, A.; Landgraf, J.; de Brugh, J.A.; Borsdorff, T.; Scheepmaker, R.; Aben, I. The operational methane retrieval algorithm for TROPOMI. Atmos. Meas. Tech. 2016, 9, 5423–5440. [Google Scholar] [CrossRef] [Green Version]
  23. Wunch, D.; Toon, G.C.; Wennberg, P.O.; Wofsy, S.C.; Stephens, B.B.; Fischer, M.L.; Uchino, O.; Abshire, J.B.; Bernath, P.; Biraud, S.C.; et al. Calibration of the Total Carbon Column Observing Network using aircraft profile data. Atmos. Meas. Tech. 2010, 3, 1351–1362. [Google Scholar] [CrossRef] [Green Version]
  24. Zhou, M.; Wang, P.; Kumps, N.; Hermans, C.; Nan, W. TCCON data from Xianghe, China, Release GGG2020.R0 (Version R0) [Data set]. CaltechDATA 2022. [CrossRef]
  25. Yang, Y.; Zhou, M.; Langerock, B.; Sha, M.K.; Hermans, C.; Wang, T.; Ji, D.; Vigouroux, C.; Kumps, N.; Wang, G.; et al. New ground-based Fourier-transform near-infrared solar absorption measurements of XCO2, XCH4 and XCO at Xianghe, China. Earth Syst. Sci. Data 2020, 12, 1679–1696. [Google Scholar] [CrossRef]
  26. Liu, C.; Wang, W.; Sun, Y.; Shan, C. TCCON data from Hefei (PRC), Release GGG2020.R0 (Version R0) [Data set]. CaltechDATA 2022. [CrossRef]
  27. Tian, Y.; Sun, Y.W.; Liu, C.; Wang, W.; Shan, C.G.; Xu, X.W.; Hu, Q.H. Characterisation of methane variability and trends from near-infrared solar spectra over Hefei, China. Atmos. Environ. 2018, 173, 198–209. [Google Scholar] [CrossRef]
  28. Rodgers, C.D. Inverse Methods for Atmospheric Sounding: Theory and Practice; Series on atmospheric, oceanic and planetary physics; World Scientific Publishing: Singapore, 2000; reprinted 2004; 2008; Volume 2. [Google Scholar]
Figure 1. (a) Daily mean time series of dry-air column mixing ratios of CO (XCO) observed by the TROPOMI (green points) and the g-b FTIR at Hefei site (yellow points). (b) Correlation scatter diagram between the TROPOMI and the FTIR data over Hefei based on (a). The slope of the regression line without intercept is 0.97. (c) Daily mean time series of dry-air column mixing ratios of CO (XCO) observed by the TROPOMI (green points) and the g-b FTIR at Xianghe site (yellow points). (d) Correlation scatter diagram between the TROPOMI and the FTIR data over Xianghe based on (c). The slope of the regression line without intercept is 0.99. The average for FTIR products was only performed from 11:00 to 15:00 local time (LT), that is within ±2 h of TROPOMI overpass time (about 13:00 LT). Vertical error bars for TROPOMI and FTIR represent diurnal variabilities of the respective dataset.
Remotesensing 14 06045 g001
Figure 2. (a) Daily mean time series of dry-air column mixing ratios of CH4 (XCH4) observed by the TROPOMI (green points) and the g-b FTIR at Hefei site (yellow points). (b) Correlation scatter diagram between the TROPOMI and the FTIR data over Hefei based on (a). The slope of the regression line without intercept is 0.93. (c) Daily mean time series of dry-air column mixing ratios of CH4 (XCH4) observed by the TROPOMI (green points) and the g-b FTIR at Xianghe site (yellow points). (d) Correlation scatter diagram between the TROPOMI and the FTIR data over Xianghe based on (c). The slope of the regression line without intercept is 0.95. The average for FTIR products was only performed from 11:00 to 15:00 local time (LT), that is within ±2 h of TROPOMI overpass time (about 13:00 LT). Vertical error bars for TROPOMI and FTIR represent diurnal variabilities of the respective dataset.
Remotesensing 14 06045 g002
Figure 3. (a) The bias of XCO between the TROPOMI data and the FTIR data (TROPOMI–FTIR) as function of the coincident radius around the Hefei site for both clear-sky and cloudy satellite observations. (b) The same as (a) but for the Xianghe site.
Remotesensing 14 06045 g003
Figure 4. (a) The bias of XCH4 between the TROPOMI data and the FTIR data (TROPOMI–FTIR) as function of the coincident radius around the Hefei site only for clear-sky satellite observations. (b) The same as (a) but for the Xianghe site.
Remotesensing 14 06045 g004
Figure 5. The distributions and variations in the annual means of TROPOMI CO total column around Hefei and Xianghe from 2019 to 2021.
Remotesensing 14 06045 g005
Figure 6. The distributions and variations in the annual means of TROPOMI CH4 total columns around Hefei and Xianghe from 2019 to 2021.
Remotesensing 14 06045 g006
Publisher’s Note: MDPI stays neutral with regard to jurisdictional claims in published maps and institutional affiliations.

