Article

Aircraft Detection in SAR Images Based on Peak Feature Fusion and Adaptive Deformable Network

Key Laboratory for Information Science of Electromagnetic Waves (MoE), Fudan University, Shanghai 200433, China
*
Author to whom correspondence should be addressed.
Remote Sens. 2022, 14(23), 6077; https://doi.org/10.3390/rs14236077
Submission received: 21 October 2022 / Revised: 25 November 2022 / Accepted: 27 November 2022 / Published: 30 November 2022
(This article belongs to the Special Issue SAR-Based Signal Processing and Target Recognition)

Abstract

:
Due to the unique imaging mechanism of synthetic aperture radar (SAR), targets in SAR images often shows complex scattering characteristics, including unclear contours, incomplete scattering spots, attitude sensitivity, etc. Automatic aircraft detection is still a great challenge in SAR images. To cope with these problems, a novel approach called adaptive deformable network (ADN) combined with peak feature fusion (PFF) is proposed for aircraft detection. The PFF is designed for taking full advantage of the strong scattering features of aircraft, which consists of peak feature extraction and fusion. To fully exploit the strong scattering features of the aircraft in SAR images, peak features are extracted via the Harris detector and the eight-domain pixel detection of local maxima. Then, the saliency of aircraft under multiple imaging conditions is enhanced by multi-channel blending. All the PFF-preprocessed images are fed into the ADN for training and testing. The core components of ADN contain an adaptive spatial feature fusion (ASFF) module and a deformable convolution module (DCM). ASFF is utilized to reconcile the inconsistency across different feature scales, raising the characterization capabilities of the feature pyramid and improving the detection performance of multi-scale aircraft further. DCM is introduced to determine the 2-D offsets of feature maps adaptively, improving the geometric modeling abilities of aircraft in various shapes. The well-designed ADN is established by combining the two modules to alleviate the problems of the multi-scale targets and attitude sensitivity. Extensive experiments are conducted on the GaoFen-3 (GF3) dataset to demonstrate the effectiveness of the PFF-ADN with an average precision of 89.34%, as well as an F1-score of 91.11%. Compared with other mainstream algorithms, the proposed approach achieves state-of-the-art performance.

Graphical Abstract

1. Introduction

Because of its capacity to obtain high-resolution SAR images regardless of time and weather, synthetic aperture radar has been widely applied in many fields, such as ocean observations, natural disaster prediction, and battlefield surveillance [1,2]. Automatic target detection in SAR images has been a hot research topic for many years, attracting extensive attention from scholars at home and abroad. The essence of object detection in SAR images is to extract the target from the background via the difference in scattering characteristics, figuring out the location of potential objects. However, it is difficult to interpret SAR images using coherent scattering and imaging mechanisms. Aircraft detection in complicated conditions of SAR images is always a challenging task.
Essentially, traditional SAR target detection algorithms are designed for target extraction based on the differences in the electromagnetic backscattering properties of targets and the clutter background, and the same goes for aircraft detection. The traditional methods applied in SAR images can be grouped into the following four categories: contrast-based, visual attention-based, complex data-based, and multi-feature-based. The methods based on contrast include CFAR [3], various CFAR-derived methods (CA-CFAR [4], SOCA-CFAR [5], GOCA-CFAR [6], OS-CFAR [7], VI-CFAR [8]), GLRT [9] and PR [10]. The advantage of methods based on contrast are easy to implement and can accomplish good performance in simple scenarios. However, it is difficult to select an appropriate statistical clutter model and tackle heterogeneous strong clutter in the practical application. In addition, there are many false alarms and missing targets in object detection under a complex background. The visual attention-based method [11] suppresses the strong hetero enhancement target by introducing prior information, improving the SCR (signal to clutter ratio). Yet, the prior information introduced needs to be concretely analyzed for specific conditions, and the algorithm may be redesigned for different detection tasks. For complex data-based methods [12], the scattering characteristics of the target and clutter, as well as the imaging mechanism, are utilized for detecting the target. It can reflect the difference between man-made targets and natural clutter from the physical mechanism. However, high acquisition costs are required to obtain the raw complex SAR image data, and the capacity to distinguish between artificial clutter interference and artificial targets of interest is yet to be verified. The principal features used in the multi-feature-based approach mainly comprise structural features [13], peak features [4], variance features [14], and extended fractal features [15]. The merit of this solution is that it can detect targets from multi-dimensional features. Nevertheless, due to the poor generalization of this method, it can only achieve good performance for specific data. Among the above detection methods, the CFAR detector is one of the most widely studied and intensively applied. The main components of aircraft are composed of metallic materials with high backscattering coefficients. The airport area has a low backscattering coefficient as it is more capable of absorbing electromagnetic waves. The contrast-based detection algorithm can efficiently detect aircraft in the ROI area of the airport under such conditions. However, in general, traditional methods are ineffective in the face of complex background scattering, owing to the poor robustness and the limited capacity of feature representation.
With the enrichment of SAR images, the traditional algorithm, represented by CFAR, no longer meets the requirements. In recent years, with the development of DL and the improvement of the related hardware device, convolutional neural networks have shown amazing performance in the field of computer vision; and yet these methods are mainly applied to optical images. Detection algorithms based on DL can be divided into the two-stage algorithm and the single-stage algorithm in terms of detection steps. The Faster-RCNN [16] is a typical two-stage algorithm that adopts a trainable region proposal network (RPN) to improve detection efficiency while maintaining high accuracy. However, only high-level features are employed to predict objects, and it is difficult to detect small targets because it loses the low-level features. The single-stage representative algorithm is YOLO [17], which transforms the detection into a regression problem. The algorithm achieves a significant improvement in the detection rate, but the precision becomes poor. An FPN structure [18] is proposed in the literature, which integrates high-resolution information about shallow features with high semantic information on deep features. The detection performance is raised by predicting the different feature layers separately. All the above methods are based on anchor frames. Firstly, the location of potential targets is inferred from the generated anchors in the RPN stage, and the final results are filtered by NMS (Non-Maximum Suppression). After 2019, algorithms based on DL without anchor frames have been developed, such as CornetNet [19], ExtremeNet [20], FCOS [21], and CenerNet [22]. CornerNet is a new one-stage detection method that treats the target as a set of key points. ExtremeNet evolves based on CornerNet, which detects four extremes and one centroid via standard key point estimation. The central heat map of each class is proposed to predict the target center. CenterNet derives the centroid via key point estimation and additional information about the target by regression. Many other methods have been proposed for object detection, e.g., [23,24].
With deep learning (DL) achieving amazing performance in computer vision, DL has also gradually become a standard paradigm in SAR image analysis, including aircraft detection [25], which is detailed in Section 2.1.1. Although many approaches have achieved a certain effect in aircraft detection of SAR images, they still leave much room for improvement.
The imaging mechanisms of SAR and optical satellites display great differences, resulting in an entirely different appearance of the target. The represented features of aircraft in SAR images can be summarized via the following three aspects:
(1)
Discrete points. Due to the mechanism of SAR imaging, aircraft appearing in SAR images consist of a few strong scattering points, which form the faint outline of the aircraft. Coupled with the interference of background clutter, it is easy to miss detection;
(2)
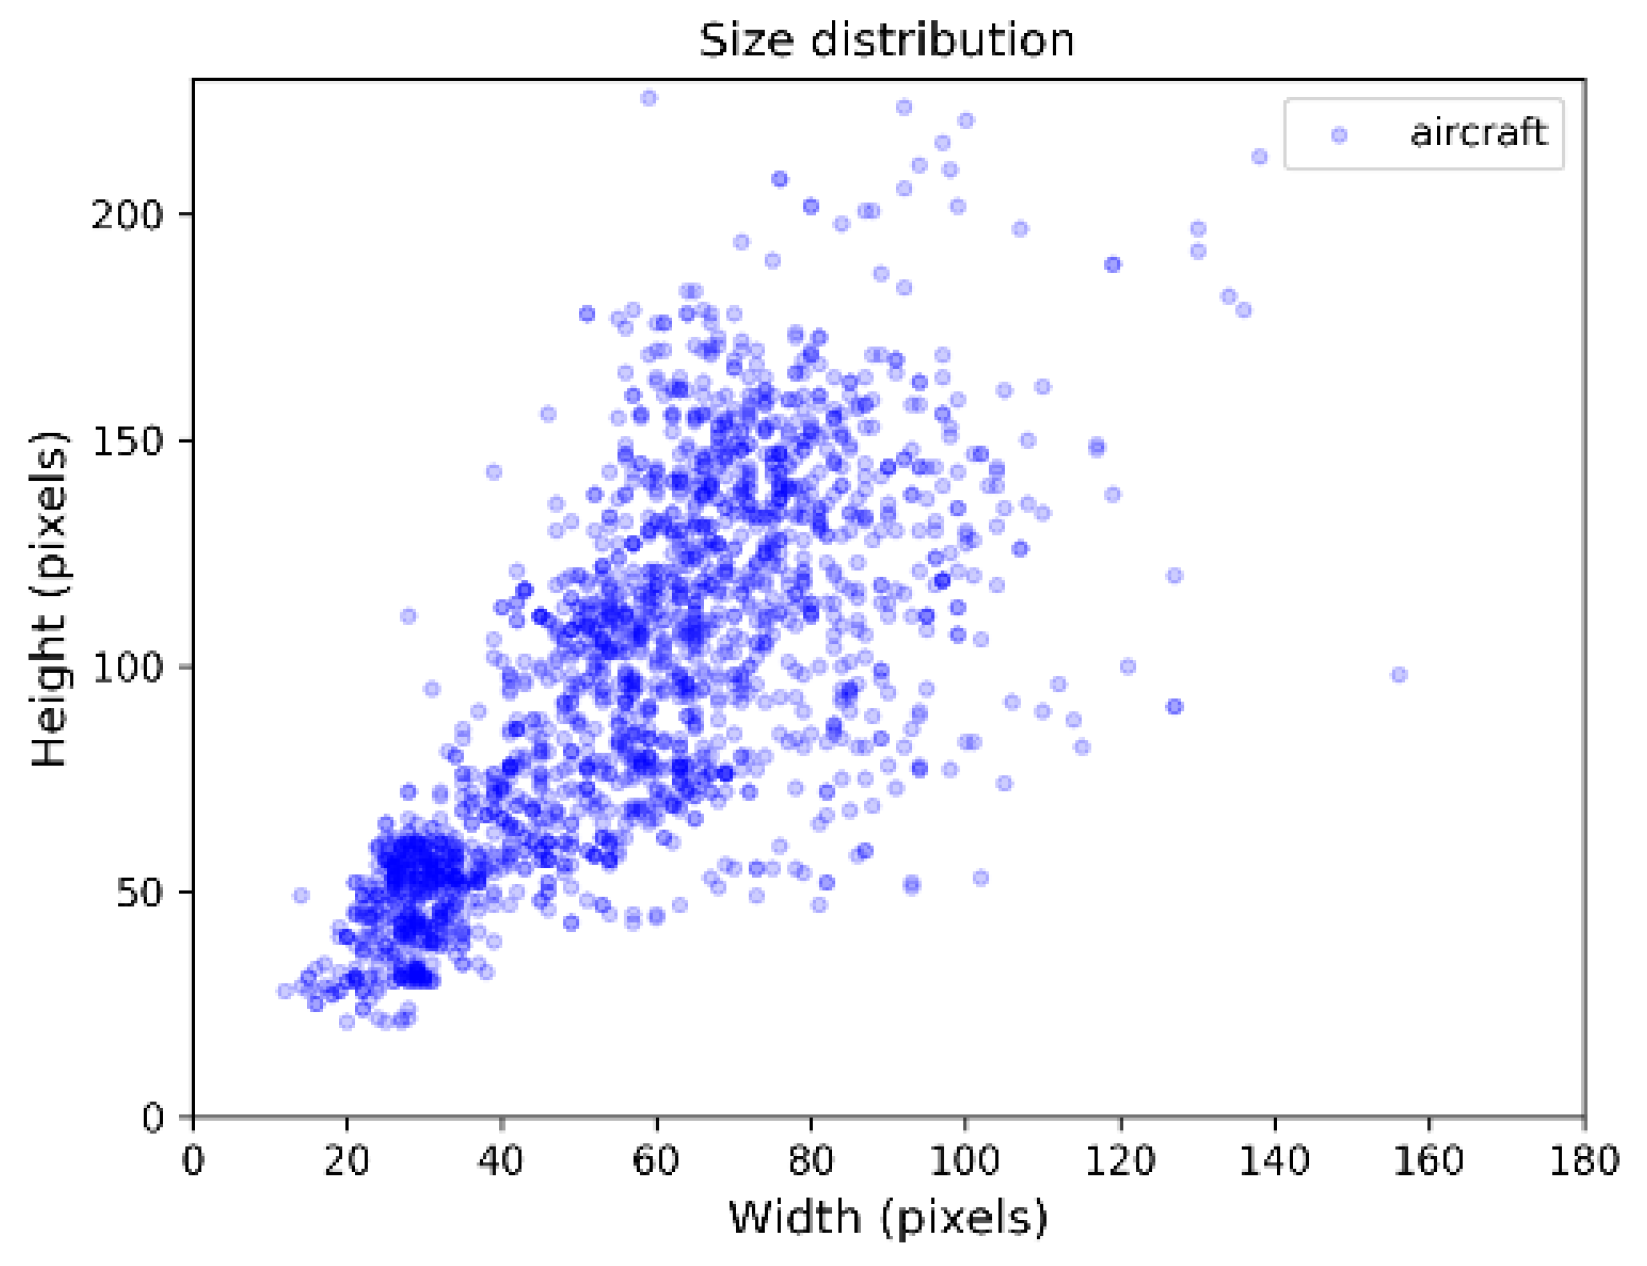
Multi-scale targets. In this study, the size of most aircraft in the GF3 dataset ranges from 20 to 110 pixels. However, with the deepening of the CNN, the spatial information of small-size aircraft with fewer pixels is easy to lose, which poses a challenge to multi-scale aircraft detection;
(3)
Attitude sensitivity. With changes in azimuth angle, the appearance of the same aircraft in different SAR images is not quite identical. It is difficult to acquire the modeling geometric transformation of changeable-appearance aircraft in limited and available training samples.
As is well-known, there is no doubt that abstract features extracted by DL have better representation capacities than traditional manual features. However, should the traditionally established hand-made features be completely abandoned in favor of total reliance on abstract features? This is a meaningful issue. Regretfully, most detection algorithms of SAR based on DL are established by fine-tuning the classical optical network, and do not consider the differences in the imaging mechanism between SAR and optical satellites. Otherwise, compared with optical data, SAR image data are relatively scarce. A large amount of image data is acquired to train the network model, so transfer learning from optical networks alone does not work well. Besides this, many publications are only tested on specific circumstances, e.g., aircraft with clear contours and a single background. Fewer detection networks take the multi-scale and attitude sensitivity of targets in the various and complicated conditions of SAR images into consideration.
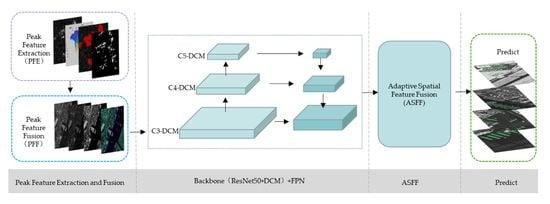
Intending to address the above-mentioned problems, an adaptive pyramid deformable network combined with the peak feature fusion (PFF-ADN) is proposed to ameliorate the performance of aircraft detection under complex backgrounds and target dense arrangement conditions. The strong scattering points represent the maximum pixel value of the local scattering region in SAR images, which have superior significance and stability [
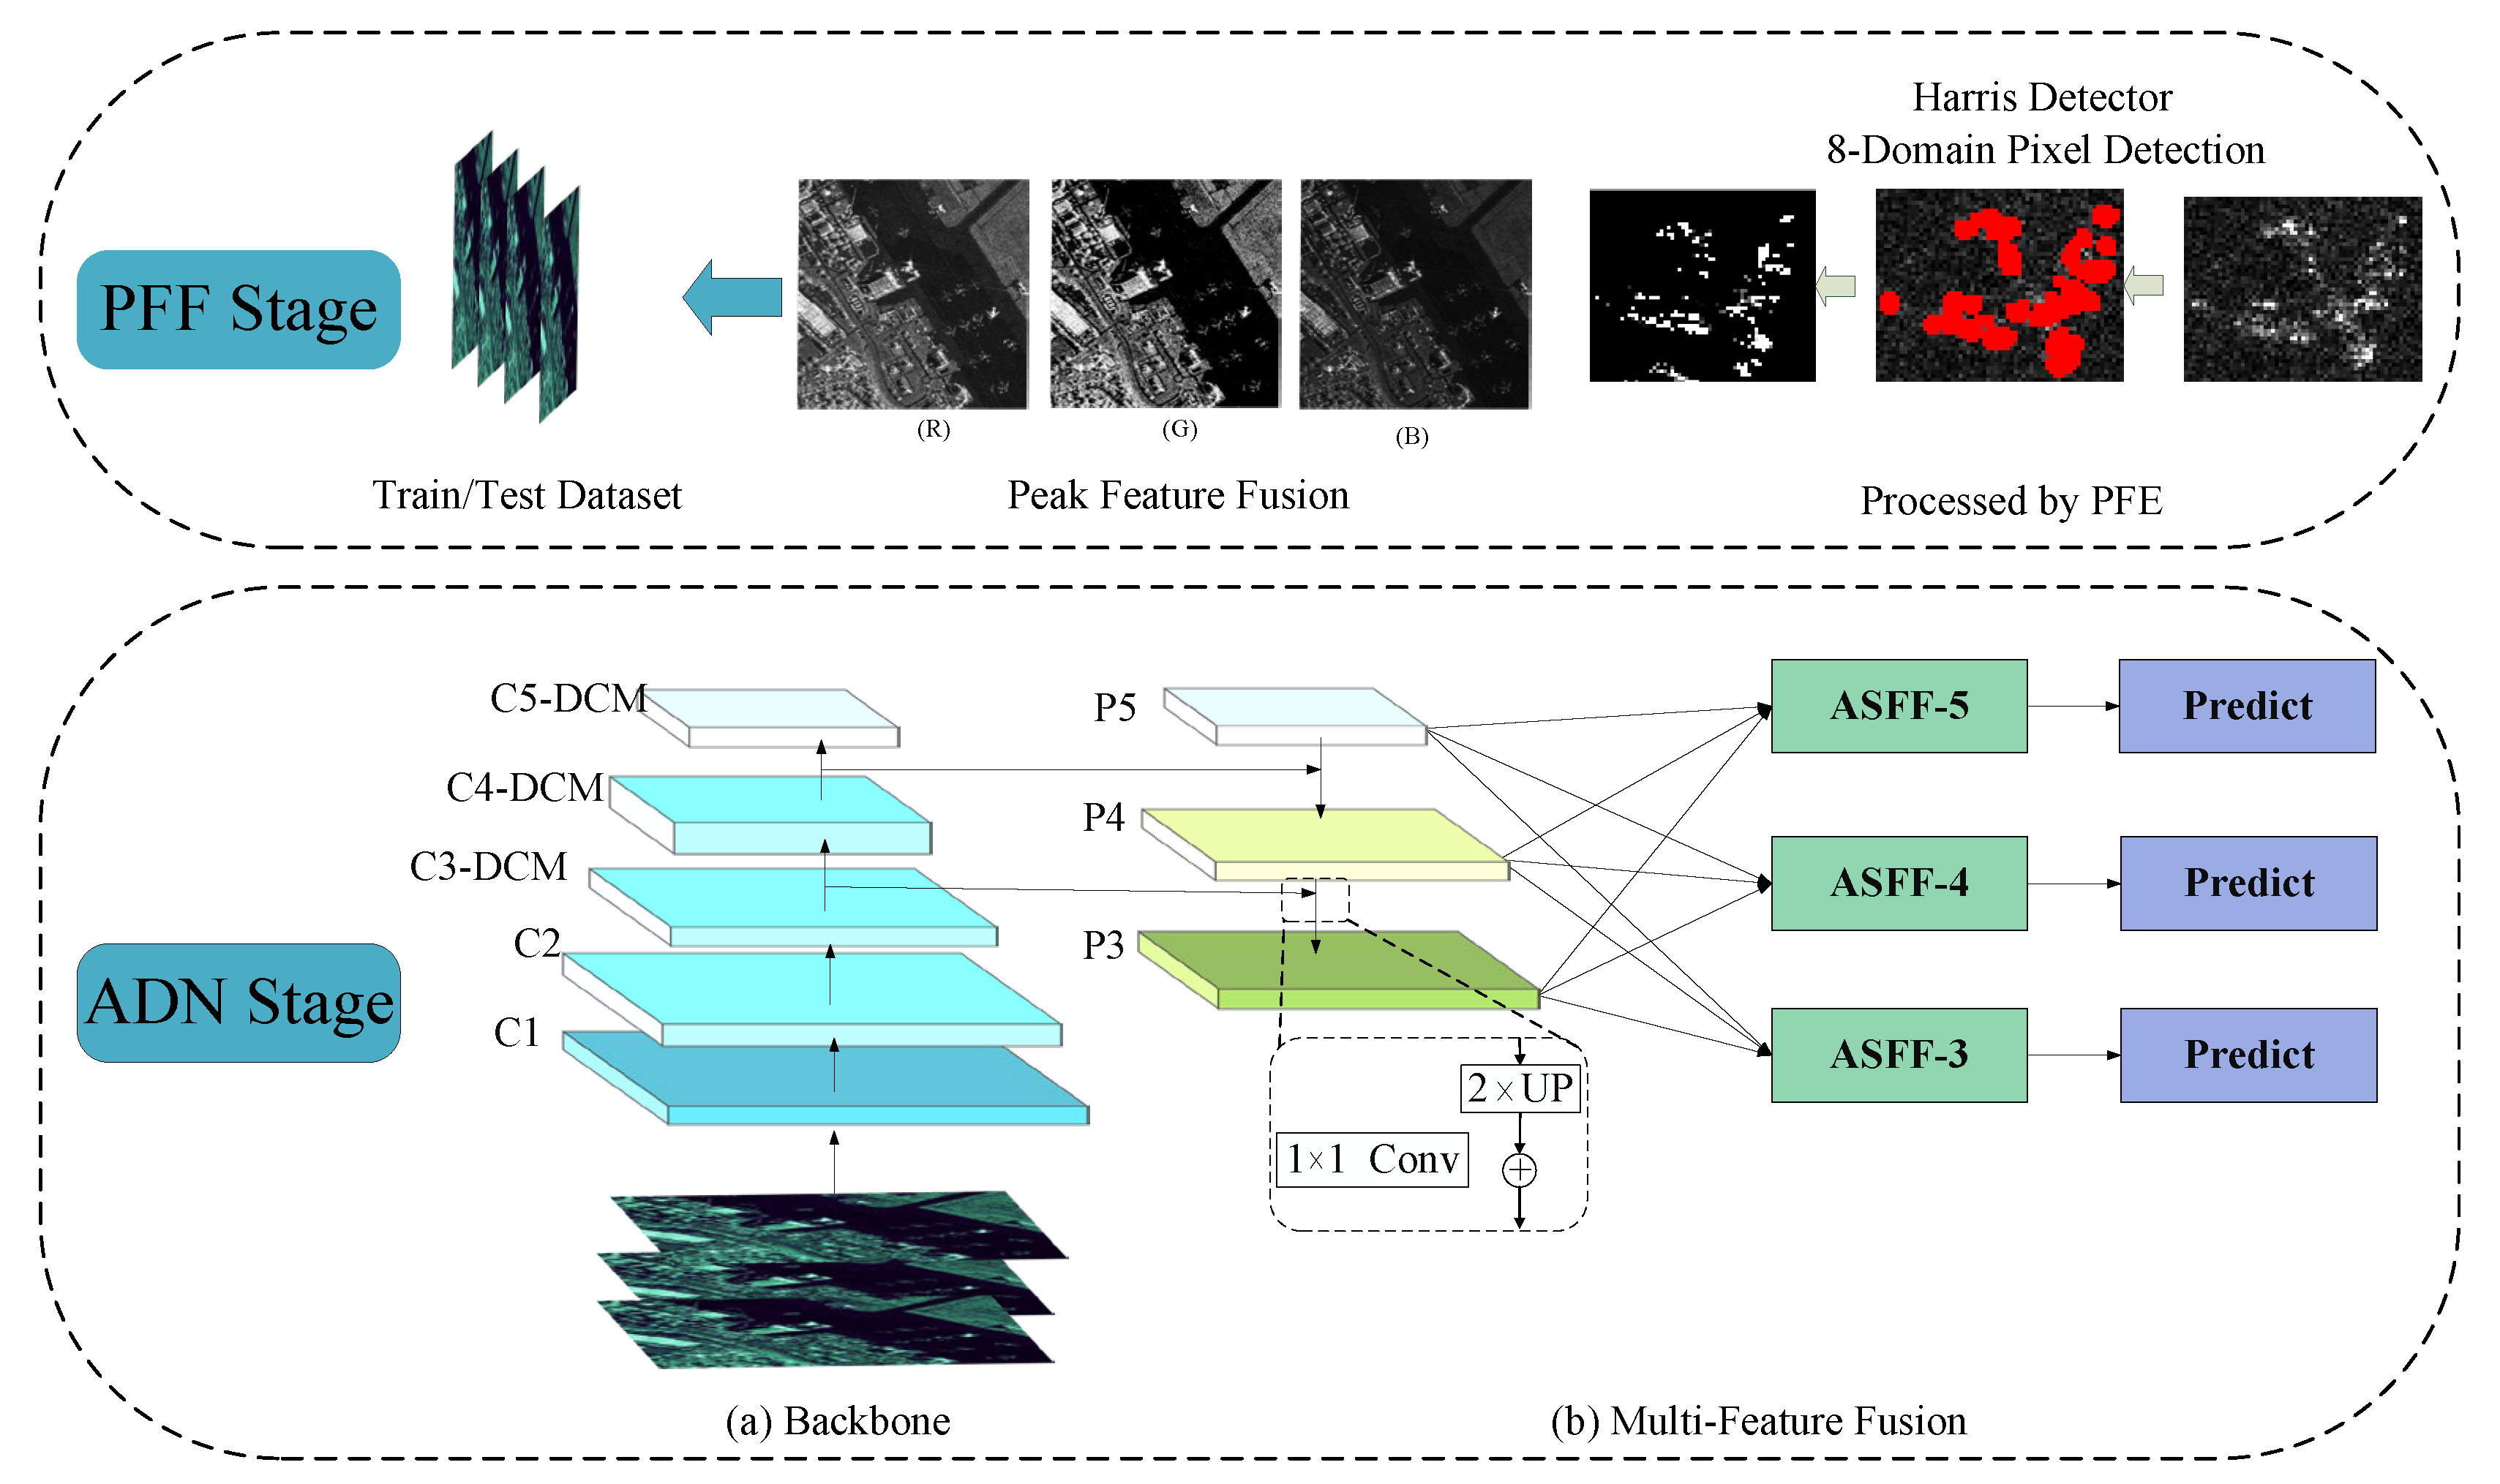
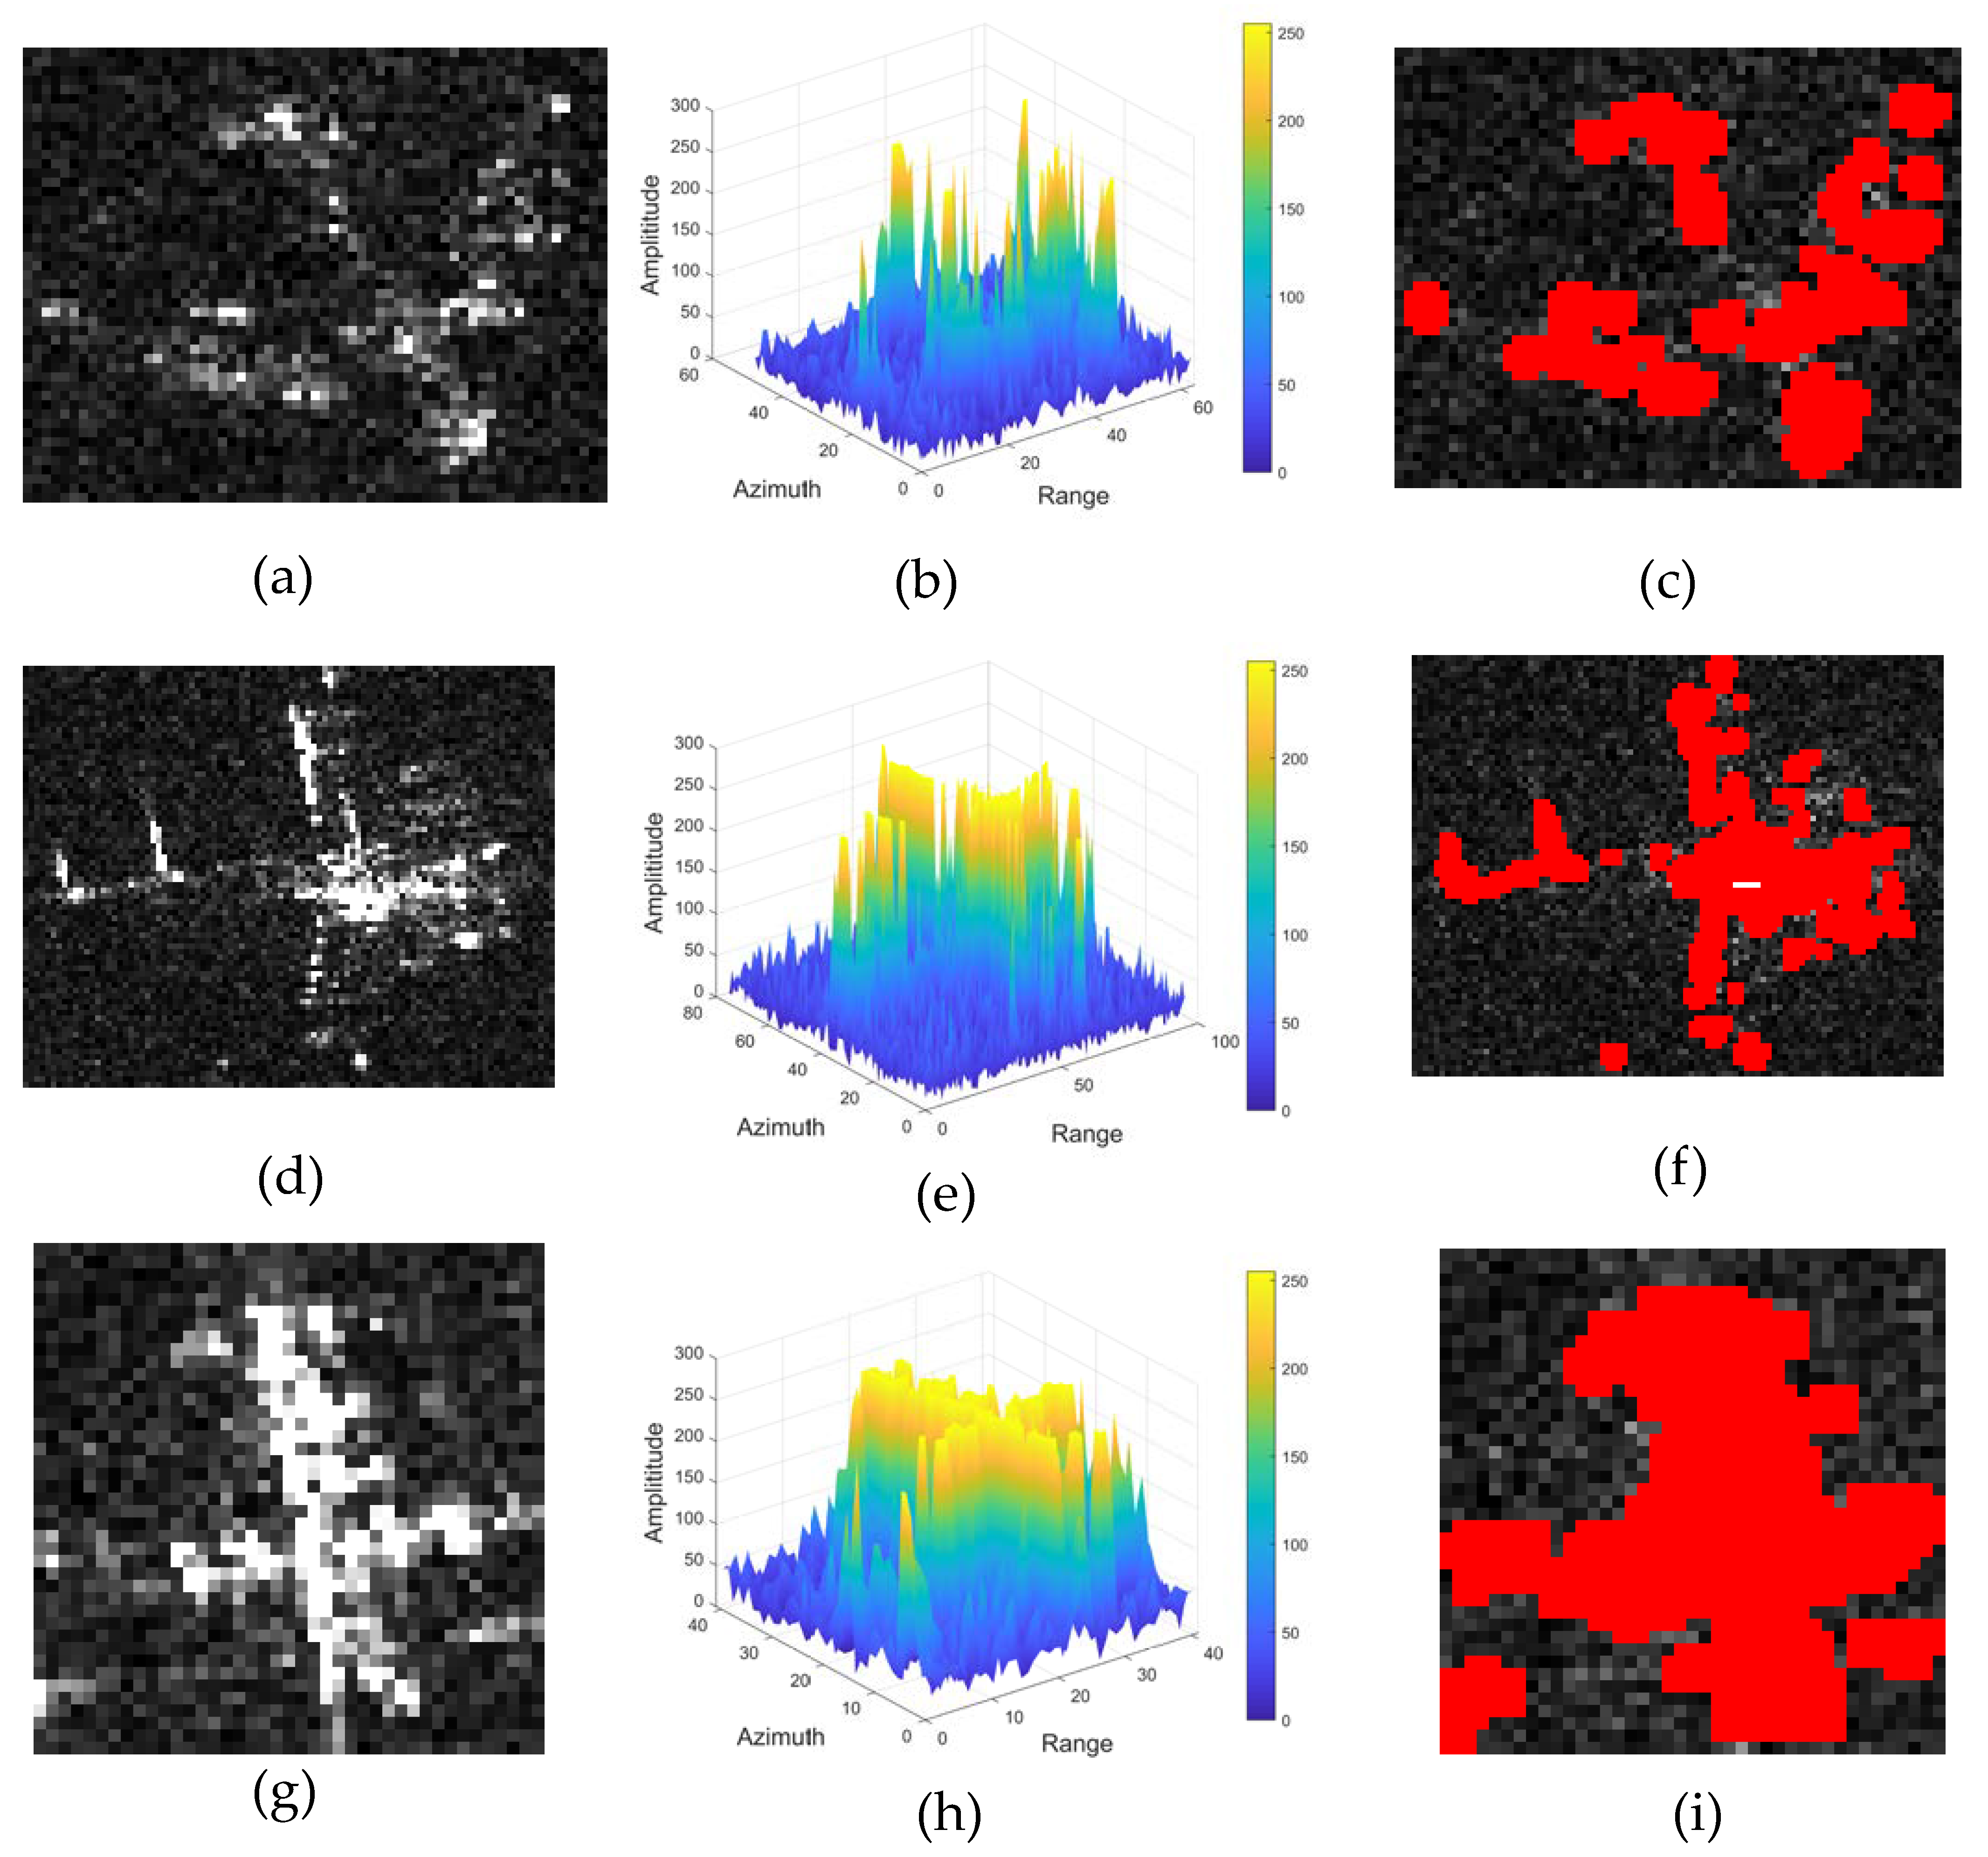
26]. The distribution of scattering centers can be responded to the peak features, which also can describe the geometric shape of the target in a complex environment. Therefore, combining the peak features is a feasible way to enhance the performance of aircraft detection. (1) In the peak feature extraction stage, because the strong scattering points tend to be distributed on the common components such as nose, fuselage, tail, wings, and engines, the corner points extracted by the Harris detector [27] with rotational invariance, are selected as the basis for modeling the scattering information of aircraft. Then the peak features of images are acquired based on the 8-domain pixel detection of local maxima, which will be sent to the next stage for feature fusion. (2) In the peak feature fusion stage, the image data processed by PFE will be integrated into the image as the G-channel data. This operation can fuse the peak features of aircraft into the image, enhancing the saliency of aircraft under various imaging conditions. Meanwhile, it facilitates the mitigation of variability and provides more effective information to the detection network. (3) In the deep feature extraction stage, an adaptive deformable network for aircraft detection is proposed by incorporating the ASFF and DCM. The ASFF can cope with the inconsistency of multi-scale features, which is beneficial to fully exploit the representational power of the feature pyramid network, improving the ability to detect multi-scale aircraft, especially for small-size aircraft. The DCM is adopted to cope with the attitude sensitivity of aircraft in SAR imaging and various shapes of aircraft, making the detection network accommodate the geometric variations. Finally, experiments are conducted on the GF3 dataset to validate the effectiveness of each presented module and to demonstrate the superiority of the proposed method.
The main contributions of our work can be summarized as follows:
(1)
A novel integrated framework named PFF-ADN is proposed for SAR aircraft detection, which enhances the scattering features of the target by fusing the peak features of images and improving the network structure. This presented method achieves state-of-the-art performance on the GF3 dataset.
(2)
A peak feature fusion strategy is designed for enhancing the brightness information of aircraft in the SAR images by extracting and fusing the peak feature information, which has stronger robustness to deal with the variability and obscureness caused by the scattering mechanism of SAR. Compared to the raw images, the aircraft characteristics are highlighted in the enhanced images, providing effective information on aircraft for the subsequent network.
(3)
An adaptive deformable network for aircraft detection is designed, which is composed of a Feature Pyramid Network with ASFF structure and deformable convolution module (DCM). The ASSF is introduced to solve the inconsistency of multi-scale features and retain more discrete information about small-size aircraft, which enhances the detectability, especially for small-size aircraft. The DCM is adopted to cope with the attitude sensitivity of aircraft in SAR imaging and various shapes of aircraft, making the detection network accommodate the geometric variations.
The remainder of this paper is organized as follows. Section 2.1 shows a review of the related work, which contains DL methods and traditional methods of aircraft detection in the SAR domain. Section 2.2 describes the proposed PFF-ADN algorithm in detail. In Section 3, the parameter configuration, assessment criteria, experimental results as well as performance evaluation are shown in detail. Finally, we summarize this article and provide the prospect for further research in Section 4.

2. Materials and Methods

2.1. Related Work

2.1.1. Aircraft Detection Based on DL in SAR Images

Recently, with deep learning (DL) achieving amazing performance in computer vision, DL has also gradually become a standard paradigm in SAR image analysis. Guo et al. [25] designed a novel method that combines scattering information enhancement and an attention pyramid network for aircraft detection. The candidate areas containing aircraft are enhanced by scattering information, improving the average precision of aircraft detection. Therefore, inspired by this work, we propose the peak feature can be fused into the image to enhance the information of the target, thus improving the detection performance. Wang et al. [28] proposed a method based on a convolutional neural network (CNN) and data enhancement for aircraft detection. The regions of interest are acquired by the saliency pre-detection approach and then fed into CNN to get the final detection results. Zhang et al. [29] showed a cascaded three-look network to detect aircraft in SAR images. It firstly narrows the inspected image down to the airport area by pixel-based comparison, and it obtains the detection results through Faster-RCNN. Zhao et al. [30] adopted an integration network that contains the dilated attention block and convolution block attention module for aircraft detection, and they confirmed the effectiveness of this method on a mixed SAR aircraft dataset. He et al. [31] exploited the components of aircraft to improve detection performance. To find out the inner link between the aircraft and the components, they established a multi-scale detector including a root filter and part filters. The experimental results indicate this method has higher precision and is able to detect the components of aircraft. Dou et al. [32] came up with an optimized target attitude estimation method wherein prior information about the target shape is acquired by the generative adversarial network. Detection probability is improved with valid prior knowledge of aircraft. Julie et al. [33] suggested a hybrid clustering active learning method to improve the performance of aircraft detection. Han et al. [34] utilized this method, which combines region segmentation and multi-feature decision for aircraft detection in POL-SAR images, and the detection results showed a lower false positive rate. Jia et al. [35] designed a component discrimination network for aircraft detection, which utilizes the dominant component features of aircraft to improve detection and recognition performance. Considering the SAR imaging mechanism, Kang et al. [36] proposed an innovative scattering feature relation network to improve detection performance. It guarantees the completeness of detection results by analyzing and enhancing their correlation. Zhao [37] presented a detector called Attentional Feature Refinement and Alignment Network for detecting aircraft in SAR images, achieving competitive accuracy and speed. Bi et al. [38] present a novel POL-SAR image classification method, achieving promising classification performance and preferable consistency.

2.1.2. Traditional Candidate Feature Methods in SAR Images

Manually designed features based on target structural and scattering features are used for feature representation in the conventional detection approach in the SAR domain. Target structural features include target contour, component shape, and structural distribution. The structural characteristics of the target are mainly manifested by the length and width of the target, the contour, the shape of components, and the structural configuration. Margarit et al. [39], Margarit and Mallorqui [40], and Margarit and Tabasco [41] conducted some work to improve the accuracy of ship classification by modeling the geometric features of the bow, midship and stern sections. Xu [42] et al. proposed a novel structured low-rank and sparse algorithm for high-resolution ISAR imaging, which can effectively deal with various types of sparse sampling and improve the image formation quality greatly. Gao [43] proposed a geometric feature-based aircraft interpretation method. The key geometric parameters of aircraft are obtained for interpretation by extracting the components of the aircraft, such as the engine and nose. In addition, as the SAR image resolution develops, the structural information of objects is presented in more detail, so the detection performance of SAR objects will be facilitated by making full use of radiometric and geometric scattering information. The aircraft in SAR images are usually composed of a series of strong scattered bright spots due to the imaging mechanism of SAR and the material construction of aircraft. Therefore, some scholars have studied how to effectively exploit strong scattering points for aircraft interpretation in SAR. The backscattering characteristics of aircraft are researched to acquire salient point vectors, which are integrated into the template-matching process for aircraft identification in TerraSAR-X images [44]. Zhu et al. [45] put forward a method in which the accuracy of SAR ship classification is improved by integrating the geometric topology of strong spots with amplitude intensity. In conclusion, the scattering features used for aircraft detection in SAR images can be divided into three main categories: peak features, statistical features, and texture features. The distribution of scattering centers can respond to the peak features, which can also describe the geometric shape of the target in a complex environment. Importantly, within a certain range of viewing angles, the position and intensity of strong scattering centers are statistically quasi-invariant [46]. Therefore, the extraction and application of peak features are critical to the orientation of aircraft in SAR images. Here, we focus on the peak features for aircraft detection, which is illustrated in Section 2.2.2.

2.2. The Proposed Method

2.2.1. Overview of the Proposed Method

In this work, the framework of PFF-ADN is illustrated in Figure 1, which mainly comprises three parts: peak feature extraction, peak feature fusion for enhancing the features of aircraft, and the ADN structure for detecting the image processed by PFF. In Section 2.2.2, we first introduce the extraction process of the peak feature, because it is the basis for the next step. Next, the peak feature fusion in Section 2.2.3 is introduced in detail. Finally, The ADN, which incorporates the ASFF and DCM, is described in detail. It is worth mentioning that the DCM and ASFF are introduced to the proposed approach. The two modules can greatly enhance the detector’s capacity for modeling geometric transformations and extracting abstract features, respectively. In Section 2.2.4, the principles, expression forms, and realization course of the two modules will be discussed in detail.

2.2.2. PFE

Target scattering features are the key information used in understanding SAR images deeply. The peak features of SAR images essentially reflect the scattering center of the target. Meanwhile, peak features can not only depict the geometric features and shape characteristics of the target, but also be very stable in the complex radar imaging system. Therefore, they are one of the most widely used features in SAR image target detection. The structure of an aircraft is relatively complex, the dimensions and details of which can be observed in single-polarization high-resolution SAR images. The strong scattering of aircraft mainly comes from the engine, nose, fuselage, wing, and tail edge. The different parts have different scattering mechanisms, including tip diffraction, cavity scattering, mirror reflection, edge diffraction, multiple reflections and so on [47], as illustrated in Figure 2.
Based on the aforementioned analyses, the scattering from aircraft is relatively strong, as exhibited in the highlighted regions in the SAR images. According to experiments, the extraction of peak features is generally stable, regardless of prior knowledge. The specific operation procedure of PFE is shown in Algorithm 1. Therefore, a peak feature enhancement and fusion approach based on the extraction of peak points and multi-channel fusion is proposed to enhance the scattering features of aircraft in SAR images, which facilitates the subsequent detection network.
Algorithm 1: Peak Feature Extraction
Input: The   image   I ( x , y )
the mean μ and variance σ of the background region
Hyper-parameter: k = 0.4
Output: Generated   peak   feature   points :   P = ( p 1 , p 2 , , p k )
Main loop:
1:Compute the gradient in the direction of x and y :
2: I x = I x = I ( 1 , 0 , 1 ) , I y = I x = I ( 1 , 0 , 1 ) T
3:Calculate the product of the gradients of the two directions:
4: I x 2 = I x I x ,   I y 2 = I y I y ,   I x y = I x I y
5:A Gaussian weight is assigned to each gradient acquired:
6: A = g ( I x 2 ) = I x 2 ω ,   C = g ( I y 2 ) = I y 2 ω ,
7: B = g ( I x y ) = I x y ω ,   M = [ A   C C   B ]
8:for x corner-point do
9: if   R = { R : det M α ( t r a c e M ) 2 < t h r e s h o l d H }
10:add x   into   the   corner   points   set   C = C { x }
11:else
12:pass
13:for  x C do
14:if   x > μ + k σ   and   min ( a i j a N ( i , j ) ) > σ
15:add x   into   the   peak   points   set   P = P { x }
16:else
17:pass
The peak feature points have strong gradient information, which is stable with changes in the external environment. Thus, it is of great importance to obtain the peak feature points for the subsequent feature enhancement and fusion. Given that the corner points have the advantage of rotation invariance, and insensitivity to noise and gradient features, the Harris detector is utilized to extract corner points first. Then, by comparing the corner points value and threshold, the peak points are automatically searched for. The mathematical expression of Harris is given below (1), where w ( x , y ) denotes the window function and w is an adjustable parameter, and ( x , y ) is the pixel position in the image I . E ( Δ x , Δ y ) represents the variation caused by window movement and ( Δ x , Δ y ) is the shift pixel size of window.
E ( Δ x , Δ y ) = x , y w ( x , y ) [ I ( x + Δ x , y + Δ y ) I ( x , y ) ]   2
Referring to Taylor series expansion, Equation (2) is derived by using Equation (1). g ( σ ) stands for the Gaussian convolution kernel with scale σ , which convolves with a matrix, improving the anti-noise ability of the algorithm. I x is the first derivative of the position x . represents the convolution operation.
M = g ( σ ) [ I x 2 I x I y I x I y I y 2 ]
The scattering centers are defined as two kinds of peak feature points, which are comprised of a two-dimensional peak point (vertex) and a one-dimensional peak point (vertex of row and vertex of column). The row (column) vertex is the row (column) local maximum of the pixel within the target region of the SAR image and the vertex is the two-dimensional local maximum of the pixel within the target region of the SAR image. To weaken the influence of noise, when we acquire the peak points, the mean μ and variance σ of the background region need to be estimated first. The peak features of a target ( i , j ) can be defined by pixels within their domain:
p i j = { 0 ,   e l s e 1 ,   i f   a i j > μ + k σ   and   min ( a i j a N ( i , j ) ) > σ  
If p i j = 1 , it denotes that the current pixel is the peak point. If p i j = 0 , it represents that the current pixel is not the peak point. a i j is the pixel value of the current point. N ( i , j ) is the local area of a i j The row (column) vertex N ( i , j ) is the two nearest neighbor pixels in i row ( j column) of a i j . k is an empirical parameter determined by conducting multiple experiments. In this paper, we adopt a peak extraction method based on the eight-domain pixel detection of local maxima, which is a classical method with pixel-level accuracy.
For the peak feature extraction of aircraft, three different types of aircraft are selected for a detailed analysis. As shown in Figure 3, Figure 3a is the original image of an aircraft slice; Figure 3b shows the three-dimensional maps of aircraft; Figure 3c shows the extraction results of peak points, which are marked in red to offer more intuitive information. It demonstrates the strong scattering points of aircraft can be more effectively indicated by the peak feature points.
The peak features of aircraft are scattered all over, mainly in the cavity structure of the engine, the complex electromagnetic structure of the cockpit, the dihedral angle formed by the combined components, the three-sided angle structure, and other strong scattering regions. A fine description of the aircraft structure can be obtained by the extraction of the peak features. The peak points of Figure 3a are mainly concentrated in the engine, tail, and wings and fewer peak points are in the fuselage. In Figure 3b, more peak points are distributed in the junction of fuselage and wing, which is more intuitive to visualize in three-dimensional maps. As shown in Figure 3c, the peak feature distribution is presented as a cross shape, which cannot be used to clearly distinguish the characteristics of each component. It can be inferred that the numbers and locations of peak points vary between types of aircraft. Based on this, peak features are critical in the application of target detection and recognition in SAR images.
It is necessary to handle the SAR images via the PFE method, owing to the aim, which is to detect aircraft in SAR images. By comparing Figure 4a–d, the intensity of the aircraft’s position in SAR images is significantly enhanced. The changes are intuitively observed in 2-D and 3-D illustrations of SAR images. As shown in the 3-D maps in Figure 4a–d, the differences in the scattering strength of aircraft in SAR images can be observed more clearly.

2.2.3. PFF

In this study, a very effective and simple method is applied to SAR data preprocessing. k times the average of non-zero data is computed to truncate and normalize the original SAR data, which is abbreviated to KTN, as detailed in Formula (4). For the experimental dataset, the single-channel SAR data is processed by the KTN method.
I = u n i t 8 [ I ( I k m e a n ( I ) = k m e a n ( I ) max ( I ) × 255 ] [ 0 , 255 ]
In Formula (4), I stands for the data value of each channel. k is a manually tunable parameter. m e a n ( I ) and max ( I ) denote the average value of all non-zero data for each channel and the max value of data for each channel, respectively. The KTN method is utilized to handle the SAR data and convert them to a uint8 data format. Because of the network pre-trained by the optical samples of COCO [48], the images of COCO present in the RGB format with three-channel. Thus, the SAR data is necessary to be transformed into a three-channel format for detection network training better. In most pre-processing methods, single-channel eight-bit data is often transformed into three-channel data by replication. In this study, one channel of data is replaced with peak feature data I P F E which is obtained in Section 2.2.2, and the other channels adopt different multiples of the mean. By fusing these enhancements in target scattering, the strong scattering characteristics of targets can be learned by the network more effectively. In the process of synthesizing the training image, R and B channels are assigned the data processed by KTN. The data of the G channel is substituted for the data processed by PFE.
R = u n i t 8 [ I ( I k m e a n ( I ) = k m e a n ( I ) max ( I ) × 255 ] [ 0 , 255 ]
G = I P F E
B = u n i t 8 [ I ( I k m e a n ( I ) = k m e a n ( I ) max ( I ) × 255 ] [ 0 , 255 ]
Data visualization based on KNT is shown in Figure 5. Three-times and six-times are set in the KNT, as illustrated in Figure 5a,c. Compared with Figure 5c, Figure 5a shows higher visual lightness. Figure 5b is processed by PFE in Section 2.2.2 and the peak features of aircraft in the image are extracted and enhanced, leading to the information of the target being more distinct.

2.2.4. ADN

(1)
DCM: The input feature map is sampled at fixed positions in the standard convolution operation, and the sampled pixels are mostly rectangles. This gives rise to obvious issues, such as that the receptive fields are of the same size in the same layer. So, the standard convolution has no ability to handle geometric transformations. Nevertheless, because of the SAR scattering mechanisms, the same target in SAR images appears in various shapes with changes in azimuth angle. In this paper, deformable convolution [49] is adopted to accommodate geometric variations or attitude sensitivity in aircraft viewpoint and the part deformation of aircraft in SAR images.
As shown in Figure 1, ResNet50 [50] is used in this experiment and a deformable convolution kernel is applied in stages 3,4,5 of ResNet50, which is inspired by the work of Zhu [51]. As mentioned below, due to the adaptive receptive field sizes of deformable convolution, the sampling positions of feature maps in stage Conv2D can be adaptively adjusted, which allows the subsequent ASFF module to give more robust representations of geometric transformations. The standard convolution includes two steps. Firstly, the input feature graph X is sampled with a grid R of a specific size. Secondly, the sampling points are dotted with the weight coefficient W and these products are simply summed. As shown in Figure 6a, taking a 3 × 3 convolution kernel, for example, nine positions p 0 are taken as samples from X to get the output feature map y . For grid R , (−1, 1), and (1, 1) represent the upper left corner and bottom right corner respectively, and define a 3 × 3 kernel with dilation 1.
R = { ( 1 , 1 ) , ( 1 , 0 ) , , ( 0 , 1 ) , ( 1 , 1 ) }
The convolution output for each point p 0 is y
y ( p 0 ) = p n R w ( p n ) × x ( p 0 + p n )
In deformable convolution, the offsets Δ p n ( n = 1 , 2 , , N ) is added to the grid R , So the output y becomes
y ( p 0 ) = p n R w ( p n ) × x ( p 0 + p n + Δ p n )
As illustrated in Figure 6a, the offsets can be obtained by a parallel convolution unit and the sampling points of the input feature map are no longer regular rectangles. The nine cyan boxes indicate the sampling position in 3 × 3 standard convolution, while the corresponding blue boxes denote the sampling position in 3 × 3 deformable convolution. Figure 6b shows the receptive field of standard convolution (right) and deformable convolution (left). The sampling positions of standard convolution are fixed and rectangular, while the sampling positions are adaptively adjusted according to the shape and scale of instances. In conclusion, deformable convolution has the ability to learn receptive fields adaptively and enables adaptive part localization for aircraft with different shapes. For target location in a visual field, the deformable convolution proposed solves the problem of geometric transformations and it is conducive to feature extraction and fine localization.
(2)
ASFF: To fully exploit the semantic information of deep features and the high-resolution information of shallow features, the structure of the feature pyramid network is often used for feature fusion. However, the representational ability of the feature pyramid is constrained because of the inconsistency between multi-scale features. Inconsistency is reflected in detecting multi-scale aircraft in the same SAR image. The high-resolution information in the shallow layer is beneficial to the detection of small-size aircraft, while large-size aircraft can be detected with semantic information in the deep layer. When large-size aircraft are recognized as true positives, small-size aircraft are easily mistaken as false negatives, resulting in leak detection. Considering that that aircraft in SAR images consist of several discrete points and problems do occur with the detection of multi-scale aircraft, ASFF is introduced to filter conflicting information, suppressing the inconsistency and improving the scale-invariance of features [52]. The essence of ASFF is to adaptively learn the spatial weight of fusion for feature maps at each scale. Firstly, for the features of a given layer, features from other layers are adjusted to the same scale for fusion. Secondly, the best spatial weight for fusion is acquired by subsequent training. Finally, the features of all levels are adaptively aggregated at each level. In other words, some features carrying contradictory information may be filtered out, while other features with cataloged clues are retained.
ASFF-5 is shown in the ADN stage of Figure 1, as an example, the necessary measures of feature fusion can be divided into two steps. Firstly, to derive ASFF-5, the resolution of the feature at the level l ( l = 3 , 4 , 5 ) is resized to l ( l = 5 ) . Secondly, the feature in each layer ( X 3 , X 4 , X 5 ) is multiplied by the corresponding weight ( α , β , γ ) and sum the results. The equation is as follows:
y i j l = α i j l · x i j 3 l + β i j l · x i j 4 l + γ i j l · x i j 5 l
where x i j n l represents the feature vector of the position ( i , j ) on the feature maps adjusted from level n to level l . y i j l denotes the output features, and α i j l , β i j l , γ i j l are respectively the weight parameters of different layers from n ( n = 3 , 4 , 5 ) to l .
α i j l = e λ α i j l e λ α i j l + e λ β i j l + e λ γ i j l
Here λ α i j l , λ β i j l , λ γ i j l are taken as the control parameters. The 1 × 1 convolution is utilized to compute the weight scalar maps ( λ α i j l , λ β i j l , λ γ i j l ) .

3. Experiments and Analyses

In short, experiments on the PFF-ADN we have proposed are conducted for illustration and comparison with GF3 datasets. To confirm the effectiveness of each module, the detection results of ablation experiments are presented and the contributions of different modules in this method are discussed.

3.1. Data Set Description and Parameter Setting

The built datasets contain 69 GF3 SAR images with sufficient desired variations. The GF3 images show C-band HH polarization with 1 × 1 m resolution, and contain 1903 SAR aircraft. These magnitude images with expert annotation cover a variety of complex scenes in which it is difficult to distinguish targets from the background noise, such as scenes where small aircraft are densely arranged, and scenes where both large and small aircraft exist together. In addition, aircraft adjacent to buildings are common in this dataset. Therefore, GF3 is established to verify the performance of the proposed algorithm in a complex background. We randomly chose 49 images as the training set and the remaining 20 images as the test set. The large-scale images in GF3 are about 20,000 × 20,000 pixels, which need to be cut into slices of 1000 × 1000 pixels with an overlap of 200 pixels. The reason for the 200-pixel overlap is to avoid cutting off the aircraft. Detailed information on the experimental dataset is given in Table 1. Besides this, the size distribution of aircraft in this dataset also varies considerably, as shown in Figure 7.
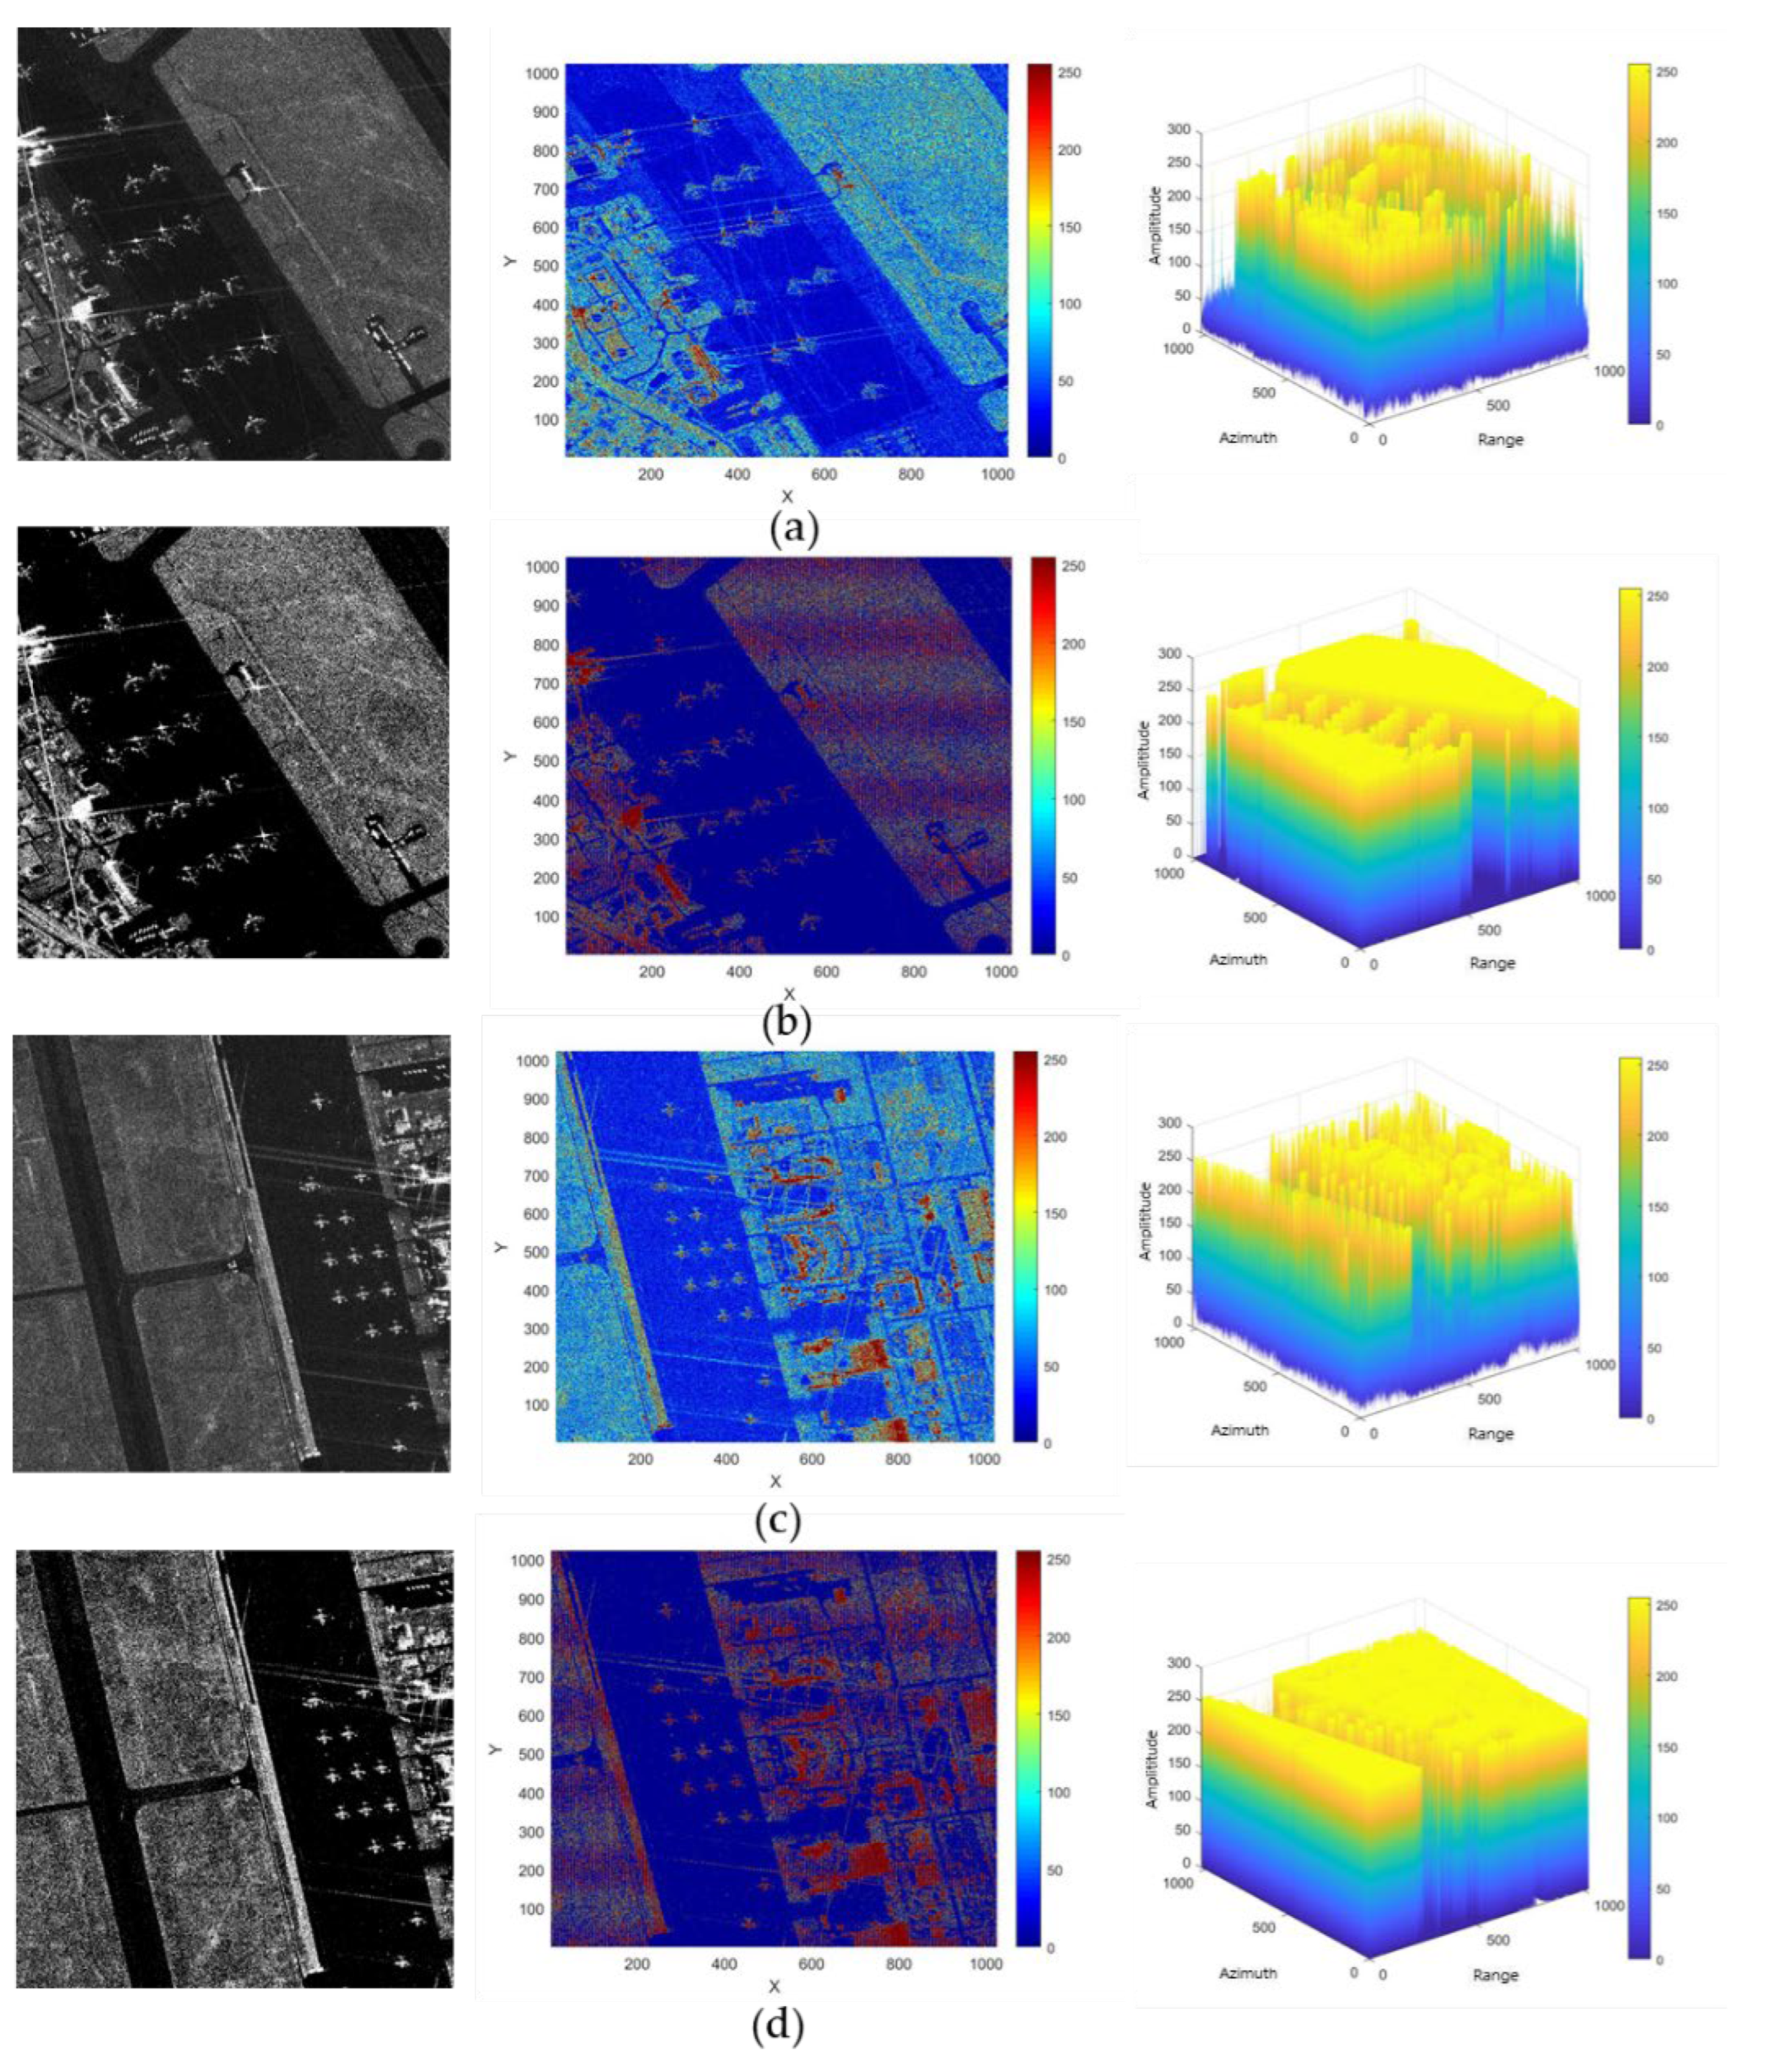
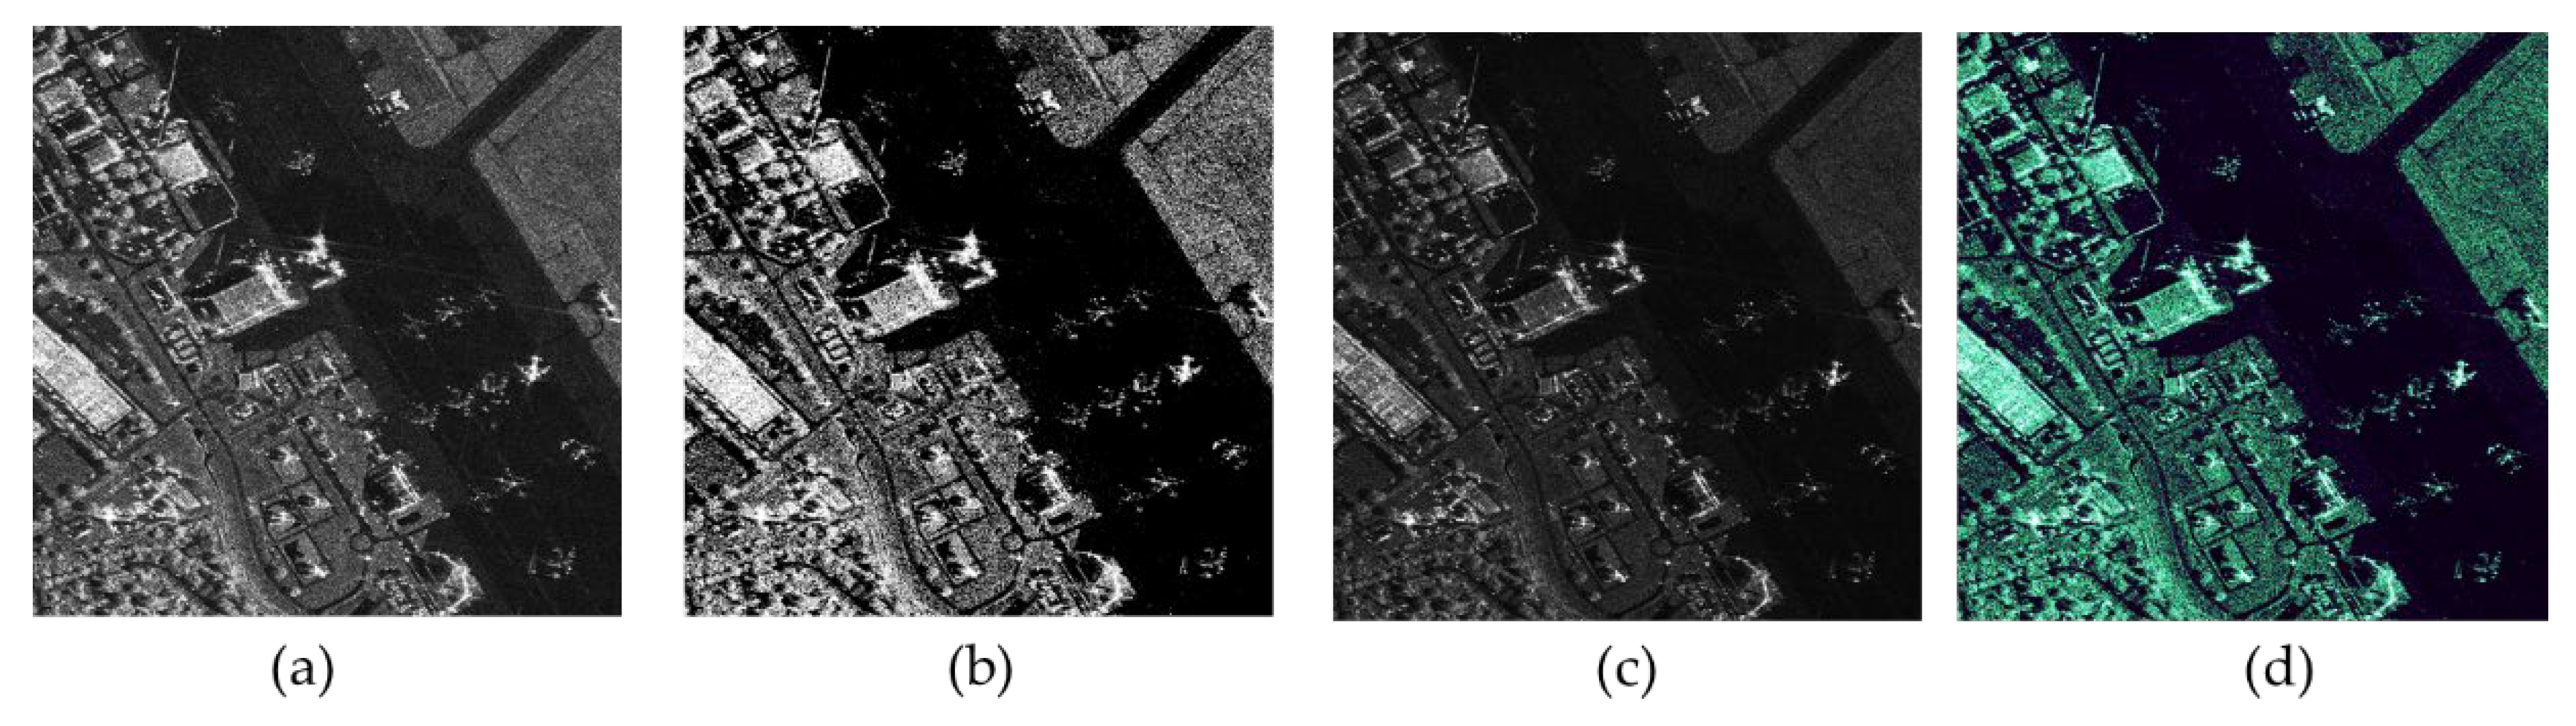
Parameters in the PFF stage: In the PFF step, for the image containing varied brightness information, the mean values of R and B channels are set to three and six empirically when the image data are processed by KTN.
Parameters in the ADN stage: the Resnet50 with DCM is taken as the backbone of the ADN, which is pre-trained on the COCO. The input size for ADN is 1000 × 1000 pixels and the basic anchor sizes for P3, P4, and P5 are set to 32, 64, and 128, respectively. The stochastic gradient descent (SGD) is applied to train the model with a batch size of eight images. The momentum and weight decay of the optimizer are given fixed values: 0.9, 0.0001, and the training steps are set to 60,000. The initial learning rate is set to 0.001 and decays to 0.0001 after 60,000 steps for the convergence of loss.
In addition, the experiment is performed on an Nvidia Titan 2080 Ti, and the configuration of the operating system environment includes Ubuntu16.04, CUDA10.1, Pytorch1.17, and Tensorflow 2.1.0.

3.2. Evaluation Metrics

To evaluate the performance of the detection task, a variety of evaluation metrics are employed in the experiment, namely, Precision ( P ), Recall ( R ), False Alarm Rate ( F A ), F 1 -score, Average Precision ( A P ), and Running Time. These metrics are computed from four well-established values measured in the experiments: True Positive ( T P ), False Positive ( F P ), False Negative ( F N ), and running time for each scene. TP represents a correctly detected target.
P = T P T P + F P
R = T P T P + F N
F A = F P T P + F P
F 1 = 2 × P × R P + R
A P = 0 1 P ( R ) d R
T P and F P represent the correctly detected objects and false alarms, respectively. F N denotes a missing target. The intersection over union (IoU) indicates the extent of overlap between the predicted bounding box and the true bounding box in the image. The value of IoU is in the range of 0 to 1. When the two bounding boxes coincide completely, the value of IoU is 1. In this experiment, if the IoU is greater than 0.5, the detected bounding box can be considered as T P .
In addition, the F 1 -score is utilized to evaluate the comprehensive performance of the proposed approach, which is defined in Formula (16). Since different precision and recall values arise at different confidence thresholds, the Precision–Recall (PR) curve is introduced to balance the two metrics, where the recall rate is the horizontal coordinate and the precision rate is the vertical coordinate. The value of A P is the area under the PR curve, which can be used for evaluating the overall effectiveness of the algorithm. The method for calculating A P is shown in the Formula (17).

3.3. Ablation Experiments

3.3.1. Effect of PFF

The effective pre-processing algorithm is beneficial to improving the performance of detection in SAR images, especially for the higher recall rate. The effectiveness of the PFF is given in Table 2. As can be seen from the table, the recall rate decreases obviously, but the precision reduces only a little bit. Fortunately, when the PFF is added, the test AP and F1 increase by 5.64% and 3.39%. The two lines in 
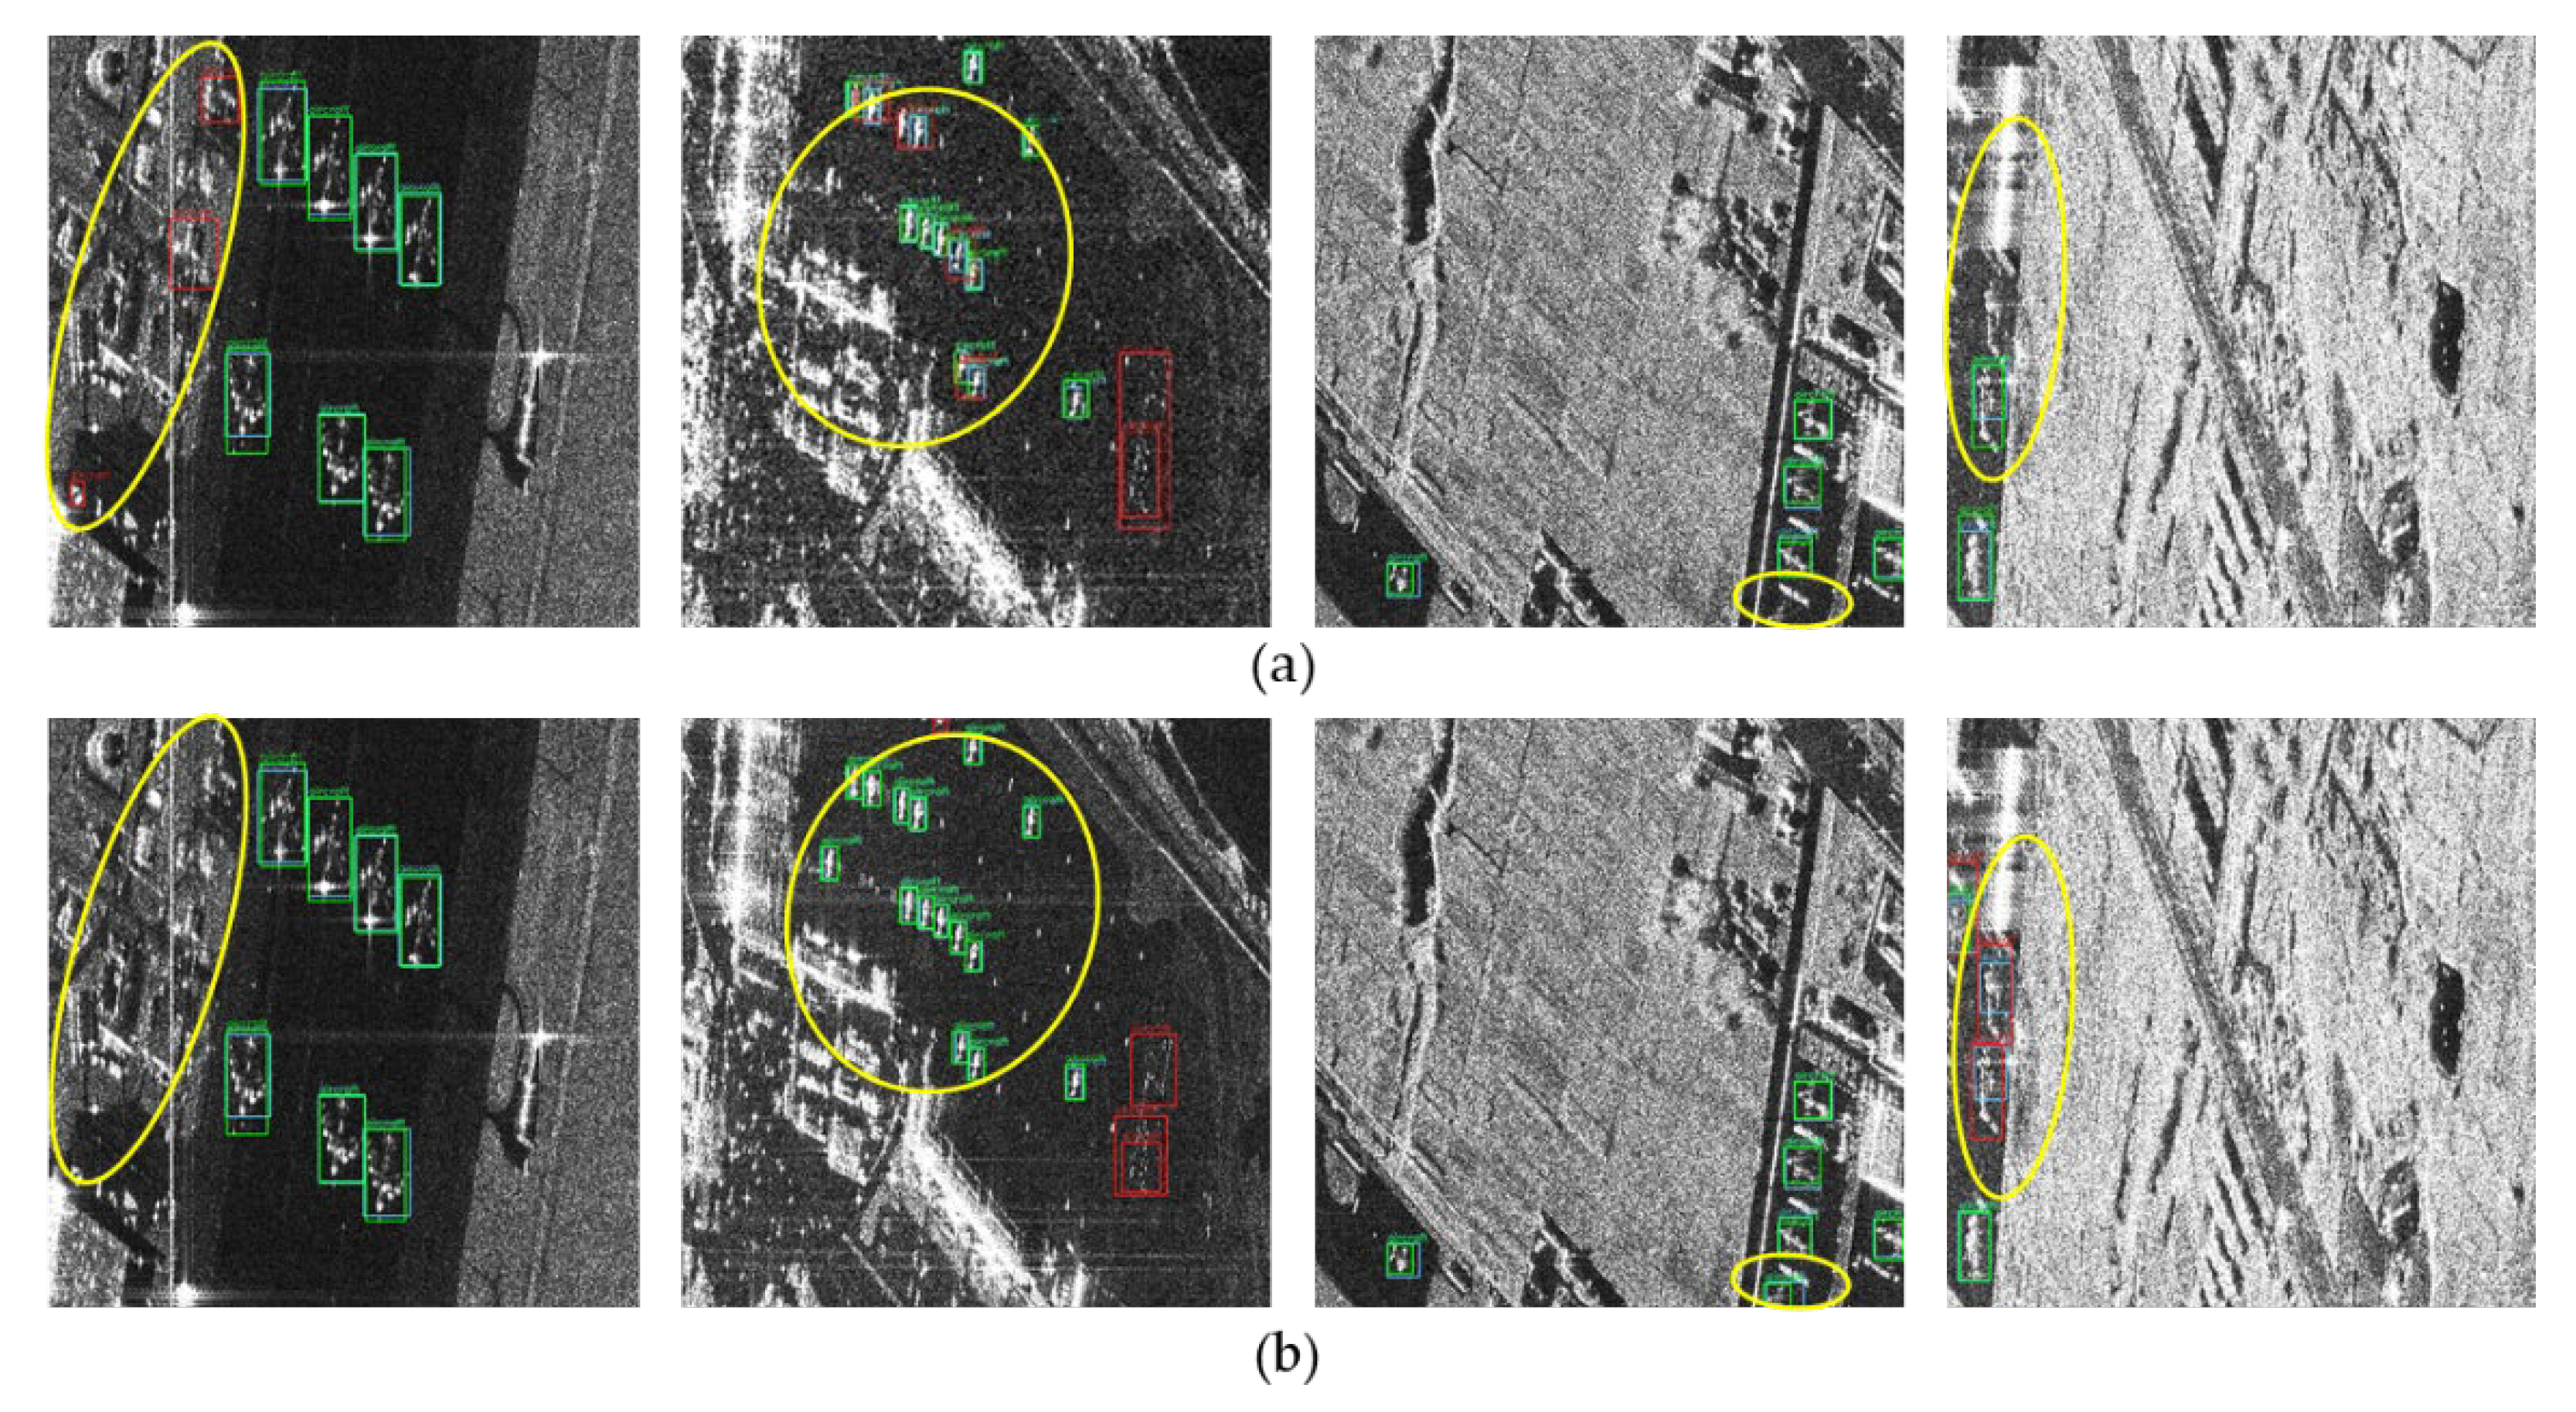
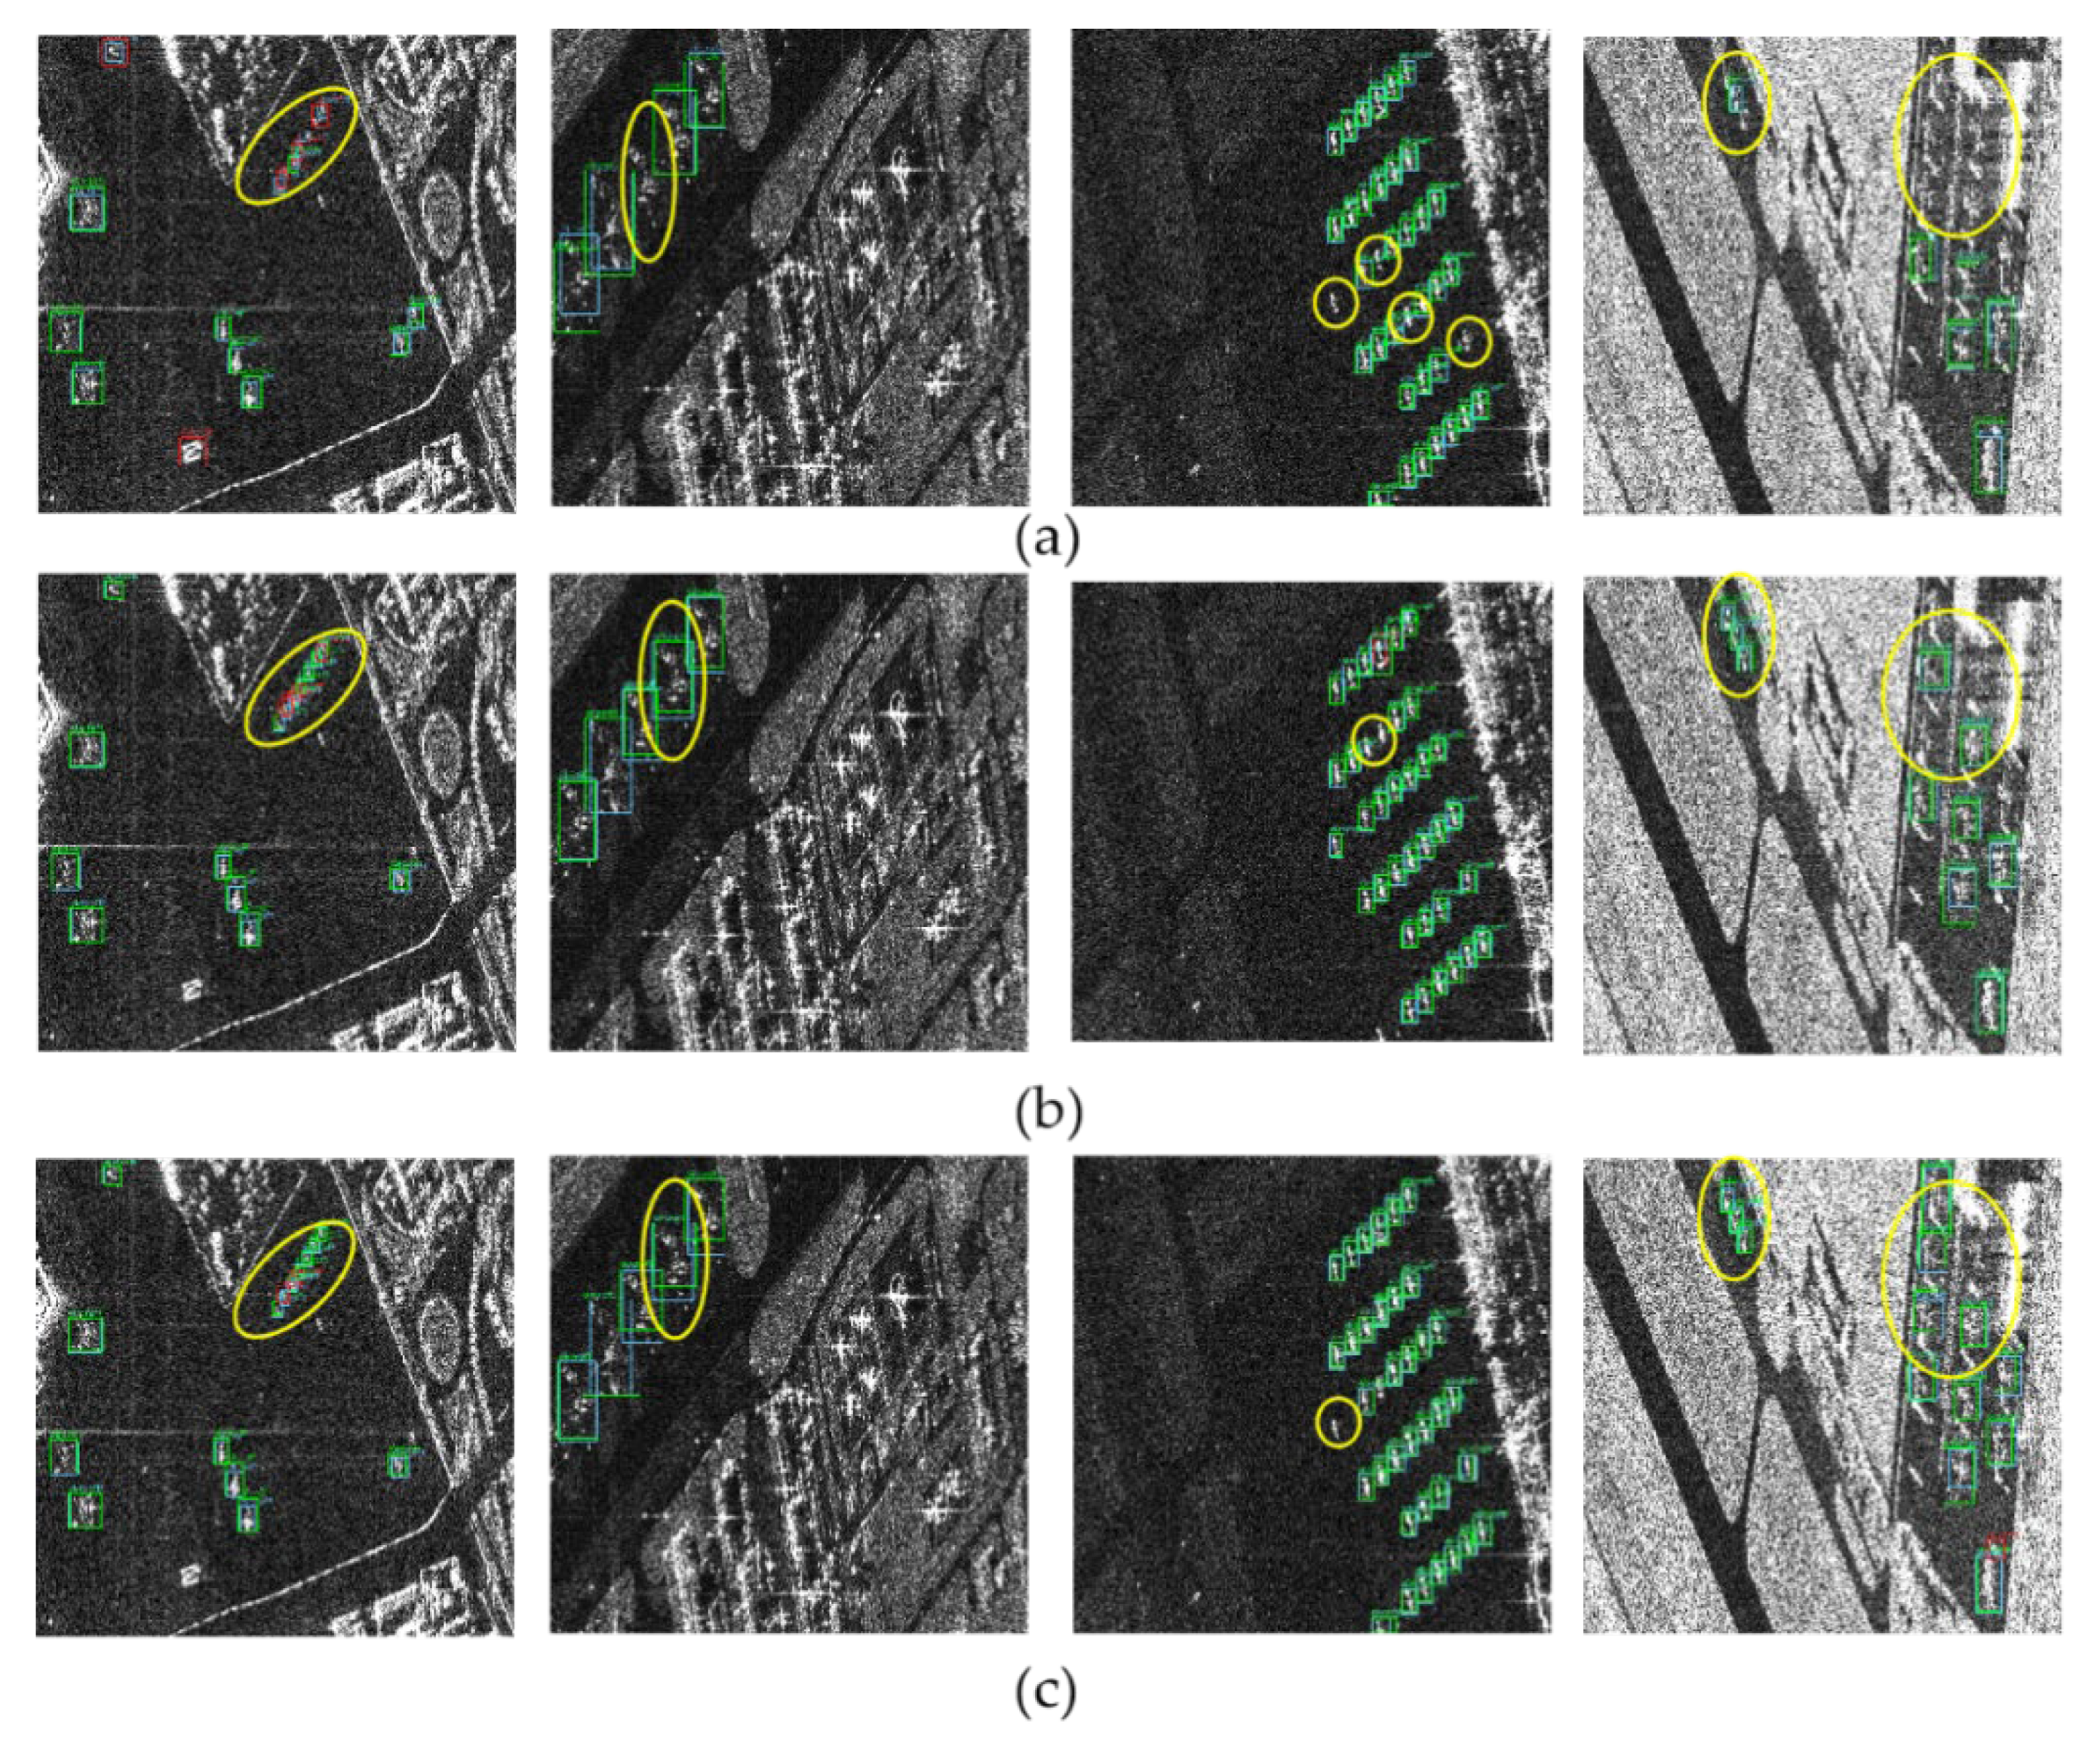
Figure 8 show the implementation results of adding PFF on the number of false alarms and detected targets through a before-and-after comparison. In the first (from left to right) column, two false alarms are suppressed. In the second column, not only are two small false alarm targets suppressed, but a small target in a densely arranged SAR scene is also detected. However, there are still two large-size false alarms that are mistaken for aircraft, even with the added PFF. The reason why the false alarms are not eliminated may be that the features of the background are enhanced along with the target. Another reason may be that the characterization ability of the detection network is insufficient. In the third column, the aircraft at the bottom of the image is also detected. In the fourth column, although the results show three more false alarms of small size, three more aircraft can be assumed to be detected. Since the bounding boxes of the detected aircraft are too large, the IoU between the detected bounding box and the true bounding box is less than 0.5, so these are considered false alarms. It can be inferred that the features from PFF are rich but redundant, leading to serious interference. In a word, the scale-invariance features of aircraft in SAR images are enhanced by adding the PFF, improving the detection performance in SAR images to a certain extent. As shown in Figure 9, the PR curve indicates the superiority of the proposed model.

3.3.2. Effect of ADN

Experiments are designed to verify the effectiveness of ADN, which contains two aspects: the ASFF and the DCM. The quantitative evaluation results of ASFF are displayed in Table 3. The precision rate and recall rate of the baseline algorithm are all increased up to 88.60% and 88.34%, respectively, by adding ASFF. The first two lines in Figure 10 show the results of adding ASFF on the number of false alarms and detected targets through a before-and-after comparison. In the first (from left to right) column, two false alarms are suppressed. In the second column, one more aircraft is detected in dense arrangements of SAR scenes. In the third column, two more aircraft are detected by adding the ASFF. However, one more false alarm appears, because the IoU is less than 0.5. The reason may be that the detection network cannot accurately extract the features of small targets. So, the DCM will be utilized to improve this condition in the next step.
In the fourth column, one more small-size aircraft and two large-size aircraft are detected. It might be inferred that the features of ASFF are rich, leading to more aircraft being detected. In a word, the detection algorithm gives full play to the characterization capabilities of the feature pyramid by adding ASFF, further improving the detection performance of multi-scale aircraft, especially for the small-size aircraft in SAR images.
Furthermore, another experiment is performed to reveal the effectiveness of DCM. As shown in Table 3, the algorithm’s performance is greatly enhanced by adding DCM. Compared to the methods without DCM, namely, * + ASFF, the method (* + ASFF + DCM) acquires a competitive advantage in terms of quantitative indicators. The recall rate is increased up to 88.34% from 90.97%. As displayed in the last two lines of Figure 10, more aircraft against a complicated background are detected in the fourth column of SAR scenes. This confirms that the deformable convolution introduced is beneficial to the fine localization of SAR aircraft. However, in the fourth column, there is still a situation in which noise is recognized as a false alarm. Encouragingly, when the DCM is added, the F 1 value increased to 88.46%, up from 89.12%. The PR curve representing the AP value is shown in Figure 9. It can be concluded from the PR curve that a great improvement in the AP value is achieved by adding the ASFF and the DCM models, respectively, demonstrating the effectiveness of each proposed model.

3.3.3. Performance of PFF-ADN

To validate the superiority of the proposed PFF-ADN further, the results are compared with those of other detectors. 
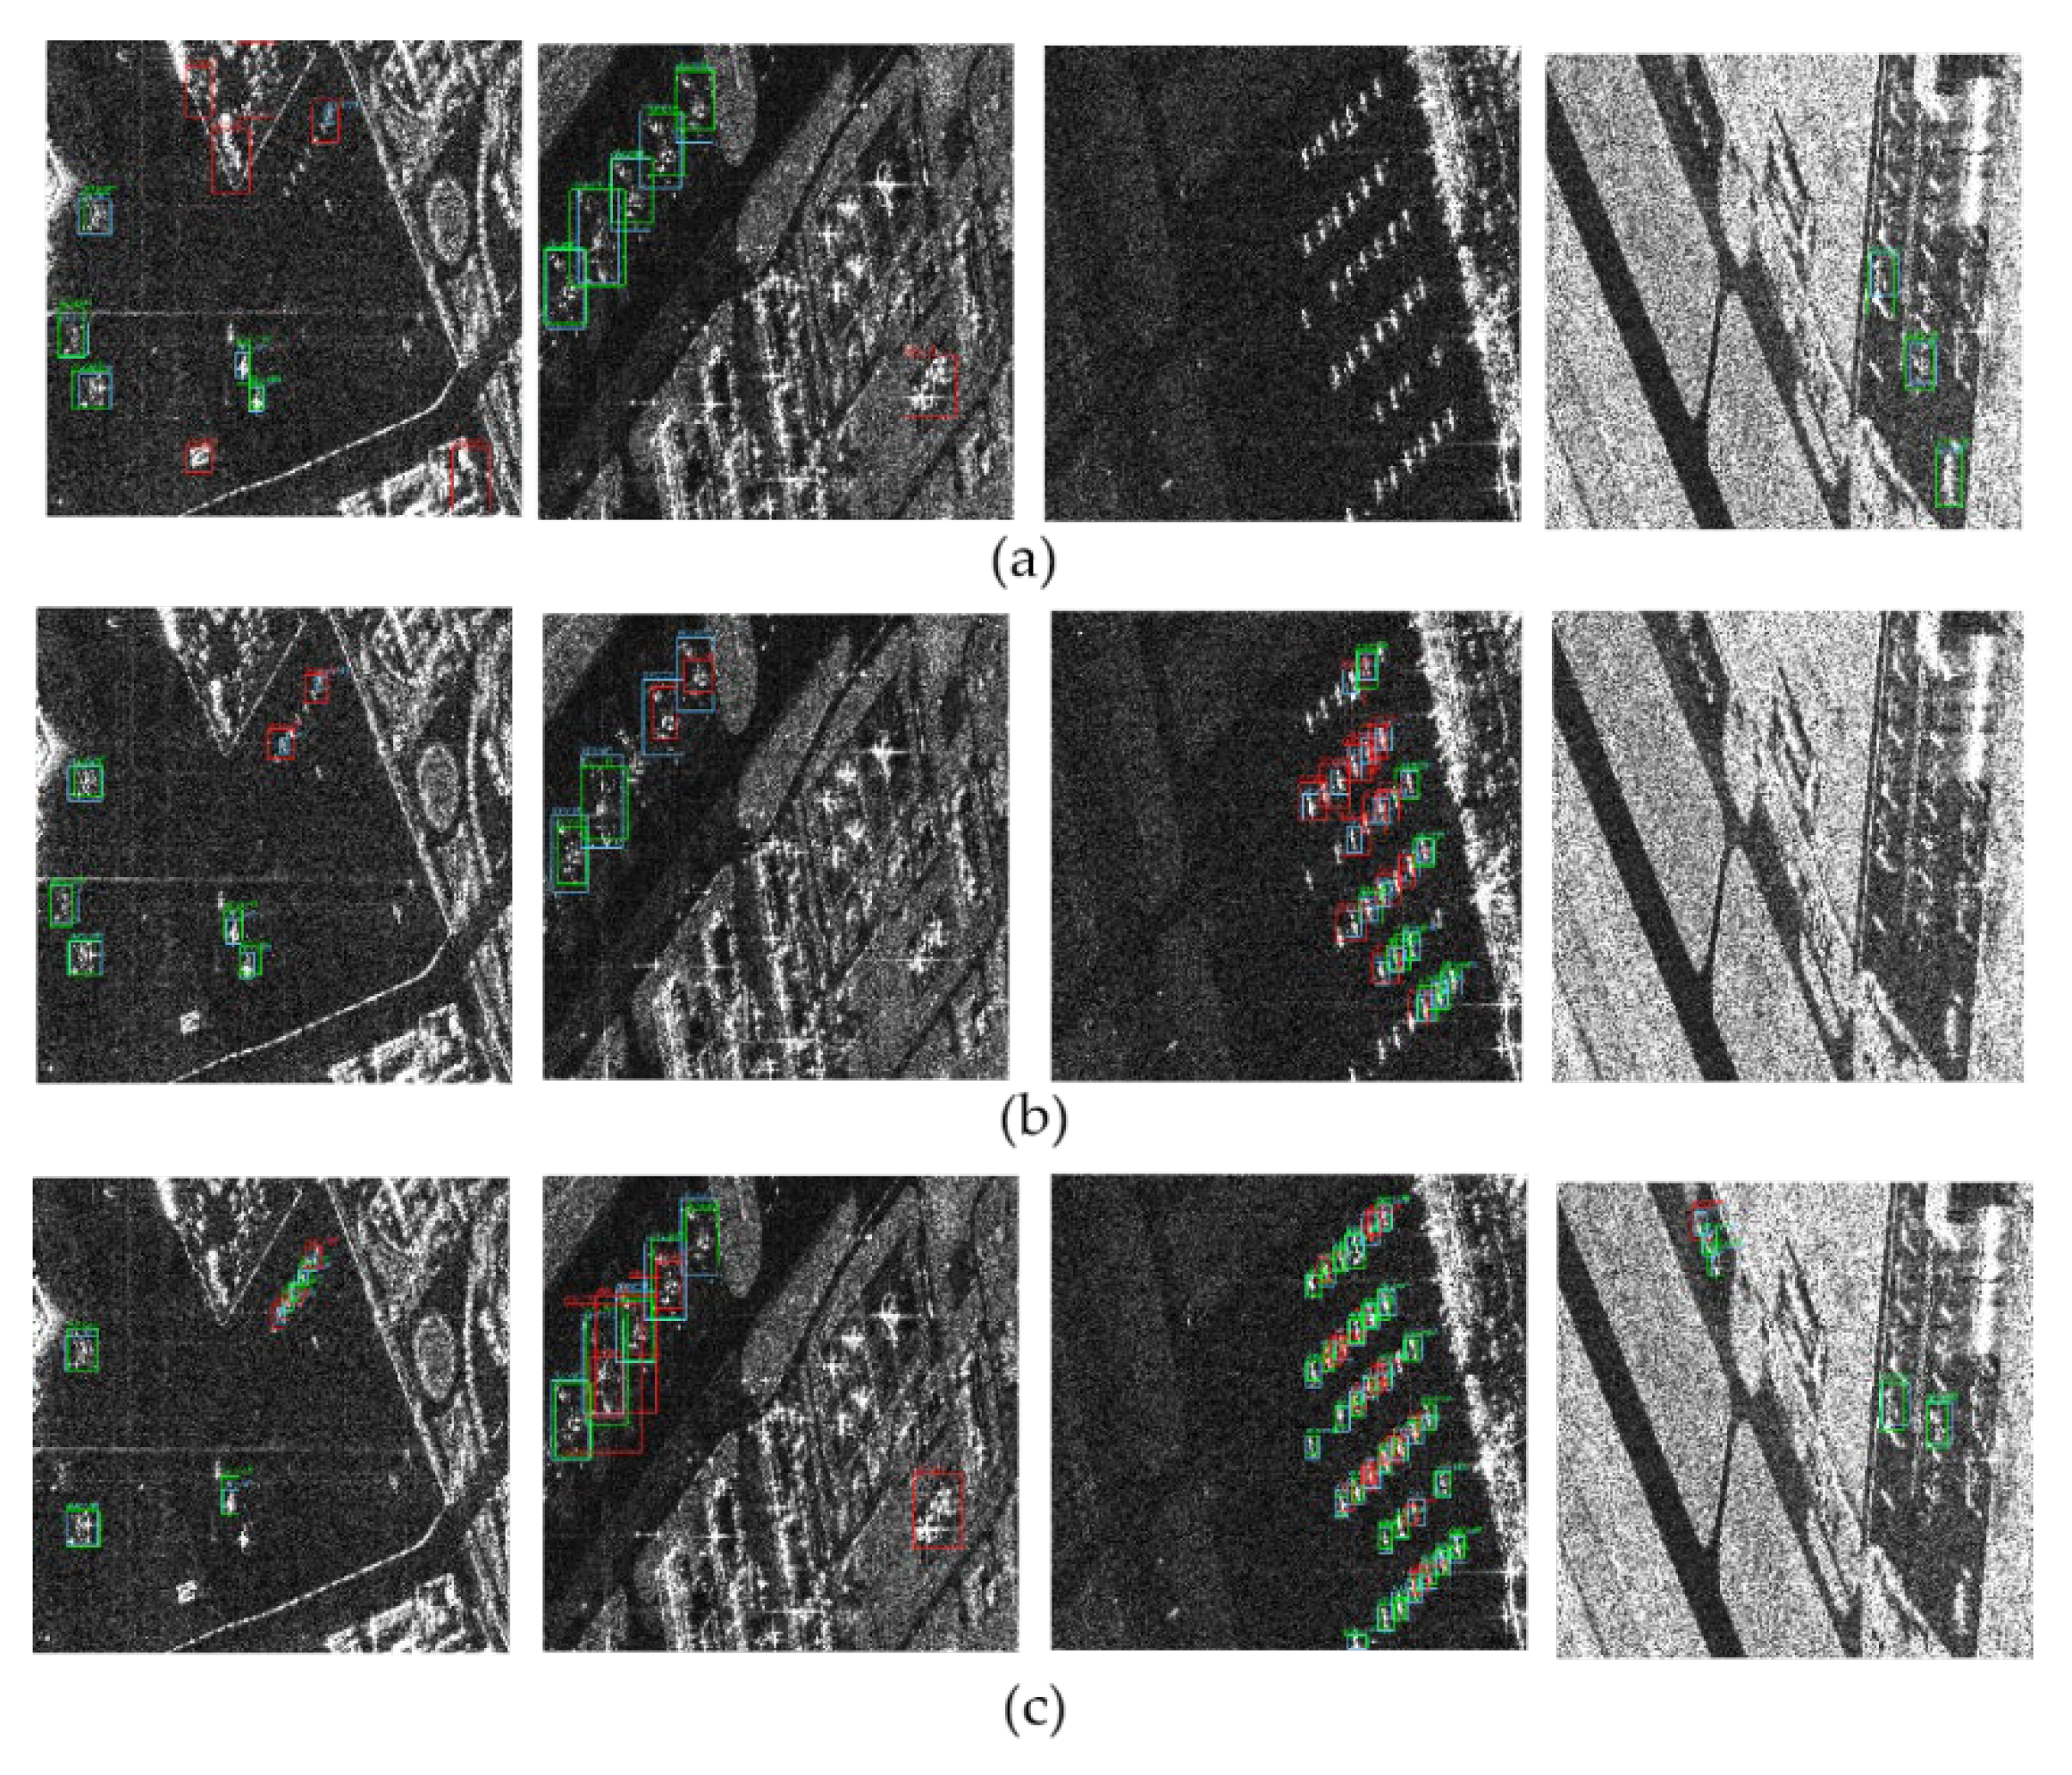
Table 4 lists the quantitative assessment results of the algorithms. All the metrics of the proposed approach have been improved greatly. Meanwhile, to better illustrate the performance of each approach, four representative images are selected to visually show the detection results of aircraft in different conditions. This is exemplified in Figure 11 A high false alarm rate and low recall rate appear in the results of lightweight algorithms, such as Yolov4-tiny and Mobile-yolov4. Besides this, in the case of small-size aircraft, the detection results of Yolov4-tiny, RFB, and FastRcnn-resnet50 are not very good. The reason why small-size aircraft are not detected is that these algorithms only utilize the high-semantic information of deeper layers to predict objects. RetinaNet adopts a feature pyramid structure that fuses the semantic information of deep features and the high-resolution information of shallow features, and then makes predictions in different feature layers, significantly improving the recall rate of small-size aircraft. However, as can be seen in the results of other detectors, there are still some aircraft missing. As such, in this paper, the PFF is proposed based on SAR image pre-processing. The PFF is employed to enhance the scattering features of aircraft in SAR images and thus catch the non-obvious features of aircraft. The ADN structure that incorporates the ASFF and the DCM is proposed as the network structure to improve accuracy. The ASFF is introduced to solve inconsistency between multi-scale features, boosting the representational capacity of the feature pyramid structure. The DCM is exploited to cope with the geometric variations or attitude sensitivity of aircraft in SAR images. The last three rows of Figure 11 show that the detection results of PFF-ADN are better than those of RetinaNet in four typical SAR scenes. In the first column, all the small-size aircraft are detected, while small-size aircraft appearing in dense arrangements are not detected in the RetinaNet. In the third column, the small-size aircraft in a dense arrangement are all detected by PFF-ADN, while two aircraft are missed by RetinaNet. In the fourth column, all aircraft are detected by PFF-ADN under complex conditions wherein both large and small aircraft exist.
To sum up, the validity of the two modules in PFF-ADN has been demonstrated by ablation experiments. All the results are presented in Table 2, Table 3 and Table 4. The algorithm we propose can not only achieve a higher recall rate, but also suppress false alarms in multiple complex conditions.
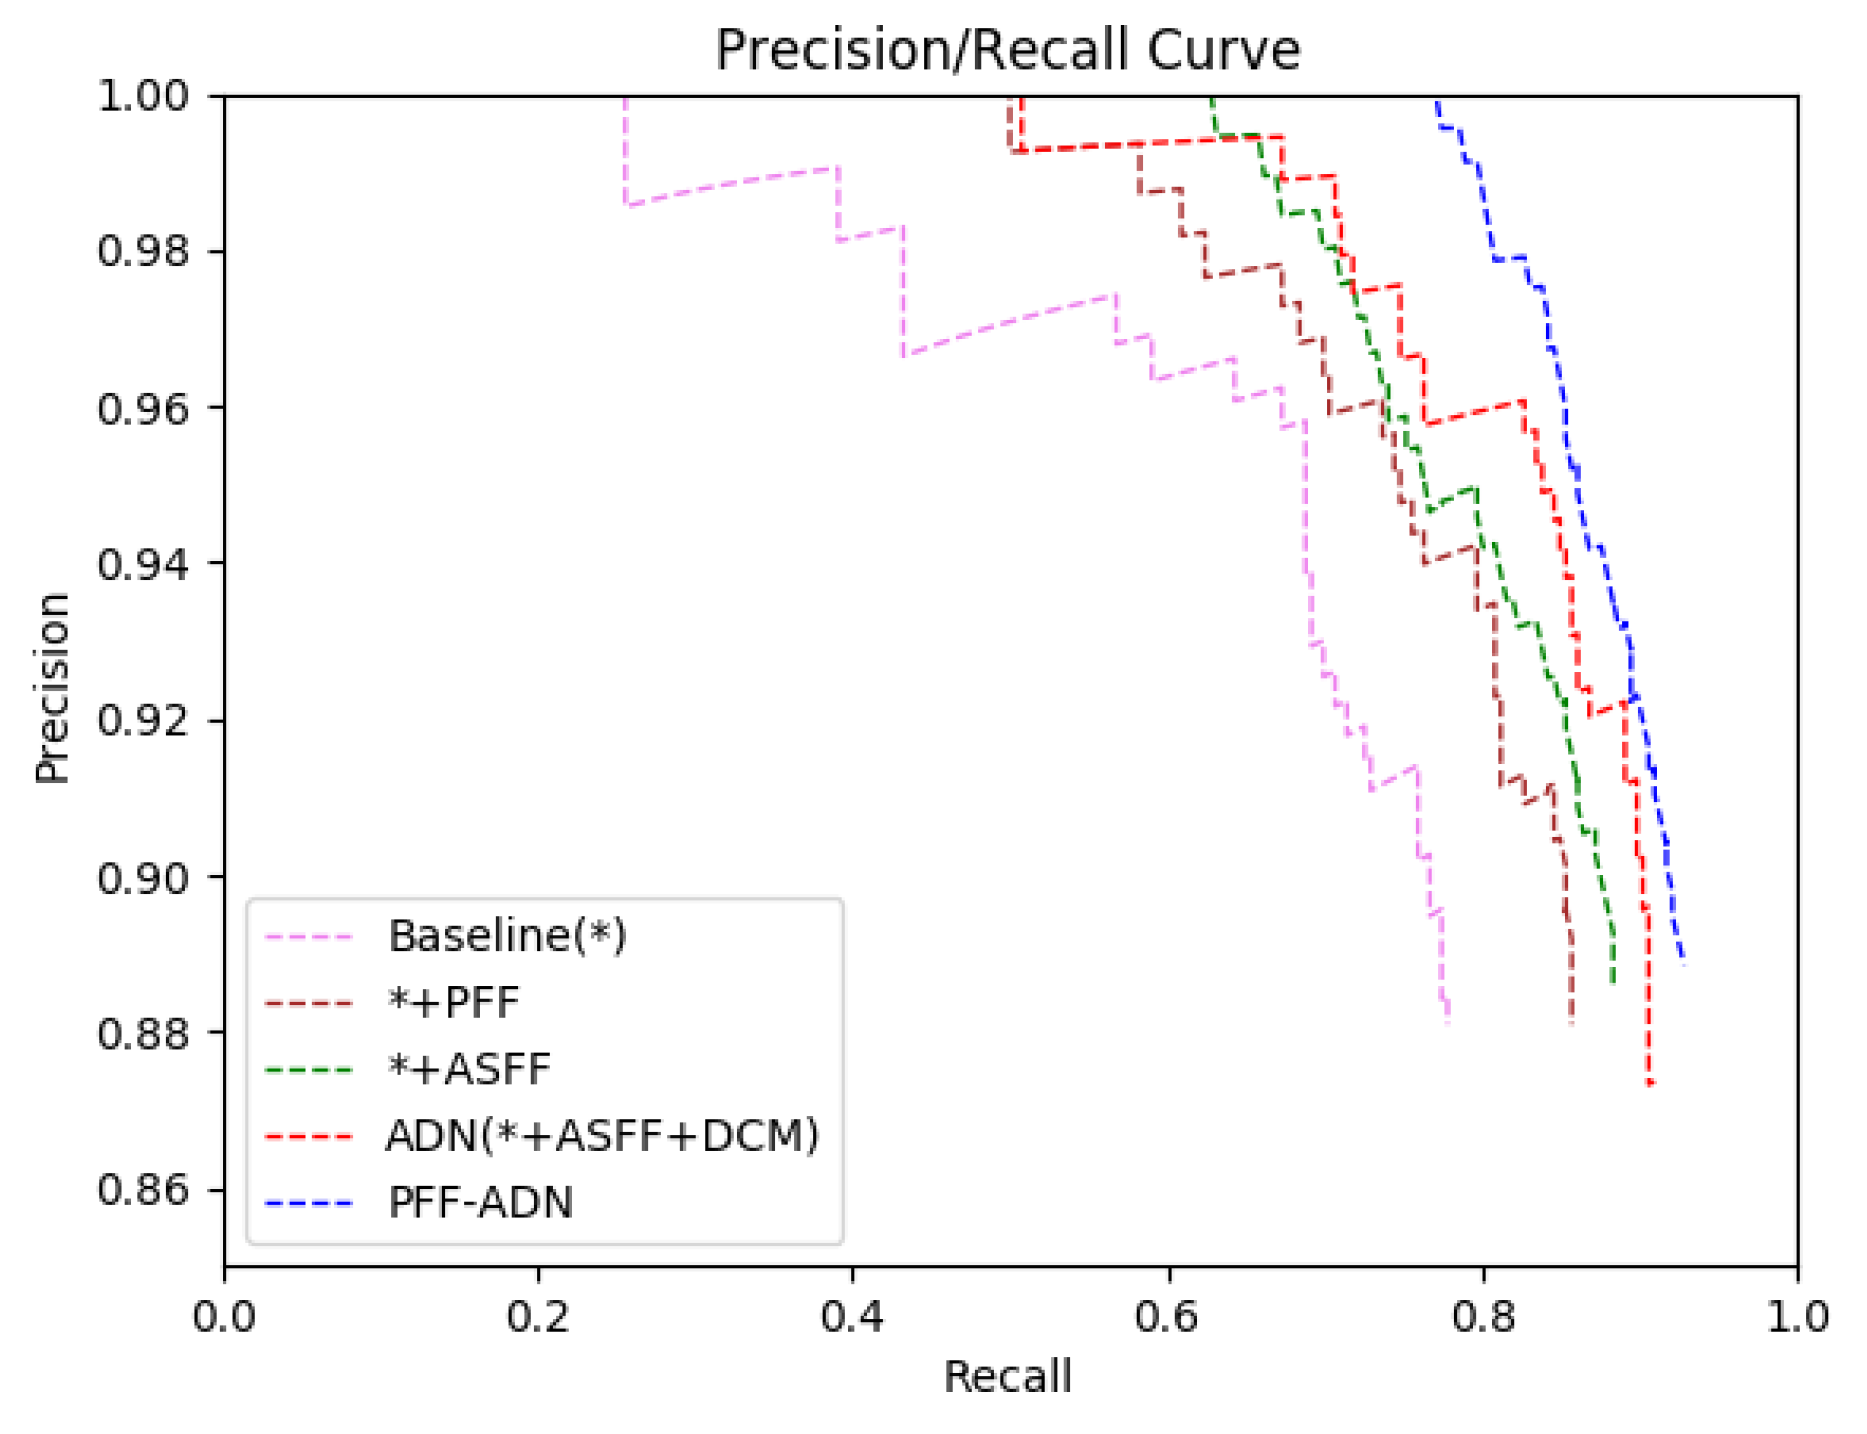
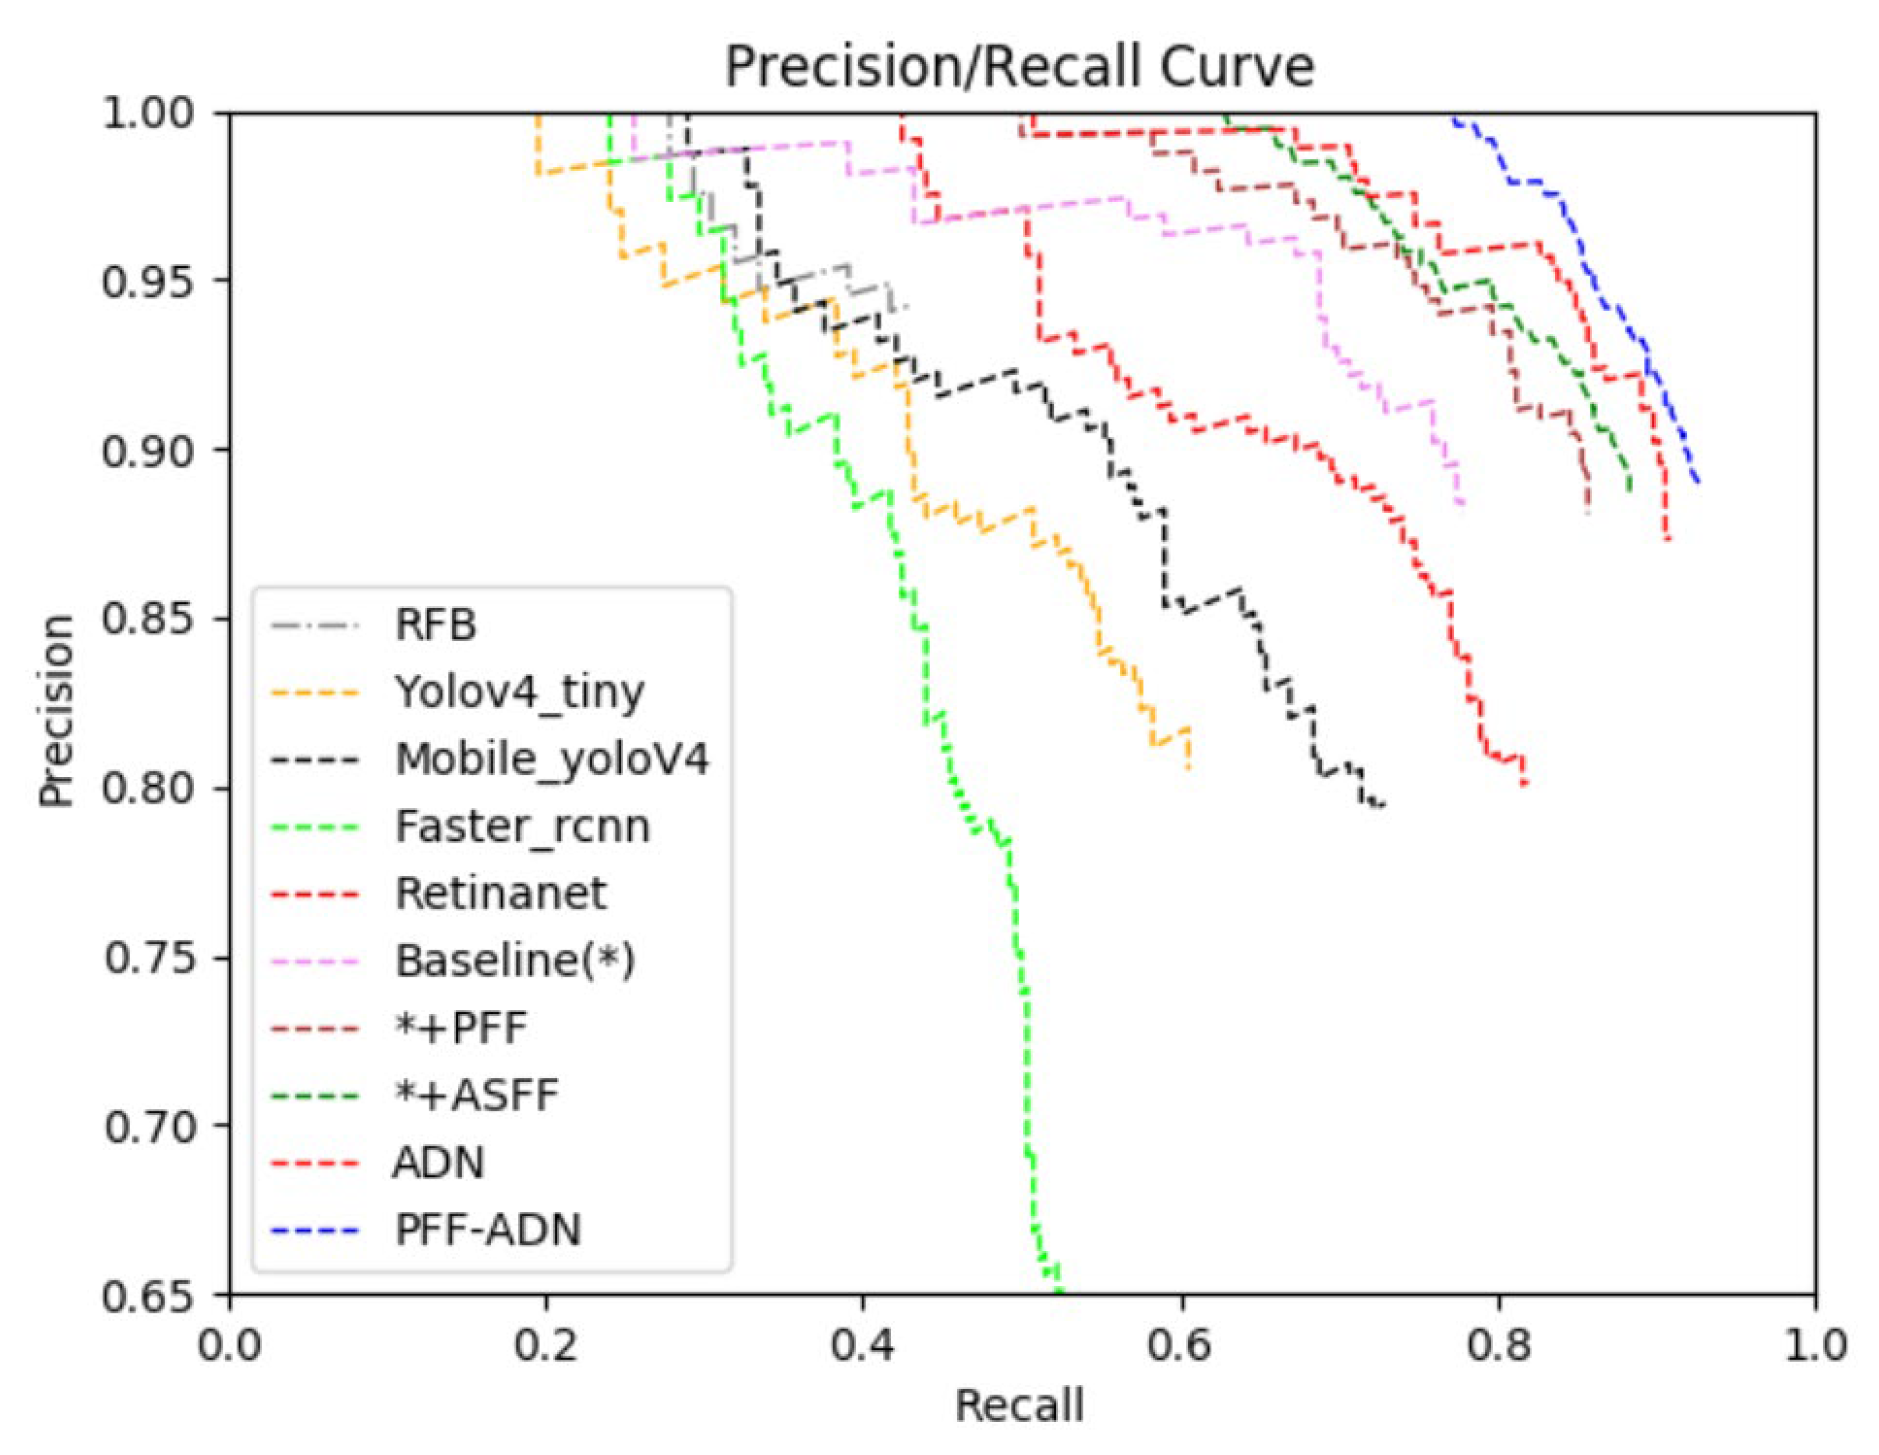
The Precision–Recall curve, which measures the detection performance of the network structure, is shown in Figure 12. The larger the area covered by the curve, the better the performance of the network structure. Therefore, in comparison with other detectors, the approach we propose achieves better detection performance in SAR images.

4. Discussion

The experimental results in Section 3.3.1 show the designed PFF is beneficial to enhance the detection performance in SAR images. To better assess the impacts, the quantitative results and visualizations are presented, demonstrating the effectiveness of the PFF. In a word, the pre-processing for SAR images is of great importance. Therefore, image pre-processing methods should be considered in practice. In the future, we can try to introduce some classical SAR image processing methods to explore their effects on SAR object interpretation based on DL.
The experimental results in Section 3.3.2 verified the effectiveness of the DCM and ASFF by ablation experiment. The precision rate and recall rate of the baseline algorithm are all increased up to 88.60% and 88.34%, respectively, by adding ASFF. It confirms that the characterization capability of the detection network is improved greatly by reconciling the inconsistency across different feature scales. The recall rate is increased up to 88.34% from 90.97% by adding the DCM. It demonstrates the DCM is conducive to fine localization by enhancing the geometric modeling abilities of aircraft in various shapes. However, ASFF and DCM requires more computation, which affects the detection efficiency. Therefore, in the future, we can explore how to achieve the balance between precision and speed in specific conditions.
To further verify the superiority of PFF-ADN, the contrast experiment with other classical detectors is conducted. The detailed results are shown in Section 3.3.3. The quantitative results and visualizations all demonstrate that the proposed method can not only achieve a higher recall rate, but also suppress false alarms in multiple complex conditions. In the future, we consider applying the proposed method to remote sensing large-scale images, paving the way for practical application.

5. Conclusions

A novel approach called PFF-ADN for aircraft detection under different arrangements of SAR images is proposed in this paper. This method improves detection performance by combining the classical feature extraction methods with DL approaches. Firstly, an effective image preprocessing approach (PFF) is outlined, in which the features of the target in the image are enhanced by the extraction of peak features and multi-channel data fusion. It is beneficial for handling incomplete scattering and ambiguous characteristics in SAR images. Secondly, in the ADN phase, a new topology of the network composed of ASFF and DCM is proposed to tackle the multiple scales and attitude sensitivity. The ASFF optimizes the characterization capabilities of the network by reconciling the inconsistency across different feature scales, which facilitates the detection of multi-scale aircraft, especially small-size aircraft. The DCM refines the geometric variation capacity of the detection network, which contributes to the handling of the attitude sensitivity and the various shapes of aircraft in SAR images. The satisfactory results of the ablation experiments on the GF3 datasets demonstrate the effectiveness of each proposed module. Meanwhile, detailed comparisons with various methods have also verified the superiority of the proposed algorithm in various circumstances.
In the future, a tight combination between network design and intrinsic properties of aircraft in SAR images need to be considered. In addition, in order to promote the application as soon as possible, it is also very important to carry out SAR object detection under the SAR large-scale scenarios.

Author Contributions

Conceptualization, X.X.; methodology, X.X. and H.J.; software, X.X. and H.J.; validation, X.X.; investigation, X.X.; resources, H.J.; data curation, P.X.; writing—original draft preparation, X.X.; writing—review and editing, H.J. and H.W.; visualization, X.X.; supervision, H.W.; funding acquisition, H.W. All authors have read and agreed to the published version of the manuscript.

Funding

This work was supported in part by the National Natural Science Foundation of China (Grant No. 62271153) and the Natural Science Foundation of Shanghai (Grant No. 22ZR1406700).

Acknowledgments

The authors would like to thanks to the anonymous reviewers.

Conflicts of Interest

The authors declare no conflict of interest.

Nomenclature

SARSynthetic Aperture Radar
CFARConstant False Alarm Rate
CACell-Averaging
DLDeep Learning
SCRSignal to Clutter Ratio
SOCASmallest of Cell-Averaging
GOCAGreatest of Cell-Averaging
OSOrdered Statistic
VIVariability Index
PFEPeak Feature Extraction
PFFPeak Feature Fusion
ADNAdaptive Deformable Network
ASFFAdaptive Spatial Feature Fusion
DCMDeformable Convolution Module
GLRTGeneralized Likelihood Ratio Test
KTNK-Times to Truncate and Normalize
FPNFeature Pyramid Network
GF3GaoFen-3
IoUIntersection Over Union
PRPower Ring

References

  1. Zhu, X.X.; Tuia, D.; Mou, L.C.; Xia, G.S.; Zhang, L.P.; Xu, F.; Fraundorfer, F. Deep Learning in Remote Sensing: A Comprehensive Review and List of Resources. IEEE Geosci. Remote Sens. Mag. 2017, 5, 8–36. [Google Scholar] [CrossRef] [Green Version]
  2. Xu, G.; Zhang, B.; Yu, H.W.; Chen, J.L.; Xing, M.D.; Hong, W. Sparse Synthetic Aperture Radar Imaging from Compressed Sensing and Machine Learning: Theories, Applications and Trends. IEEE Geosci. Remote Sens. Mag. 2022, 12, 1–26. [Google Scholar] [CrossRef]
  3. Steenson, B.O. Detection performance of a mean-level threshold. IEEE Trans. Aerosp. Electron. Syst. 1968, AES-4, 529–534. [Google Scholar] [CrossRef]
  4. Finn, H.M. Adaptive detection mode with threshold control as a function of spatially sampled clutter-level estimates. RCA Rev. 1968, 29, 414–465. [Google Scholar]
  5. Hansen, V.G. Constant false alarm rate processing in search radars. In Proceedings of the IEEE Conference Publication No. 105, “Radar-Present and Future”, London, UK, 23–25 October 1973; pp. 325–332. [Google Scholar]
  6. Trunk, G.V. Range resolution of targets using automatic detectors. IEEE Trans. Aerosp. Electron. Syst. 1978, AES-4, 750–755. [Google Scholar] [CrossRef]
  7. Kuttikkad, S.; Chellappa, R. Non-Gaussian CFAR techniques for target detection in high resolution SAR images. In Proceedings of the 1st International Conference on Image Processing, Austin, TX, USA, 13–16 November 1994; Volume 1, pp. 910–914. [Google Scholar]
  8. Smith, M.E.; Varshney, P.K. VI-CFAR: A novel CFAR algorithm based on data variability. In Proceedings of the 1997 IEEE National Radar Conference, Syracuse, NY, USA, 13–15 May 1997; pp. 263–268. [Google Scholar]
  9. Conte, E.; Lops, M.; Ricci, G. Radar detection in K-distributed clutter. IEE Proc. Radar Sonar Navig. 1994, 141, 116–118. [Google Scholar] [CrossRef]
  10. Lombardo, P.; Sciotti, M.; Kaplan, L.M. SAR prescreening using both target and shadow information. In Proceedings of the 2001 IEEE Radar Conference (Cat. No. 01CH37200), Atlanta, GA, USA, 3 May 2001; pp. 147–152. [Google Scholar]
  11. Yu, Y.; Wang, B.; Zhang, L. Hebbian-based neural networks for bottom-up visual attention and its applications to ship detection in SAR images. Neurocomputing 2011, 74, 2008–2017. [Google Scholar] [CrossRef]
  12. El-Darymli, K.; Moloney, C.; Gill, E.; McGuire, P.; Power, D.; Deepakumara, J. Nonlinearity and the effect of detection on single-channel synthetic aperture radar imagery. In Proceedings of the OCEANS 2014-TAIPEI, Taipei, Taiwan, 7–10 April 2014; pp. 1–7. [Google Scholar]
  13. Gu, D.; Xu, X. Multi-feature extraction of ships from SAR images. In Proceedings of the 2013 6th International Congress on Image and Signal Processing (CISP), Hangzhou, China, 16–18 December 2013; Volume 1, pp. 454–458. [Google Scholar]
  14. Kaplan, L.M.; Murenzi, R.; Namuduri, K.R. Extended fractal feature for first-stage SAR target detection. In Proceedings of the Algorithms for Synthetic Aperture Radar Imagery VI, Orlando, FL, USA, 5–9 April 1999; SPIE: Bellingham, WA, USA, 1999; Volume 3721, pp. 35–46. [Google Scholar]
  15. Kaplan, L.M. Improved SAR target detection via extended fractal features. IEEE Trans. Aerosp. Electron. Syst. 2001, 37, 436–451. [Google Scholar] [CrossRef]
  16. Ren, S.; He, K.; Girshick, R.; Sun, J. Faster R-CNN: Towards Real-Time Object Detection with Region Proposal Networks. IEEE Trans. Pattern Anal. Mach. Intell. 2017, 39, 1137–1149. [Google Scholar] [CrossRef] [PubMed] [Green Version]
  17. Redmon, J.; Divvala, S.; Girshick, R.; Farhadi, A. You only look once: Unified, real-time object detection. In Proceedings of the IEEE Conference on Computer Vision and Pattern Recognition, Las Vegas, NV, USA, 27–30 June 2016; pp. 779–788. [Google Scholar]
  18. Lin, T.Y.; Dollár, P.; Girshick, R.; He, K.; Hariharan, B.; Belongie, S. Feature pyramid networks for object detection. In Proceedings of the IEEE Conference on Computer Vision and Pattern Recognition, Honolulu, HI, USA, 21–26 July 2017; pp. 2117–2125. [Google Scholar]
  19. Law, H.; Deng, J. Cornernet: Detecting objects as paired keypoints. In Proceedings of the European Conference on Computer Vision (ECCV), Munich, Germany, 8–14 September 2018; pp. 734–750. [Google Scholar]
  20. Zhou, X.Y.; Zhuo, J.C.; Krhenbühl, P. Bottom-up Object Detection by Grouping Extreme and Center Points. In Proceedings of the IEEE/CVF Conference on Computer Vision and Pattern Recognition, Long Beach, CA, USA, 15–20 June 2019; pp. 850–859. [Google Scholar]
  21. Tian, Z.; Shen, C.; Chen, H.; He, T. FCOS: Fully Convolutional One-Stage Object Detection. In Proceedings of the 2019 IEEE/CVF International Conference on Computer Vision (ICCV), Seoul, Republic of Korea, 27–28 October 2019; pp. 9627–9636. [Google Scholar]
  22. Zhou, X.Y.; Wang, D.Q.; Krähenbühl, P. Objects as points. arXiv 2019, arXiv:1904.07850. [Google Scholar]
  23. He, K.; Gkioxari, G.; Dollár, P.; Girshick, R. Mask R-CNN. In Proceedings of the 2017 IEEE International Conference on Computer Vision (ICCV), Venice, Italy, 22–29 October 2017; pp. 2980–2988. [Google Scholar] [CrossRef]
  24. Liu, W.; Anguelov, D.; Erhan, D.; Szegedy, C. Ssd: Single shot multibox detector. In Proceedings of the European Conference on Computer Vision, Amsterdam, The Netherlands, 11–14 October 2016; pp. 21–37. [Google Scholar]
  25. Guo, Q.; Wang, H.; Xu, F. Scattering Enhanced Attention Pyramid Network for Aircraft Detection in SAR Images. IEEE Trans. Geosci. Remote Sens. 2020, 59, 7570–7587. [Google Scholar] [CrossRef]
  26. Fu, K.; Fu, J.; Wang, Z.; Sun, X. Scattering-keypoint-guided network for oriented ship detection in high-resolution and large-scale SAR images. IEEE J. Sel. Top. Appl. Earth Obs. Remote Sens. 2021, 14, 11162–11178. [Google Scholar] [CrossRef]
  27. Harris, C.; Stephens, M. A combined corner and edge detector. In Proceedings of the Alvey Vision Conference, Manchester, UK, 31 August–2 September 1988; Volume 15, pp. 10–5244. [Google Scholar]
  28. Wang, S.Y.; Gao, X.; Sun, H.; Zheng, X.W.; Sun, X. An aircraft detection method based on convolutional neural networks in high-resolution SAR images. J. Radars 2017, 6, 195–203. [Google Scholar] [CrossRef]
  29. Zhang, L.; Li, C.; Zhao, L.; Xiong, B.; Quan, S.; Kuang, G. A cascaded three-look network for aircraft detection in SAR images. Remote Sens. Lett. 2020, 11, 57–65. [Google Scholar] [CrossRef]
  30. Zhao, Y.; Zhao, L.; Li, C.; Kuang, G. Pyramid Attention Dilated Network for Aircraft Detection in SAR Images. IEEE Geosci. Remote Sens. Lett. 2020, 18, 662–666. [Google Scholar] [CrossRef]
  31. He, C.; Tu, M.; Xiong, D.; Tu, F.; Liao, M. Adaptive Component Selection-Based Discriminative Model for Object Detection in High-Resolution SAR Imagery. Int. J. Geo-Inf. 2018, 7, 72. [Google Scholar] [CrossRef] [Green Version]
  32. Dou, F.; Diao, W.; Sun, X.; Zhang, Y.; Fu, K. Aircraft reconstruction in high-resolution SAR images using deep shape prior. ISPRS Int. J. Geo-Inf. 2017, 6, 330. [Google Scholar] [CrossRef] [Green Version]
  33. Imbert, J.; Dashyan, G.; Goupilleau, A.; Ceillier, T.; Corbineau, M.C. Improving performance of aircraft detection in satellite imagery while limiting the labelling effort: Hybrid active learning. In Proceedings of the 2021 IEEE International Geoscience and Remote Sensing Symposium IGARSS, Brussels, Belgium, 11–16 July 2021; pp. 220–223. [Google Scholar]
  34. Han, P.; Lu, B.; Zhou, B.; Han, B. Aircraft Target Detection in Polsar Image based on Region Segmentation and Multi-Feature Decision. In Proceedings of the IGARSS 2020—2020 IEEE International Geoscience and Remote Sensing Symposium, Waikoloa, HI, USA, 26 September–2 October 2020; pp. 2201–2204. [Google Scholar]
  35. Jia, H.; Guo, Q.; Chen, J.; Wang, F.; Wang, H.; Xu, F. Adaptive Component Discrimination Network for Airplane Detection in Remote Sensing Images. IEEE J. Sel. Top. Appl. Earth Obs. Remote Sens. 2021, 14, 7699–7713. [Google Scholar] [CrossRef]
  36. Kang, Y.; Wang, Z.; Fu, J.; Sun, X.; Fu, K. SFR-Net: Scattering Feature Relation Network for Aircraft Detection in Complex SAR Images. IEEE Trans. Geosci. Remote Sens. 2022, 60, 5218317. [Google Scholar] [CrossRef]
  37. Zhao, Y.; Zhao, L.; Liu, Z.; Hu, D.; Kuang, G.; Liu, L. Attentional Feature Refinement and Alignment Network for Aircraft Detection in SAR Imagery. arXiv 2022, arXiv:2201.07124. [Google Scholar] [CrossRef]
  38. Bi, H.; Yao, J.; Wei, Z.; Hong, D.; Chanussot, J. PolSAR image classification based on robust low-rank feature extraction and Markov random field. IEEE Geosci. Remote Sens. Lett. 2020, 19, 1–5. [Google Scholar] [CrossRef]
  39. Margt, G.; Mallorqui, J.J.; Rius, J.M.; Sanz-Marcos, J. On the usage of GRECOSAR, an orbital polarimetric SAR simulator of complex targets, to vessel classification studies. IEEE Trans. Geosci. Remote Sens. 2006, 44, 3517–3526. [Google Scholar] [CrossRef]
  40. Margarit, G.; Mallorqui, J. Assessment of polarimetric SAR interferometry for improving ship classification based on simulated data. Sensors 2008, 8, 7715–7735. [Google Scholar] [CrossRef] [PubMed] [Green Version]
  41. Margarit, G.; Tabasco, A. Ship classification in single-pol SAR images based on fuzzy logic. IEEE Trans. Geosci. Remote Sens. 2011, 49, 3129–3138. [Google Scholar] [CrossRef]
  42. Xu, G.; Zhang, B.J.; Chen, J.L.; Hong, W. Structured Low-rank and Sparse Method for ISAR Imaging with 2D Compressive Sampling. IEEE Trans. Geosci. Remote Sens. 2022; early access. [Google Scholar]
  43. Gao, J.; Gao, X.; Sun, X. Geometrical Features-based Method for Aircraft Target Interpretation in High-resolution SAR Images. Foreign Electron. Meas. Technol. 2015, 34, 21–28. [Google Scholar]
  44. Chen, J.; Zhang, B.; Wang, C. Backscattering feature analysis and recognition of civilian aircraft in TerraSAR-X images. IEEE Geosci. Remote Sens. Lett. 2014, 12, 796–800. [Google Scholar] [CrossRef]
  45. Zhu, J.W.; Qiu, X.L.; Pan, Z.X.; Zhang, Y.T.; Lei, B. An improved shape contexts based ship classification in SAR images. Remote Sens. 2017, 9, 145. [Google Scholar] [CrossRef] [Green Version]
  46. Iii, G.J.; Bhanu, B. Recognizing articulated objects in SAR images. Pattern Recognit. 2001, 34, 469–485. [Google Scholar] [CrossRef]
  47. Guo, Q.; Wang, H.; Xu, F. Research progress on aircraft detection and recognition in SAR imager. J. Radars 2020, 9, 497–513. [Google Scholar]
  48. Lin, T.Y.; Maire, M.; Belongie, S.; Hays, J.; Perona, P.; Ramanan, D.; Dollár, P.; Zitnick, C.L. Microsoft COCO: Common Objects in Context; Springer International Publishing: Zurich, Switzerland, 2014. [Google Scholar]
  49. Dai, J.; Qi, H.; Xiong, Y.; Li, Y.; Zhang, G.; Hu, H.; Wei, Y. Deformable convolutional networks. In Proceedings of the IEEE International Conference on Computer Vision, Venice, Italy, 22–29 October 2017; pp. 764–773. [Google Scholar]
  50. He, K.; Zhang, X.; Ren, S.; Sun, J. Deep residual learning for image recognition. In Proceedings of the IEEE Conference on Computer Vision and Pattern Recognition, Las Vegas, NV, USA, 27–30 June 2016; pp. 770–778. [Google Scholar]
  51. Zhu, X.; Hu, H.; Lin, S.; Dai, J. Deformable ConvNets V2: More Deformable, Better Results. In Proceedings of the 2019 IEEE/CVF Conference on Computer Vision and Pattern Recognition (CVPR), Long Beach, CA, USA, 16–20 June 2019; pp. 1–13. [Google Scholar]
  52. Liu, S.; Huang, D.; Wang, Y. Learning Spatial Fusion for Single-Shot Object Detection. arXiv 2019, arXiv:1911.09516. [Google Scholar]
Figure 1. Overview of the PFF-ADN framework. The proposed method mainly comprises the PFF stage and ADN stage. The PFF stage aims to enhance the saliency of the aircraft target in SAR images by fusing the peak features of the aircraft into the image. The ADN is the detection network based on DL, which generates the final detection results.
Remotesensing 14 06077 g001
Figure 2. Scattering mechanism of aircraft in SAR images. (a) Scattering mechanism analysis of core components of aircraft. (b) SAR image of aircraft (c) Optical image of aircraft.
Remotesensing 14 06077 g002
Figure 3. Peak feature extraction of aircraft in SAR images. (a,d,g): SAR image of aircraft; (b,e,h): 3-dimensional maps of aircraft; (c,f,i): Extraction results of peak points.
Remotesensing 14 06077 g003
Figure 4. Peak feature extraction and enhancement of SAR images. (a,c) The three views, from left to right, are the original SAR images, the 2-D illustration of the SAR image, and the 3-D illustration of the SAR image. (b,d) Corresponding to (a,c), the three views, the image processed by PFE, 2-D illustration of SAR image, and 3-D illustration of SAR image.
Remotesensing 14 06077 g004
Figure 5. Data visualization based on KNT in a different channel. (a) R-channel (b) G-channel (c) B-channel (d) RGB-channel.
Remotesensing 14 06077 g005
Figure 6. Illustration of DCM (a) Schematic diagram of the deformable convolution (b) Receptive field of standard convolution and deformable convolution. Top: A activation unit from a 3 × 3 convolution kernel on the top feature map. Middle: The sampling positions from the feature map of the previous layer. Bottom: the sampling positions of two layers of 3 × 3 convolution kernel on the top feature map.
Remotesensing 14 06077 g006
Figure 7. Size distribution of aircraft in the GF3 dataset.
Remotesensing 14 06077 g007
Figure 8. Detection results of two algorithms in four SAR scenes. The cyan rectangles refer to the ground truth. The green and red rectangles denote the detected targets and false alarms, respectively. For a more intuitive comparison of the differences between the two algorithms, a yellow marker is drawn on the detection results. (a) Baseline (*) (b) * + PFF.
Remotesensing 14 06077 g008
Figure 9. Effectiveness of the proposed PFF-ADN, which includes the PFF, the ASFF, and the ADN (ASFF + PFF). (*) denotes the baseline algorithm.
Remotesensing 14 06077 g009
Figure 10. Detection results of three algorithms in four SAR scenes. The cyan rectangles refer to the ground truth. The green and red rectangles denote the detected targets and false alarms, respectively. For a more intuitive comparison of the differences between the two algorithms, a yellow marker is drawn on the detection results. (a) Baseline (*), (b) * + ASFF, (c) ADN: * + ASFF + DCM.
Remotesensing 14 06077 g010
Figure 11. Detection results of each algorithm in four typical SAR scenes. Specifically, the scene in the first (from left to right) column contains mainly medium-sized and small-sized aircraft in a dense arrangement. The scene in the second column represents large-size aircraft against a complex background. The scene in the third column includes lots of small-size aircraft in dense arrangement situations. The scene in the fourth column includes both large and small aircraft and there is a lot of clutter noise in this environment. (a) RFB, (b) YoloV4-tiny, (c) MobileNet-yolov4, (d) FasterRcnn, (e) RetinaNet, (f) ADN, (g) PFF-ADN.
Remotesensing 14 06077 g011aRemotesensing 14 06077 g011b
Figure 12. Precision-Recall curves of mentioned methods. (*) denotes the baseline algorithm.
Remotesensing 14 06077 g012
Table 1. Detailed information on the experimental dataset.
DatasetTrainingTestTotal
GF-3495165660
Table 2. Effectiveness of different components.
Algorithm A P (%) P (%) R (%) F 1 (%)
Baseline (*)77.0888.0877.8182.63
* + PFF82.7286.3485.7186.02
Table 3. Effectiveness of different components.
Algorithm A P (%) P (%) R (%) F 1 (%)
Baseline (*)77.0888.0877.8182.63
* + ASFF84.6588.6088.3488.46
* + ASFF + DCM86.1587.3690.9789.12
Table 4. Effectiveness of different components.
Algorithm A P (%) P (%) R (%) F 1 (%)FPS (Slice)
RFB42.2494.2142.8558.9185
Yolov4-tiny58.2881.4661.2769.93341
Mobile-yolov468.5879.4772.9276.05325
FasterRcnn49.8765.7653.7558.8413
RetinaNet78.3680.0481.9580.98268
ADN86.1587.3690.9789.1211
PFF-ADN89.3489.4492.8591.1111
Publisher’s Note: MDPI stays neutral with regard to jurisdictional claims in published maps and institutional affiliations.

