Article

Layover Detection Using Neural Network Based on Expert Knowledge

1
National Key Laboratory of Microwave Imaging Technology, Aerospace Information Research Institute, Chinese Academy of Sciences, Beijing 100190, China
2
School of Electronic, Electrical and Communication Engineering, University of Chinese Academy of Sciences, Beijing 100049, China
*
Author to whom correspondence should be addressed.
Remote Sens. 2022, 14(23), 6087; https://doi.org/10.3390/rs14236087
Submission received: 30 September 2022 / Revised: 18 November 2022 / Accepted: 29 November 2022 / Published: 30 November 2022
(This article belongs to the Special Issue Recent Progress and Applications on Multi-Dimensional SAR)

Abstract

:
Layover detection is crucial in 3D array SAR topography reconstruction. However, existing algorithms are not automated and accurate enough in practice. To solve this problem, this paper proposes a novel layover detection method that combines the complex-valued (cv) neural network and expert knowledge to extract features in the amplitude and phase of multi-channel SAR. First, inspired by expert knowledge, a fast Fourier transform (FFT) residual convolutional neural network was developed to eliminate the training divergence of the cv network, deepen networks without extra parameters, and facilitate network learning. Then, another innovative component, phase convolution, was designed to extract phase features of the layover. Subsequently, various cv neural network components were integrated with FFT residual learning blocks and phase convolution on the skeleton of U-Net. Due to the difficulty of obtaining SAR images marked with layover truths, a simulation was performed to gather the required dataset for training. The experimental results indicated that our approach can efficiently determine the layover area with higher precision and fewer noises. The proposed method achieves an accuracy of 97% on the testing dataset, which surpasses previous methods.

1. Introduction

Layover is the biggest challenge to interpretations in 3D SAR imaging, and the detection of layover becomes the cornerstone of the processing of 3D SAR images. With the rapid development of technology and demand in recent years, array SAR is of significant interest in airborne reconnaissance, forest inventory, and subsurface or wall-penetrating sensing applications [1]. Essentially, 3D SAR imaging by multi-channel data is an inverse problem of radar imaging [2,3]. Meanwhile the layover areas are the most critical portion to inverse in the 3D SAR image, which usually contain dramatic changes in terrain and abundant elevation information [4,5,6]. Thus, the detection of layover has emerged as a significant issue in the processing of reconstruction. Figure 1 illustrates the location of layover detection in the whole procedure. As shown in the flowchart, after image registration and phase compensation, layover detection is adopted to determine which method should be applied for the sake of efficiency and accuracy. The super-resolution operation used in layover areas consumes hundreds of thousands of times more computing resources than interference processing, which is suitable for non-layover areas. The overall interpretation process can be made more efficient by applying the correct method to each corresponding area. Both efficiency and accuracy are significantly impacted by the layover detection. Once layover is mistaken for non-layover, meaningful information will be discarded. Moreover, there will be massive noises if non-layover is mistaken for layover. Thus, layover detection has a substantial impact on 3D SAR imaging.
Layover is unavoidable in radar side-looking imaging, and it usually appears when the imaged scene contains highly sloping areas (e.g., mountainous terrain) or discontinuous surfaces (such as buildings) [7,8,9,10]. Specifically, once the viewing angle θ is smaller than the slope angle β , as shown in Figure 2, the layover will appear in the SAR image. According to its significance, the research of layover detection has attracted much attention and made considerable advancements. However, the existing detection algorithms still have some drawbacks, and the accuracy in the context of array SAR can be further improved. On the one hand, the existing methods underutilize the abundant multi-channel data of new system radars. Although some research has used data in array SAR to detect layover, the rich feature information in the multi-channel data has not been fully extracted [11,12]. On the other hand, most traditional layover detection methods rely on the artificially set threshold. The setting of the threshold is strongly influenced by the experience of interpreters and the selected regions. All of these factors make the traditional methods too empirical to be universal and robust [13]. The lack of efficiency and precision in the existing layover detection algorithms has seriously undermined the productivity and accuracy of 3D model reconstruction. For example, during 3D modeling, half the time needs to be spent on artificially correcting the layover detection area. Thus, it is necessary to implement a novel and automated method for fusion mining features from abundant array SAR data to improve accuracy.
With developments in machine learning, especially deep learning, complex-valued convolutional neural networks are widely used in computer vision, signal processing, wireless communications, and other areas, where complex numbers arise naturally or artificially [14,15,16,17,18,19,20,21]. In the typical application field of radar imaging and identification, complex-valued networks were employed for InSAR adaptive noise reduction [15]. Meanwhile, benefiting from the extremely strong extraction and fusion of features, complex-valued networks were used to exploit the inherent nature of human activities in radar echoes’ amplitude and phase [22]. However, few effective neural network methods have been implemented in the layover detection of multi-channel SAR data. In addition, layover has richer features in multi-channel SAR data than in InSAR or general SAR. Thus, the complex-valued neural network is ideal for extracting and fusing abundant features in the amplitude and phase of multi-channels. Moreover, a well-structured neural network combined with expert knowledge depends more on the quality of training data than the artificially set threshold, which contributes to more automatic and precise detection.
Inspired by the above reviewing and analysis, this paper intends to use neural network technology, which is widely used in segmentation, to enhance the automation and accuracy of layover detection. The backpropagation-based capability of neural networks for highly non-linear feature learning can make detection rely more on data training than on manual rules and experience. Faced with a limited number of neural network applications for layover detection in multi-channel data, tailored neural network structures must be designed based on expert knowledge. Array SAR multi-channel data contain rich features, including amplitude, phase, and height. Among them, amplitude features are the most basic and obvious in layover detection; phase features can be detected in interferometric SAR; and height features can be sensed in array SAR. Finally, a novel layover detection method is proposed, which combines complex-valued neural networks organically with expert knowledge to incorporate multi-dimensional features of layover to detect layover adaptively and efficiently with higher precision.
The rest of this paper is organized as follows. Traditional studies and related features of layover areas are introduced in Section 2. The neural network structure and the procedure of building the module with expert knowledge and complex-valued neural network components are explained in Section 3. The comparative experiments of our proposed method and traditional methods are described in Section 4. Finally, Section 5 and Section 6, respectively, contain the discussion and conclusion of our works.

2. The Features of Layover and the Related Traditional Algorithms

To improve the detection precision of layover, a practical approach is to fuse different dimensions of features with the assistance of expert knowledge. To achieve this goal, a series of traditional layover detection methods should be reviewed from distinct perspectives of layover features. As an important and complex radar imaging area to interpret, the layover area has attracted many researchers to study detection algorithms in line with its different types of characteristics from the past to the present. According to their related characteristics, the existing detection methods could be classified into two categories:
  • The first category of methods aims at extracting recognizable characteristics from feature maps, including the amplitude map, interference phase map, coherence coefficient map, etc., which are all calculated from a two-dimensional range–azimuth plane. Thus, this broad category of methods is based on the range–azimuth dimension feature.
  • The second category of methods aims at extracting recognizable characteristics from multi-channel data of array SAR. This category of methods is based on features in the height dimension, among which the representative one is the improved eigenvalue decomposition method [11].

2.1. Methods Based on Range–Azimuth Dimension Feature

2.1.1. Methods Based on the Amplitude Feature

Soergel et al. initially used a threshold segmentation method based on the amplitude of radar images to detect the layover of city areas [23]. In recent years, Yunfei Wu applied the multi-scale deep neural network and the attention-based convolutional neural network to increase the amplitude of maps of SAR to detect the built-up areas [24,25]. The principle of this method is that the layover area has generally larger amplitudes because more than one signal collapses in the layover area. Thus, from this perspective, the layover area can be judged by the obviously larger amplitude than the neighboring area. The advantage of this method is that its processing speed is very fast, but due to insufficient mining of the features of the layover areas and the need to manually set the threshold, the accuracy is very low, and the robustness is poor.

2.1.2. Methods Based on the Phase Feature

In addition to the amplitude feature, the layover area also has a reverse phase. In the geometry model shown in Figure 3, the interference phase can be obtained according to the mathematical model for elevation calculation proposed by Prati et al. [26].
Δ ϕ 12 = 2 π B cos θ α × r p λ r × tan θ β
where r p is the distance between P 1 and P 2 in the slant distance direction; B is the baseline of the InSAR system; θ is the incident angle; β is the slope of P 1 and P 2 ; α is the baseline inclination of InSAR. It can be found that in the non-layover areas, β < θ , and the interference phase gradient is positive; in the layover areas, β > θ , and the interference phase gradient is negative. Therefore, the layover area has the characteristic of a reverse phase.
Firstly, the phase needs to be unwrapped, and then the gradient of the unwrapped interferometric phase can be obtained. Considering the negative gradient caused by the Gaussian noise of the interferometric phase in the shadow area, it is necessary to filter out shadows by the coherence sparsity and amplitude characteristics [23]. Finally, the layover area is selected according to reversed phase. However, this method is only effective in dealing with simple cases. Due to the coherent speckle noise, this method cannot be used alone in complex large cases.

2.1.3. Methods Based on Coherence

Wilkinson et al. studied the statistical characteristics of the layover area based on the InSAR data, and they proposed the coherence method [3]. The advantage of this algorithm lies in its fast processing speed, but it is easy to cause misjudgments in areas with serious decoherence such as lakes and forests. This is because many factors cause the decoherence of InSAR interferometric phase maps, including signal-to-noise ratio, system space geometry, imaging time difference, and registration error [27].

2.2. Methods Based on Multi-Channel Data

The principle of these methods is that the layover area is formed by the superposition of multiple signals in the height dimension. The general process is to use eigenvalue decomposition, fast Fourier transform (FFT), and other techniques to separate the array SAR multi-channel data into high-dimensional signals and then judge the layover by the number of signals.
With the development of multi-channel radar, the layover area can be detected based on this feature. The key to this type of method is to judge the number of signals in the area after the signal separation. According to the judgment approach, these methods can be divided into the ratio method and the iterative amplitude method [11]. However, this type of method needs to add artificial thresholds and approximate assumptions, and similar to the aforementioned methods, it cannot handle the case with massive noise.

2.2.1. Methods Based on Ratio Judgement

This type of method determines the number of signals by ratio after separating the main signals in the height dimension [28]. The process involves sorting the main high-dimensional signals and then traversing the ratio of adjacent signals. When the ratio reaches the maximum, the boundary of signals and noises is obtained. If there are more than one signal in one pixel, it can be judged as a layover point. The advantage of this method is that it can effectively extract high-dimensional features, but the disadvantage is that it is easy to misjudge strong noises.

2.2.2. Methods Based on Eigenvalue Decomposition

In the improved eigenvalue decomposition method, the detected result can be obtained by directly comparing the eigenvalues with the variance in the shadow area, which approximates the noise [11]. After one segmentation, the judgment is performed again. The iteration continues until the difference between two judgement results decreases to the set threshold. The initial segmentation is given by the amplitude threshold. The theoretical accuracy is higher than that of other traditional methods. However, manual setting thresholds also make this method lack universality.

3. The Proposed Model

This section describes our proposed detection model. The model aims to efficiently obtain a higher score in layover detection by fusing more features from the information of multi-channels with neural networks. More prior knowledge can guide networks to learn and help them to converge better in situations with a small sample size [29,30]. Going a step further, this paper tries to combine expert knowledge and existing complex-valued neural network components on the skeleton of U-Net, which is a famous expert at segmentation. Meanwhile, to realize accurate, fast, and robust detection of layover areas, this paper designs two components, namely the FFT residual learning component and the phase convolution component, which can improve the convergence of the network, help to extract features from abundant array SAR data, and promote the speed and precision of searching for the optimal solution. In addition, this paper organically integrates the existing complex-valued components to a U-Net-like network, which is first applied to layover detection. The complex-valued neural network has been proven to be effective in many fields such as radio frequency fingerprint identification, medical image recognition, etc. [31,32]. The traditional methods are all operated on the complex-valued domain. The complex-valued neural network is more suitable to incorporating expert knowledge derived from these methods. Thus, a complex-valued neural network combined with our specific structures is created to mine rich layover features in multi-channel SAR data. In the following, our model is introduced first, and then our proposed original neural network structures and the complex-valued neural network components integrated and redesigned in this paper are described.

3.1. Neural Network Framework

The network architecture of the proposed complex-valued FFT residual neural network contains an encoder backbone followed by a decoder subnetwork, as illustrated in Figure 4. The encoder on the left is formed by five convolution blocks, each of which consists of two complex-valued convolutional layers followed by the complex batch normalization (CBN) and CReLU activation function. Afterward, FFT residual modules are incorporated into each convolution block to improve the extraction of the height dimension feature. Next to the bottleneck, the decoder block is transformed into absolute values to better absorb the amplitude feature skip pathways from the encoder blocks. Each stacked block incorporates feature maps from both the encoder and the deeper decoder. The final convolution absorbs the feature map of phase convolution from the original SAR data, which preserves the most complete phase information. Followed by a convolutional layer with the softmax activation, the detection results are produced, which fuses the amplitude, phase, and height features.

3.2. The Proposed Network Structures

3.2.1. Theoretical Basis and FFT Residual Structure

To explain the theoretical basis of the FFT residual structure, this paper starts by establishing the basic model of the layover. For any pixel P ( m , n ) in the layover area, it contains multiple terrain patches with different elevation angles, which will exhibit different interferometric phases related to their elevations [26].
y 0 ( m , n ) = i = 0 N s x 0 i ( m , n ) exp ( j ψ i ( m , n ) ) + v 0 ( m , n ) y 1 ( m , n )     = i = 0 N s x 1 i ( m , n ) exp ( j ( ψ i ( m , n ) + ψ i 1 ( m , n ) )     + v 1 ( m , n )                           y N c ( m , n )   = i = 0 N s x N c i ( m , n ) exp ( j ( ψ i ( m , n ) + ψ i N c ( m , n ) )   + v N c ( m , n )
In the above equations, y 0 , y 1 y N c are the multi-channel complex data obtained by the array SAR, where N c is the number of array antennas, N s   is the echo number of different heights and different scenes superimposed by the pixel, and i   is the serial number. x represents the ground scattering characteristics and coherent speckle noise of the pixel, which obey the complex Gaussian distribution, and different layover areas x i are not correlated with each other. ν 0 , ν 1 , ν N c are mutually uncorrelated additive complex Gaussian white noises. ψ   is the phase determined by the round-trip path of the radar signals. When factors such as the viewing angle and the orbit height under the radar are constant, the single-point signal is analyzed, and ψ   can be obtained as follows:
ψ N c = α B N c h s + ω N c 2 π
Here, the index s refers to the position of the pixel in the image (for specific discrete range and azimuth coordinate), ω is the phase decorrelation noise, 2 π represents the “module- 2 π ” operation, α = 4 π / λ R 0   s i n θ , λ is the wavelength, B N c is the orthogonal baseline of the n th SAR interferogram, θ is the SAR viewing angle, h s is the height value, and R 0 is the distance between the master antenna and the center of the scene.
According to the above theoretical analysis, we can find that ψ N c is linear to B N C · h s . In other words, the frequency of multi-channel SAR data is related to the height value. The time of multi-channel SAR data is linear to the baseline. Due to this principle, multi-channel SAR has the capability of obtaining the target distribution along the elevation direction by the spatial spectrum estimation technique [33,34,35,36], and the FFT technique is a conventional method to estimate the spectrum. Based on this expert knowledge, the height dimension information can be extracted from the frequency domain of multi-channel SAR data by FFT operation. Layover can be detected by more than one overlaid signal in height. This means that Fourier transform mapping is more likely to be optimal in real cases of layover detection rather than identity mapping, which can be treated as a time domain signal. FFT mapping utilized in a residual block can help distinguish different signals in height for better extraction of layover features. Thus, this paper proposes to let shortcuts be FFT ( x ) to optimize the performance of residual learning, as shown in Figure 5. Meanwhile, the inputs to the layers are denoted as x , and the whole underlying mapping to be fit by the sum of a few complex-valued stacked layers and FFT shortcuts are denoted as H ( x ) . Finally, stacked complex-valued layers are adopted to approximate F ( x ) : = H ( x ) FFT ( x ) , which is referred to as the FFT residual function.
Another property of this mapping is that it requires fewer parameters than traditional residual blocks. Specifically, feature extraction relies on the dimensional increase. Facing this circumstance, residual blocks usually use 1 × 1 convolutions, which have no physical meaning and many parameters to train. By contrast, Fourier transform mappings can improve the dimensions of data without introducing extra parameters. This saving is of special importance in small sample layover detection. Specifically, the Fourier transformer can be formulated as follows:
x 0 x 1 x m 0 · F = y 0 y 1 y n
where x i represents the values in different channels of one pixel from the upper layer; y i represents the output; m is the number of input features of FFT residual blocks; n is the number of output features of FFT residual blocks; n m is the number of zeros that need be added to input data; F represents the learnable parameter that is set to the Fourier coefficient, and it is listed as follows:
1 1 1 1 1 1 ω 1 ω 2 ω 8 ω 9 1 ω 8 ω 16 ω n 2 ω n 1 1 ω 9 ω 18 ω n 1 ω n
Here, ω = e 2 π n i , where i 2 = 1 . In this way, the input data with added zeros can be more highly dimensioned from the input dimension to the output dimension without any parameters needing to be trained. In the high-dimensional space, which is also the Fourier transformer space, the main signals can be better separated and more easily extracted. Thus, the pursuit of better optimization effects will consume less time and calculation costs at a good starting point for searching.
The complex-valued neural network is complicated to train with many parameters. Moreover, a slightly deepened complex-valued network will tend to degenerate or even become divergent. More and more deep learning models utilize the residual learning framework to simplify the training process and achieve good accuracy with a considerable depth in deep complex-valued networks [31,32,37]. In addition, its strength is supported by a reasonable case that identity mappings or closer ones might be the optimal functions to fit in optical computer vision. However, according to the above expert knowledge and analysis, Fourier transform mappings are more likely to be optimal in complex-valued layover detection. Thus, FFT residual learning blocks are the optimal choice to deepen the network and improve layover detection performance.

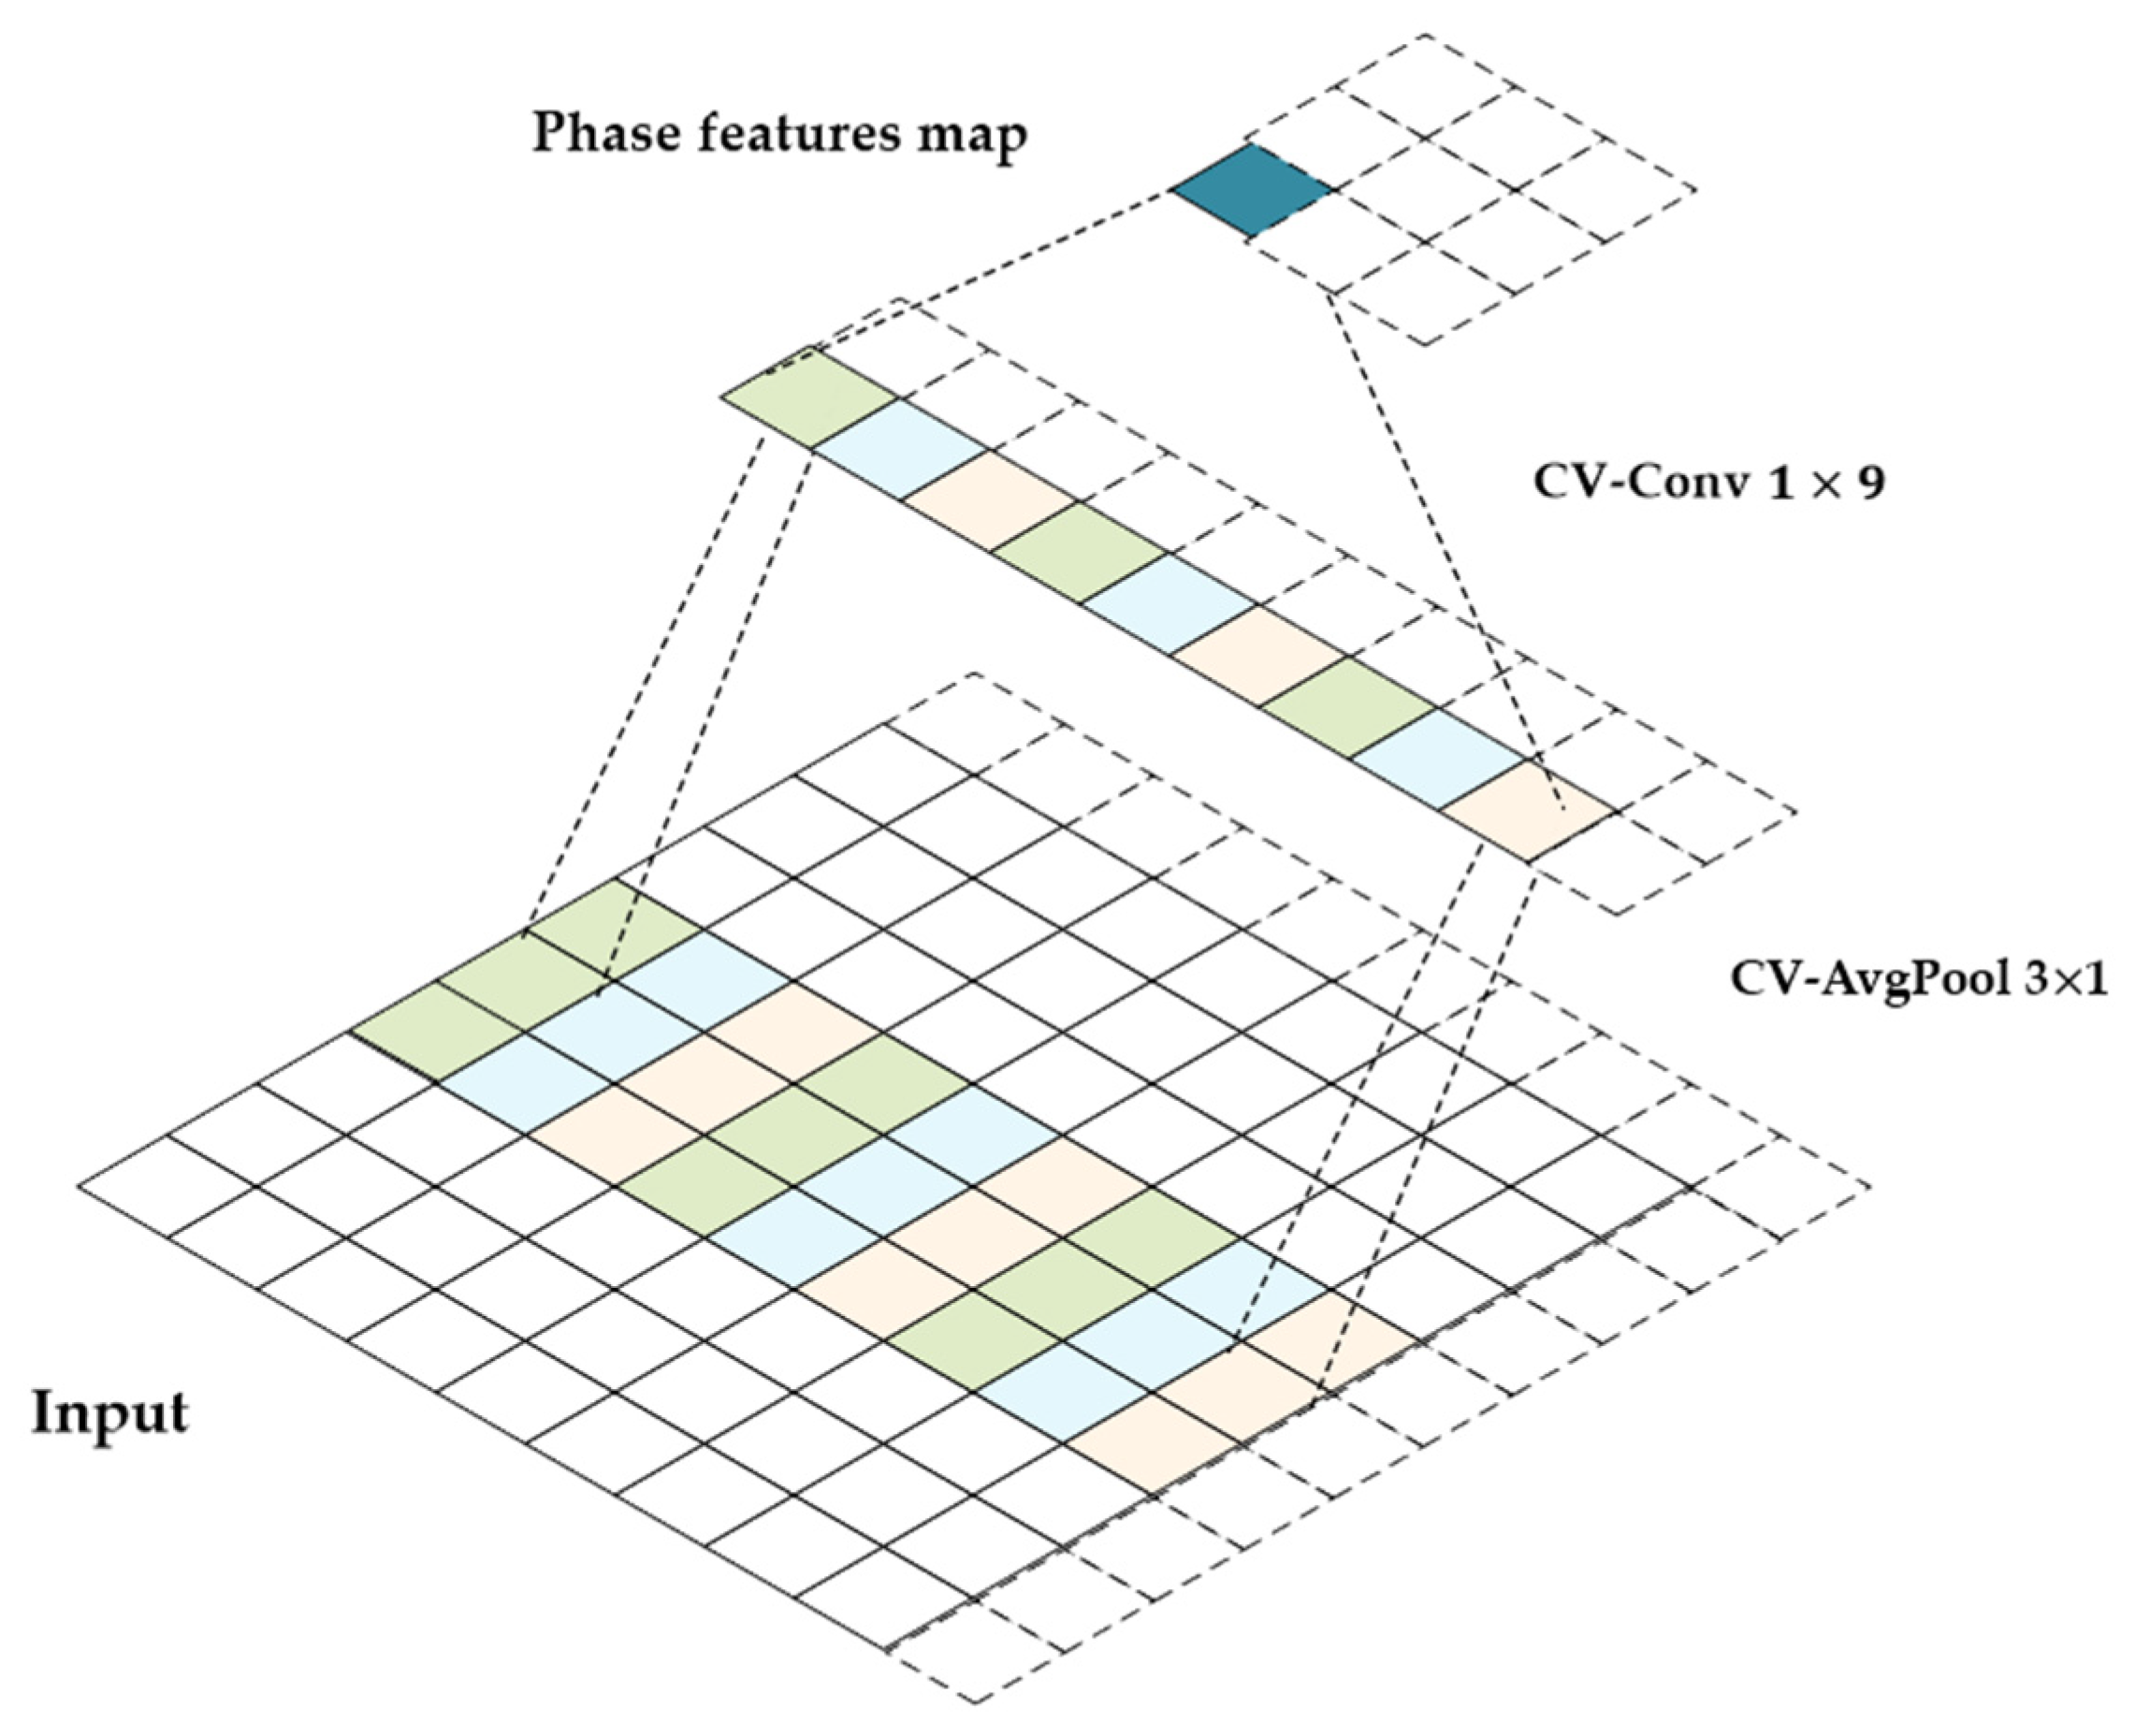
3.2.2. Phase Convolution

Phase feature is a crucial basis for judgment in some circumstances, which can be an effective supplement to the fusion detection of multi-dimensional features.
In terms of phase feature extraction, a two-layer structure called phase convolution is designed to extract the phase feature in the azimuth direction. As shown in Figure 6, the phase convolution structure is composed of a complex-valued average pool layer that aims to eliminate the effect of noise and a complex-valued convolution layer that focuses on extracting phase features. The layover has the characteristic of inverse phases in the direction of range. The first part of phase convolution is cv avgpool in order to mitigate the impact of noise. The second part is a 1 × 9 cv convolution, which elongates in range direction to extract the inverse phase feature in range. Finally, the phase features map, which is gained after the process of cv avgpool and cv convolution, is concatenated with the features from the decoder path as the input of the next transposed convolution.

3.3. Other CV Components

Our transformation needs to be performed in a complex domain. The input data and weights are both pluralized and divided into a real number channel and an imaginary number channel. To realize the weight multiplication operation, the parameters and the four channels of the input data are multiplied by each other, and then correspondingly added. This process can be expressed by the following formula:
V j ( n + 1 ) = i ω j i ( n + 1 ) O i ( n ) + b i ( n + 1 )   = i R ( ω j i ( n + 1 ) ) · R ( O i ( n ) ) I ( ω j i ( n + 1 ) ) · I O i ( n ) + j · R ω j i ( n + 1 ) · I O i ( n ) + I ω i j ( n + 1 ) · R O i ( n ) + b i ( n + 1 )
where O i n is the input feature map of the n th layer, V j n + 1 is the output feature map of the   n + 1 th layer, ω j i n + 1 and b i n + 1 are the weight coefficient and bias value between the two layers, respectively.
In complex-valued networks, the data are divided into a real number channel and an imaginary number channel, but there is a lot of information between the two channels. Because of this, some commonly used activation functions cannot be chosen. Finally, the modReLU activation function was used in our network, and it is expressed by the following formula:
modReLU z = ReLU z + b e i θ z   = z + b z z z + b 0 0 otherwise
Here, z is the complex-valued signal, θ z represents the phase of the z , and b is a learnable parameter. Positive z and bias b are introduced to create a “dead zone” where the neuron will be inactive, and outside of which it is active. From this activation’s mathematical characteristics, it can be seen that modReLU manages to filter out the small signals. What is more important is that the filtering threshold can be trained by data. This kind of feature can help to remove noise as accurately as possible and then improve the robustness and accuracy of the model. It could also increase the network’s depth and allow it to extract deeper features.
In most cases, batch normalization can accelerate the learning process of the network [38]. The normalization procedure of the complex-valued data can help to decorrelate the imaginary and real parts of a unit and reduce the risk of overfitting [39,40]. In our model, batch normalization is performed before the Fourier transform layer and after the Fourier transform layer, and the result is passed through the modReLU activation function. Moreover, during training and testing, a run average with momentum is employed to estimate the complicated batch normalization statistics. In this way, the difficulty of searching for solutions can be reduced, the learning rate is improved, and less consideration is needed for the initialization process.

3.4. Loss Function

A common loss function for addressing binary classification is the binary cross-entropy (BCE), which is represented as follows:
L B C E = 1 M m y log p m + ( 1 y ) log ( 1 p m )
where p m is the predicted probability for the pixel m of a batch of data, and y is the probability that the positive sample is 1. However, there is an extreme imbalance between positive and negative examples in layover detection. This imbalance manifests in two aspects. (1) In the overall scene, the non-layover area is far larger than that of the layover. This is because the steep terrain is generally a small part of the overall topographic map. (2) In the local image slices, a single type of pixel, layover or non-layover, usually dominates a picture as layover or non-layover always appears in a large area on the map. Extreme imbalance on two scales can make the training process inefficient because most locations are easy non-layovers that contribute less useful learning signals. Additionally, the easy non-layovers can overwhelm the training process and degenerate the detector model.
To improve our model training efficiency and accuracy, this paper introduces the binary focal loss instead of the binary cross-entropy [41]. Massive and easily classified negatives, that appear in the pure non-layover image, comprise most of the loss and dominate the gradient. To prevent this, a balancing factor α t and a modulating factor ( 1 p t ) γ are introduced into the binary focal loss, with the tunable focusing parameter γ 0 . The formal formula is expressed as:
L B F L ( p t ) = α t ( 1 p t ) γ log ( p t )
where p t is calculated from the model’s estimated probability p and is defined as follows:
p t = p layover 1 p non - layover
In the loss function, α t balances the importance of layover/non-layover pixels. When facing a non-layover pixel, α t is set to be lower than one of the layover pixels to down-weighted massive negatives. ( 1 p t ) γ makes the model focus on hard examples rather than easy examples. For example, when a hard example is misclassified as either a layover area or a non-layover area, p t will be small, and the modulating factor is near 1. In this case, the loss value is unaffected or little affected. In contrast, well-classified examples may make the factor near 0 and decrease the impact on the loss value and gradient update. In this way, the binary focal loss makes the training process focus on a sparse set of hard-classified layover areas, thus improving the efficiency of the gradient update of backpropagations and the accuracy of ultimate detections.

4. Experiment and Result

In this section, the procedures and results of the experiment built above are presented. Firstly, Section 4.1 describes the dataset used for experiments and introduces the implementation details and the evaluation criteria. Then, Section 4.2 compares our method with other traditional algorithms on the testing dataset. Finally, Section 4.3 applies our method to the actual data to further validate its effectiveness and practicality.

4.1. Data Preparation and Experiment Setup

4.1.1. Simulation Experiment

The data used for the experiment need to have true marks to feed into the neural network for training. Therefore, the simulation experiment is suitable for obtaining the training dataset and validation dataset because of its true and accessible marks. Specifically, simulation parameters are set in Table 1. The antenna array consists of 10 antennas that are evenly placed horizontally and work in a spontaneous sending and receiving mode. The DEM of simulation experiment is from the Aerospace Information Research Institute, Chinese Academy of Sciences (AIRCAS) InSAR.
In this experiment, the simulation uses a scaled model of natural scenes instead of regular geometric terrains such as the trapezoidal terrain widely adopted by other papers. This is because complex and irregular natural terrains help to train a stronger network and test out the more appropriate model for future practical applications.
Then, registration between ten channels is performed. After the simulation dataset is obtained, the whole terrain information of the dataset is exposed in three aspects in Figure 7, where (A) shows the amplitude map of one channel, (B) shows the interference phase of two adjacent channels, and (C) shows the truth map of the layover. The true mask is listed, in which the layover is marked as a white pixel and the non-layover is marked as a black pixel. In the images of amplitude and phase, the layover and non-layover are mixed to different degrees according to the brightness or reverse phase. The layover is easily mixed in the non-layover area in the case of a single feature. In this situation, the use of a single traditional method or several mechanically combined methods in a more complex and realistic environment cannot obtain effective recognition results. Then, our network is built and trained based on these simulation data. Meanwhile, the results of several traditional methods are reproduced to test the effectiveness of our method.

4.1.2. Data Augmentation

The size of the whole SAR image used for simulation is 1024 × 1024 pixels. As for the data slices fed to the network, the size is set to 64 × 64. Due to the lack of data, there is a necessity for data augmentation. Firstly, the whole image was divided into a training dataset and a test dataset at the ratio of 7:3. Then, a sliding window was adopted to crop the two datasets at a step 8 pixel according to the determined size. After traversal, a training dataset of 752 image slices and a test dataset of 176 image slices were acquired. To speed up training, these images were utilized to create 47 mini-batches, each of which had an average of 16 pieces.
Finally, after the entire procedure from simulation to data augmentation, a dataset of relatively complex mountain terrains was obtained for training. Several typical data examples are displayed from three aspects of truth, amplitude, and phase in Figure 8. The layover’s properties of amplitude and phase can be vaguely observed by humans. Additionally, detection with higher accuracy is achieved by our neural network incorporating multi-dimensional features, as shown in the following experiments.
.

4.1.3. Experiment Setup

In this section, experimental settings and implementation details are introduced. In addition, the operations on the dataset are explained one by one.
Our network is trained for 150 epochs. The initial learning rate is 0.02 and decays 10 times every 50 epochs. The size of a batch is set to 32. The experiments are conducted on an NVIDIA GeForce RTX 2080 Ti GPU. The entire network is trained from scratch and does not use extra training data. The network is trained on the training set and evaluated on the respective validation set for each dataset.
During training and testing, running averages with momentum are applied to maintain an estimate of the complex batch normalization statistics. The moving averages of V r i and β are initialized to 0; the moving averages of V r r and V i i are set to 1 / 2 ; the momentum for the moving average is set to 0.9.
The following metrics are adopted to evaluate the method’s performance to compare it with other algorithms comprehensively.
Accuracy = TP + TN TP + FP + TN + FN Precision = TP TP + FP Recall = TP TP + FN Missing   Alarm = FN TP + FN False   Alarm = FP TP + FP
where TP represents the true positive where a point is identified as the layover in both the prediction image and the ground truth, TN represents the true negative where a non-layover point is correctly classified, FN represents the misclassification where a layover point is wrongly predicted as a non-layover point, and FP is the misclassification where a non-layover point is misidentified as a layover point. The accuracy is measured by the ratio of the total number of correctly classified pixels (the sum of true positives and true negatives) to the number of whole pixels in the SAR image. The precision and recall show the performance on the testing dataset. Missing alarm is the loss of the layover points in the prediction Image. False alarm is the erroneous report of layover detection. They are all components of a comprehensive evaluation.

4.2. Comparative Experiments with Traditional Methods

Then, experiments were conducted on the simulation dataset to compare the proposed method with traditional methods. Amplitude is the most commonly used traditional method [23]. The coherence method is important in the environment of a better coherence detection method, so it is applied to layover detection in practice. The eigenvalue method also incorporates the height feature to improve accuracy [11]. Comparative experiments were conducted between the traditional methods and our proposed method on the same test dataset to compare their results. Note that the environment of our simulation is a scene containing complex mountain terrains with noise. Thus, some of the metrics may be lower than those in other papers under a simple terrain test.
From the inspection results in Table 2, it can be seen that our proposed method outperforms the traditional methods in all metrics. As the most classical method, the amplitude method achieves a moderate detection effect. This conforms to the common perception that a high amplitude means layover with a high probability. However, both accuracy and recall can be further improved. The coherence method obtains poor results, indicating that coherence is only a necessary condition for a layover. Once the scene is more complicated, the method often produces a worse result. Compared with the previous methods, the eigenvalue method obtains higher scores on the two indicators of accuracy and precision. However, the recall of this method is very low, which means that the missing alarm is high. This indicates that although most of the targets detected by the method are true, there is still a large proportion of missed true targets. Our method is significantly superior to the eigenvalue method in terms of recall, but it is only marginally superior in terms of accuracy. This is because the non-layover dominates the scene, and a large number of missed true targets only account for a small proportion of the entire scene. However, the excessive missed true targets cause unacceptable information loss in 3D SAR reconstruction. From the perspective of evaluation metrics, our proposed method exceeds traditional methods in all aspects.
It is well known that layover is typically discrete and sparse. To further compare the results of various methods, an area with an unbroken layover is selected, which can help inspect the distinction intuitively. Figure 9 demonstrates that, among all methods, ours has the most complete shape and the least amount of noise and missing targets. The amplitude method detects the layover approximatively, which is filled with massive noise. It is difficult to distinguish layover and non-layover in the amplitude method’s result. In the result obtained by the coherence method, a layover can be observed on the left side. However, the region on the right side is most misidentified as the targets, indicating the complex environment makes the coherence method almost ineffective. The final eigenvalue method has a good recognition effect in the upper left portion of the image, but there is a large area of missing targets in the lower middle portion of the image. Moreover, the thin layover on the right side of the image is not detected at all, which is unacceptable and causes significant information loss in 3D SAR reconstruction.
In this section, the differences between our proposed method and traditional methods are compared from the perspectives of both quantitative metrics and intuitive recognition results. Attributed to the fusion of multi-dimensional features of the layover in the framework of deep learning, our method surpasses the traditional method in terms of all metrics. This demonstrates our method can greatly improve the layover detection’s accuracy and reduces the pressure of manual recognition.

4.3. Comparative Experiments with Other Deep Learning Methods

In addition to performing comparison trials with traditional approaches, we also conducted comparison experiments with different deep learning methods in order to show the effectiveness of our proposed components for layover detection on a small sample dataset. U-Net, U-Net++, DeepLabV3, and DeepLabV3+ are selected to be compared as the most popular methods in semantic segmentation.
From the inspection results in Table 3, we can find that deep learning methods generally achieve better results than traditional methods. As the most classical semantic segmentation, U-Net gains an accuracy of 92.62%. The improved version, which is named as U-Net++, has better precision but worse recall. We inferred the overfitting means the true targets are missed because of the more complex structure and small sample dataset. DeepLabV3 and DeepLabV3+ select the ResNet18 as the backbone. The deeper network benefits very little. Considering the low recall and high missing alarm, the multi-scale extraction of these two models cannot help much in the mountain scene of the simulation experiment. Benefiting from the customized layover feature extraction components, our method obtains the most comprehensive metrics.

4.4. Ablation Studies

We conducted ablation experiments to further analyze the effectiveness of our proposed components combined with expert knowledge. We designed an FFT residual block to replace the original residual block at the skeleton of complex-valued U-Net [46], and we added the phase convolution to the network. Thus, we performed the ablation experiments among the original residual block, FFT residual block, and phase convolution.
From the inspection results in Table 4, It can be found that complex-valued residual U-Net achieves a high score in accuracy as the plain network. This indicates the model is pretty suitable for layover detection. After transforming the residual block to an FFT residual block, a noticeable improvement was seen in accuracy, precision, and recall. This proves that the frequency domain is easier to use to extract the features of layover than the time domain, which is identity mapping in residual learning. The phase convolution has a smaller improvement compared with the original model, and the neural network with an FFT residual block and phase convolution is greater than them on their own. This shows that the FFT residual block for the height feature and phase convolution for the phase feature are complementary for layover detection. The ablation studies prove the effectiveness of our proposed two components.

4.5. Actual Data Verification

The proposed method aims to detect layover caused by sloping topography such as mountains, and its validity has been verified on the simulation test set. Then, it is further validated on the actual mountain area data. The actual SAR data used for model testing came from the hilly regions in the Shawan District ( 103 ° 30 ' 59.5 ' '   to 103 ° 32 ' 01.4 ' ' E, 29 ° 24 ' 49.0 ' to 29 ° 25 ' 42.5 ' ' N), which lies southwest of Leshan City in China’s Sichuan Province. This area is located in the transition zone between the Daliang Mountains and Sichuan Basin. It is dominated by mountainous terrain, with complicated topography and numerous vegetation. Thus, it is difficult to analyze topographic changes from optical images. Additionally, there are abundant woodland and mineral resources. Therefore, it has practical significance to use this region as the actual dataset to verify our method. Figure 10 shows a SAR image and an optical image of this area.
The SAR image is obtained by the airborne array SAR on 7 August 2022. The size of the original SAR image is 13312 × 27000 pixels. In the experiment, images with a size of 1500 × 1500 pixels are intercepted for testing, and they cover an area of 58,240 m2 (284.1 m in latitude and 205 m in longitude). Figure 10a shows the selected test region as a red box in the partial SAR image ( 6400 × 6400 pixels). Figure 10b shows the counterpart in the optical image.
In the test area, using traditional methods always leads to a high false alarm rate or a high missing alarm rate by the manually set threshold based on experience. After our method is applied to the actual data, the layover detection result is obtained and presented in Figure 11. Since the actual data are not labeled with actual values, only a qualitative analysis can be conducted. The selected area in Figure 11a contains the typical layover area that can be confirmed without extra manual verification but cannot be well detected by traditional methods. When using our detection method, layover areas are identified with a small missing alarm rate and an extremely low false alarm rate. As shown in Figure 11b, the strong noise in the upper region has minimal impact on the recognition result; the lower half of the layover is almost intactly detected; for the middle portion of the layover, a complete boundary identification is achieved, with only a small inner portion remaining undetected. Overall, the algorithm accomplishes rapid, highly accurate, and efficient detection of layover without setting domain values artificially. The detection result of actual data initially demonstrates the universality of the features incorporated from simulation data and the robustness and practicality of the algorithm.

5. Discussion

Generally, complex-valued neural networks are more difficult to train [18,21,47], and pure pluralization of neural networks for optical segmentation generally yields subpar outcomes. The two structures presented in this paper improve the neural networks and simplify the training process. Among them, the FFT residual structure is built based on the expert knowledge that layover features are easier to be recognized in the Fourier domain. Considering the widespread application of FFT in signal processing, the applicability of the FFT residual structure in other disciplines can be investigated in our future research.
For the array SAR data, the features in the amplitude, phase, and height domains are derived from the multi-channel data, and the features of polarization patterns and other aspects in layover are ignored. Though the fusion of more features helps to improve the precision, it increases the negative impact of poor-quality data on the model, given that SAR data are generally filled with a lot of noise. Thus, how to effectively fuse more features of other aspects will be investigated in our study.
Generally, the range of SAR imaging is extremely wide, and it is particularly labor-intensive to accurately calculate the true value of the layover by building an accurate DEM model. Therefore, in this paper, the model is first trained with simulated data with truth, and then the model’s patterns are verified in actual data. This leads to two important issues that need to be discussed. One is how to ensure the generality of the features between the simulated data and the actual data. Our experimental experience indicates that the simulation should strictly follow the scattering mechanism of multi-channel SAR, and then reasonable and realistic possible noise should be added, which is fundamental for the trained model not to have serious underfitting or overfitting phenomena in the actual data. Moreover, a normalization component should be added to the model, including the preprocessing normalization of the data and the batch normalization in the model, which is also important to minimize the effect of noise in the data. The other issue is that even if the simulation experiments are conducted to expand the training dataset, the total number of samples is still very small, and the range and type of scenes covered by the simulation experiments are limited. Thus, it is necessary to increase the application of actual unlabeled data. Nowadays, SAR radar is widely used in large quantities and generates a large amount of data all the time. In future work, we will take a semi-supervised approach to allow models to extract features from unlabeled massive actual data. Many researchers have built semi-supervised models in deep learning, such as the knowledge distillation model proposed by Hinton that can be used for semi-supervised learning [48]. Organically combining simulation data and real data by a semi-supervised approach to further improve the layover recognition accuracy is our next research direction

6. Conclusions

This paper proposed a complex-valued FFT residual neural network that incorporates expert knowledge to overcome the low accuracy and inefficiency of layover detection in 3D SAR reconstruction. Given that the fusion of multi-dimensional features can improve the detection accuracy, the complex-valued U-Net was built, and the FFT residual component and phase convolution were designed according to expert knowledge. Meanwhile, considering the characteristics of layover, the focal loss was adapted to binary focal loss to train the designed model. This loss function can effectively solve the positive and negative imbalance and hard sample training problems of the layover. In the absence of layover truth, simulation experiments were designed to fit the actual situation to generate labeled multi-channel SAR data as the training and test datasets. Finally, a comparison experiment with the traditional methods was conducted. The experimental results indicated that our proposed method outperforms the existing traditional methods in all metrics, indicating the effectiveness of the method. Meanwhile, our method can improve the efficiency and accuracy of layover identification in 3D SAR modeling and finally improve the 3D SAR image quality.

Author Contributions

Conceptualization, Y.T., C.D. and F.Z.; methodology, Y.T. and F.Z.; software, Y.T.; validation, Y.T., M.S. and F.Z.; formal analysis, Y.T., C.D., M.S. and F.Z.; resources, C.D. and F.Z.; writing—original draft preparation, Y.T.; writing—review and editing, Y.T., M.S., C.D. and F.Z.; visualization, Y.T.; supervision, Y.T. and F.Z.; project administration, Y.T. and F.Z. All authors have read and agreed to the published version of the manuscript.

Funding

This work was supported by the National Key R&D Program of China (Grant No. 2021YFA0715404).

Data Availability Statement

Not applicable.

Acknowledgments

We would like to thank the editors and anonymous reviewers for their careful reading and constructive comments.

Conflicts of Interest

The authors declare no conflict of interest.

References

  1. Axelsson, S.R.J. Beam Characteristics of Three-Dimensional SAR in Curved or Random Paths. IEEE Trans. Geosci. Remote Sens. 2004, 42, 2324–2334. [Google Scholar] [CrossRef]
  2. Gini, F.; Lombardini, F.; Matteucci, P.; Verrazzani, L. System and Estimation Problems for Multibaseline InSAR Imaging of Multiple Layovered Reflectors. In Proceedings of the IGARSS 2001. Scanning the Present and Resolving the Future. Proceedings. IEEE 2001 International Geoscience and Remote Sensing Symposium (Cat. No.01CH37217), Sydney, NSW, Australia, 9–13 July 2001; Volume 1, pp. 115–117. [Google Scholar]
  3. Wilkinson, A.J. Synthetic Aperture Radar Interferometry: A Model for the Joint Statistics in Layover Areas. In Proceedings of the 1998 South African Symposium on Communications and Signal Processing-COMSIG ’98 (Cat. No. 98EX214), Rondebosch, South Africa, 8 September 1998; pp. 333–338. [Google Scholar]
  4. Tian, F.; Fu, Y.; Liu, H.; Li, G. Attitude angle error analysis of MIMO downward-looking array SAR. Sci. Surv. Mapp. 2020, 45, 65–71. [Google Scholar]
  5. Feng, D. Research on Three-Dimensional Reconstruction of Buildings from High-Resolution SAR Data. Ph.D. Thesis, University of Science and Technology of China, Heifei, China, 2016. [Google Scholar]
  6. Han, X.; Mao, Y.; Wang, J.; Wang, B.; Xiang, M. DEM reconstruction method in layover areas based on multi-baseline InSAR. Electron. Meas. Technol. 2012, 35, 66–70,85. [Google Scholar]
  7. Fu, K.; Zhang, Y.; Sun, X.; Li, F.; Wang, H.; Dou, F. A Coarse-to-Fine Method for Building Reconstruction from HR SAR Layover Map Using Restricted Parametric Geometrical Models. IEEE Geosci. Remote Sens. Lett. 2016, 13, 2004–2008. [Google Scholar] [CrossRef]
  8. Cheng, K.; Yang, J.; Shi, L.; Zhao, Z. The Detection and Information Compensation of SAR Layover Based on R-D Model. In Proceedings of the 2009 IET International Radar Conference, Guilin, China, 20–22 April 2009; pp. 1–3. [Google Scholar]
  9. Peng, X.; Wang, Y.; Tan, W.; Hong, W.; Wu, Y. Airborne Downward-looking MIMO 3D-SAR Imaging Algorithm Based on Cross-track Thinned Array. JEIT 2012, 34, 943–949. [Google Scholar] [CrossRef]
  10. Guo, R.; Zang, B.; Peng, S.; Xing, M. Extraction of Features of the Urban High-Rise Building from High Resolution InSAR Data. J. Xidian Univ. 2019, 46, 137–143. [Google Scholar]
  11. Chen, W.; Xu, H.; Li, S. A Novel Layover and Shadow Detection Method for InSAR. In Proceedings of the 2013 IEEE International Conference on Imaging Systems and Techniques (IST), Beijing, China, 22–23 October 2013; pp. 441–445. [Google Scholar]
  12. Ding, C.; Qiu, X.; Xu, F.; Liang, X.; Jiao, Z.; Zhang, F. Synthetic Aperture Radar Three-Dimensional Imaging—From TomoSAR and Array InSAR to Microwave Vision. J. Radars 2019, 8, 693–709. [Google Scholar] [CrossRef]
  13. Liu, N.; Xiang, M.; Mao, Y. Method for Layover Regions Detection Based on Interferometric Synthetic Aperture Radar. Sci. Technol. Eng. 2011, 11, 3975–3978. [Google Scholar]
  14. Gao, J.; Deng, B.; Qin, Y.; Wang, H.; Li, X. Enhanced Radar Imaging Using a Complex-Valued Convolutional Neural Network. IEEE Geosci. Remote Sens. Lett. 2019, 16, 35–39. [Google Scholar] [CrossRef] [Green Version]
  15. Oyama, K.; Hirose, A. Adaptive Phase-Singular-Unit Restoration with Entire-Spectrum-Processing Complex-Valued Neural Networks in Interferometric SAR. Electron. Lett. 2018, 54, 43–45. [Google Scholar] [CrossRef]
  16. Wilmanski, M.; Kreucher, C.; Hero, A. Complex Input Convolutional Neural Networks for Wide Angle SAR ATR. In Proceedings of the 2016 IEEE Global Conference on Signal and Information Processing (GlobalSIP), Washington, DC, USA, 7–9 December 2016; pp. 1037–1041. [Google Scholar]
  17. Sarroff, A. Complex Neural Networks for Audio. Ph.D. Thesis, Dartmouth College, Hanover, NH, USA, 2018. [Google Scholar]
  18. Bassey, J.; Qian, L.; Li, X. A Survey of Complex-Valued Neural Networks. arXiv 2021, arXiv:2101.12249. [Google Scholar] [CrossRef]
  19. Arjovsky, M.; Shah, A.; Bengio, Y. Unitary Evolution Recurrent Neural Networks. arXiv 2016, arXiv:1511.06464. [Google Scholar]
  20. Aizenberg, I.; Moraga, C. Multilayer Feedforward Neural Network Based on Multi-Valued Neurons (MLMVN) and a Backpropagation Learning Algorithm. Soft Comput. 2007, 11, 169–183. [Google Scholar] [CrossRef]
  21. Hirose, A. Complex-Valued Neural Networks: Advances and Applications; John Wiley & Sons: Hoboken, NJ, USA, 2013; ISBN 978-1-118-59006-5. [Google Scholar]
  22. Yao, X.; Shi, X.; Zhou, F. Complex-Value Convolutional Neural Network for Classification of Human Activities. In Proceedings of the 2019 6th Asia-Pacific Conference on Synthetic Aperture Radar (APSAR), Xiamen, China, 26–29 November 2019; pp. 1–6. [Google Scholar]
  23. Han, S.; Xiang, M. Approach for Shadow in Interferometric Synthetic Aperture Radar. Electron. Meas. Technol. 2008, 31, 4–6. [Google Scholar]
  24. Wu, Y.; Zhang, R.; Li, Y. The Detection of Built-up Areas in High-Resolution SAR Images Based on Deep Neural Networks. In Image and Graphics; Zhao, Y., Kong, X., Taubman, D., Eds.; Springer International Publishing: Cham, Switzerland, 2017; pp. 646–655. [Google Scholar]
  25. Wu, Y.; Zhang, R.; Zhan, Y. Attention-Based Convolutional Neural Network for the Detection of Built-Up Areas in High-Resolution SAR Images. In Proceedings of the IGARSS 2018—2018 IEEE International Geoscience and Remote Sensing Symposium, Valencia, Spain, 22–27 July 2018; pp. 4495–4498. [Google Scholar]
  26. Baselice, F.; Ferraioli, G.; Pascazio, V. DEM Reconstruction in Layover Areas from SAR and Auxiliary Input Data. IEEE Geosci. Remote Sens. Lett. 2009, 6, 253–257. [Google Scholar] [CrossRef]
  27. Gatelli, F.; Guamieri, A.M.; Parizzi, F.; Pasquali, P.; Prati, C.; Rocca, F. The Wavenumber Shift in SAR Interferometry. IEEE Trans. Geosci. Remote Sens. 1994, 32, 855–865. [Google Scholar] [CrossRef]
  28. Wu, H.-T.; Yang, J.-F.; Chen, F.-K. Source Number Estimator Using Gerschgorin Disks. In Proceedings of the Proceedings of ICASSP ’94. IEEE International Conference on Acoustics, Speech and Signal Processing, Adelaide, SA, Australia, 19–22 April 1994; Volume 4, pp. 261–264. [Google Scholar]
  29. Jiang, Z.; Zheng, T.; Carlson, D. Incorporating Prior Knowledge into Neural Networks through an Implicit Composite Kernel. arXiv 2022, arXiv:2205.07384. [Google Scholar]
  30. Jain, A.; Zongker, D. Feature Selection: Evaluation, Application, and Small Sample Performance. IEEE Trans. Pattern Anal. Mach. Intell. 1997, 19, 153–158. [Google Scholar] [CrossRef] [Green Version]
  31. Wang, S.; Jiang, H.; Fang, X.; Ying, Y.; Li, J.; Zhang, B. Radio Frequency Fingerprint Identification Based on Deep Complex Residual Network. IEEE Access 2020, 8, 204417–204424. [Google Scholar] [CrossRef]
  32. Wang, S.; Cheng, H.; Ying, L.; Xiao, T.; Ke, Z.; Zheng, H.; Liang, D. DeepcomplexMRI: Exploiting Deep Residual Network for Fast Parallel MR Imaging with Complex Convolution. Magn. Reson. Imaging 2020, 68, 136–147. [Google Scholar] [CrossRef] [Green Version]
  33. Wang, B.; Wang, Y.; Hong, W.; Wu, Y. Application of Spatial Spectrum Estimation Technique in Multibaseline SAR for Layover Solution. In Proceedings of the IGARSS 2008—2008 IEEE International Geoscience and Remote Sensing Symposium, Boston, MA, USA, 6–11 July 2008; Volume 3, p. III-1139-III–1142. [Google Scholar]
  34. Reigber, A.; Moreira, A. First Demonstration of Airborne SAR Tomography Using Multibaseline L-Band Data. IEEE Trans. Geosci. Remote Sens. 2000, 38, 2142–2152. [Google Scholar] [CrossRef]
  35. Fornaro, G.; Serafino, F.; Soldovieri, F. Three-Dimensional Focusing with Multipass SAR Data. IEEE Trans. Geosci. Remote Sens. 2003, 41, 507–517. [Google Scholar] [CrossRef]
  36. Guillaso, S.; Reigber, A. Scatterer Characterisation Using Polarimetric SAR Tomography. In Proceedings of the 2005 IEEE International Geoscience and Remote Sensing Symposium, 2005. IGARSS ’05, Seoul, Republic of Korea, 29 July 2005; Volume 4, pp. 2685–2688. [Google Scholar]
  37. Shruthi Bhamidi, S.B.; El-Sharkawy, M. 3-Level Residual Capsule Network for Complex Datasets. In Proceedings of the 2020 IEEE 11th Latin American Symposium on Circuits & Systems (LASCAS), San Jose, Costa Rica, 25–28 February 2020; pp. 1–4. [Google Scholar]
  38. Ioffe, S.; Szegedy, C. Batch Normalization: Accelerating Deep Network Training by Reducing Internal Covariate Shift. arXiv 2015, arXiv:1502.03167. [Google Scholar]
  39. Cogswell, M.; Ahmed, F.; Girshick, R.; Zitnick, L.; Batra, D. Reducing Overfitting in Deep Networks by Decorrelating Representations. arXiv 2016, arXiv:1511.06068. [Google Scholar]
  40. Srivastava, N.; Hinton, G.; Krizhevsky, A.; Sutskever, I.; Salakhutdinov, R. Dropout: A Simple Way to Prevent Neural Networks from Overfitting. J. Mach. Learn. Res. 2014, 15, 1929–1958. [Google Scholar]
  41. Lin, T.-Y.; Goyal, P.; Girshick, R.; He, K.; Dollár, P. Focal Loss for Dense Object Detection. In Proceedings of the IEEE International Conference on Computer Vision, Salt Lake City, UT, USA, 18–23 June 2018. [Google Scholar]
  42. Ronneberger, O.; Fischer, P.; Brox, T. U-Net: Convolutional Networks for Biomedical Image Segmentation. arXiv 2015, arXiv:1505.04597. [Google Scholar]
  43. Zhou, Z.; Siddiquee, M.M.R.; Tajbakhsh, N.; Liang, J. UNet++: A Nested U-Net Architecture for Medical Image Segmentation. In Deep Learning in Medical Image Analysis and Multimodal Learning for Clinical Decision Support; Springer: Cham, Switzerland, 2018. [Google Scholar]
  44. Chen, L.-C.; Papandreou, G.; Schroff, F.; Adam, H. Rethinking Atrous Convolution for Semantic Image Segmentation. arXiv 2017, arXiv:1706.05587. [Google Scholar]
  45. Chen, L.-C.; Zhu, Y.; Papandreou, G.; Schroff, F.; Adam, H. Encoder-Decoder with Atrous Separable Convolution for Semantic Image Segmentation. In Proceedings of the European conference on computer vision (ECCV), Munich, Germany, 8–14 September 2018. [Google Scholar]
  46. Men, G.; He, G.; Wang, G. Concatenated Residual Attention UNet for Semantic Segmentation of Urban Green Space. Forests 2021, 12, 1441. [Google Scholar] [CrossRef]
  47. Trabelsi, C.; Bilaniuk, O.; Zhang, Y.; Serdyuk, D.; Subramanian, S.; Santos, J.F.; Mehri, S.; Rostamzadeh, N.; Bengio, Y.; Pal, C.J. Deep Complex Networks. arXiv 2018, arXiv:1705.09792. [Google Scholar]
  48. Hinton, G.; Vinyals, O.; Dean, J. Distilling the Knowledge in a Neural Network. arXiv 2015, arXiv:1503.02531. [Google Scholar]
Figure 1. Array SAR 3D reconstruction flow chart introducing the location of our specific work in the overall process and the importance of this job.
Remotesensing 14 06087 g001
Figure 2. The geometry model of the layover. ν is the radar motion direction. Layover appears when the viewing angle θ is smaller than the slope angle β .
Remotesensing 14 06087 g002
Figure 3. The InSAR geometry model of layover area.
Remotesensing 14 06087 g003
Figure 4. The neural network framework.
Remotesensing 14 06087 g004
Figure 5. A complex-valued FFT residual learning block.
Remotesensing 14 06087 g005
Figure 6. Phase convolution consists of cv conv 1 × 9 in the azimuth direction and cv avgpool 3 × 1 in the range direction.
Remotesensing 14 06087 g006
Figure 7. The simulation experiment data. (A) shows the amplitude of channel 1 signal, (B) shows the interferogram of two channels, and (C) shows the truth of the layover that is represented as the white part in the figure.
Remotesensing 14 06087 g007
Figure 8. The illustration of the dataset. (A) shows the typical truth of pieces in the dataset, (B) shows the amplitude information of the corresponding pieces in the dataset, and (C) shows the rainbow figure of the interference phase in [ π , π ) .
Remotesensing 14 06087 g008
Figure 9. The results of traditional methods and our method in a relatively complete layover area.
Remotesensing 14 06087 g009
Figure 10. The actual data of the Shawan district: (a) is the SAR image; (b) is the optical image. The red box circles the area of our experiment.
Remotesensing 14 06087 g010
Figure 11. The layover detection result of our method in the actual data: (a) shows the selected SAR image; (b) shows the layover detection result of our method.
Remotesensing 14 06087 g011
Table 1. The simulation parameters of the multi-channel array SAR.
ParameterValue
wavelength cm 3.125
sampling rate MHz 360
PRF Hz 240
Carrier Speed m / s 100
Length of baseline m 9
pulse width μ s 1
Signal bandwidth   MHz 300
Reference slope distance m 7071
Down perspective   ° 45
SNR dB 20
Table 2. Evaluation of traditional methods and our method on the test dataset.
MethodsAccuracyPrecisionRecallFalse AlarmMissing Alarm
Amplitude0.87100.77210.60310.22740.3962
Coherency0.49810.12380.20270.87610.7972
Eigenvalue method0.95020.84910.48980.15040.5102
Our method0.97260.85810.73290.14190.2671
Note: The values in bold indicate the highest score of the corresponding metrics.
Table 3. Evaluation of other deep learning methods and our method.
MethodsAccuracyPrecisionRecallFalse AlarmMissing Alarm
U-Net [42]0.92620.76460.68570.23540.3143
U-Net++ [43]0.95390.84680.59590.15320.4041
DeepLabV3 [44]0.93020.84910.48980.15090.5102
DeepLabV3+ [45]0.94360.85930.60480.14070.3952
Our method0.97260.85810.73290.14190.2671
Note: The values in bold indicate the highest score of the corresponding metrics.
Table 4. Evaluation of Ablation experiments.
RBFFT-RBPCAccuracyPrecisionRecallFalse AlarmMissing Alarm
0.93310.79670.63740.20330.3626
0.96820.85530.72930.14470.2707
0.93390.80660.64250.19340.3575
0.97260.85810.73290.14190.2671
Note: The values in bold indicate the highest score of the corresponding metrics. RB denotes the residual block, FFT-RB denotes the FFT residual block, and PC represents the phase convolution component. ✓ indicated which components are used in the model of experiments.
Publisher’s Note: MDPI stays neutral with regard to jurisdictional claims in published maps and institutional affiliations.

