Article

Detection of White Leaf Disease in Sugarcane Crops Using UAV-Derived RGB Imagery with Existing Deep Learning Models

by
Narmilan Amarasingam
1,2,*,
Felipe Gonzalez
1,
Arachchige Surantha Ashan Salgadoe
3,
Juan Sandino
1 and
Kevin Powell
4
1
School of Electrical Engineering and Robotics, Faculty of Engineering, Queensland University of Technology (QUT), 2 George Street, Brisbane City, QLD 4000, Australia
2
Department of Biosystems Technology, Faculty of Technology, South Eastern University of Sri Lanka, University Park, Oluvil 32360, Sri Lanka
3
Department of Horticulture and Landscape Gardening, Wayamba University of Sri Lanka, Makandura, Gonawila 60170, Sri Lanka
4
Sugar Research Australia, P.O. Box 122, Gordonvale, QLD 4865, Australia
*
Author to whom correspondence should be addressed.
Remote Sens. 2022, 14(23), 6137; https://doi.org/10.3390/rs14236137
Submission received: 11 October 2022 / Revised: 22 November 2022 / Accepted: 30 November 2022 / Published: 3 December 2022

Abstract

:
White leaf disease (WLD) is an economically significant disease in the sugarcane industry. This work applied remote sensing techniques based on unmanned aerial vehicles (UAVs) and deep learning (DL) to detect WLD in sugarcane fields at the Gal-Oya Plantation, Sri Lanka. The established methodology to detect WLD consists of UAV red, green, and blue (RGB) image acquisition, the pre-processing of the dataset, labelling, DL model tuning, and prediction. This study evaluated the performance of the existing DL models such as YOLOv5, YOLOR, DETR, and Faster R-CNN to recognize WLD in sugarcane crops. The experimental results indicate that the YOLOv5 network outperformed the other selected models, achieving a precision, recall, mean average [email protected] ([email protected]), and mean average [email protected] ([email protected]) metrics of 95%, 92%, 93%, and 79%, respectively. In contrast, DETR exhibited the weakest detection performance, achieving metrics values of 77%, 69%, 77%, and 41% for precision, recall, [email protected], and [email protected], respectively. YOLOv5 is selected as the recommended architecture to detect WLD using the UAV data not only because of its performance, but this was also determined because of its size (14 MB), which was the smallest one among the selected models. The proposed methodology provides technical guidelines to researchers and farmers for conduct the accurate detection and treatment of WLD in the sugarcane fields.

Graphical Abstract

1. Introduction

Sugarcane (Saccharum officinarum) is one of the most significant economic crops in the world [1,2,3]. It is a tropical crop used for sugar extraction, especially in Sri Lanka [4,5]. It may be grown in various soil types, including sand, hard clay, and organic soils [6]. One of the most economically impacting diseases in the sugarcane sector and affecting sugarcane yields is white leaf disease (WLD) [7]. A phytoplasma causes WLD, and it is transmitted by leafhoppers [8], and sugarcane crops infected with WLD do not always exhibit symptoms [8]. Farmers use a variety of agronomic practices for disease management. However, most of them are based on conventionally monitoring them, which is inaccurate and time-consuming. Moreover, modern techniques have been slowly adopted to the crops due to a lack of knowledge and technological resources, a high level of investment, and unwillingness to adopt the new technologies. Consequently, it may diminish the sugarcane’s productivity [6].
The traditional approach to disease diagnosis primarily evaluates the crop health or type of disease by employing human-based field monitoring and assessments [4,9,10,11,12,13,14]. This technique regulates the agricultural output by manually observing the colour, size, and form of the disease spots on the crop leaves, which has issues such as the need for field experts, lengthy diagnosis times, and a low work efficiency [15]. In addition, numerous researchers are striving to improve the WLD diagnosis methods by laboratory-based testing, particularly the polymerase chain reaction (PCR) test, which is time-consuming and costly [8]. The methods based on precision agriculture have been recently adopted as one of the effective applications [16,17,18,19] that improve the productivity of the sugarcane as they offer the quick and simple detection of WLD-affected areas in the sugarcane fields, enabling the timely control and prevention of propagating the infestation [8].
The use of small unmanned aerial vehicles (UAVs) or drones combined with artificial intelligence (AI) techniques for object detection from airborne UAV imagery have been recently established as one of the most effective precision agricultural practices in crop fields [20,21,22,23] in recent years [24,25,26,27,28,29,30,31,32,33,34]. UAVs equipped with various image sensors or cameras such as red, green, and blue (RGB), multispectral, and hyperspectral ones, have become alternatives for rapid, accurate, and non-destructive high-throughput phenotyping [35] which generates high-resolution images, which has great potential in identifying pests and diseases in agriculture [36,37,38]. In recent years, remote sensing applications have increasingly employed deep learning (DL) methods [35,39,40,41,42,43,44] as they can offer more effective processing models than traditional image processing algorithms can, and they appear to hold considerable potential for improved precision [45,46,47]. Many researchers are working with different DL models for various agricultural applications, including crop mapping, the detection of fruits, the identification of pests and diseases, crop counting, and the identification of weeds. Table 1 illustrates some DL techniques used in agricultural applications in recent years.
Most of the recent studies focused on similar agricultural applications have employed three key DL models: (1) the you only look once (YOLO) ones such as YOLOv5 and YOLOR, (2) faster region-based convolutional neural networks (R-CNN), and (3) detection transformers (DETR). YOLO is a widespread neural network that can recognize the bounding boxes of objects from raw image pixels in an image and the probability that they belong to a particular class in a single step [53,64]. One of the recent versions of YOLO, namely YOLOv5, is a one-stage object detection detector that accurately detects objects in real time. Another version of YOLO is YOLOR, a cutting-edge DL technique for object detection that differs from YOLOv1–YOLOv5 as it is a unified network that encodes implicit and explicit information [65]. Faster R-CNNs aim to detect objects in any input image by constructing their bounds. The key benefits of Faster R-CNN models include a very high mean average precision (mAP), a single-stage training employing multitask loss, and no need for disc storage for feature caching [53]. The DETR networks are set-based object detectors that use a transformer on a convolutional backbone [66]. DETR can predict all of the items concurrently, and they are trained end-to-end with a loss function that matches the expected and ground truth objects [67].
There have been many studies conducted using existing DL models for different crops. Nevertheless, there has been little research conducted to improve the productivity in sugarcane crops using DL [68,69,70,71,72,73]. Only a few studies were conducted in different countries to detect WLD in sugarcane crops using classical image processing techniques, but no studies have been conducted to detect WLD using DL models with UAV imagery in Sri Lanka. The closest implementation by Narmilan et al. [74] presented a pipeline to detect WLD using classical machine learning (ML) techniques from multispectral UAV imagery, highlighting a few limitations in the prediction of the areas with WLD using ML models. Therefore, this study aims to evaluate the performance of the existing cutting-edge DL models from the collected airborne UAV imagery in sugarcane crops exposed to WLD. The four primary objectives of this study were to: (1) detect WLD using YOLOv5, YOLOR, DETR, and Faster R-CNN models; (2) compare the performance of existing models by evaluating the predictive accuracy of these models for WLD detection; (3) converge on a pipeline and DL model that will aid in monitoring and managing WLD by eliminating the need for conventional techniques for crop assessment and validation; (4) establish the guidelines for detecting WLD using the DL techniques with UAV imagery for researchers and farmers.

2. Methodology

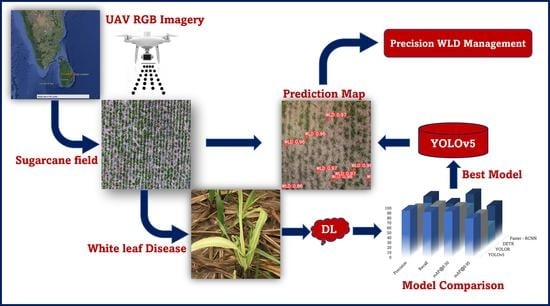
2.1. Process Pipeline

Figure 1 depicts the development of a process pipeline with five primary components: acquisition, pre-processing, labelling, DL architecture, and prediction for detecting WLD.

2.2. Study Area

The study site is located at Gal-Oya Plantation, Hingurana, in the eastern region of Sri Lanka (7°16′42.94”N, 81°42′25.53”E), with an area extent of 0.75 ha. As shown in Figure 2, approximately 0.4 ha of the studied area was split for data training, 0.15 ha was used for testing, and 0.2 ha was used for validation. The research site has a tropical monsoon environment, with the annual precipitation averaging between 1100 and 1600 mm, and the yearly air temperature averaging between 15 °C and 23 °C. The experiment was conducted in October 2021 during the sugarcane growing season. For this experiment, two-month-old sugarcane plants with an average plant height of 1.2 m were chosen. The plants infected with WLD were randomly picked following the natural disease incidence pattern throughout the field. During this experiment, field agronomists confirmed the following: (1) the irrigation water was applied via the ridges and furrows system without any water stress (2) the entire site was covered with homogenous sandy to clay loam soils, and (3) the recommended amount of fertilizer was applied without any fertilizer stress.

2.3. UAV Image Acquisition

A DJI Phantom 4 (Da-Jiang Innovations (DJI), Shenzhen, Guangdong, China) equipped with a real-time kinematic (RTK) module was used to capture RGB images using the drone’s inbuilt CMOS RGB sensor, which has an effective pixel resolution of 2.08 MP. The flight mission parameters, namely the flight path, speed, height, and overlapping were set to collect the raw images using the DJI GS Pro software. The UAV flight operation was conducted during the growing season on a sunny day between 11:00 and 12:00 (Sri Lankan standard time) in October 2021. The flight height above the ground, velocity, and ground sample distance were, respectively, 20 m, 1.4 m/s, and 1.1 cm/pixel. As illustrated in Figure 1, the front and side overlaps of the pictures on the flight line were of 75% and 65%, respectively. Once the flights were completed, the RGB images were transferred to a ground control station (laptop) through the plug-and-play SD card of the UAV.

2.4. Ground Truth Data Collection

Agronomists evaluated and identified the plants infected with WLD as the ground truth before acquiring the UAV imagery [74]. As depicted in Figure 3, the red colour tags were installed adjacent to the plants with WLD, ensuring no shading nor reflectance could have impacted the imagery acquisition of the plants, as confirmed by the field specialists. The infected plants were identified using their appearance of pure white leaves with stunted growth [75].

2.5. Image Orthomosaics

At the initial level of image pre-processing, Agisoft Metashape 1.6.6 (Agisoft LLC, Petersburg, Russia) was used to create RGB orthomosaics for analysis. The image processing pipeline of Agisoft Metashape consists of three primary processes, namely, alignment, the 2.5D digital elevation model (DEM), and orthomosaic creation. The output orthomosaic was georeferenced and utilized as a basic layer for many types of maps, as well as for additional post-processing analysis and vectorization. As illustrated in Figure 2, the above processes were executed to generate georeferenced RGB orthomosaics for the training, testing, and validation sites.

2.6. Image Tiles

Each RGB orthomosaic image for training, testing, and validation was sliced into tiles using ENVI 5.5.1 (Environment for Visualizing Imagery, 2018, L3Harris Geospatial Solutions Inc., Broomfield, CO, USA). Previous studies using YOLOv5 [76,77] have confirmed the optimal results by processing images in the input later with dimensions of 640 × 640 pixels, and these were dimensions that were also applied in this study per tile, obtaining a total of 110, 40, and 60 tile images for the training, testing, and validation, respectively. Larger image sizes usually lead to better results with the cost of taking longer times to process them and using more memory [12]. Most of the time, optimal results can be obtained with no changes being made to the established DL models or their training parameters [78,79,80].

2.7. Image Augmentation

The quantity of available data for training, testing, and validation is crucial to the success of any technique based on DL. To increase the model’s performance, augmentation techniques such as random rotation, flip, random blur, and random brightness were used to generate additional images. Using the Python Augmentor package 0.2.9, the selected DL models were tuned using a total of 1200 training images, 240 testing images, and 240 validation images. Augmenting the validation dataset is not a typical procedure in DL. However, some exceptional cases can be applied to the augmentation step for the validation dataset. The first case is that if the validation and/or test datasets are too small for a model to evaluate them reliably, it might make sense to use data augmentation [81]. The second case is that real-world data have more variations with the selected dataset for validation, so it is possible to check the model’s performance using different augmented validation images. Some studies have applied these techniques to develop their models in various sectors [81,82,83,84,85]. In this study, all of the infected crops did not look the same. Therefore, we applied the augmentation technique to the validation dataset to further validate the model’s performance.

2.8. Image Labelling

The training and testing image datasets were manually labelled using the LabelImg 1.4.0 (Python based image annotation tool) as shown in Figure 4. The infected plants were precisely marked with a bounding box, and the annotations were validated by experts using photointerpretation. Each annotation was stored in text files as metadata using the YOLO format, which contains key information such as the image titles, target category names, target category IDs, and target frame locations.

2.9. Steps in Different DL Models

This experiment compared the performance of four DL object detection models (YOLOv5, YOLOR, DETR, and Faster R-CNN). The training phase was conducted on the Google Colab Pro Plus platform, which was equipped with a graphics processing unit (GPU) [23]. The images and matching labels were inputted into the models, and then, the position and category of the prediction box were acquired during the model’s development. Finally, different performance indicators were used to assess the object detection models.

2.9.1. YOLOv5

After completing the annotation process mentioned in Section 2.8, the dataset was uploaded to Google Drive and mounted into Google Colab to train a cloned instance of YOLOv5 from https://github.com/ultralytics/yolov5 (accessed on 6 June 2022). Two configuration files were created before training the model, namely, the model architecture and the training configuration. The model architecture file provides information regarding the number of classes in the dataset, the pre-computed anchors, the backbone and neck of the model, the structure of layers, the number of layers, and the filters. The training configuration file specifies the paths for the training and testing datasets, and the number of classes (one), and the class names (WLD). In step 4, as shown in Figure 5, the training procedure for YOLOv5 began by executing the training command. Finally, inference was applied to the tuned model to evaluate the crop plants with WLD that were identified.

2.9.2. YOLOR

The applied methodology to fit a YOLOR model is almost identical to the one applied for YOLOv5. The YOLOR model, however, comes with some pre-trained weights. After uploading the dataset to Google Drive, the YOLOR repository was cloned from https://github.com/roboflow-ai/yolor (accessed on 22 June 2022) into Google Colab. The YOLOR pre-trained weights were downloaded, and a configuration was created to set the number of classes in the dataset before training the model. Finally, training and inferencing were performed to detect the WLD in the image as shown in Figure 6.

2.9.3. DETR

In order to train a DETR model, the annotated dataset needed to be converted from the YOLO formatted label files (.txt) into the COCO format (.json). The DETR repository was cloned from https://github.com/facebookresearch/detr.git (accessed on 7 July 2022), and a custom code for DETR was cloned from https://github.com/woctezuma/detr.git (accessed on 7 July 2022) into Google Colab. Similar to the process applied to YOLOR, the pre-trained weights were loaded, and the first-class index, number of classes, and finetuned classes were set before tuning the model. Finally, the tuned model was loaded for the inference of WLD in the sugarcane field as shown in Figure 7.

2.9.4. Faster R-CNN

The Detectron2 library, a popular PyTorch-based modular computer vision model, was installed into Google Colab and cloned from https://github.com/facebookresearch/detectron2 (accessed on 2 August 2022). The dataset with a COCO format was loaded to train the model. The Detectron2 training configuration and the custom training configuration were created. The model weights, the images per batch, the iterations, the batch size per image, and the number of classes were tuned to train the model as shown in Figure 8. Finally, the testing was conducted using the model weights, detectron2.evaluation, and the threshold level.

2.10. Evaluation Metrics

The evaluation metrics such as precision, recall, intersection over union (IoU), and mAP were employed to evaluate the performance of the studied models. As defined in Equation (1), precision is the mean between the total number of correctly detected WLD images and the total number of rightly and wrongly detected WLD images. Recall (Equation (2)) is the average number of correctly identified WLD images relative to the total number of successfully identified and undetected images. mAP is computed by taking the mean of the average accuracy (AP) of all of the classes, as shown in Equation (4), where q is the number of queries, and AveP(q) is the average precision for the query in question. The mAP is calculated employing IoU. A value between 0 and 1 indicates the amount of overlap between the expected and ground truth bounding boxes (Equation (3)).
Precision = T P T P + F P
Recall = T P T P + F N
IoU = A r e a   o f   I n t e r s e c t i o n A r e a   o f   U n i o n
mAP = q = 1 Q A v e P ( q ) Q

3. Results

3.1. Visual Analysis of Evaluation Indicators during Training

In this study, the tensor board visualization toolkit and the Wandb experiment tracking tool were configured to visualize the training process and dynamically monitor each of the model’s training performances and operations (i.e., YOLOv5, YOLOR, DETR, and Faster R-CNN) as shown from Figure 9, Figure 10, Figure 11 and Figure 12. At the completion of the training step, the DL model reached convergence, and the optimal model weights were determined.
In terms of the YOLOv5 training process, as shown in Figure 9, the precision, recall, and mAP at 50% of IoU threshold ([email protected]) and the mAP at 95% of IoU threshold ([email protected]) increased rapidly from epoch 0 to epoch 200, which was followed by a slow increase from epoch 200 to epoch 600. At epoch 599, YOLOv5 achieved metrics values of 95%, 92%, 93%, and 79% for precision, recall, [email protected], and [email protected], respectively. At the same time, the loss function value dropped rapidly from epoch 0 to epoch 300, and then it finally reached a stable value of approximately 0.016.
In the YOLOR training process, as shown in Figure 10, the precision, recall, [email protected], and [email protected] increased rapidly from epoch 0 to epoch 100. However, the [email protected] did not improve after reaching epoch 300. [email protected] increased gradually from epoch 300 to epoch 600. Finally, the model obtained stable metrics values such as 87%, 93%, 90%, and 75% for precision, recall, [email protected], and [email protected], respectively. At the same time, the loss function value dropped rapidly from epoch 0 to epoch 400, and we obtained the constant value of 0.008. As depicted in Figure 11, the mAP value of the DETR model experienced a rapid increase from epoch 0 to epoch 300 until reaching a plateau during the remaining epochs. The model’s converged metrics were of 77%, 69%, 77%, and 41% for precision, recall, [email protected], and [email protected], respectively. Similarly, the loss function value dropped rapidly from epoch 0 to epoch 200 for the training and testing datasets.
Figure 12 illustrates the evolution of metrics of the Faster R-CNN model during training. From iteration 0 to 2000, the model parameters fluctuated significantly. The model’s performance was constantly adjusted as the number of model iterations rose from 2000 to 14,000. Eventually, the index became gradually stable, and the class accuracy reached approximately 97%, and then it stabilized over the course of 14,000–15,000 iterations. In addition, the value of the loss function decreased throughout the training phase. Considering the impact of the number of iterations on the model’s stability and performance, the ideal number of iterations in this investigation was 14,000.

3.2. Comparison of DL Model Performances

The selected DL models for WLD detection were evaluated by comparing the operation time, final model size, precision, recall, [email protected], and [email protected]. A synthesis of the results is shown in Table 2 and Table 3 and in Figure 13. Each trained model was evaluated against the testing site dataset.
Overall, the YOLOv5 model obtained the highest values of precision, [email protected], and [email protected], of 95%, 93%, and 79%, respectively. However, the highest recall value of 93% was obtained by YOLOR, which produced 87% precision, 90% [email protected], and 75% [email protected]. From all of the models, DETR obtained the weakest detection metrics of 77%, 69%, 77%, and 41% for precision, recall, [email protected], and [email protected], respectively. The Faster R-CNN obtained a better overall performance than the DETR model did, but it had an inferior detection performance than the YOLOv5 and YOLOR models did. A graphical representation of the performance comparison for different DL models is depicted in Figure 13.

3.3. Training Duration

As shown in Table 3, the training times of YOLOv5, YOLOR, DETR, and Faster R-CNN were around 6 h, 12 h, 30 h, and 3 h, respectively. The Faster R-CNN was the fastest trained model, and DETR was the model that took longer to converge.

3.4. Bounding Box Detection Results from the Different DL Models

The detection of the infected plants with WLD using bounding boxes were evaluated against the ground truth annotations (Figure 14), and these are shown in Figure 15, Figure 16, Figure 17 and Figure 18 for YOLOv5, YOLOR, DETR, and Faster R-CNN, respectively. Based on the evaluation metrics, the recognition effect of the YOLOv5 network for WLD was better than that of the other models. Associated with the performance metrics, the DETR model shown poor inference results in identifying the infected plants.

3.5. Model Comparison with Previous Work

Narmilan et al. [74] presented an approach for detecting WLD in the same field and during the same growing season using UAV multispectral imagery and traditional ML classifiers such as extreme gradient boosting (XGB), random forest (RF), decision tree (DT), and K-nearest neighbours (KNN). As shown in Table 4, the XGB, RF, and KNN models achieved detection accuracies that were between 69% and 72% to detect WLD in the field, which are lower than the performance metrics obtained in this study. In the previous study, the margin of all of the leaves per infected plant was classified as WLD due to the dead leaves, which appeared to be WLD symptoms. However, the proposed DL models did not classify the crops with dead leaves as WLD crops in the sugarcane field.

4. Discussion

This paper aimed to utilize existing DL models to detect sugarcane plants with WLD using UAV-derived RGB imagery. The proposed DL model is crucial for sugarcane farmers and other agronomists or researchers as they can detect the sugarcane WLD and take the necessary precautions to avoid spreading the disease. This investigation used RGB imagery because visible light image capture is comparatively straightforward and less expensive than multispectral and hyperspectral sensor acquisition is. Consequently, this technique can be broadly implemented by researchers, farmers, and other stakeholders. Other UAV remote sensing studies used various sensors such as RGB, multispectral, hyperspectral, and LiDAR ones based on their objectives and applications. RGB cameras are highly suited for the determination of canopy height and lodging, multispectral cameras are highly suited for drought stress detection, pathogen detection, the estimation of nutrients, the determination of growth vigour, and yield prediction, and also, hyperspectral cameras are more suitable for the identification of diseases, weed detection, and the assessment of the nutrient status.
In general, multispectral, and hyperspectral sensors are more suited well to identifying plant disease characteristics in images of the canopy than RGB cameras are as they give rich spectral and material composition information. The multispectral and hyperspectral images provide relevant bands such as near-infra-red (NIR) and red edge ones, which are most suitable for differentiating healthy and diseased plants. Hyperspectral cameras have been demonstrated to be capable of characterizing vegetation type, health, and function. Additionally, many vegetation indices (VI) can be developed through the use of multispectral and hyperspectral images. However, the current drawback of multispectral and hyperspectral cameras is that they have a significantly higher cost, leading to reduced adaptation by farmers in the sugarcane industry. Based on the lower cost, light weight, ease of use, simplicity of the data processing, and reasonably low specifications for the working environment of RGB cameras, these were chosen in this study in combination with DL for WLD detection.
According to the results, YOLOv5 is more effective than the other models are at detecting WLD. Many other researchers also have reached the same conclusion for different crops for different diseases. For instance, YOLOv5 was used to detect apple leaf diseases with a [email protected] of 96.04% [85]. Yao et al. [62] used a real-time kiwifruit flaw detection system based on YOLOv5, and they attained 94.7% [email protected]. Using edge computing, the smart strawberry farming model achieved efficient disease detection with a 92% accuracy [86]. Another experiment was conducted by Mathew et al. [87] on disease detection in bell peppers, applying YOLOv5, and they obtained a [email protected] value of 90.7%. The apple leaf disease identification method based on improved YOLOv5 was conducted by Wang et al. [88], and the average precision attained was 83.4%. YOLOv5 provides each batch of training data via the data loader, and it simultaneously enriches the training data. However, some of the previous studies achieved lower objection detection accuracy values. For example, the DL-based rice leaf disease detection experiment with YOLOv5 was performed with 100 epochs, and it has shown the best performance with mAP values of 62% [89]. Moreover, Yu et al. (2021) [90] conducted a study on the early identification of pine wilt disease utilizing UAV-based multispectral imagery with YOLOv4, and they achieved a mAP of 57.07%. Sun et al. (2022) [91] detected the pine wilt nematode from UAV images using UAV, enhanced MobileNetv2-YOLOv4, Faster R-CNN, YOLOv4, and SSD, and the findings indicate that the improved MobileNetv2-YOLOv4 method has an average precision of 86.85%.
Current agricultural practices in sugarcane crops use different versions of YOLO to improve the sugarcane productivity. Paliyam et al. [68] presented a pipeline for obtaining georeferenced points of the objects of interest in images taken from vehicles on the road using YOLOv5 to predict the bounding boxes around sugarcane crops. Murugeswari et al. [69] also used YOLOv5 and Faster R-CNN to detect the sugarcane eyespot disease. However, Faster R-CNN proves to be a better and more efficient model for detecting diseases than YOLOv5 is [69]. Chen et al. (2021) and Zhu et al. (2022) applied YOLOv4 for sugarcane stem node recognition, and the research shows that it was a feasible method for the real-time detection of sugarcane stem nodes in a complex natural environment [70,71]. Malik et al. (2019) applied YOLOv3 for the recognition of different diseases, including helminthosporium leaf spot, red rot, cercospora leaf spot, rust, and yellow leaf disease in sugarcane crops [72]. In addition to this study, sugarcane red stripe disease detection using YOLO was conducted by Kumpala et al. (2022) [73].
Next to the YOLOv5, another selected model, YOLOR, also gave good detection results. However, previous studies on YOLOR and precision agriculture were not found in the widely used research databases. Even though a few researchers gave applied Faster R-CNN for plant disease detection, similar results were obtained. For example, Yu et al. (2021) [90] performed a study on the detection of pine wilt disease using DL models and multispectral imagery using Faster R-CNN, and they attained a mAP of 60.8%. Cynthia et al. (2019) [92] obtained an accuracy of 67.34% using Faster R-CNN to detect the plant disease. However, few of the previous studies attained a good detection accuracy. For instance, the experiment on tomato disease recognition used Faster R-CNN, and the result was obtained with mAP values of 90.87% [93]. Another experiment on sugarcane crops for disease detection using Faster R-CNN with an android application was performed by Murugeswari et al. (2022) [69], and the results demonstrate that Faster R-CNN is a more effective algorithm than YOLOv5 is for detecting diseases, which will aid the farmers in more accurately predicting the diseases. Meanwhile, the DETR model was given the lowest accuracy for detecting WLD, but one of the experimental results on tomato leaf disease segmentation and damage evaluation using DETR reached 96.40% [94].
A comparison between the traditional ML and DL models was evaluated in this study, and the findings stated that the lower precision and recall values were achieved in XGB, RF, DT, and KNN to identify WLD. Similar research was performed by Yu et al. (2021) [90] to examine two DL models (Faster R-CNN and YOLOv4) and two classical ML strategies based on feature extraction (Support vector machine (SVM) and RF) to identify the infected pine plants. The accuracy of the conventional ML models ranged from 73.28% to 79.64%. During this study site, one of the interferences of detecting WLD crops is the background colour (ground). The farmers applied mulch (old leaves of sugarcane crops) to the sugarcane field. Therefore, the soil was covered entirely by mulch. Therefore, there is a chance of misclassifying WLD and the ground (background) because of the same colour of the WLD crops and the mulch. As a result, it affects the accuracy of the detection, and it leads to erroneous in the assessments of plant diseases. In a future study, this interference can be eliminated by removing the ground or background from all of the healthy and WLD crops by applying a mask using vegetation indices such as excess green (ExG). Additionally, future research will focus on multispectral and hyperspectral data with DL algorithms to enhance the detection accuracy.
The proposed methodology can be applied to disease detection in other crops because previous works (see Table 1) have also used the same proposed YOLO models in different agricultural applications. However, some challenges limit the applications of YOLO models in agricultural fields. These challenges include the need for high-resolution RGB images, them consuming more time for the labelling process, and interferences with the background or ground. However, the proposed model and methodology have several advantages in precision agriculture. The benefits include the accurate detection of diseased plants and their location for timely treatment. However, the economic concern is one of the critical factors affecting the farmers’ adaptation to this technology, especially in developing countries. The high initial investment in UAVs and sensors is a major limiting economic factor in precision agriculture. However, the cost of identifying the disease by a traditional method, such as a human walking through the field, is higher than the disease detection method by the UAV technique.

5. Conclusions

Our findings offer a methodology of WLD detection based on UAV imagery and DL techniques. The WLD detection data using YOLOv5 were superior to those of the other models (YOLOR, DETR, and Faster R-CNN). YOLOv5 achieved the highest precision, [email protected] and [email protected] for the detection of WLD. DETR, on the other hand, exhibited a poor detection performance by reaching the lowest metrics values. The parameter size of YOLOv5 was the smallest among the selected models. However, Faster R-CNN consumed the shortest time to train the model among the models, and the DETR model took the longest time to train the dataset. In this investigation, the YOLOv5 model demonstrated obvious benefits in terms of its model size, precision, [email protected], and [email protected], which can be used to detect WLD. Inference performances from the evaluated DL models can be further enhanced by collecting very high-resolution RGB imagery, training a model with a large quantity of images, or by using multispectral or hyperspectral images. Additionally, future studies can be concentrated on integrating DL with UAV which will then make judgments independently without the use of human effort. However, the use of UAVs in the sugarcane industry is still in its infancy, and there is an opportunity for further growth in terms of both the technologies of UAVs and DL. In summary, the UAV-based DL techniques are currently the most effective method of detecting WLD in sugarcane crops.

Author Contributions

N.A. conducted the UAV flight mission and analysis and prepared the manuscript as a corresponding author for final submission. F.G. and J.S. provided overall supervision and contributed to the writing and editing. A.S.A.S. provided the technical guidance to conduct the UAV flight mission, research design, and feedback on the draft manuscript. K.P. contributed to the manuscript editing. All authors have read and agreed to the published version of the manuscript.

Funding

This research received no external funding, and the APC was funded by Queensland University of Technology (QUT)

Data Availability Statement

Not applicable.

Acknowledgments

The authors thank the Gal-Oya Plantation in Sri Lanka for permitting the UAV flight operations and ground truth data collection. In addition, the authors are incredibly grateful to the Centre for Agriculture and the Bioeconomy (CAB), Queensland university of technology (QUT), South Eastern University of Sri Lanka (SEUSL), Accelerating Higher Education Expansion and Development (AHEAD), and the World Bank for awarding us a scholarship for the tuition fee and cost of living for the PhD study. We would like to thanks to QUT Centre for Robotics (QCR) for their technical support to complete the image analysis. Finally, the authors would like to acknowledge the assistance of their friends and co-workers throughout the experiment. We appreciate the informative comments made by anonymous reviewers and editors regarding our article.

Conflicts of Interest

The authors declare no conflict of interest.

References

  1. Sumesh, K.C.; Ninsawat, S.; Som-ard, J. Integration of RGB-based vegetation index, crop surface model and object-based image analysis approach for sugarcane yield estimation using unmanned aerial vehicle. Comput. Electron. Agric. 2021, 180, 105903. [Google Scholar] [CrossRef]
  2. Chen, J.; Wu, J.; Qiang, H.; Zhou, B.; Xu, G.; Wang, Z. Sugarcane nodes identification algorithm based on sum of local pixel of minimum points of vertical projection function. Comput. Electron. Agric. 2021, 182, 105994. [Google Scholar] [CrossRef]
  3. Huang, Y.-K.; Li, W.-F.; Zhang, R.-Y.; Wang, X.-Y. Color Illustration of Diagnosis and Control for Modern Sugarcane Diseases, Pests, and Weeds; Springer: Berlin/Heidelberg, Germany, 2018. [Google Scholar] [CrossRef]
  4. Braithwaite, K.S.; Croft, B.J.; Magarey, R.C. Progress in Identifying the Cause of Ramu Stunt Disease of Sugarcane. Proc. Aust. Soc. Sugar Cane Technol. 2007, 29, 235–241. [Google Scholar]
  5. Wang, X.; Zhang, R.; Shan, H.; Fan, Y.; Xu, H.; Huang, P.; Li, Z.; Duan, T.; Kang, N.; Li, W.; et al. Unmanned Aerial Vehicle Control of Major Sugarcane Diseases and Pests in Low Latitude Plateau. Agric. Biotechnol. 2019, 8, 48–51. [Google Scholar]
  6. Amarasingam, N.; Salgadoe, A.S.A.; Powell, K.; Gonzalez, L.F.; Natarajan, S. A review of UAV platforms, sensors, and applications for monitoring of sugarcane crops. Remote Sens. Appl. 2022, 26, 100712. [Google Scholar] [CrossRef]
  7. Wickramasinghe, K.P.; Wijesuriya, A.; Ariyawansha, B.D.S.K.; Perera, A.M.M.S.; Chanchala, K.M.G.; Manel, D.; Chandana, R.A.M. Performance of Sugarcane Varieties in a White Leaf Disease (WLD)-Prone Environment at Pelwatte. November 2019. Available online: http://sugarres.lk/wp-content/uploads/2020/05/Best-Paper-Award-–-Seventh-Symposium-on-Plantation-Crop-Research-2019.pdf (accessed on 5 May 2022).
  8. Sanseechan, P.; Saengprachathanarug, K.; Posom, J.; Wongpichet, S.; Chea, C.; Wongphati, M. Use of vegetation indices in monitoring sugarcane white leaf diseasesymptoms in sugarcane field using multispectral UAV aerial imagery. IOP Conf. Ser. Earth Environ. Sci. 2019, 301, 12025. [Google Scholar] [CrossRef]
  9. Cherry, R.H.; Nuessly, G.S.; Sandhu, H.S.; Insect Management in Sugarcane. Florida. 2011. Available online: http://edis.ifas.ufl.edu/pdffiles/IG/IG06500.pdf (accessed on 11 May 2022).
  10. Wilson, B.E. Successful Integrated Pest Management Minimizes the Economic Impact of Diatraea saccharalis (Lepidoptera: Crambidae) on the Louisiana Sugarcane Industry. J. Econ. Entomol. 2021, 114, 468–471. [Google Scholar] [CrossRef]
  11. Huang, W.; Lu, Y.; Chen, L.; Sun, D.; An, Y. Impact of pesticide/fertilizer mixtures on the rhizosphere microbial community of field-grown sugarcane. 3 Biotech 2021, 11, 210. [Google Scholar] [CrossRef]
  12. Vennila, A.; Palaniswami, C.; Durai, A.A.; Shanthi, R.M.; Radhika, K. Partitioning of Major Nutrients and Nutrient Use Efficiency of Sugarcane Genotypes. Sugar Tech 2021, 23, 741–746. [Google Scholar] [CrossRef]
  13. He, S.S.; Zeng, Y.; Liang, Z.X.; Jing, Y.; Tang, S.; Zhang, B.; Li, M. Economic Evaluation of Water-Saving Irrigation Practices for Sustainable Sugarcane Production in Guangxi Province, China. Sugar Tech 2021, 23, 1325–1331. [Google Scholar] [CrossRef]
  14. Verma, K.; Garg, P.K.; Prasad, K.S.H.; Dadhwal, V.K.; Dubey, S.K.; Kumar, A. Sugarcane Yield Forecasting Model Based on Weather Parameters. Sugar Tech 2021, 23, 158–166. [Google Scholar] [CrossRef]
  15. Wang, H.; Shang, S.; Wang, D.; He, X.; Feng, K.; Zhu, H. Plant Disease Detection and Classification Method Based on the Optimized Lightweight YOLOv5 Model. Agriculture 2022, 12, 931. [Google Scholar] [CrossRef]
  16. Narmilan, G.N.; Sumangala, K. Assessment on Consequences and Benefits of the Smart Farming Techniques in Batticaloa District, Sri Lanka. Int. J. Res. Publ. 2020, 61, 14–20. [Google Scholar] [CrossRef]
  17. Narmilan, A.; Puvanitha, N. Mitigation Techniques for Agricultural Pollution by Precision Technologies with a Focus on the Internet of Things (IoTs): A Review. Agric. Rev. 2020, 41, 279–284. [Google Scholar] [CrossRef]
  18. Narmilan, A.; Niroash, G. Reduction Techniques for Consequences of Climate Change by Internet of Things (IoT) with an Emphasis on the Agricultural Production: A Review. Int. J. Sci. Technol. Eng. Manag. 2020, 5844, 6–13. [Google Scholar]
  19. Suresh, K.; Narmilan, A.; Ahmadh, R.K.; Kariapper, R.; Nawaz, S.S.; Suresh, J. Farmers’ Perception on Precision Farming Technologies: A Novel Approach. Indian J. Agric. Econ. 2022, 77, 264–276. [Google Scholar]
  20. Biffi, L.J.; Mitishita, E.; Liesenberg, V.; Santos, A.A.d.; Gonçalves, D.N.; Estrabis, N.V.; Silva, J.d.A.; Osco, L.P.; Ramos, A.P.M.; Centeno, J.A.S.; et al. Article atss deep learning-based approach to detect apple fruits. Remote Sens. 2021, 13, 54. [Google Scholar] [CrossRef]
  21. Parvathi, S.; Selvi, S.T. Detection of maturity stages of coconuts in complex background using Faster R-CNN model. Biosyst. Eng. 2021, 202, 119–132. [Google Scholar] [CrossRef]
  22. Narmilan, A. E-Agricultural Concepts for Improving Productivity: A Review. Sch. J. Eng. Technol. (SJET) 2017, 5, 10–17. [Google Scholar] [CrossRef]
  23. Chandra, L.; Desai, S.V.; Guo, W.; Balasubramanian, V.N. Computer Vision with Deep Learning for Plant Phenotyping in Agriculture: A Survey. arXiv 2020, arXiv:2006.11391. [Google Scholar] [CrossRef]
  24. Seyyedhasani, H.; Digman, M.; Luck, B.D. Utility of a commercial unmanned aerial vehicle for in-field localization of biomass bales. Comput. Electron. Agric. 2021, 180, 105898. [Google Scholar] [CrossRef]
  25. Nebiker, S.; Annen, A.; Scherrer, M.; Oesch, D. A lightweight multispectral sensor for micro-UAV—Opportunities for very high resolution airborne remote sensing. Int. Arch. Photogramm. Remote Sens. Spat. Inf. Sci. 2008, 37, 1193–1200. [Google Scholar]
  26. Yue, J.; Lei, T.; Li, C.; Zhu, J. The Application of Unmanned Aerial Vehicle Remote Sensing in Quickly Monitoring Crop Pests. Intell. Autom. Soft Comput. 2012, 18, 1043–1052. [Google Scholar] [CrossRef]
  27. Aasen, H.; Honkavaara, E.; Lucieer, A.; Zarco-Tejada, P.J. Quantitative remote sensing at ultra-high resolution with UAV spectroscopy: A review of sensor technology, measurement procedures, and data correctionworkflows. Remote Sens. 2018, 10, 1091. [Google Scholar] [CrossRef]
  28. Casagli, N.; Frodella, W.; Morelli, S.; Tofani, V.; Ciampalini, A.; Intrieri, E.; Lu, P. Spaceborne, UAV and ground-based remote sensing techniques for landslide mapping, monitoring and early warning. Geoenvironmental Disasters 2017, 4, 9. [Google Scholar] [CrossRef]
  29. Xiang, H.; Tian, L. Development of a low-cost agricultural remote sensing system based on an autonomous unmanned aerial vehicle (UAV). Biosyst. Eng. 2011, 108, 174–190. [Google Scholar] [CrossRef]
  30. Chivasa, W.; Mutanga, O.; Burgueño, J. UAV-based high-throughput phenotyping to increase prediction and selection accuracy in maize varieties under artificial MSV inoculation. Comput. Electron. Agric. 2021, 184. [Google Scholar] [CrossRef]
  31. Aboutalebi, M.; Torres-Rua, A.F.; Kustas, W.P.; Nieto, H.; Coopmans, C.; McKee, M. Assessment of different methods for shadow detection in high-resolution optical imagery and evaluation of shadow impact on calculation of NDVI, and evapotranspiration. Irrig. Sci. 2019, 37, 407–429. [Google Scholar] [CrossRef]
  32. Sandino, J.; Gonzalez, F.; Mengersen, K.; Gaston, K.J. UAVs and machine learning revolutionizing invasive grass and vegetation surveys in remote arid lands. Sensors 2018, 18, 605. [Google Scholar] [CrossRef] [Green Version]
  33. Sandino, J.; Gonzalez, F. A Novel Approach for Invasive Weeds and Vegetation Surveys Using UAS and Artificial Intelligence. In Proceedings of the 2018 23rd International Conference on Methods and Models in Automation and Robotics, MMAR 2018, Miedzyzdroje, Poland, 27–30 August 2018; pp. 515–520. [Google Scholar] [CrossRef]
  34. Sandino, J.; Pegg, G.; Gonzalez, F.; Smith, G. Aerial Mapping of Forests Affected by Pathogens Using UAVs, Hyperspectral Sensors, and Artificial Intelligence. Sensors 2018, 18, 944. [Google Scholar] [CrossRef] [Green Version]
  35. Ampatzidis, Y.; Partel, V. UAV-based high throughput phenotyping in citrus utilizing multispectral imaging and artificial intelligence. Remote Sens. 2019, 11, 410. [Google Scholar] [CrossRef] [Green Version]
  36. Yang, G.; Liu, J.; Zhao, C.; Li, Z.; Huang, Y.; Yu, H.; Yang, H. Unmanned aerial vehicle remote sensing for field-based crop phenotyping: Current status and perspectives. Front. Plant Sci. 2017, 8, 1111. [Google Scholar] [CrossRef] [PubMed] [Green Version]
  37. Vergouw, B.; Nagel, H.; Bondt, G.; Custers, B. Drone Technology: Types, Payloads, Applications, Frequency Spectrum Issues and Future Developments; Springer: Berlin/Heidelberg, Germany, 2016. [Google Scholar] [CrossRef]
  38. Olson, D.; Anderson, J. Review on unmanned aerial vehicles, remote sensors, imagery processing, and their applications in agriculture. Agron. J. 2021, 113, 971–992. [Google Scholar] [CrossRef]
  39. Anagnostis, A.; Tagarakis, A.C.; Asiminari, G.; Papageorgiou, E.; Kateris, D.; Moshou, D.; Bochtis, D. A deep learning approach for anthracnose infected trees classification in walnut orchards. Comput. Electron. Agric. 2021, 182, 105998. [Google Scholar] [CrossRef]
  40. Gonzalo-Martín, C.; García-Pedrero, A.; Lillo-Saavedra, M. Improving deep learning sorghum head detection through test time augmentation. Comput. Electron. Agric. 2021, 186, 106179. [Google Scholar] [CrossRef]
  41. Hasan, S.M.M.; Sohel, F.; Diepeveen, D.; Laga, H.; Jones, M.G.K. A survey of deep learning techniques for weed detection from images. Comput. Electron. Agric. 2021, 184, 106067. [Google Scholar] [CrossRef]
  42. Shin, J.; Chang, Y.K.; Heung, B.; Nguyen-Quang, T.; Price, G.W.; Al-Mallahi, A. A deep learning approach for RGB image-based powdery mildew disease detection on strawberry leaves. Comput. Electron. Agric. 2020, 183, 106042. [Google Scholar] [CrossRef]
  43. Ahmad, A.; Saraswat, D.; Aggarwal, V.; Etienne, A.; Hancock, B. Performance of deep learning models for classifying and detecting common weeds in corn and soybean production systems. Comput. Electron. Agric. 2021, 184, 106081. [Google Scholar] [CrossRef]
  44. Vong, N.; Conway, L.S.; Zhou, J.; Kitchen, N.R.; Sudduth, K.A. Early corn stand count of different cropping systems using UAV-imagery and deep learning. Comput. Electron. Agric. 2021, 186, 106214. [Google Scholar] [CrossRef]
  45. Hong, H.; Lin, J.; Huang, F. Tomato Disease Detection and Classification by Deep Learning. In Proceedings of the 2020 International Conference on Big Data, Artificial Intelligence and Internet of Things Engineering, ICBAIE 2020, Fuzhou, China, 12–14 June 2020; pp. 25–29. [Google Scholar] [CrossRef]
  46. Chen, Z.; Wu, R.; Lin, Y.; Li, C.; Chen, S.; Yuan, Z.; Zou, X. Plant Disease Recognition Model Based on Improved YOLOv5. Agronomy 2022, 12, 365. [Google Scholar] [CrossRef]
  47. Cao, J.; Zhang, Z.; Tao, F.; Zhang, L.; Luo, Y.; Zhang, J.; Xie, J. Integrating Multi-Source Data for Rice Yield Prediction across China using Machine Learning and Deep Learning Approaches. Agric. For. Meteorol. 2021, 297, 108275. [Google Scholar] [CrossRef]
  48. Osorio, K.; Puerto, A.; Pedraza, C.; Jamaica, D.; Rodríguez, L. A Deep Learning Approach for Weed Detection in Lettuce Crops Using Multispectral Images. AgriEngineering 2020, 2, 471–488. [Google Scholar] [CrossRef]
  49. Zhang, P.; Li, D. EPSA-YOLO-V5s: A novel method for detecting the survival rate of rapeseed in a plant factory based on multiple guarantee mechanisms. Comput. Electron. Agric. 2022, 193, 106714. [Google Scholar] [CrossRef]
  50. Santos, T.T.; de Souza, L.L.; Santos, A.A.d.; Avila, S. Grape detection, segmentation, and tracking using deep neural networks and three-dimensional association. Comput. Electron. Agric. 2020, 170, 105247. [Google Scholar] [CrossRef] [Green Version]
  51. Wu, B.; Liang, A.; Zhang, H.; Zhu, T.; Zou, Z.; Yang, D.; Su, J. Application of conventional UAV-based high-throughput object detection to the early diagnosis of pine wilt disease by deep learning. For. Ecol. Manag. 2021, 486, 118986. [Google Scholar] [CrossRef]
  52. Tan, L.; Lu, J.; Jiang, H. Tomato Leaf Diseases Classification Based on Leaf Images: A Comparison between Classical Machine Learning and Deep Learning Methods. AgriEngineering 2021, 3, 542–558. [Google Scholar] [CrossRef]
  53. Dananjayan, S.; Tang, Y.; Zhuang, J.; Hou, C.; Luo, S. Assessment of state-of-the-art deep learning based citrus disease detection techniques using annotated optical leaf images. Comput. Electron. Agric. 2022, 193, 106658. [Google Scholar] [CrossRef]
  54. Qi, J.; Liu, X.; Liu, K.; Xu, F.; Guo, H.; Tian, X.; Li, Y. An improved YOLOv5 model based on visual attention mechanism: Application to recognition of tomato virus disease. Comput. Electron. Agric. 2022, 194, 106780. [Google Scholar] [CrossRef]
  55. Temniranrat, P.; Kiratiratanapruk, K.; Kitvimonrat, A.; Sinthupinyo, W.; Patarapuwadol, S. A system for automatic rice disease detection from rice paddy images serviced via a Chatbot. Comput. Electron. Agric. 2021, 185, 106156. [Google Scholar] [CrossRef]
  56. Zhang, Y.; Yu, J.; Chen, Y.; Yang, W.; Zhang, W.; He, Y. Real-time strawberry detection using deep neural networks on embedded system (rtsd-net): An edge AI application. Comput. Electron. Agric. 2022, 192, 106586. [Google Scholar] [CrossRef]
  57. Kang, H.; Chen, C. Fast implementation of real-time fruit detection in apple orchards using deep learning. Comput. Electron. Agric. 2020, 168, 105108. [Google Scholar] [CrossRef]
  58. Yu, Y.; Zhang, K.; Yang, L.; Zhang, D. Fruit detection for strawberry harvesting robot in non-structural environment based on Mask-R-CNN. Comput. Electron. Agric. 2019, 163, 104846. [Google Scholar] [CrossRef]
  59. Wang, X.; Tang, J.; Whitty, M. DeepPhenology: Estimation of apple flower phenology distributions based on deep learning. Comput. Electron. Agric. 2021, 185, 106123. [Google Scholar] [CrossRef]
  60. Yang, G.F.; Yong, Y.A.N.G.; He, Z.K.; Zhang, X.Y.; Yong, H.E. A rapid, low-cost deep learning system to classify strawberry disease based on cloud service. J. Integr. Agric. 2022, 21, 460–473. [Google Scholar] [CrossRef]
  61. Kathiresan, G.; Anirudh, M.; Nagharjun, M.; Karthik, R. Disease detection in rice leaves using transfer learning techniques. J. Phys. Conf. Ser. 2021, 1911, 012004. [Google Scholar] [CrossRef]
  62. Yao, J.; Qi, J.; Zhang, J.; Shao, H.; Yang, J.; Li, X. A real-time detection algorithm for kiwifruit defects based on yolov5. Electronics 2021, 10, 1711. [Google Scholar] [CrossRef]
  63. Sethy, P.K.; Barpanda, N.K.; Rath, A.K.; Behera, S.K. Rice false smut detection based on faster R-CNN. Indones. J. Electr. Eng. Comput. Sci. 2020, 19, 1590–1595. [Google Scholar] [CrossRef]
  64. Ieamsaard, J.; Charoensook, S.N.; Yammen, S. Deep Learning-based Face Mask Detection Using YoloV5. In Proceedings of the 2021 9th International Electrical Engineering Congress, iEECON 2021, Pattaya, Thailand, 10–12 March 2021; pp. 428–431. [Google Scholar] [CrossRef]
  65. Wang, C.-Y.; Yeh, I.-H.; Liao, H.-Y.M.; You Only Learn One Representation: Unified Network for Multiple Tasks. May 2021. Available online: http://arxiv.org/abs/2105.04206 (accessed on 12 May 2022).
  66. Brungel, R.; Friedrich, C.M. DETR and YOLOv5: Exploring performance and self-training for diabetic foot ulcer detection. In Proceedings of the IEEE Symposium on Computer-Based Medical Systems, Aveiro, Portugal, 7–9 June 2021; Volume 2021, pp. 148–153. [Google Scholar] [CrossRef]
  67. Carion, N.; Massa, F.; Synnaeve, G.; Usunier, N.; Kirillov, A.; Zagoruyko, S. End-to-End Object Detection with Transformers. Available online: https://github.com/facebookresearch/detr (accessed on 15 August 2022).
  68. Paliyam, M.; Nakalembe, C.; Liu, K.; Nyiawung, R.; Kerner, H. Street2Sat: A Machine Learning Pipeline for Generating Ground-truth Geo-Referenced Labeled Datasets from Street-Level Images. 2021. Available online: https://github.com/ultralytics/yolov5 (accessed on 23 June 2022).
  69. Murugeswari, R.; Anwar, Z.S.; Dhananjeyan, V.R.; Karthik, C.N. Automated Sugarcane Disease Detection Using Faster R-CNN with an Android Application. In Proceedings of the 2022 6th International Conference on Trends in Electronics and Informatics, ICOEI 2022—Proceedings, Tirunelveli, India, 28–30 April 2022; pp. 1–7. [Google Scholar] [CrossRef]
  70. Chen, W.; Ju, C.; Li, Y.; Hu, S.; Qiao, X. Sugarcane stem node recognition in field by deep learning combining data expansion. Appl. Sci. 2021, 11, 8663. [Google Scholar] [CrossRef]
  71. Zhu, C.; Wu, C.; Li, Y.; Hu, S.; Gong, H. Spatial Location of Sugarcane Node for Binocular Vision-Based Harvesting Robots Based on Improved YOLOv4. Appl. Sci. 2022, 12, 3088. [Google Scholar] [CrossRef]
  72. Malik, H.S.; Dwivedi, M.; Omkar, S.N.; Javed, T.; Bakey, A.; Pala, M.R.; Chakravarthy, A. Disease Recognition in Sugarcane Crop Using Deep Learning. In Advances in Artificial Intelligence and Data Engineering; Kacprzyk, J., Ed.; Springer: Singapore, 2019; Volume 1133, pp. 189–205. Available online: http://www.springer.com/series/11156 (accessed on 3 May 2022).
  73. Kumpala, I.; Wichapha, N.; Prasomsab, P. Sugar Cane Red Stripe Disease Detection using YOLO CNN of Deep Learning Technique. Eng. Access 2022, 8, 192–197. [Google Scholar]
  74. Narmilan, A.; Gonzalez, F.; Salgadoe, A.S.A.; Powell, K. Detection of White Leaf Disease in Sugarcane Using Machine Learning Techniques over UAV Multispectral Images. Drones 2022, 6, 230. [Google Scholar] [CrossRef]
  75. Sugar Research Australia (SRA). WLD Information Sheet. 2013. Available online: Sugarresearch.com.au (accessed on 13 April 2022).
  76. Zhou, F.; Zhao, H.; Nie, Z. Safety Helmet Detection Based on YOLOv5. In Proceedings of the 2021 IEEE International Conference on Power Electronics, Computer Applications, ICPECA 2021, Shenyang, China, 22–24 January 2021; pp. 6–11. [Google Scholar] [CrossRef]
  77. Du, X.; Song, L.; Lv, Y.; Qiu, S. A Lightweight Military Target Detection Algorithm Based on Improved YOLOv5. Electronics 2022, 11, 3263. [Google Scholar] [CrossRef]
  78. Wang, Q.; Cheng, M.; Huang, S.; Cai, Z.; Zhang, J.; Yuan, H. A deep learning approach incorporating YOLO v5 and attention mechanisms for field real-time detection of the invasive weed Solanum rostratum Dunal seedlings. Comput. Electron. Agric. 2022, 199, 107194. [Google Scholar] [CrossRef]
  79. Li, X.; Wang, C.; Ju, H.; Li, Z. Surface Defect Detection Model for Aero-Engine Components Based on Improved YOLOv5. Appl. Sci. 2022, 12, 7235. [Google Scholar] [CrossRef]
  80. Jing, Y.; Ren, Y.; Liu, Y.; Wang, D.; Yu, L. Automatic Extraction of Damaged Houses by Earthquake Based on Improved YOLOv5: A Case Study in Yangbi. Remote Sens. 2022, 14, 382. [Google Scholar] [CrossRef]
  81. Training, Validation, and Test Datasets—Machine Learning Glossary. Available online: https://machinelearning.wtf/terms/training-validation-test-datasets/ (accessed on 31 October 2022).
  82. Why No Augmentation Applied to Test or Validation Data and Only to Train Data? | Data Science and Machine Learning | Kaggle. Available online: https://www.kaggle.com/questions-and-answers/291581 (accessed on 31 October 2022).
  83. Data Augmentation | Baeldung on Computer Science. Available online: https://www.baeldung.com/cs/ml-data-augmentation (accessed on 31 October 2022).
  84. Abayomi-Alli, O.; Damaševičius, R.; Misra, S.; Maskeliūnas, R. Cassava disease recognition from low-quality images using enhanced data augmentation model and deep learning. Expert Syst. 2021, 38, e12746. [Google Scholar] [CrossRef]
  85. Li, J.; Zhu, X.; Jia, R.; Liu, B.; Yu, C. Apple-YOLO: A Novel Mobile Terminal Detector Based on YOLOv5 for Early Apple Leaf Diseases. In Proceedings of the 2022 IEEE 46th Annual Computers, Software, and Applications Conference (COMPSAC), Los Alamitos, CA, USA, 27 June–1 July 2022; pp. 352–361. [Google Scholar] [CrossRef]
  86. Cruz, M.; Mafra, S.; Teixeira, E.; Figueiredo, F. Smart Strawberry Farming Using Edge Computing and IoT. Sensors 2022, 22, 5866. [Google Scholar] [CrossRef]
  87. Mathew, P.; Mahesh, T.Y. Leaf-based disease detection in bell pepper plant using YOLO v5. Signal Image Video Process 2022, 16, 841–847. [Google Scholar] [CrossRef]
  88. Wang, Y.; Sun, F.; Wang, Z.; Zhou, Z.; Lan, P. Apple Leaf Disease Identification Method Based on Improved YoloV5; Springer: Singapore, 2022; pp. 1246–1252. [Google Scholar] [CrossRef]
  89. Jhatial, M.J.; Shaikh, R.A.; Shaikh, N.A.; Rajper, S.; Arain, R.H.; Chandio, G.H.; Shaikh, K.H. Deep Learning-Based Rice Leaf Diseases Detection Using Yolov5. Sukkur IBA J. Comput. Math. Sci. 2022, 6, 49–61. [Google Scholar]
  90. Yu, R.; Luo, Y.; Zhou, Q.; Zhang, X.; Wu, D.; Ren, L. Early detection of pine wilt disease using deep learning algorithms and UAV-based multispectral imagery. For. Ecol. Manag. 2021, 497, 119493. [Google Scholar] [CrossRef]
  91. Sun, Z.; Ibrayim, M.; Hamdulla, A. Detection of Pine Wilt Nematode from Drone Images Using UAV. Sensors 2022, 22, 4704. [Google Scholar] [CrossRef] [PubMed]
  92. Cynthia, S.T.; Hossain, K.M.S.; Hasan, M.N.; Asaduzzaman, M.; Das, A.K. Automated Detection of Plant Diseases Using Image Processing and Faster R-CNN Algorithm. In Proceedings of the 2019 International Conference on Sustainable Technologies for Industry 4.0 (STI), Dhaka, Bangladesh, 24–25 December 2019. [Google Scholar]
  93. Wang, Q.; Qi, F. Tomato diseases recognition based on faster R-CNN. In Proceedings of the 10th International Conference on Information Technology in Medicine and Education, ITME 2019, Qingdao, China, 23–25 August 2019; pp. 772–776. [Google Scholar] [CrossRef]
  94. Wu, J.; Wen, C.; Chen, H.; Ma, Z.; Zhang, T.; Su, H.; Yang, C. DS-DETR: A Model for Tomato Leaf Disease Segmentation and Damage Evaluation. Agronomy 2022, 12, 2023. [Google Scholar] [CrossRef]
Figure 1. Core steps of the proposed methodology to detect WLD using unmanned aerial vehicles.
Remotesensing 14 06137 g001
Figure 2. Study area at Galoya Plantation, Hingurana, eastern Sri Lanka. (7°16′42.94”N, 81°42′25.53”E).
Remotesensing 14 06137 g002
Figure 3. Ground truth procedure in the studied sugarcane field.
Remotesensing 14 06137 g003
Figure 4. Manual labelling of plants with WLD from UAV imagery using LabelImg.
Remotesensing 14 06137 g004
Figure 5. Main steps in the development of YOLOv5 model.
Remotesensing 14 06137 g005
Figure 6. Main steps in the development of YOLOR model.
Remotesensing 14 06137 g006
Figure 7. Main steps in the development of DETR model.
Remotesensing 14 06137 g007
Figure 8. Main steps in the development of Faster R-CNN model.
Remotesensing 14 06137 g008
Figure 9. Visual analysis of YOLOv5 evaluation indicators during training.
Remotesensing 14 06137 g009
Figure 10. Visual analysis of YOLOR evaluation indicators during training.
Remotesensing 14 06137 g010
Figure 11. Visual analysis of DETR evaluation indicators during training.
Remotesensing 14 06137 g011
Figure 12. Visual analysis of Faster R-CNN evaluation indicators during training.
Remotesensing 14 06137 g012
Figure 13. Comparison of performance for different DL models.
Remotesensing 14 06137 g013
Figure 14. Ground truth bounding boxes.
Remotesensing 14 06137 g014
Figure 15. Bounding box detection using YOLOv5.
Remotesensing 14 06137 g015
Figure 16. Bounding box detection using YOLOR.
Remotesensing 14 06137 g016
Figure 17. Bounding box detection using DETR.
Remotesensing 14 06137 g017
Figure 18. Bounding box detection using faster R-CNN.
Remotesensing 14 06137 g018
Table 1. Application of DL techniques in precision agriculture.
LocationApplicationDL TechniqueLiterature
BrazilDetection of apple fruitsAdaptive Training Sample Selection (ATSS)
Retina Net, Cascade R-CNN, Faster R-CNN, Feature Selective Anchor-Free (FSAF), and High-Resolution Network (HRNet)
[20]
ColombiaWeed detection in a lettuce fieldYOLOV3, Mask R-CNN[48]
ChinaDetection of the survival rate of rapeYOLOV5, Faster R-CNN, YOLOv3, and YOLOv4[49]
BrazilDetection of grapeYOLOv2 and YOLOv3[50]
FloridaDetect, count, and geolocate Citrus treesYOLOv3[35]
ChinaDetection of Pine wilt diseaseYOLOv3 and Faster R-CNN[51]
ChinaTomato Leaf Diseases ClassificationGG16, VGG19, ResNet34, ResNeXt50 (32 × 4 d), EfficientNet-b7, and MobileNetV2[52]
ChinaDetection of citrus leaf diseasesCenterNet, YOLOv4, Faster R-CNN, DetectoRS, Cascade R-CNN, Foveabox and Deformabe DETR[53]
ChinaDetection of tomato virus diseasesYOLOv5[54]
ChinaDetection of plant diseasesYOLOv5[15]
ThailandDetection of rice diseaseLINE Bot System[55]
ChinaDetection strawberryRTSD-Net[56]
Australiareal-time fruit detection in apple orchardsLedNet[57]
ChinaFruit detection for strawberry harvestingMask R-CNN[58]
AustraliaEstimation of apple flower phenologyVGG-16, YOLOv5[59]
Chinaclassify strawberry diseaseLFC-Net[60]
IndiaDisease detection in riceMobileNet, ResNet 50, ResNet 101, Inception V3, Xception, and RiceDenseNet[61]
ChinaPlant Disease RecognitionYOLOv5[46]
ChinaDetection of Kiwifruit DefectsYOLOv5[62]
IndiaDetection of maturity stages of coconutsFaster R-CNN[21]
IndiaRice false smut detectionFaster R-CNN[63]
Table 2. Comparison of model performances for different DL models.
ModelPrecisionRecall[email protected][email protected]Model Size
YOLOv59592937914 MB
YOLOR87939075281 MB
DETR77697741473 MB
Faster R-CNN90769571158 MB
Table 3. Training times of selected DL models.
ModelTime (Hours: Minutes: Seconds)
YOLOv506:02:55
YOLOR12:10:31
DETR30:22:47
Faster R-CNN03:03:21
Table 4. Performance of classical ML models from Narmilan et al. [74] to detect WLD.
XGBRFDTKNN
Precision (%)72716971
Recall (%)72726567
F1-score (%)71716769
Publisher’s Note: MDPI stays neutral with regard to jurisdictional claims in published maps and institutional affiliations.

