Article

Linearized Single-Scattering Property Database for Hexagonal Prism Ice Particles

1
Department of Atmospheric and Oceanic Sciences, Institute of Atmospheric Sciences, Fudan University, Shanghai 200438, China
2
CMA-FDU Joint Laboratory of Marine Meteorology and Shanghai Frontiers Science Center of Atmosphere-Ocean Interaction, Shanghai 200438, China
3
Advanced Algorithm Joint Lab, National Supercomputing Center in Jinan, Jinan 250014, China
4
Shanghai Qi Zhi Institute, Shanghai 200232, China
5
School of Nuclear Science and Technology, University of Science and Technology of China, Hefei 230026, China
6
Shandong Computer Science Center, National Supercomputing Center in Jinan, Qilu University of Technology, Shandong Academy of Sciences, Jinan 250014, China
*
Author to whom correspondence should be addressed.
Remote Sens. 2022, 14(23), 6138; https://doi.org/10.3390/rs14236138
Submission received: 1 November 2022 / Revised: 24 November 2022 / Accepted: 1 December 2022 / Published: 3 December 2022

Abstract

:
Accurate description of the single scattering properties of atmospheric particles can be an essential factor influencing the remote sensing of atmospheric microphysics. In this paper, a database for the linearized single scattering properties of ice particles was developed in the visible to infrared spectral region of 0.4–15 μm and for size parameters ranging from 0.5 to 500. The linearized invariant imbedding T-matrix method and linearized physical-geometric optics method were jointly applied. A full set of integral scattering properties including extinction efficiency, single scattering albedo, asymmetry factors, and differential scattering properties, including six phase matrix elements, were the basic scattering parameters in the database. Furthermore, the Jacobians of these regular scattering properties with respect to refractive index (real and imaginary parts) and effective radius were also included and used for sensitivity determinations. The spectral and size-dependent variations and changing rates of the derivative characteristics with actual application values, such as backscattering depolarization ratios, were also discussed.

1. Introduction

The single scattering properties of atmospheric particles play a substantial role in the retrieval of atmospheric components, the radiative forcing estimation in climate modeling, and the evaluation of aerosol–cloud interactions [1,2]. Numerous algorithms have been established to capture the scattering features of spherical and non-spherical particles [2,3,4,5,6,7], but there is no universal algorithm for the entire size parameter spectrum and all shapes [8]. For spherical particles, the Lorenz–Mie theory is the analytical solution derived from fundamental Maxwell’s equations [9,10]. There are plenty of numerically accurate methods for small non-spherical particles [11]. The T-matrix is an effective tool for computing the scattering properties of homogenous non-spherical particles by relating the expansion of the incident and scattered fields in vector spherical wave functions [12,13]. Both the invariant imbedding T-matrix method (IITM) and extended boundary condition method (EBCM) are semianalytical T-matrix methods for solving Maxwell’s equations [14,15,16,17]. Each has its advantages in terms of calculation speed and applicable shapes [18,19]. Scattering for a non-spherical particle of large size can be solved by approximate methods, such as the physical-geometric optics method (PGOM), that require fewer computational resources than rigorous methods [20]. The fundamental integral and differential single scattering properties required for radiative transfer computation can be generated using these algorithms or obtained using deep learning approaches [21,22]. Plenty of single scattering property databases for application in remote sensing and the simulation of radiative transfer have been developed to satisfy spectral and scale continuity, and they employ a variety of algorithms, such as those of the Lorenz–Mie theory [23,24,25,26], the discrete dipole approximation [26,27,28], the T-matrix methods [25,28,29,30,31,32], the geometric optics method [33,34,35,36,37], the finite-difference time-domain method [35,38], etc. Combinations of methods are usually applied to consider algorithm applicability, as well as computational resources [31,39]. Moreover, a significant amount of experiments have been undertaken to obtain differential scattering properties for the validation of theoretical simulations [40,41,42].
To evaluate the radiative effect of cloud, aerosol, dust, and other particulate matter on the Earth atmosphere system, it is first necessary to undertake accurate quantitative retrieval. Due to the inhomogeneity and morphological complexity of atmospheric particles, the retrieval of their microphysical properties is a great challenge. With their global scale and high frequency, satellite observations have become the predominant data source for remote sensing [43,44]. Multiple-channel measurements of the numerous high-resolution radiation devices are used in remote sensing of the atmospheric states. These observations constitute the measurement vector Y in retrieval and the unknown parameters constitute the state vector X to be retrieved, which contains quantities that adequately represent the atmospheric state [45]. The inversion of atmospheric parameters is undoubtedly a non-linear problem and must be solved numerically and iteratively. The retrieval process can be described in terms of iterations of the guessed state vector by entering the vector into the forward model F(X) and testing each output departure from the observations. Each step of retrieval is affected by the prior information, the accuracy of instrumental measurements, and the uncertainties of the forward model. The Jacobian matrix, K = Y / X , also termed the weight function matrix, is used to linearize and invert the forward model, which indicates the sensitivity of the forward model to the state vector [46]. Most atmospheric science problems are moderately non-linear, where linearization is adequate for the error analysis [45]. Consequently, linearization of the forward model is of great importance in microphysical inverse problems. The forward model used for the microphysical parameters of atmospheric retrieval combines the scattering algorithm and radiative transfer model, with linearization of the two components being required to provide the sensitivity of measurement with respect to the state vector. The direct calculation of the linearized radiative transfer model generates the required Jacobians, as has been applied practically [47,48,49,50]. Meanwhile, the derivatives of single scattering properties with respect to optical parameters, such as refractive index, and shape parameters, such as aspect ratio and effective radius, can be generated from the linearization of scattering algorithms [51]. The aforementioned algorithms, such as IITM, EBCM, and PGOM, have been linearized and validated by the finite difference method and against each other [51,52,53,54]. Previous studies have shown that single scattering properties calculated by the linearized IITM and PGOM (abbreviated as LIITM and LPGOM) are sufficiently accurate for a wide range of size parameters [55]. To reduce the burden of computation and time for the finite difference approximation of the retrieval, a linearized single scattering property database was pre-calculated in this study by employing a combination of LIITM and LPGOM.
As a commonly observed particle morphology from the in situ observations of ice clouds [56,57,58], hexagonal prisms were used as the model for the database with random orientations, and the size parameter, defined as the ratio of the particle size to the incident wavelength, was used as the input size property, as in previous studies [23,24,25,26,28,33,34,35]. A database containing the single scattering properties and their partial derivatives for wavelengths of 0.4–15 μm and size parameters of 0.5–500 for hexagonal prism ice particles was established jointly using the LIITM and LPGOM algorithms. The paper is organized as follows: the methodology and parameters are introduced in Section 2; the simulation results and sensitivity are analyzed in Section 3; the discussion of derivatives characteristics is given in Section 4, and conclusions are given in Section 5.

2. Materials and Methods

2.1. Parameters

The real and imaginary parts of the refractive index(mr and mi) of ice, from the visible to mid-infrared regions, were taken from the compilation by Warren et al. (2008) [59]. The selected size parameters for each algorithm and incident wavelength are listed in Table 1. The ranges of the real and imaginary parts of the refractive index and their finite-difference values with respect to wavelength are shown in Figure 1, and points indicate selected wavelengths. Figure 1b,d indicate the sensitivity of the refractive index to the wavelength calculated by linear difference. Both the real and imaginary parts of the refractive index oscillate markedly at approximately λ = 3 μm. The choice of wavelength takes into account the trend in refractive index and the uniformity of its distribution over the studied range. As shown in Figure 1a,c, the chosen wavelengths match the original curve well enough to facilitate subsequent interpolation.
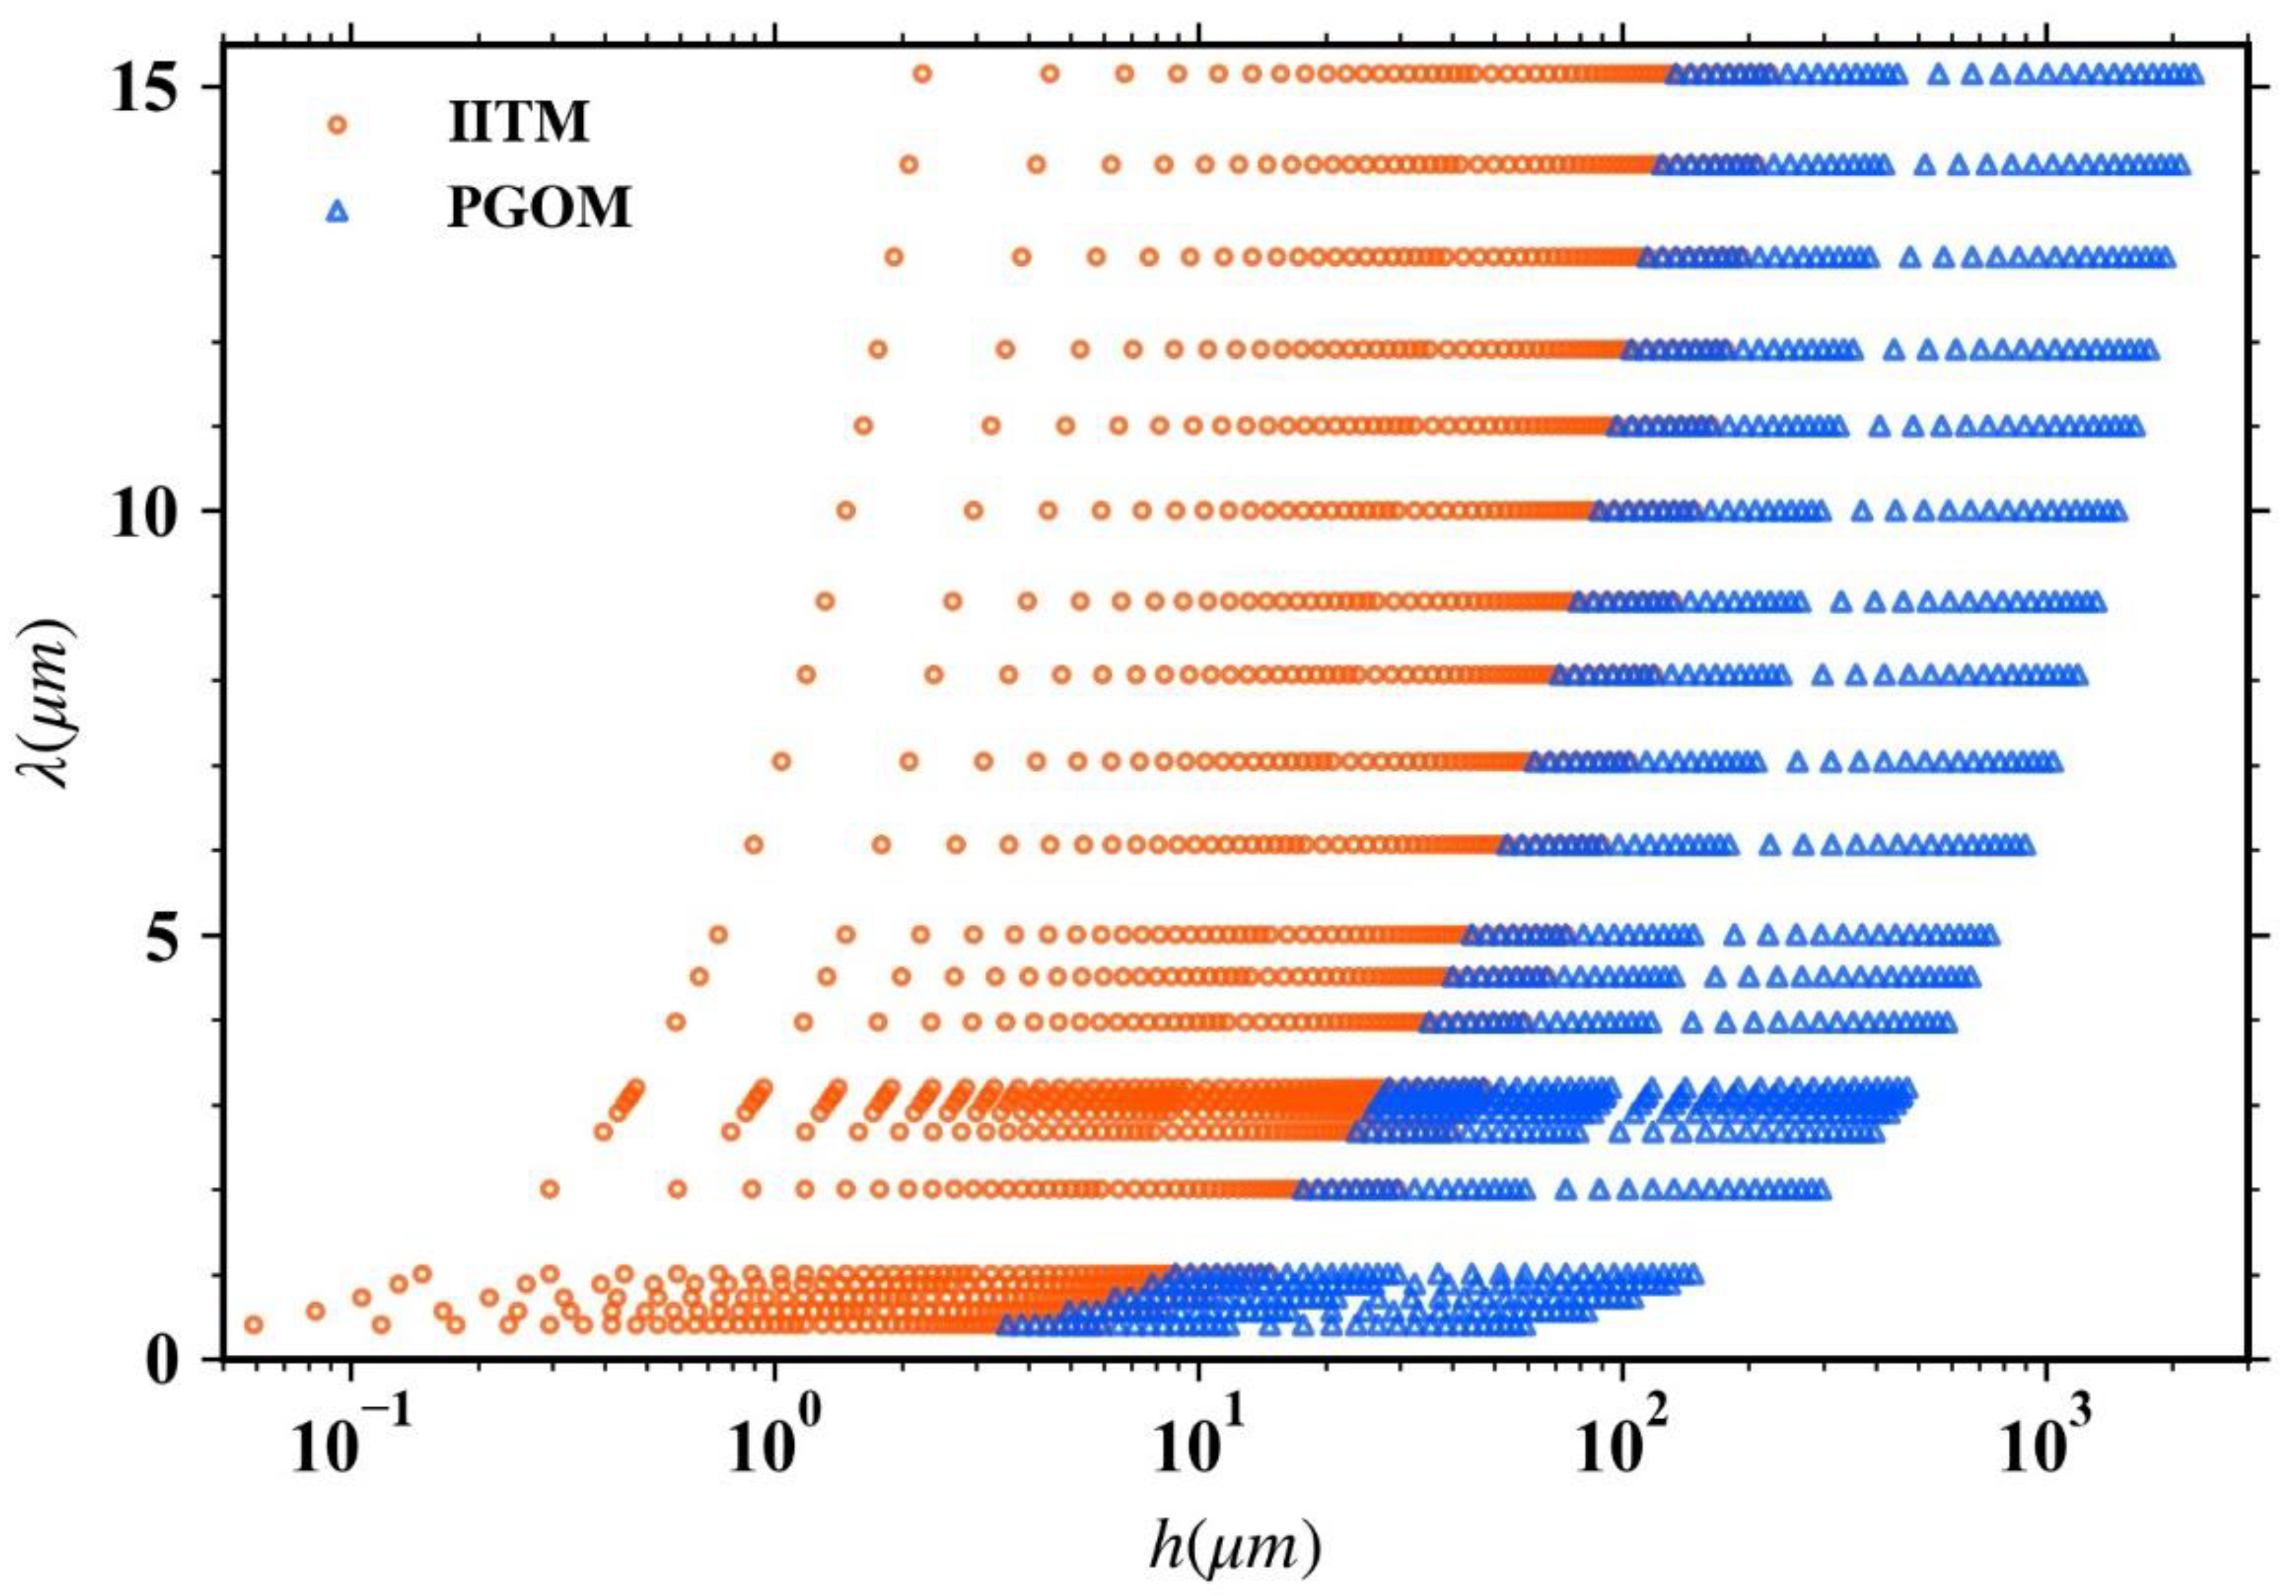
Regular hexagonal prisms of unit aspect ratios were used as standard ice crystal shapes in the database. For a regular hexagonal prism, the side lengths of the bottom and top facets are equal, which are denoted as a, and the vertical length is denoted as h. The aspect ratio is defined as σ = 2 a / h . To describe particle habits, the effective radius is defined as a radius of an equivalent volume sphere; i.e., V = 4 π / 3 r e 3 = 3 3 / 2 a 2 h . With the unit aspect ratio, the shape parameter follows the relationship r e = a 9 3 / 4 π 3 1.24 a . Lengths parameters used in the scattering algorithm are related to the ratio of particle size to the incident wavelength, and defined as the dimensionless size parameter x = 2 π r e / λ . The corresponding particle heights with various size parameters and selected wavelengths are shown in Figure 2.

2.2. Model and Algorithms

The physical models of the two methods (LIITM and LPGOM) are shown in Figure 3. The scattering properties of hexagonal prisms with small size parameters were obtained using the invariant imbedding T-matrix method. A non-spherical particle can be divided into some concentric imbedding shells from inscribed to circumscribed spheres. The T-matrix iteration is shown schematically in Figure 3a. By using the volume-integral equation of the scattering field, the T-matrix of the inscribed sphere Tis obtained from Lorenz–Mie theory can be iterated step by step to the T-matrix of the circumscribed sphere Tcs. Tα denotes the α-th step iteration of T-matrix. The truncation order of the infinite T-matrix and the resolution of the spherical shell jointly determine the accuracy of the algorithm. The invariant imbedding T-matrix method performs matrix inversion at each iterated step, which is time consuming. With the invariant imbedding technique based on the volume-integral equation, stable matrix inversions can be performed without encountering ill-conditioning problems. The storage required for the calculation grows exponentially with truncation order and particle size parameter. Therefore, the IITM is used to calculate the scattering properties of small size particles, while taking into account computation efficiency and storage requirements.
The scattering properties of hexagonal prisms with large size parameters were obtained using the physical-geometric optics method because of the capability and efficiency of the rigorous method. An incident light hit on the side facet of a large hexagonal prism is reflected and refracted to different surfaces involving beam-tracing processes and beam-splitting technology. As shown in Figure 3b, for example, the beam e ^ i that was incident on the left facet of the hexagonal prism is reflected and refracted on the surface, and the refracted part of the beam, e ^ 1 , hits two facets of the prism. To improve computation efficiency, the beam was split into separate parts, and the particles were segmented into sub-prisms to ensure that each beam was incident on only one facet. By considering refraction, reflection, diffraction, and far-field mapping, the PGOM calculates the scattering properties of large particles.

3. Results

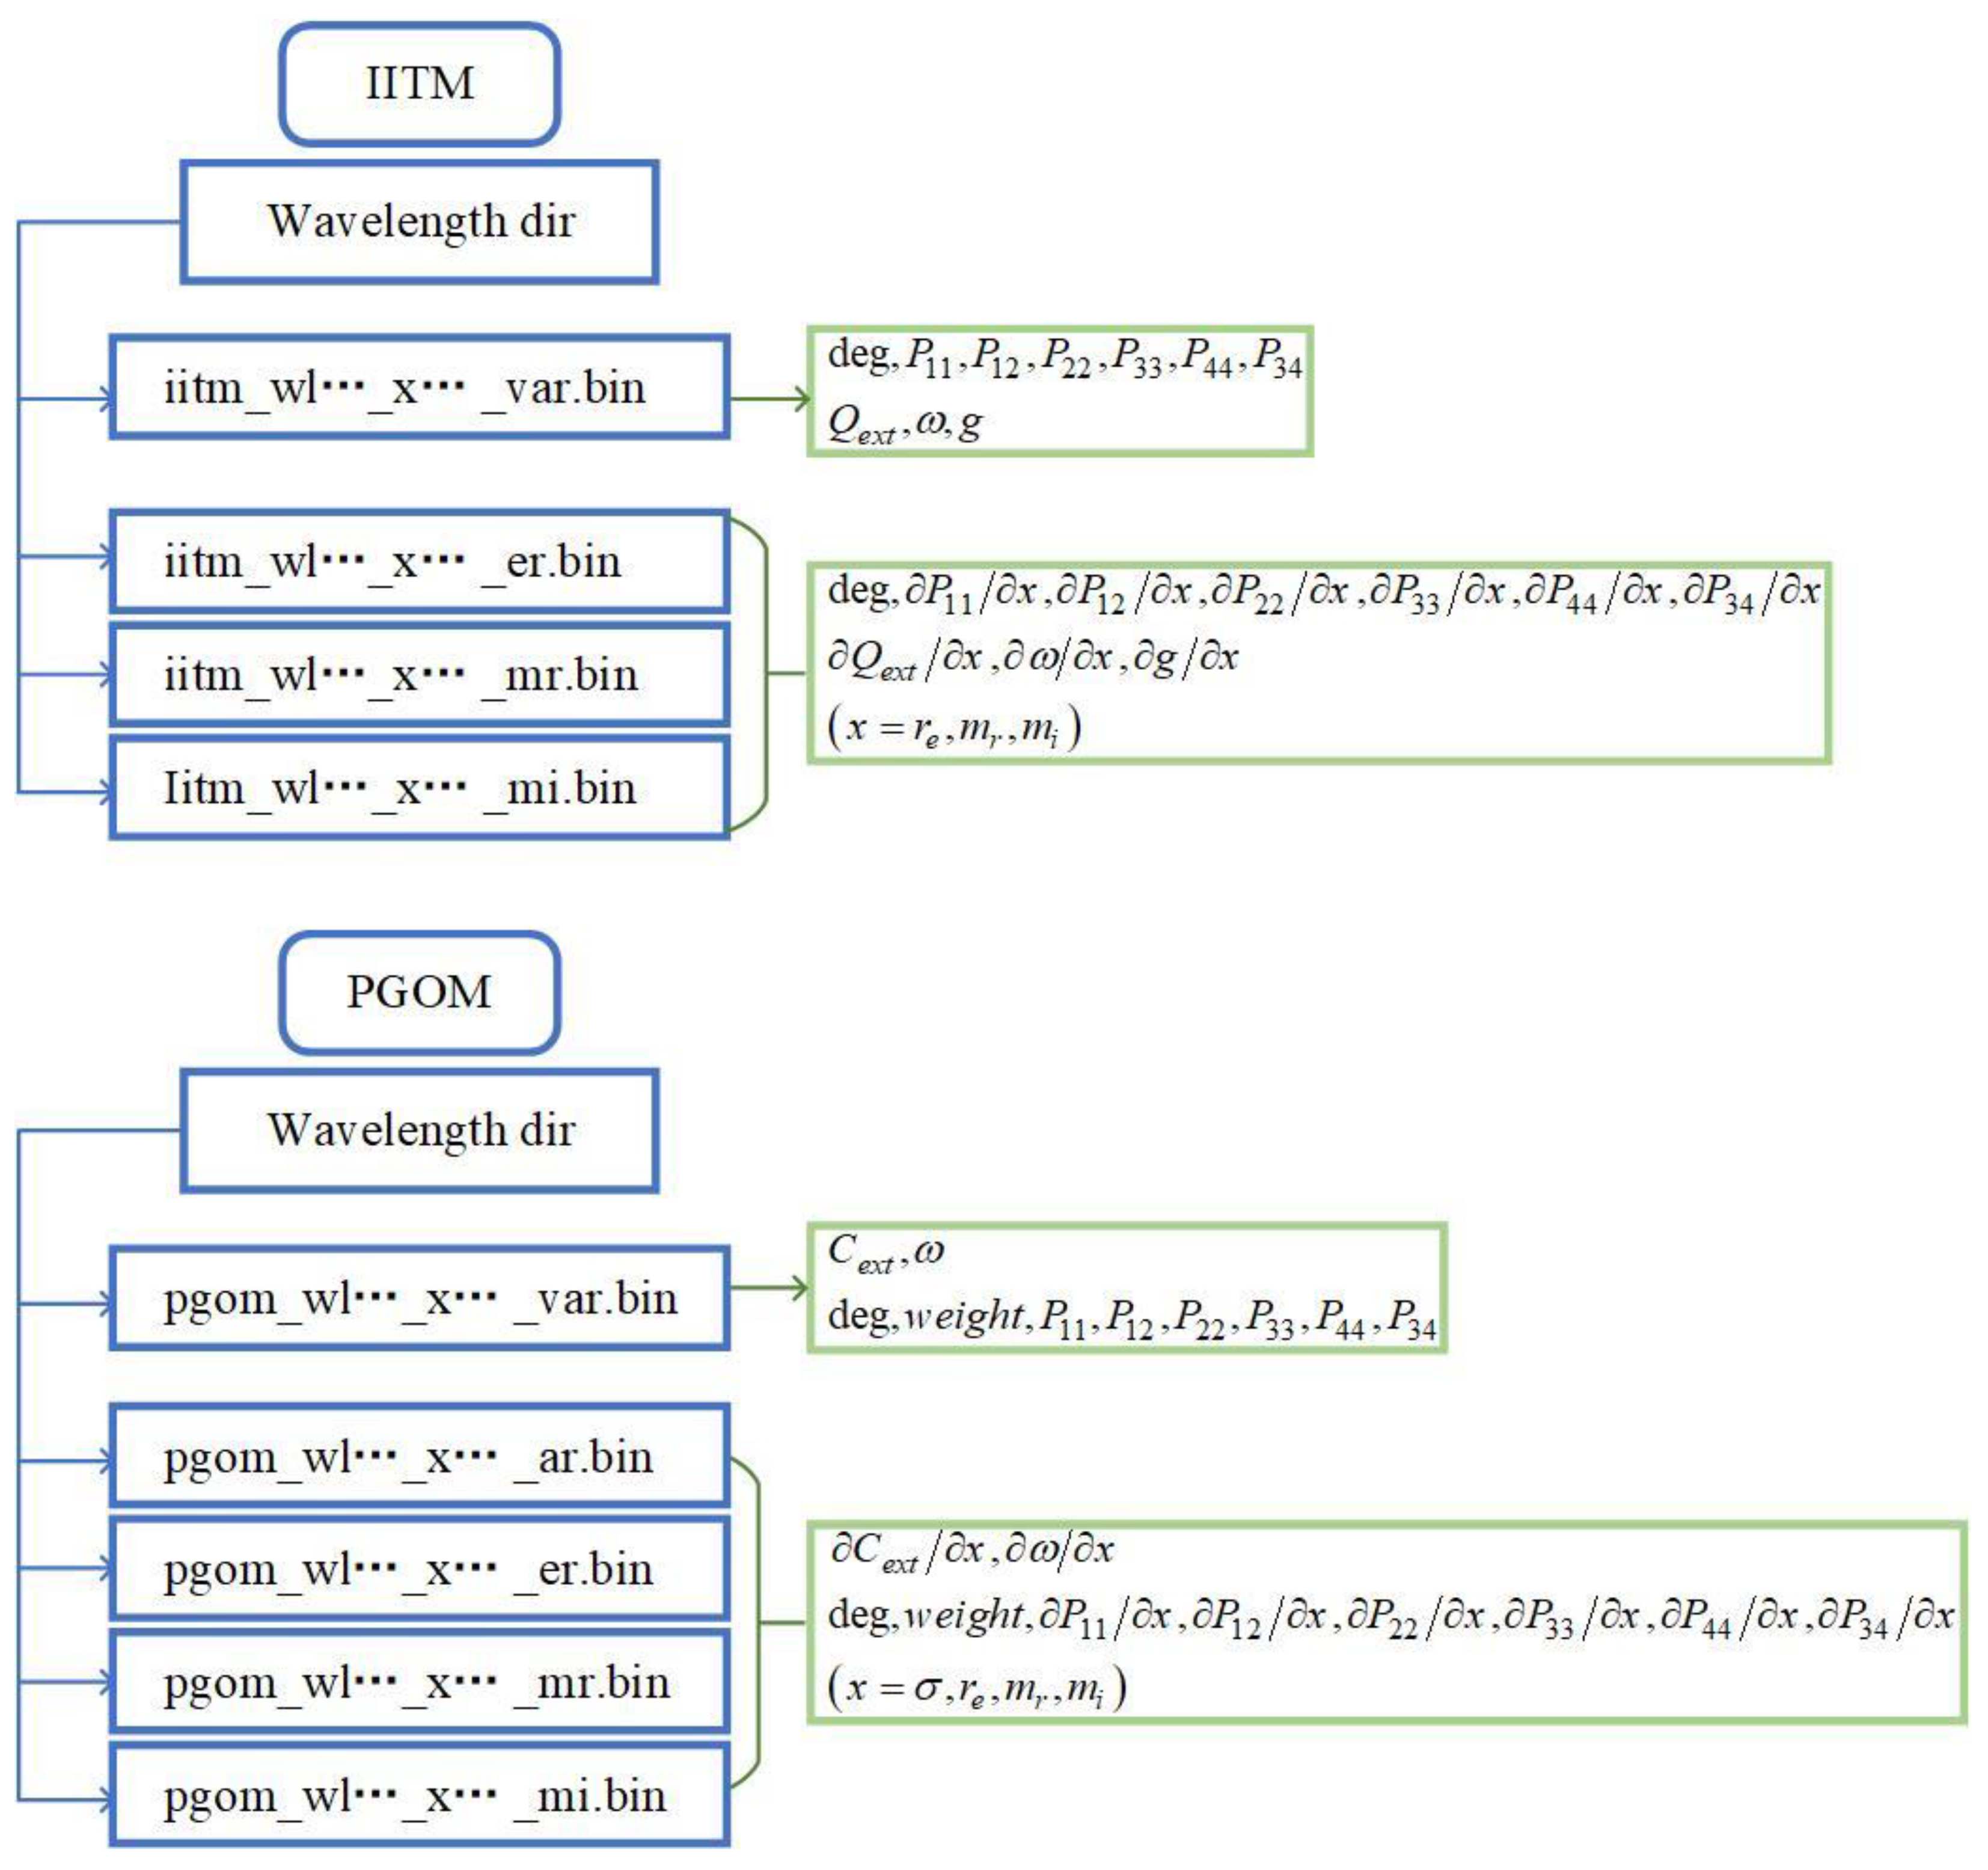
The structure of the database is illustrated in Figure 4. Considering the memory requirement, results were saved in binary form. The integral scattering properties included extinction, absorption, scattering cross-sections ( C e x t , C a b s , C s c a , respectively), asymmetry factor g, single scattering albedo ω , which follows ω = C s c a / C e x t , and C e x t = C s c a + C a b s . Corresponding efficiencies were calculated by dividing the cross section by the geometric cross section S, i.e., Q e x t = C e x t / S . By representing the incident and scattered beams as Stokes vectors I i = I i , Q i , U i , V i , I s = I s , Q s , U s , V s (subscripts “i”, “s” refer to the incident and scattered beams, respectively), they can be related by the differential scattering properties in a 4 × 4 phase matrix P. As shown by Equation (1), the phase matrix for a hexagonal prism includes six non-zero independent elements P 11 , P 12 , P 22 , P 33 , P 44 , and P 34 . The first element, termed the scattering phase function, P11, indicates the energy distribution of scattering [6]. The asymmetry factor g, calculated as the integral mean of the product of the cosine of the scattering angle and the phase function in Equation (2), represents the relative magnitude of scattering relative to forward and backward directions, and is also included in the database output. For 0 < g 1 , scattering is mainly forward with scattering angles from 0° to 90°; for 1 g < 0 , scattering is predominantly backward with angles from 90° to 180°; and for g = 0, scattering is front-to-back symmetrical, as for Rayleigh scattering [5]. The linearization of single scattering properties is described by Equation (3), which includes partial derivatives of the effective radius, as well as real and imaginary parts of the refractive index, and stored in files with suffixes of er.bin, mr.bin, and mi.bin, respectively. Partial derivatives of the aspect ratio are contained in the ar.bin-suffixed PGOM files. Files with var.bin suffixes store original scattering properties.
I s Q s U s V s = C s c a 4 π r 2 P 11 P 12 0 0 P 12 P 22 0 0 0 0 P 33 P 34 0 0 P 34 P 44 I i Q i U i V i
g = 1 1 P 11 cos θ cos θ d ( c o s θ )
y x = Q e x t , ω , g , P r e f f , m r , m i = r e f f , m r , m i T Q e x t , ω , g , P

3.1. Integrated Scattering Properties

The variation in integrated single scattering properties for wavelengths of 0.4–15 μm and size parameters of 0.5–500 is shown in Figure 5. The properties of the two algorithms were combined at a size parameter of 50. The real and imaginary parts of the refractive index represent the scattering and absorption capacity of particles, respectively. Integrated scattering properties therefore varied with refractive index, which was determined by wavelength. Normally, the extinction efficiency peaks with increasing size parameter before converging to a value of two. Similar features of the maximum extinction efficiency, Q e x t ( max ) in Figure 5a, and the real part of the refractive index in Figure 1a are shown. The steep decline of mr indicates that Q e x t ( max ) occurred at a larger size parameter, and the wavelength of maximum mr was associated with the smallest Q e x t ( max ) occurrence size parameter. Extinction efficiencies at all wavelengths in the studied range converged to 2 with size parameters greater than 40. Variations in single scattering albedo reflected the values of the imaginary part of the refractive index, as shown in Figure 5d. For wavelengths less than 3 μm with smaller mi, single scattering albedos near unity indicate that scattering predominated in the single scattering process. In the case of larger absorption, albedos converged to a constant with size parameters greater than 20. Asymmetry factors in Figure 5g were relatively stable and increased monotonically toward unity with increasing size parameter.
The subplots in Figure 5b,e,h and Figure 5c,f,i illustrate the vertical and horizontal change rates of the integrated single scattering properties, respectively. The change rate with respect to wavelength can be calculated using the chain rule y / λ = y / m r m r / λ + y / m i m i / λ . Partial derivatives with respect to the wavelength in Figure 5b,e,h indicate spectral sensitivities, which oscillated with increasing size parameter. The oscillation of Jacobians was caused by the constructive and destructive interference between the diffraction and transmission fields. The interference structures were strongly damped when absorption became large, which were proxied by the bigger imaginary parts of the refractive index between wavelengths 5 and 15 μm [6]. The variation was evident at about 3 and 11 μm, due to drastic changes in the refractive index. However, variations with size parameter in Figure 5c,f,i were clustered at smaller sizes, and mainly positive values decreased. Weak negative values are annotated by dashed lines and occurred mainly with a size parameter of 10. These features were correlated with a trend of increasing then plateauing integral scattering properties, which indicates that all these properties converged to fixed values as particle size increased.

3.2. Differential Scattering Properties

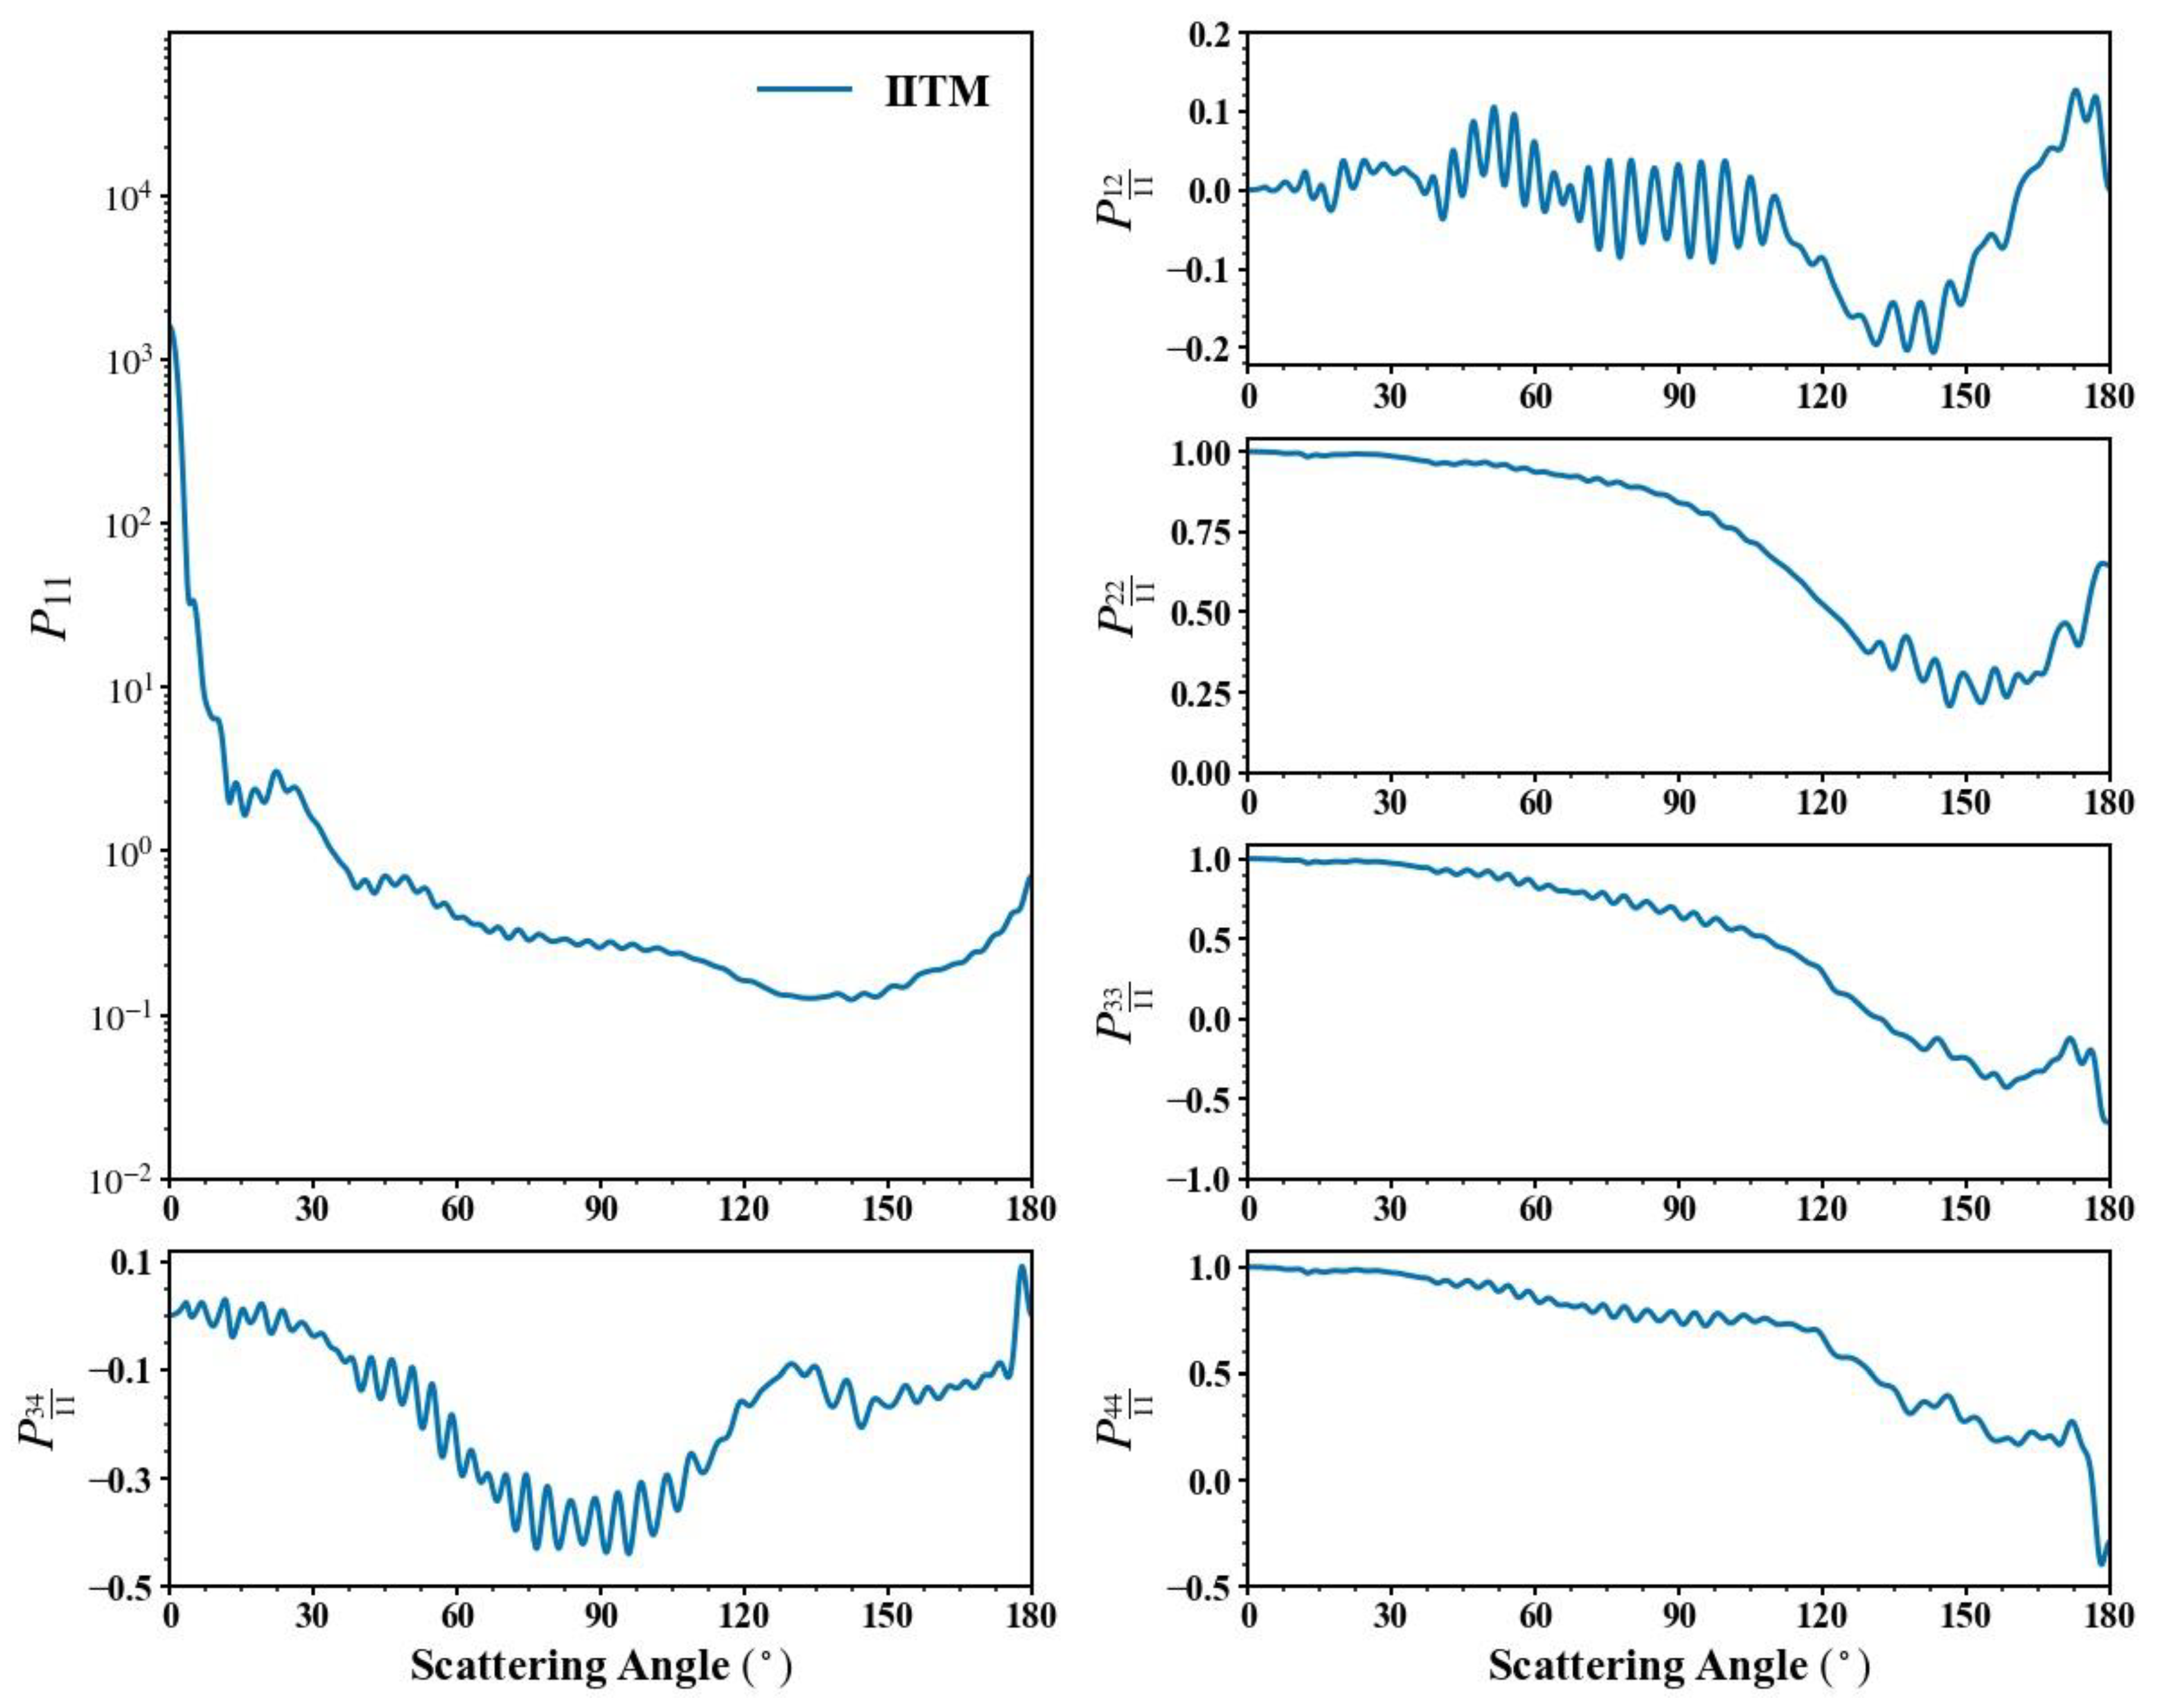
A comprehensive database enables analysis of variations in particle scattering distributions with spectra and size parameters. Six non-zero phase matrix elements were included in the database as functions of scattering angles, and an example is shown in Figure 6. The first element of phase matrix P11 is termed the phase function. As a function of angle, P11 reflects the distribution of scattering energy. A strong forward diffraction peak and halos of the hexagonal prism were all shown in the phase function diagram. The other phase matrix elements indicate the intensity of polarization and are presented as ratios, P i j 11 = P i j / P 11 (“ij” denotes the subscript of any other phase matrix elements other than 11).
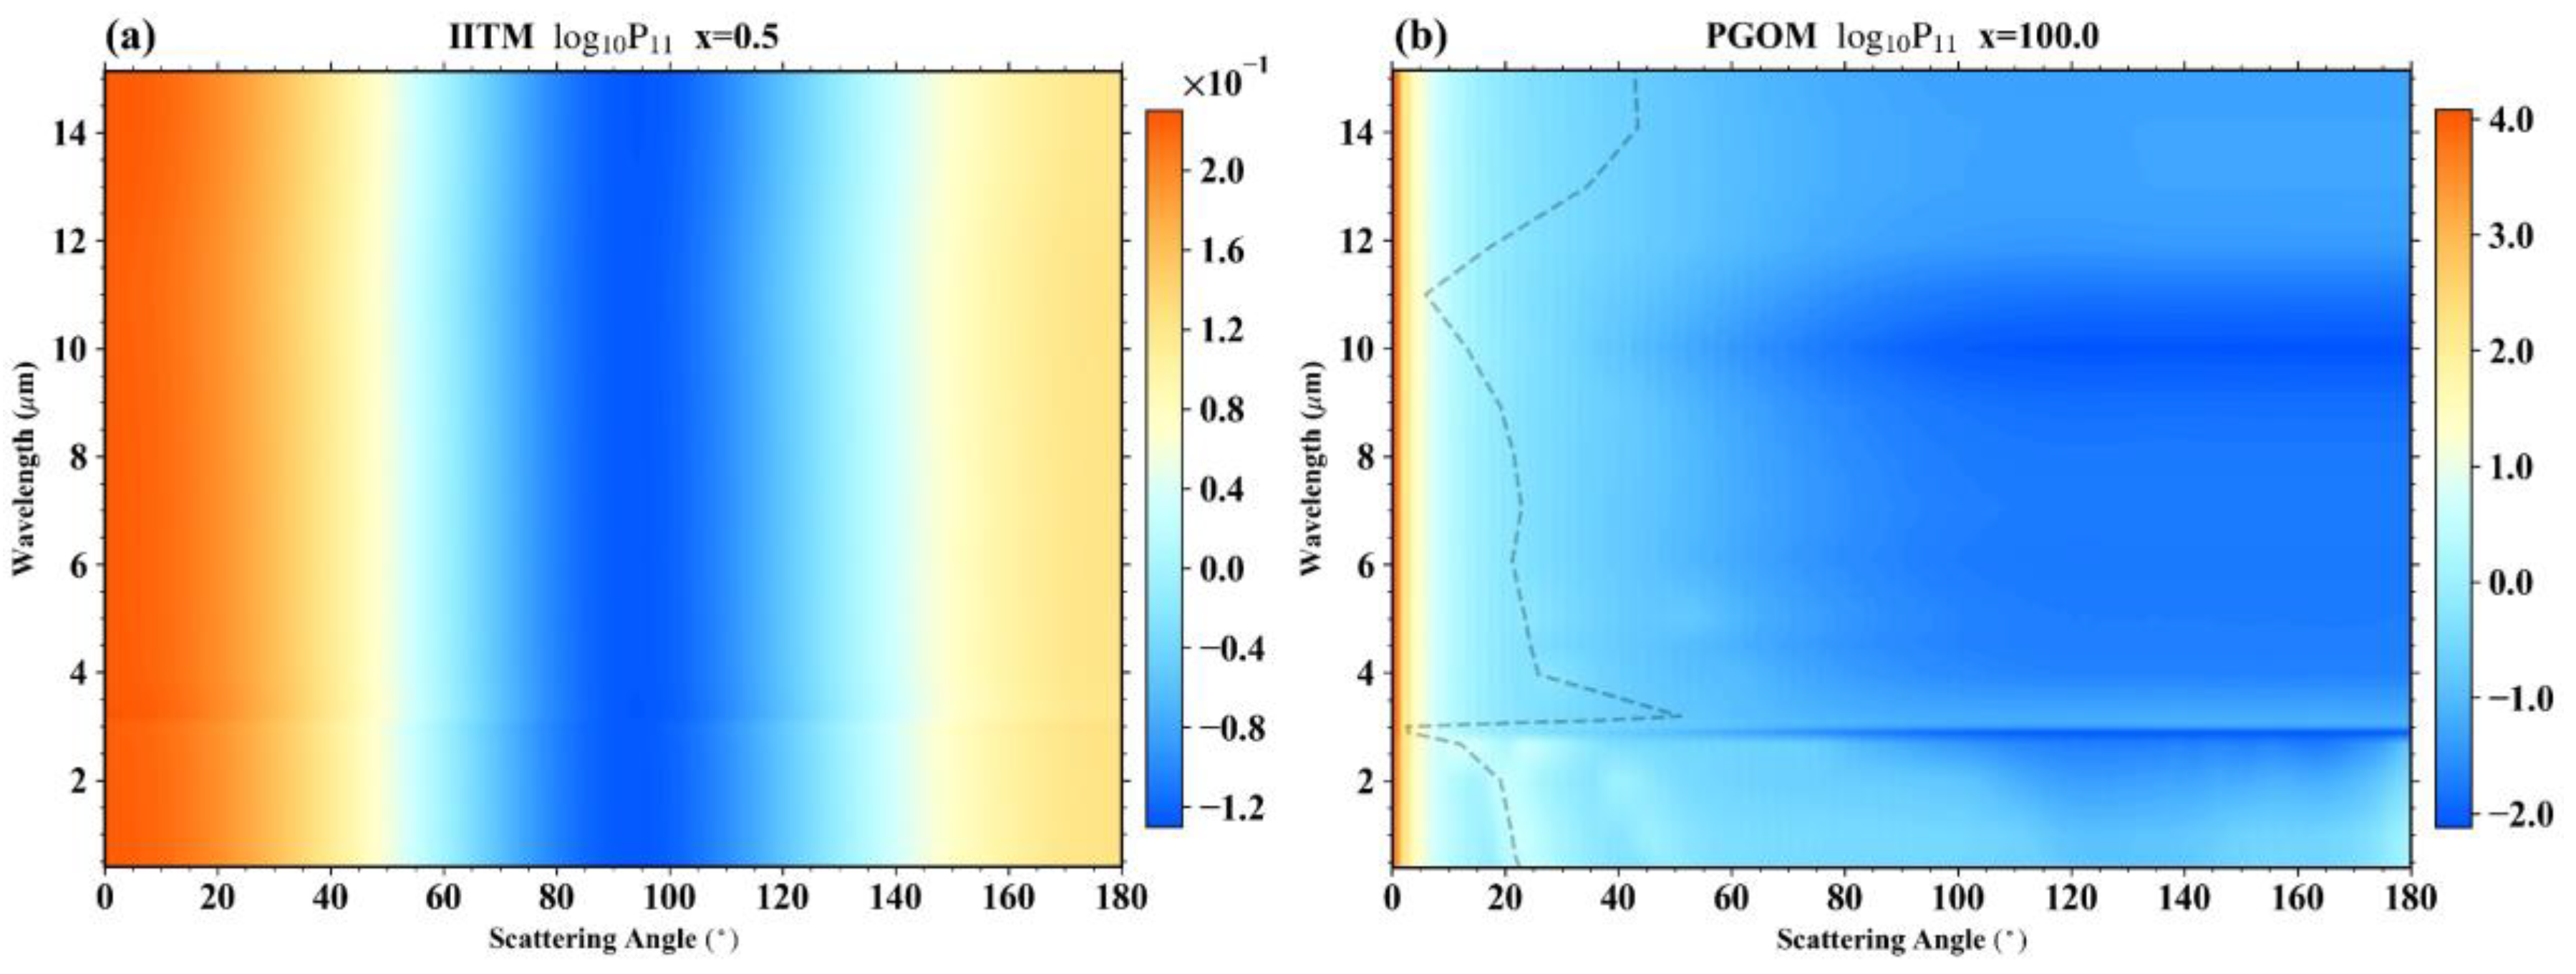
When the particle size is much smaller than the wavelength, scattering can be solved using the Rayleigh approximation, and the phase function will be symmetric in the forward and backward directions [6]. For a regular hexagonal prism with a fixed size parameter of x = 0.5, the stronger forward peaks of phase function P11 appear, and minimal scattering occurs perpendicular to the incident direction, as shown in Figure 7a. Discrepancies between forward and other angles are not obvious for smaller size parameters. Another noteworthy feature is that the phase function does not vary significantly as the refractive index oscillates with wavelength. The phase function for a size parameter of 100 is shown in Figure 7b. With its large size parameter compared to the Rayleigh regime, the asymmetry of the forward and backward phase functions was evident. The extremely strong forward diffraction peaks in the phase function differed from those of the backward direction by five orders of magnitude, with a significant effect on the efficiency of radiative transfer calculations. The weak absorption due to the minor imaginary part of the refractive index resulted in two halos at about 22° and 46°, and wavelengths less than 2 μm could be faintly seen. Additionally, the dashed line in Figure 7b indicates the halo peak angle calculated from the incident angle and the real part of the refractive index [60]. The halo dashed line corresponded well to extremes of the phase function. Light passing through facets of randomly oriented hexagonal prisms generated the 22° halo feature. Oscillation of the real part of the refractive index had a significant effect at large degrees of scattering, especially for the low extremes at wavelengths of 3 and 10 μm.
The variations in phase functions with size parameters are shown in Figure 8 for a fixed wavelength. The phase functions of small particles had a relatively uniform scattering distribution, which was consistent with the features shown in Figure 7a. A clear angular signature appeared in the phase functions of large particles at wavelengths less than 2 μm as, for example, the forward diffraction peaks, with halos at ~22° and 46°, 120°–160° ice bow features, and faint peaks in the backward direction that are shown in Figure 8a,b. As wavelength increased, these halos peaks tended to occur at smaller angles, such as 20° and 38°, as in Figure 8b, and the range of ice bow features at scattering angles of around 130° was extended to 100°–180°. The large forward peak of the phase function could be seen only at wavelengths larger than 2 μm (e.g., 3.195 μm in Figure 8c). With the most elevated real parts of the refractive index, values of side-scattering greater than 20° were less than 1, and the halo features of the ice hexagonal prism were removed.

4. Discussion

The scattering properties and their partial derivatives derived from the linearized algorithms were presented in Section 3. The optical parameters, such as exact backward scattering and backscattering depolarization ratios, are widely applicated in atmospheric detecting and can be further obtained by means of these basic characteristics.
The exact backward scattering corresponding to 180° of phase function, termed retro-reflection, has significant impact on groundbase instrumental observations. Figure 9a shows the variation of the exact backward scattering (P11 (180°)) with wavelength and particle size parameter. The change from negative to positive in partial derivatives of P11(180°) with respect to wavelength corresponded to the backward scattering trough, as shown particularly with intermediate size parameters. This feature is evident in Figure 9b, with the strongest negative and positive alternations occurring at a wavelength of 3 μm with an intermediate size parameter. Variations in size parameters corresponded to partial derivatives with respect to effective radius, with small oscillations occurring at small sizes, as shown in Figure 9c.
In lidar application, the backscattering depolarization ratio is commonly taken into account to indicate the particle nonsphericity. The linear, circular backscattering depolarization ratios could be calculated by the phase matrix elements [15] as
δ l = P 11 P 22 P 11 + P 22 ,
δ c = P 11 + P 44 P 11 P 44 = 2 δ l 1 δ l .
For randomly oriented hexagonal prisms, there are certain relations between the phase matrix elements [3]. Consequently, the linear and circular backscattering depolarization ratios vary in the roughly same way [15,61,62]. Figure 10 displays an example of the fluctuations of the linear backscattering depolarization ratio and its derivatives with size parameters at a given wavelength. As with variation in previous studies, the linear backscattering depolarization ratio rapidly increased at a size parameter of about 10 and gradually decreased after oscillation. It is worth noting that the derivatives of the refractive index had different sensitive size parameters and showed opposite trends.

5. Conclusions

A synthetic scattering database was developed that contains integral and differential single scattering properties and their partial derivatives with respect to the real and imaginary parts of the refractive index and effective radius for randomly oriented hexagonal prisms for a spectral range from 0.4 to 15 μm and size parameter ranges from 0.5 to 500. The creation of the database is based on a combination of the linearized invariant imbedding T-matrix method and the linearized physical-geometric optics method. The essential characteristics of scattering properties and their sensitivities were investigated. Change features were dominated mainly by the refractive index and were strongly influenced by size parameters at relatively small values. The partial derivatives with respect to the refractive index, wavelength, and effective radius quantified the features of the variations. Furthermore, the spectral and size-dependent variations of the partial derivatives of the single scattering properties and useful characteristics were also discussed. The linearized database will be helpful in improving the accuracy of remote sensing applications.

Author Contributions

Conceptualization, B.S., C.G. and D.L.; methodology, B.S., C.G. and D.L.; software, B.S., J.L. and Z.L.; validation, B.S., C.G. and D.L.; formal analysis, C.G.; data curation, C.G.; writing—original draft preparation, C.G.; writing—review and editing, C.G. and B.S.; visualization, C.G.; supervision, B.S.; project administration, B.S.; funding acquisition, B.S. All authors have read and agreed to the published version of the manuscript.

Funding

This research was funded by the National Key Research and Development Program, grant number 2021YFB3900401; the National Natural Science Foundation of China, grant number 41975021; and the Shanghai Science and Technology Development Foundation, grant number 20dz1200700.

Data Availability Statement

The database is publicly available and can be obtained by contacting the corresponding author.

Conflicts of Interest

The authors declare no conflict of interest.

References

  1. Boucher, O.; Randall, D.; Artaxo, P.; Bretherton, C.; Feingold, G.; Forster, P.; Kerminen, V.-M.; Kondo, Y.; Liao, H.; Lohmann, U. Clouds and aerosols. In Climate Change 2013: The Physical Science Basis. Contribution of Working Group I to the Fifth Assessment Report of the Intergovernmental Panel on Climate Change; Cambridge University Press: Cambridge, UK, 2013; pp. 571–657. [Google Scholar]
  2. Liou, K.N. An Introduction to Atmospheric Radiation; Elsevier Science: Amsterdam, The Netherlands, 2002. [Google Scholar]
  3. van de Hulst, H.C. Light Scattering by Small Particles; Courier Corporation: Chelmsford, MA, USA, 1981. [Google Scholar]
  4. Mishchenko, M.I.; Hovenier, J.W.; Travis, L.D. Light Scattering by Nonspherical Particles: Theory, Measurements, and Applications; Elsevier: Amsterdam, The Netherlands, 1999. [Google Scholar]
  5. Mishchenko, M.I.; Travis, L.D.; Lacis, A.A. Scattering, Absorption, and Emission of Light by Small Particles; Cambridge University Press: Cambridge, UK, 2002. [Google Scholar]
  6. Bohren, C.F.; Huffman, D.R. Absorption and Scattering of Light by Small Particles; John Wiley & Sons: Hoboken, NJ, USA, 2008. [Google Scholar]
  7. Born, M.; Wolf, E. Principles of Optics: Electromagnetic Theory of Propagation, Interference and Diffraction of Light; Elsevier: Amsterdam, The Netherlands, 2013. [Google Scholar]
  8. Liou, K.N.; Takano, Y. Light scattering by nonspherical particles: Remote sensing and climatic implications. Atmos. Res. 1994, 31, 271–298. [Google Scholar] [CrossRef]
  9. Mie, G. Beiträge zur Optik trüber Medien, speziell kolloidaler Metallösungen. Ann. Der Phys. 1908, 330, 377–445. [Google Scholar] [CrossRef]
  10. Lorenz, L.V. Upon the light reflected and refracted by a transparent sphere. Vidensk. Selsk. Shrifter 1890, 6, 1–62. [Google Scholar]
  11. Kahnert, F.M. Numerical methods in electromagnetic scattering theory. J. Quant. Spectrosc. Radiat. Transf. 2003, 79, 775–824. [Google Scholar] [CrossRef]
  12. Sun, B.; Bi, L.; Yang, P.; Kahnert, M.; Kattawar, G. Invariant Imbedding T-Matrix Method for Light Scattering by Nonspherical and Inhomogeneous Particles; Elsevier: Amsterdam, The Netherlands, 2019. [Google Scholar]
  13. Johnson, B.R. Invariant imbedding T-matrix approach to electromagnetic scattering. Appl. Opt. 1988, 27, 4861–4873. [Google Scholar] [CrossRef] [PubMed]
  14. Waterman, P.C. Symmetry, unitarity, and geometry in electromagnetic scattering. Phys. Rev. D 1971, 3, 825. [Google Scholar] [CrossRef]
  15. Mishchenko, M.I.; Travis, L.D.; Mackowski, D.W. T-matrix computations of light scattering by nonspherical particles: A review. J. Quant. Spectrosc. Radiat. Transf. 1996, 55, 535–575. [Google Scholar] [CrossRef]
  16. Mishchenko, M.I.; Zakharova, N.T.; Videen, G.; Khlebtsov, N.G.; Wriedt, T. Comprehensive T-matrix reference database: A 2007–2009 update. J. Quant. Spectrosc. Radiat. Transf. 2010, 111, 650–658. [Google Scholar] [CrossRef] [Green Version]
  17. Mishchenko, M.I. Comprehensive thematic T-matrix reference database: A 2017–2019 update. J. Quant. Spectrosc. Radiat. Transf. 2020, 242, 106692. [Google Scholar] [CrossRef] [Green Version]
  18. Mishchenko, M.I.; Travis, L.D.; Mackowski, D.W. T-matrix method and its applications to electromagnetic scattering by particles: A current perspective. J. Quant. Spectrosc. Radiat. Transf. 2010, 111, 1700–1703. [Google Scholar] [CrossRef] [Green Version]
  19. Bi, L.; Yang, P. Accurate simulation of the optical properties of atmospheric ice crystals with the invariant imbedding T-matrix method. J. Quant. Spectrosc. Radiat. Transf. 2014, 138, 17–35. [Google Scholar] [CrossRef]
  20. Sun, B.; Yang, P.; Kattawar, G.W.; Zhang, X. Physical-geometric optics method for large size faceted particles. Opt. Express 2017, 25, 24044–24060. [Google Scholar] [CrossRef] [PubMed] [Green Version]
  21. Chen, X.; Wang, J.; Gomes, J.; Dubovik, O.; Yang, P.; Saito, M. Analytical Prediction of Scattering Properties of Spheroidal Dust Particles With Machine Learning. Geophys. Res. Lett. 2022, 49, e2021GL097548. [Google Scholar] [CrossRef]
  22. Yu, J.; Bi, L.; Han, W.; Wang, D.; Zhang, X. Jacobians of single-scattering optical properties of super-spheroids computed using neural networks. Opt. Express 2022, 30, 38513–38533. [Google Scholar] [CrossRef] [PubMed]
  23. Fu, Q.; Yang, P.; Sun, W.B. An accurate parameterization of the infrared radiative properties of cirrus clouds for climate models. J. Clim. 1998, 11, 2223–2237. [Google Scholar] [CrossRef]
  24. Hess, M.; Koepke, P.; Schult, I. Optical Properties of Aerosols and Clouds: The Software Package OPAC. Bull. Am. Meteorol. Soc. 1998, 79, 831–844. [Google Scholar] [CrossRef]
  25. Yang, P.; Wei, H.; Huang, H.-L.; Baum, B.A.; Hu, Y.X.; Kattawar, G.W.; Mishchenko, M.I.; Fu, Q. Scattering and absorption property database for nonspherical ice particles in the near- through far-infrared spectral region. Appl. Opt. 2005, 44, 5512. [Google Scholar] [CrossRef] [Green Version]
  26. Meng, Z.; Yang, P.; Kattawar, G.W.; Bi, L.; Liou, K.N.; Laszlo, I. Single-scattering properties of tri-axial ellipsoidal mineral dust aerosols: A database for application to radiative transfer calculations. J. Aerosol Sci. 2010, 41, 501–512. [Google Scholar] [CrossRef]
  27. Bi, L.; Yang, P.; Kattawar, G.W.; Kahn, R. Modeling optical properties of mineral aerosol particles by using nonsymmetric hexahedra. Appl. Opt. 2010, 49, 334–342. [Google Scholar] [CrossRef]
  28. Yang, P.; Bi, L.; Baum, B.A.; Liou, K.-N.; Kattawar, G.W.; Mishchenko, M.I.; Cole, B. Spectrally Consistent Scattering, Absorption, and Polarization Properties of Atmospheric Ice Crystals at Wavelengths from 0.2 to 100 μm. J. Atmos. Sci. 2013, 70, 330–347. [Google Scholar] [CrossRef]
  29. Dubovik, O.; Sinyuk, A.; Lapyonok, T.; Holben, B.N.; Mishchenko, M.; Yang, P.; Eck, T.F.; Volten, H.; Muñoz, O.; Veihelmann, B.; et al. Application of spheroid models to account for aerosol particle nonsphericity in remote sensing of desert dust. J. Geophys. Res. 2006, 111, D11. [Google Scholar] [CrossRef]
  30. Saito, M.; Yang, P.; Ding, J.; Liu, X. A comprehensive database of the optical properties of irregular aerosol particles for radiative transfer simulations. J. Atmos. Sci. 2021, 78, 2089–2111. [Google Scholar] [CrossRef]
  31. Bi, L.; Yang, P.; Kattawar, G.W.; Hu, Y.; Baum, B.A. Scattering and absorption of light by ice particles: Solution by a new physical-geometric optics hybrid method. J. Quant. Spectrosc. Radiat. Transf. 2011, 112, 1492–1508. [Google Scholar] [CrossRef]
  32. Bi, L.; Yang, P. Improved ice particle optical property simulations in the ultraviolet to far-infrared regime. J. Quant. Spectrosc. Radiat. Transf. 2017, 189, 228–237. [Google Scholar] [CrossRef] [Green Version]
  33. Baum, B.A.; Heymsfield, A.J.; Yang, P.; Bedka, S.T. Bulk Scattering Properties for the Remote Sensing of Ice Clouds. Part I: Microphysical Data and Models. J. Appl. Meteorol. Climatol. 2005, 44, 1885–1895. [Google Scholar] [CrossRef]
  34. Huang, H.-L.; Yang, P.; Wei, H.; Baum, B.A.; Hu, Y.; Antonelli, P.; Ackerman, S.A. Inference of ice cloud properties from high spectral resolution infrared observations. IEEE Trans. Geosci. Remote Sens. 2004, 42, 842–853. [Google Scholar] [CrossRef] [Green Version]
  35. Yang, P.; Gao, B.-C.; Baum, B.A.; Hu, Y.X.; Wiscombe, W.J.; Tsay, S.-C.; Winker, D.M.; Nasiri, S.L. Radiative properties of cirrus clouds in the infrared (8–13 μm) spectral region. J. Quant. Spectrosc. Radiat. Transf. 2001, 70, 473–504. [Google Scholar] [CrossRef]
  36. Baum, B.A.; Yang, P.; Heymsfield, A.J.; Bansemer, A.; Cole, B.H.; Merrelli, A.; Schmitt, C.; Wang, C. Ice cloud single-scattering property models with the full phase matrix at wavelengths from 0.2 to 100 µm. J. Quant. Spectrosc. Radiat. Transf. 2014, 146, 123–139. [Google Scholar] [CrossRef]
  37. Baum, B.A.; Yang, P.; Heymsfield, A.J.; Schmitt, C.G.; Xie, Y.; Bansemer, A.; Hu, Y.X.; Zhang, Z. Improvements in shortwave bulk scattering and absorption models for the remote sensing of ice clouds. J. Appl. Meteorol. Climatol. 2011, 50, 1037–1056. [Google Scholar] [CrossRef] [Green Version]
  38. Fu, Q.; Sun, W.; Yang, P. Modeling of scattering and absorption by nonspherical cirrus ice particles at thermal infrared wavelengths. J. Atmos. Sci. 1999, 56, 2937–2947. [Google Scholar] [CrossRef]
  39. Letu, H.; Ishimoto, H.; Riedi, J.; Nakajima, T.Y.; C-Labonnote, L.; Baran, A.J.; Nagao, T.M.; Sekiguchi, M. Investigation of ice particle habits to be used for ice cloud remote sensing for the GCOM-C satellite mission. Atmos. Chem. Phys. 2016, 16, 12287–12303. [Google Scholar] [CrossRef]
  40. Volten, H.; Muñoz, O.; Hovenier, J.W.; de Haan, J.F.; Vassen, W.; van der Zande, W.J.; Waters, L.B.F.M. WWW scattering matrix database for small mineral particles at 441.6 and. J. Quant. Spectrosc. Radiat. Transf. 2005, 90, 191–206. [Google Scholar] [CrossRef]
  41. Volten, H.; Muñoz, O.; Hovenier, J.W.; Waters, L.B.F.M. An update of the Amsterdam Light Scattering Database. J. Quant. Spectrosc. Radiat. Transf. 2006, 100, 437–443. [Google Scholar] [CrossRef] [Green Version]
  42. Muñoz, O.; Moreno, F.; Guirado, D.; Dabrowska, D.D.; Volten, H.; Hovenier, J.W. The Amsterdam–Granada Light Scattering Database. J. Quant. Spectrosc. Radiat. Transf. 2012, 113, 565–574. [Google Scholar] [CrossRef]
  43. Stephens, G.L.; Vane, D.G.; Boain, R.J.; Mace, G.G.; Sassen, K.; Wang, Z.; Illingworth, A.J.; O’connor, E.J.; Rossow, W.B.; Durden, S.L.; et al. The CloudSat mission and the A-Train: A new dimension of space-based observations of clouds and precipitation. Bull. Am. Meteorol. Soc. 2002, 83, 1771–1790. [Google Scholar] [CrossRef] [Green Version]
  44. Letu, H.; Nagao, T.M.; Nakajima, T.Y.; Riedi, J.; Ishimoto, H.; Baran, A.J.; Shang, H.; Sekiguchi, M.; Kikuchi, M. Ice Cloud Properties From Himawari-8/AHI Next-Generation Geostationary Satellite: Capability of the AHI to Monitor the DC Cloud Generation Process. IEEE Trans. Geosci. Remote Sens. 2019, 57, 3229–3239. [Google Scholar] [CrossRef]
  45. Rodgers, C.D. Inverse Methods for Atmospheric Sounding: Theory and Practice; World Scientific: Singapore, 2000; Volume 2. [Google Scholar]
  46. Maahn, M.; Turner, D.D.; Löhnert, U.; Posselt, D.J.; Ebell, K.; Mace, G.G.; Comstock, J.M. Optimal Estimation Retrievals and Their Uncertainties: What Every Atmospheric Scientist Should Know. Bull. Am. Meteorol. Soc. 2020, 101, E1512–E1523. [Google Scholar] [CrossRef]
  47. Wang, J.; Xu, X.; Ding, S.; Zeng, J.; Spurr, R.; Liu, X.; Chance, K.; Mishchenko, M. A numerical testbed for remote sensing of aerosols, and its demonstration for evaluating retrieval synergy from a geostationary satellite constellation of GEO-CAPE and GOES-R. J. Quant. Spectrosc. Radiat. Transf. 2014, 146, 510–528. [Google Scholar] [CrossRef] [Green Version]
  48. Wang, C.; Platnick, S.; Zhang, Z.; Meyer, K.; Yang, P. Retrieval of ice cloud properties using an optimal estimation algorithm and MODIS infrared observations. Part 2. Retrieval evaluation content. J. Geophys. Res. Atmos. 2016, 121, 5809–5826. [Google Scholar] [CrossRef] [Green Version]
  49. Wang, C.; Platnick, S.; Zhang, Z.; Meyer, K.; Yang, P. Retrieval of ice cloud properties using an optimal estimation algorithm and MODIS infrared observations. Part I: Forward model, error analysis, and information content. J. Geophys. Res. Atmos. 2016, 121, 5809–5826. [Google Scholar] [CrossRef] [Green Version]
  50. Hasekamp, O.P.; Landgraf, J. Linearization of vector radiative transfer with respect to aerosol properties and its use in satellite remote sensing. J. Geophys. Res. Atmos. 2005, 110, D04203. [Google Scholar] [CrossRef]
  51. Sun, B.; Gao, C.; Bi, L.; Spurr, R. Analytical Jacobians of single scattering optical properties using the invariant imbedding T-matrix method. Opt Express 2021, 29, 9635–9669. [Google Scholar] [CrossRef]
  52. Spurr, R.; Wang, J.; Zeng, J.; Mishchenko, M.I. Linearized T-matrix and Mie scattering computations. J. Quant. Spectrosc. Radiat. Transf. 2012, 113, 425–439. [Google Scholar] [CrossRef] [Green Version]
  53. Gao, C.; Sun, B. Improvement and application of linearized invariant imbedding T-matrix scattering method. J. Quant. Spectrosc. Radiat. Transf. 2022, 290, 108322. [Google Scholar] [CrossRef]
  54. Liang, D.; Sun, B. Linearization of light scattering properties based on the physical-geometric optics method. Opt. Express 2022, 30, 22178–22199. [Google Scholar] [CrossRef] [PubMed]
  55. Sun, B.; Gao, C.; Liang, D.; Liu, Z.; Liu, J. Capability and convergence of linearized invariant-imbedding T-matrix and physical-geometric optics methods for light scattering. Opt. Express 2022, 30, 37769–37785. [Google Scholar] [CrossRef] [PubMed]
  56. Heymsfield, A.J.; Bansemer, A.; Field, P.R.; Durden, S.L.; Stith, J.L.; Dye, J.E.; Hall, W.; Grainger, C.A. Observations and parameterizations of particle size distributions in deep tropical cirrus and stratiform precipitating clouds: Results from in situ observations in TRMM field campaigns. J. Atmos. Sci. 2002, 59, 3457–3491. [Google Scholar] [CrossRef]
  57. Mcfarquhar, G.M.; Heymsfield, A.J. Parameterization of Tropical Cirrus Ice Crystal Size Distributions and Implications for Radiative Transfer Results from CEPEX. J. Atmos. Sci. 1997, 54, 2187–2200. [Google Scholar] [CrossRef]
  58. Rolland, P.; Liou, K.N.; King, M.D.; Tsay, S.C.; McFarquhar, G.M. Remote sensing of optical and microphysical properties of cirrus clouds using Moderate-Resolution Imaging Spectroradiometer channels: Methodology and sensitivity to physical assumptions. J. Geophys. Res. 2000, 105, 11721–11738. [Google Scholar] [CrossRef]
  59. Warren, S.G.; Brandt, R.E. Optical constants of ice from the ultraviolet to the microwave: A revised compilation. J. Geophys. Res. Atmos. 2008, 113, D14220. [Google Scholar] [CrossRef]
  60. Flatau, P.J.; Draine, B.T. Light scattering by hexagonal columns in the discrete dipole approximation. Opt. Express 2014, 22, 21834–21846. [Google Scholar] [CrossRef] [PubMed]
  61. Mishchenko, M.I.; Hovenier, J.W. Depolarization of light backscattered by randomly oriented nonspherical particles. Opt. Lett. 1995, 20, 1356–1358. [Google Scholar] [CrossRef] [PubMed]
  62. Mishchenko, M.I.; Sassen, K. Depolarization of lidar returns by small ice crystals: An application to contrails. Geophys. Res. Lett. 1998, 25, 309–312. [Google Scholar] [CrossRef]
Figure 1. Trends in the complex refractive index and their changing rates of ice, (a,b) for the real parts (mr) and (c,d) for the imaginary parts (mi). δ is the differential notation. Data are from Warren et al. (2008) [59]. Points represent the wavelengths selected in this database.
Remotesensing 14 06138 g001
Figure 2. Scatter plot of the corresponding particle vertical heights with various size parameters and selected wavelengths listed in Table 1.
Remotesensing 14 06138 g002
Figure 3. (a) Schematic view of the invariant imbedding T-matrix method. Tis and Tcs represent the T-matrix of the inscribed and circumscribed spheres, respectively. Tα denotes the α-th step iteration of T-matrix. (b) An example of beam-splitting in the physical-geometric optics method. e ^ i denotes the incident beam; e ^ 1 is the initial refracted beam and was divided into two parts (green and blue shades); and e ^ 2 indicates secondary refracted beam. The dashed lines show the reflected-refracted beams exiting the particle.
Remotesensing 14 06138 g003
Figure 4. Structure of the database. The blue boxes show the file names and directory (abbreviated as “dir”), and the green boxes show the variables contained in each file.
Remotesensing 14 06138 g004
Figure 5. Trends in integral scattering properties and their partial derivatives with respect to wavelength and effective radius for wavelengths of 0.4–15 μm and size parameters of 0.5–500. Nine diagrams correspond to extinction efficiency Q e x t (a), single scattering albedo ω (d), and asymmetry factor g (g) and their Jacobians with respect to the wavelength (b,e,h) and effective radius (c,f,i). Dashed lines in the third column represent the division of positive and negative derivatives.
Remotesensing 14 06138 g005
Figure 6. Six elements of IITM phase matrix at a wavelength of 0.4 μm for a size parameter of 50.
Remotesensing 14 06138 g006
Figure 7. Scattering phase function trends of a regular hexagonal prism of unit aspect ratio for wavelengths of 0.4–15 μm. Size parameters are x = 0.5 (a) and x = 100 (b). The refractive index of ice corresponds to the incident wavelength, as shown in Figure 1.
Remotesensing 14 06138 g007
Figure 8. Scattering phase function trends for size parameters of 0.5–500. The refractive index of ice corresponds to incident wavelengths of 0.4 μm (a), 2.0 μm (b), and 3.195 μm (c). Wavelengths plotted separately due to the differences in magnitude between forward and backward angles.
Remotesensing 14 06138 g008
Figure 9. The exact backward scattering (P11 (180°)) (a) and its partial derivatives with respect to wavelength (b) and effective radius (c) for size parameters of 1–500 and wavelengths of 0.4–15 μm. The dashed line in (c) represents the division of positive and negative derivatives.
Remotesensing 14 06138 g009
Figure 10. Linear backscattering depolarization ratio (a) and its partial derivatives with respect to effective radius (b) and refractive index(c,d).
Remotesensing 14 06138 g010
Table 1. Grid point values of database parameters.
ParametersGrid Points
x (IITM)0.5, 1.0, 1.5, 2.0, 2.5, 3.0, 3.5, 4.0, 4.5, 5.0, 5.5, 6.0, 6.5, 7.0, 7.5, 8.0, 8.5, 9.0, 9.5, 10.0, 11.0, 12.0, 13.0, 14.0, 15.0, 16.0, 17.0, 18.0, 19.0, 20.0, 21.0, 22.0, 23.0, 24.0, 25.0, 26.0, 27.0, 28.0, 29.0, 30.0, 32.5, 35.0, 37.5, 40.0, 42.5, 45.0, 47.5, 50.0
x (PGOM)30.0, 32.5, 35.0, 37.5, 40.0, 42.5, 45.0, 47.5, 50.0, 55.0, 60.0, 65.0, 70.0, 75.0, 80.0, 85.0, 90.0, 95.0, 100.0, 125.0, 150.0, 175.0, 200.0, 225.0, 250.0, 275.0, 300.0, 325.0, 350.0, 375.0, 400.0, 425.0, 450.0, 475.0, 500.0
λ0.400, 0.560, 0.720, 0.880, 1.000, 2.000, 2.675, 2.899, 3.003, 3.077, 3.115, 3.195, 3.9690, 4.505, 5.000, 6.061, 7.042, 8.065, 8.929, 10.000, 11.000, 11.900, 12.990, 14.080, 15.150
Publisher’s Note: MDPI stays neutral with regard to jurisdictional claims in published maps and institutional affiliations.