
Performance of Drought Indices in Assessing Rice Yield in North Korea and South Korea under the Different Agricultural Systems


Abstract
:1. Introduction
2. Study Area and Methods
2.1. North and South Korea
2.2. Study Methods
3. Results and Discussion
4. Conclusions
Author Contributions
Funding
Data Availability Statement
Conflicts of Interest
References
- Mishra, A.K.; Singh, V.P. A review of drought concepts. J. Hydrol. 2010, 391, 202–216. [Google Scholar] [CrossRef]
- Maclean, J.L.; Dawe, D.C.; Hettel, G.P. Rice Almanac: Source Book for the Most Important Economic Activity on Earth; International Rice Research Institute: Los Banos, Laguna, 2002. [Google Scholar]
- Abdullah, A.B.; Ito, S.; Adhana, K. Estimate of rice consumption in Asian countries and the world towards 2050. In Proceedings of the Workshop and Conference on Rice in the World at Stake, Los Banos, Philippines, 31 March–3 April 2006; pp. 28–43. [Google Scholar]
- Spinoni, J.; Barbosa, P.; De Jager, A.; McCormick, N.; Naumann, G.; Vogt, J.V.; Magni, D.; Masante, D.; Mazzeschi, M. A new global database of meteorological drought events from 1951 to 2016. J. Hydrol. Reg. Stud. 2019, 22, 100593. [Google Scholar] [CrossRef] [PubMed]
- Zhang, L.; Zhou, T. Drought over East Asia: A review. J. Clim. 2015, 28, 3375–3399. [Google Scholar] [CrossRef]
- Matiu, M.; Ankerst, D.P.; Menzel, A. Interactions between temperature and drought in global and regional crop yield variability during 1961–2014. PLoS ONE 2017, 12, e0178339. [Google Scholar] [CrossRef] [PubMed] [Green Version]
- Wardlow, B.D.; Anderson, M.C.; Verdin, J.P. Remote Sensing of Drought: Innovative Monitoring Approaches; CRC Press: Boca Raton, FL, USA, 2012. [Google Scholar]
- Gao, Z.; Wang, Q.; Cao, X.; Gao, W. The responses of vegetation water content (EWT) and assessment of drought monitoring along a coastal region using remote sensing. GIScience Remote Sens. 2014, 51, 1–16. [Google Scholar] [CrossRef]
- Feng, P.; Wang, B.; Li, D.; Yu, Q. Machine learning-based integration of remotely-sensed drought factors can improve the estimation of agricultural drought in South-Eastern Australia. Agric. Syst. 2019, 173, 303–316. [Google Scholar] [CrossRef]
- Bayissa, Y.A.; Tadesse, T.; Svoboda, M.; Wardlow, B.; Poulsen, C.; Swigart, J.; Van Andel, S.J. Developing a satellite-based combined drought indicator to monitor agricultural drought: A case study for Ethiopia. GIScience Remote Sens. 2019, 56, 718–748. [Google Scholar] [CrossRef]
- Bhuiyan, C.; Saha, A.K.; Bandyopadhyay, N.; Kogan, F.N. Analyzing the impact of thermal stress on vegetation health and agricultural drought–a case study from Gujarat, India. GIScience Remote Sens. 2017, 54, 678–699. [Google Scholar] [CrossRef]
- McKee, T.B.; Doesken, N.J.; Kleist, J. The relationship of drought frequency and duration to time scales. In Proceedings of the 8th Conference on Applied Climatology, Anaheim, CA, USA, 17–22 January 1993; pp. 179–183. [Google Scholar]
- Vicente-Serrano, S.M.; Beguería, S.; López-Moreno, J.I. A multiscalar drought index sensitive to global warming: The standardized precipitation evapotranspiration index. J. Clim. 2010, 23, 1696–1718. [Google Scholar] [CrossRef] [Green Version]
- Palmer, W.C. Meteorological Drought; US Department of Commerce, Weather Bureau: Washington, DC, USA, 1965; Volume 30. [Google Scholar]
- Park, E.; Jo, H.W.; Lee, W.K.; Lee, S.; Song, C.; Lee, H.; Kim, T.H. Development of earth observational diagnostic drought prediction model for regional error calibration: A case study on agricultural drought in Kyrgyzstan. GIScience Remote Sens. 2022, 59, 36–53. [Google Scholar] [CrossRef]
- Ghazaryan, G.; Dubovyk, O.; Graw, V.; Kussul, N.; Schellberg, J. Local-scale agricultural drought monitoring with satellite-based multi-sensor time-series. GIScience Remote Sens. 2020, 57, 704–718. [Google Scholar] [CrossRef]
- Zhang, L.; Jiao, W.; Zhang, H.; Huang, C.; Tong, Q. Studying drought phenomena in the Continental United States in 2011 and 2012 using various drought indices. Remote Sens. Environ. 2017, 190, 96–106. [Google Scholar] [CrossRef]
- Padhee, S.K.; Nikam, B.R.; Dutta, S.; Aggarwal, S.P. Using satellite-based soil moisture to detect and monitor spatiotemporal traces of agricultural drought over Bundelkhand region of India. GIScience Remote Sens. 2017, 54, 144–166. [Google Scholar] [CrossRef]
- Mishra, A.K.; Singh, V.P. Drought modeling–A review. J. Hydrol. 2011, 403, 157–175. [Google Scholar] [CrossRef]
- Seo, E.; Dirmeyer, P.A. Improving the ESA CCI Daily Soil Moisture Time Series with Physically Based Land Surface Model Datasets Using a Fourier Time-Filtering Method. J. Hydrometeorol. 2022, 23, 473–489. [Google Scholar] [CrossRef]
- Kogan, F.N. Application of vegetation index and brightness temperature for drought detection. Adv. Space Res. 1995, 15, 91–100. [Google Scholar] [CrossRef]
- Kogan, F.N. Global drought watch from space. Bull. Am. Meteorol. Soc. 1997, 78, 621–636. [Google Scholar] [CrossRef]
- Rhee, J.; Im, J.; Carbone, G.J. Monitoring agricultural drought for arid and humid regions using multi-sensor remote sensing data. Remote Sens. Environ. 2010, 114, 2875–2887. [Google Scholar] [CrossRef]
- Anderson, M.C.; Hain, C.; Wardlow, B.; Pimstein, A.; Mecikalski, J.R.; Kustas, W.P. Evaluation of drought indices based on thermal remote sensing of evapotranspiration over the continental United States. J. Clim. 2011, 24, 2025–2044. [Google Scholar] [CrossRef]
- Park, S.; Seo, E.; Kang, D.; Im, J.; Lee, M.-I. Prediction of drought on pentad scale using remote sensing data and MJO index through random forest over East Asia. Remote Sens. 2018, 10, 1811. [Google Scholar] [CrossRef]
- Seo, E.; Lee, M.-I.; Reichle, R.H. Assimilation of SMAP and ASCAT soil moisture retrievals into the JULES land surface model using the Local Ensemble Transform Kalman Filter. Remote Sens. Environ. 2021, 253, 112222. [Google Scholar] [CrossRef]
- Jiao, W.; Tian, C.; Chang, Q.; Novick, K.A.; Wang, L. A new multi-sensor integrated index for drought monitoring. Agric. For. Meteorol. 2019, 268, 74–85. [Google Scholar] [CrossRef] [Green Version]
- Zhang, A.; Jia, G. Monitoring meteorological drought in semiarid regions using multi-sensor microwave remote sensing data. Remote Sens. Environ. 2013, 134, 12–23. [Google Scholar] [CrossRef]
- Sánchez, N.; González-Zamora, Á.; Piles, M.; Martínez-Fernández, J. A new Soil Moisture Agricultural Drought Index (SMADI) integrating MODIS and SMOS products: A case of study over the Iberian Peninsula. Remote Sens. 2016, 8, 287. [Google Scholar] [CrossRef] [Green Version]
- Hobbins, M.T.; Wood, A.; McEvoy, D.J.; Huntington, J.L.; Morton, C.; Anderson, M.; Hain, C. The evaporative demand drought index. Part I: Linking drought evolution to variations in evaporative demand. J. Hydrometeorol. 2016, 17, 1745–1761. [Google Scholar] [CrossRef]
- Son, B.; Park, S.; Im, J.; Park, S.; Ke, Y.; Quackenbush, L.J. A new drought monitoring approach: Vector Projection Analysis (VPA). Remote Sens. Environ. 2021, 252, 112145. [Google Scholar] [CrossRef]
- Ryu, J.-H.; Han, K.-S.; Lee, Y.-W.; Park, N.-W.; Hong, S.; Chung, C.-Y.; Cho, J. Different agricultural responses to extreme drought events in neighboring counties of South and North Korea. Remote Sens. 2019, 11, 1773. [Google Scholar] [CrossRef] [Green Version]
- Yeom, J.-m.; Jeong, S.; Jeong, G.; Ng, C.T.; Deo, R.C.; Ko, J. Monitoring paddy productivity in North Korea employing geostationary satellite images integrated with GRAMI-rice model. Sci. Rep. 2018, 8, 1–15. [Google Scholar] [CrossRef] [Green Version]
- Park, S.; Im, J.; Park, S.; Rhee, J. Drought monitoring using high resolution soil moisture through multi-sensor satellite data fusion over the Korean peninsula. Agric. For. Meteorol. 2017, 237, 257–269. [Google Scholar] [CrossRef]
- Rodell, M.; Houser, P.; Jambor, U.; Gottschalck, J.; Mitchell, K.; Meng, C.-J.; Arsenault, K.; Cosgrove, B.; Radakovich, J.; Bosilovich, M. The global land data assimilation system. Bull. Am. Meteorol. Soc. 2004, 85, 381–394. [Google Scholar] [CrossRef]
- Chen, Z.; Wang, W.; Fu, J. Vegetation response to precipitation anomalies under different climatic and biogeographical conditions in China. Sci. Rep. 2020, 10, 1–16. [Google Scholar] [CrossRef] [PubMed] [Green Version]
- Park, S.; Im, J.; Jang, E.; Rhee, J. Drought assessment and monitoring through blending of multi-sensor indices using machine learning approaches for different climate regions. Agric. For. Meteorol. 2016, 216, 157–169. [Google Scholar] [CrossRef]
- Cao, Y.; Chen, S.; Wang, L.; Zhu, B.; Lu, T.; Yu, Y. An agricultural drought index for assessing droughts using a water balance method: A case study in Jilin Province, Northeast China. Remote Sens. 2019, 11, 1066. [Google Scholar] [CrossRef] [Green Version]
- Li, Z.; Han, Y.; Hao, T. Assessing the consistency of remotely sensed multiple drought indices for monitoring drought phenomena in continental China. IEEE Trans. Geosci. Remote Sens. 2020, 58, 5490–5502. [Google Scholar] [CrossRef]
- Siebert, S.; Ewert, F.; Rezaei, E.E.; Kage, H.; Graß, R. Impact of heat stress on crop yield—On the importance of considering canopy temperature. Environ. Res. Lett. 2014, 9, 044012. [Google Scholar] [CrossRef] [Green Version]
- Wang, K.; Li, T.; Wei, J. Exploring drought conditions in the Three River Headwaters Region from 2002 to 2011 using multiple drought indices. Water 2019, 11, 190. [Google Scholar] [CrossRef] [Green Version]
- Du, L.; Tian, Q.; Yu, T.; Meng, Q.; Jancso, T.; Udvardy, P.; Huang, Y. A comprehensive drought monitoring method integrating MODIS and TRMM data. Int. J. Appl. Earth Obs. Geoinf. 2013, 23, 245–253. [Google Scholar] [CrossRef]
- XING, Z.-P.; Pei, W.; Ming, Z.; Qian, H.-J.; Hu, Y.-J.; Guo, B.-W.; Wei, H.-Y.; Ke, X.; Huo, Z.-Y.; Dai, Q.-G. Temperature and solar radiation utilization of rice for yield formation with different mechanized planting methods in the lower reaches of the Yangtze River, China. J. Integr. Agric. 2017, 16, 1923–1935. [Google Scholar] [CrossRef] [Green Version]
- McCaskill, M.R. Prediction of solar radiation from rainday information using regionally stable coefficients. Agric. For. Meteorol. 1990, 51, 247–255. [Google Scholar] [CrossRef]
- Hayhoe, H.N. Relationship between weather variables in observed and WXGEN generated data series. Agric. For. Meteorol. 1998, 90, 203–214. [Google Scholar] [CrossRef]
- Liu, D.; Scott, B. Estimation of solar radiation in Australia from rainfall and temperature observations. Agric. For. Meteorol. 2001, 106, 41–59. [Google Scholar] [CrossRef]
- Seo, E.; Lee, M.-I.; Schubert, S.D.; Koster, R.D.; Kang, H.-S. Investigation of the 2016 Eurasia heat wave as an event of the recent warming. Environ. Res. Lett. 2020, 15, 114018. [Google Scholar] [CrossRef]
- Teixeira, E.I.; Fischer, G.; Van Velthuizen, H.; Walter, C.; Ewert, F. Global hot-spots of heat stress on agricultural crops due to climate change. Agric. For. Meteorol. 2013, 170, 206–215. [Google Scholar] [CrossRef]
- Vogel, E.; Donat, M.G.; Alexander, L.V.; Meinshausen, M.; Ray, D.K.; Karoly, D.; Meinshausen, N.; Frieler, K. The effects of climate extremes on global agricultural yields. Environ. Res. Lett. 2019, 14, 054010. [Google Scholar] [CrossRef]
- Kamali, B.; Abbaspour, K.C.; Lehmann, A.; Wehrli, B.; Yang, H. Spatial assessment of maize physical drought vulnerability in sub-Saharan Africa: Linking drought exposure with crop failure. Environ. Res. Lett. 2018, 13, 074010. [Google Scholar] [CrossRef]
- Abhishek; Kinouchi, T. Multidecadal Land Water and Groundwater Drought Evaluation in Peninsular India. Remote Sens. 2022, 14, 1486. [Google Scholar] [CrossRef]
- Kim, H.Y.; Shin, C.; Park, Y.; Moon, J. Water Resources Management in the Republic of Korea: Korea’s Challenge to Flood & Drought with Multi-Purpose Dam and Multi-Regional Water Supply System; IDB: Washington, DC, USA, 2018. [Google Scholar]
- Bachmair, S.; Tanguy, M.; Hannaford, J.; Stahl, K. How well do meteorological indicators represent agricultural and forest drought across Europe? Environ. Res. Lett. 2018, 13, 034042. [Google Scholar] [CrossRef]

| Data | Product | Time Period | Resolution (Spatial, Temporal) | Source |
|---|---|---|---|---|
| MODIS | LST (K) | 2001–2018 (May to October) | 1 km, 8-day | NASA EARTHDATA (https://search.earthdata.nasa.gov/, accessed on 1 November 2022) |
| NDVI | 1 km, Monthly | |||
| ET/PET (mm/8-day) | 500 m, 8-day | |||
| Land cover | 500 m, Yearly | |||
| GLDAS | Surface (0–10 cm) Soil moisture (kg/m2) | 0.25°, Monthly | ||
| TRMM | Precipitation (mm/month) | March, 2001 to October 2018 | 0.25°, Monthly | |
| Station-based precipitation | March, 1980 to October 2018 | Point, Monthly | Korea Meteorological Administration (KMA; http://data.kma.go.kr, accessed on 1 November 2022). | |
| Rice yield (kg/ha) | 2001–2018 | Yearly | Food and Agricultural Organization (FAO), United States Department of Agriculture (USDA; https://www.fas.usda.gov, accessed on 1 November 2022), and Korean Statistical Information Service (KOSIS; http://kosis.kr, accessed on 1 November 2022) | |
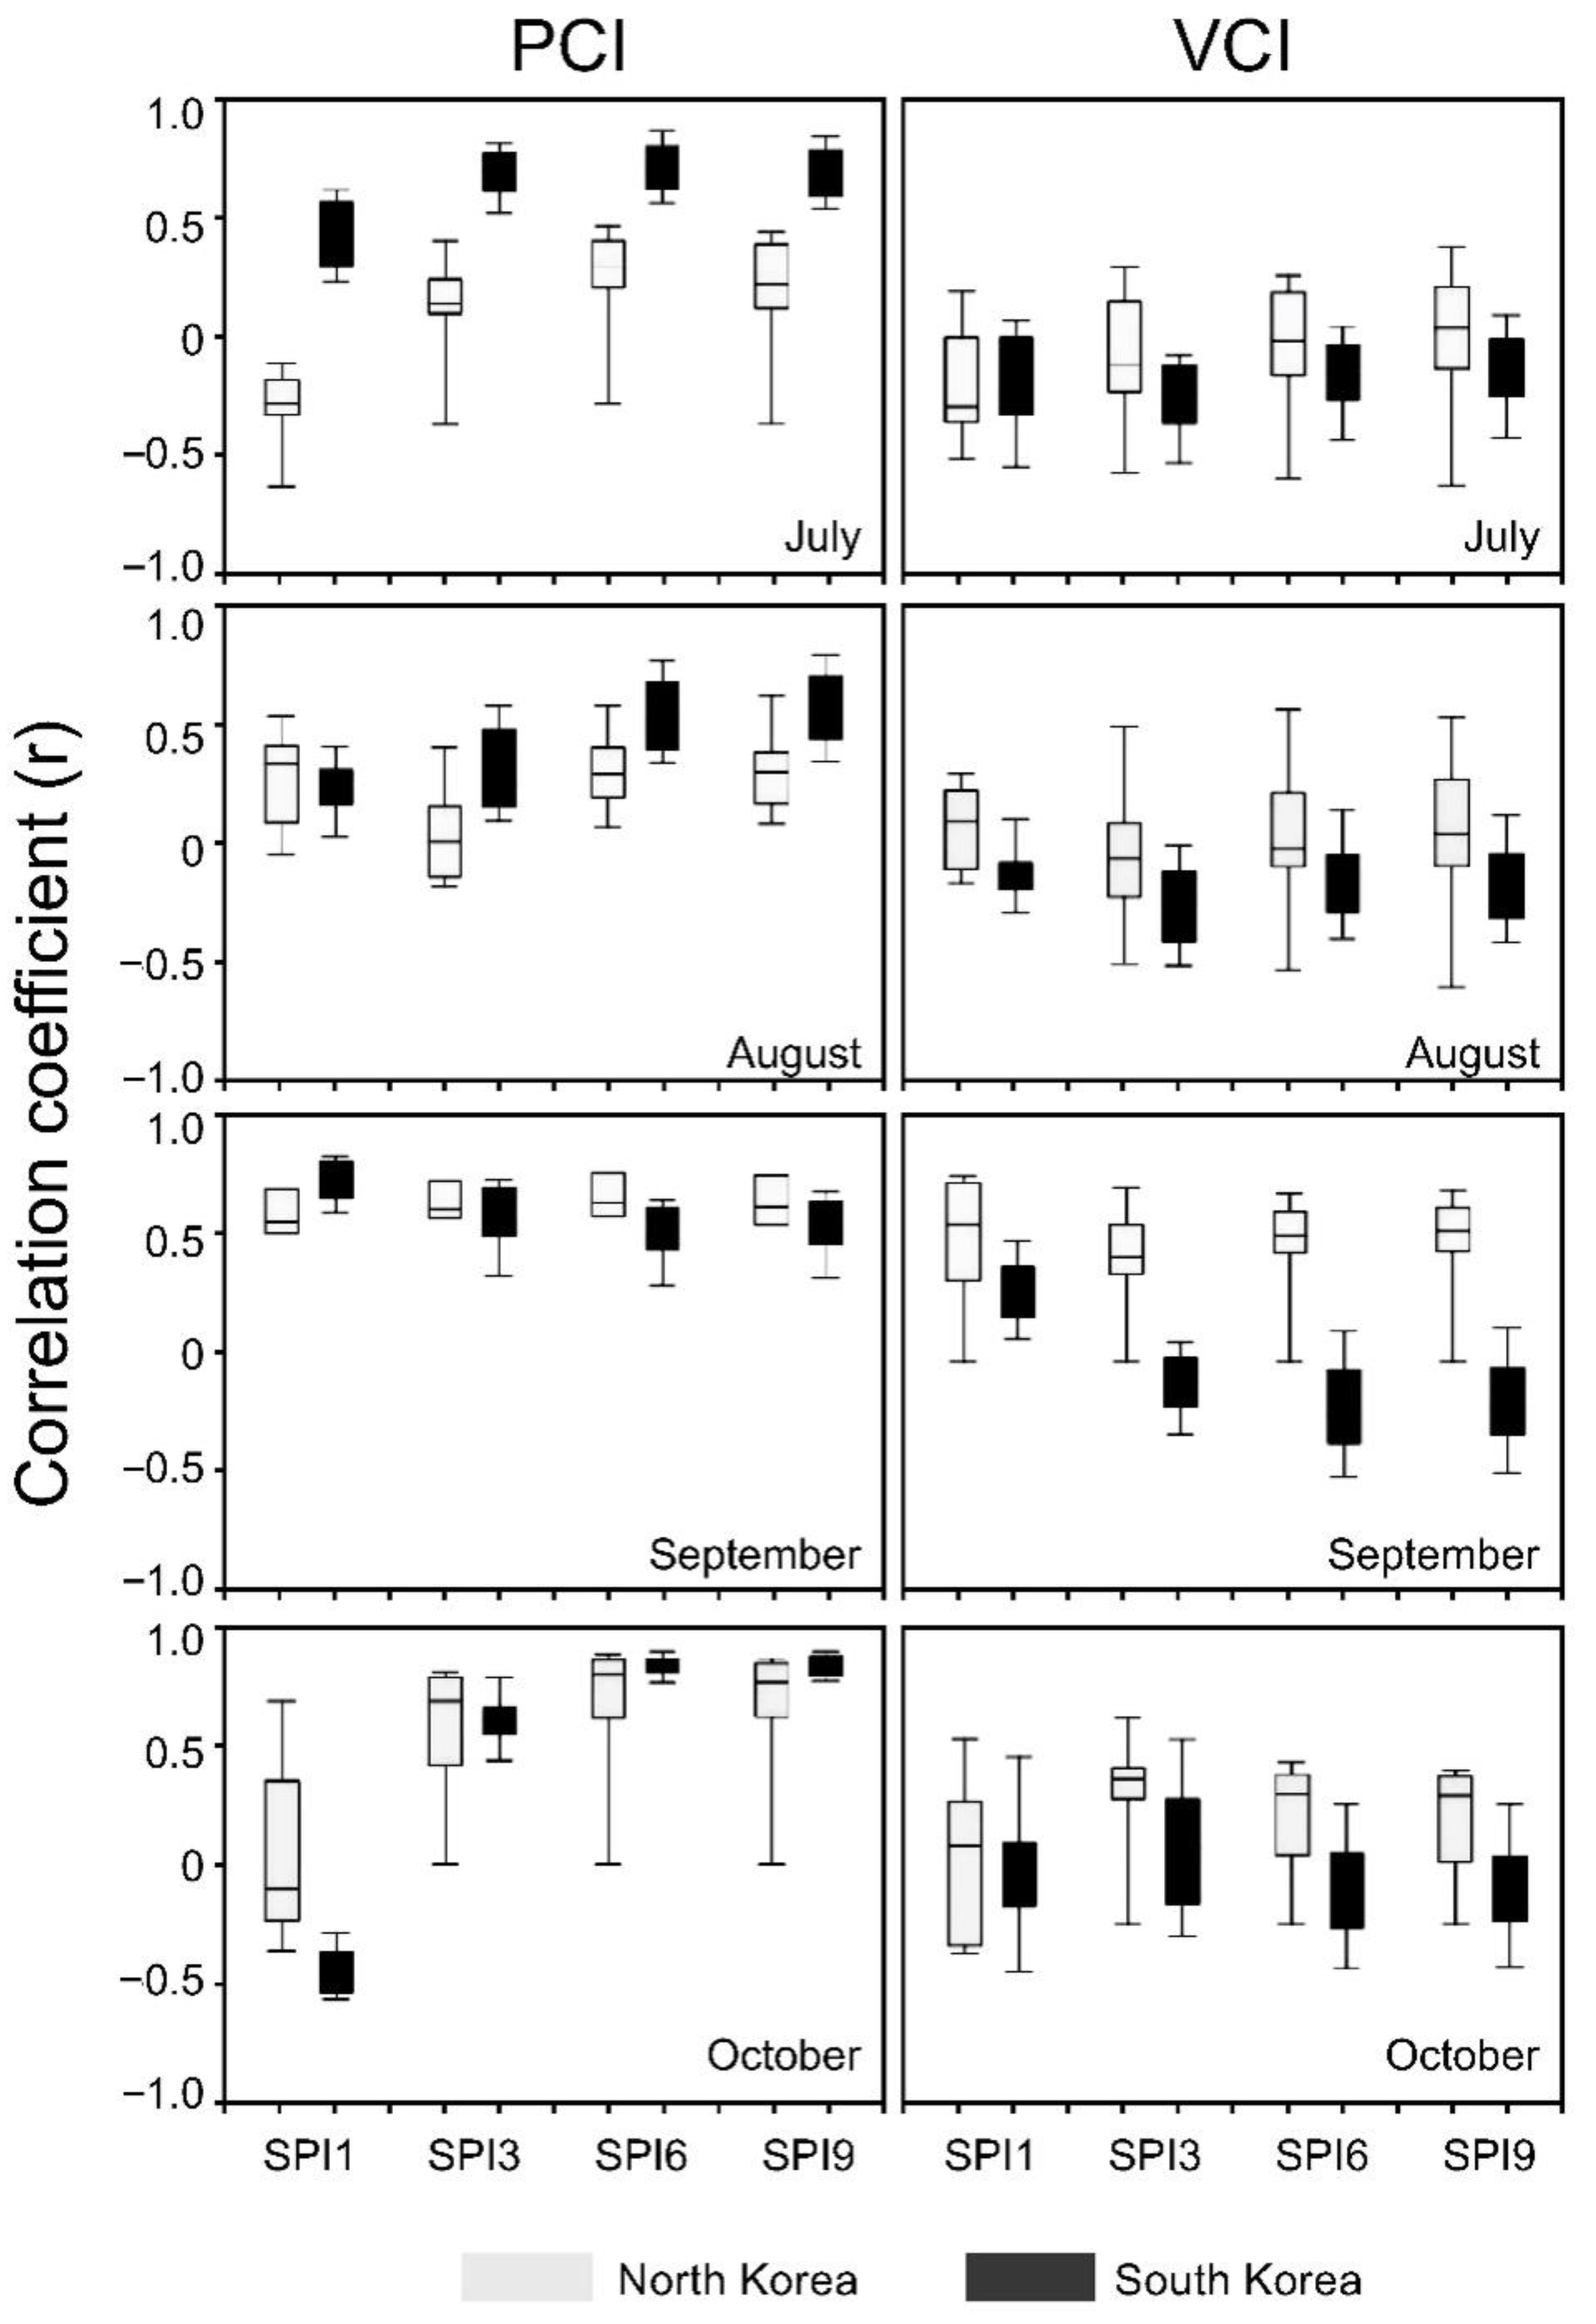
| Drought Indices | 1-Month SPI | 3-Month SPI | 6-Month SPI | 9-Month SPI | ||||
|---|---|---|---|---|---|---|---|---|
| N. Korea | S. Korea | N. Korea | S. Korea | N. Korea | S. Korea | N. Korea | S. Korea | |
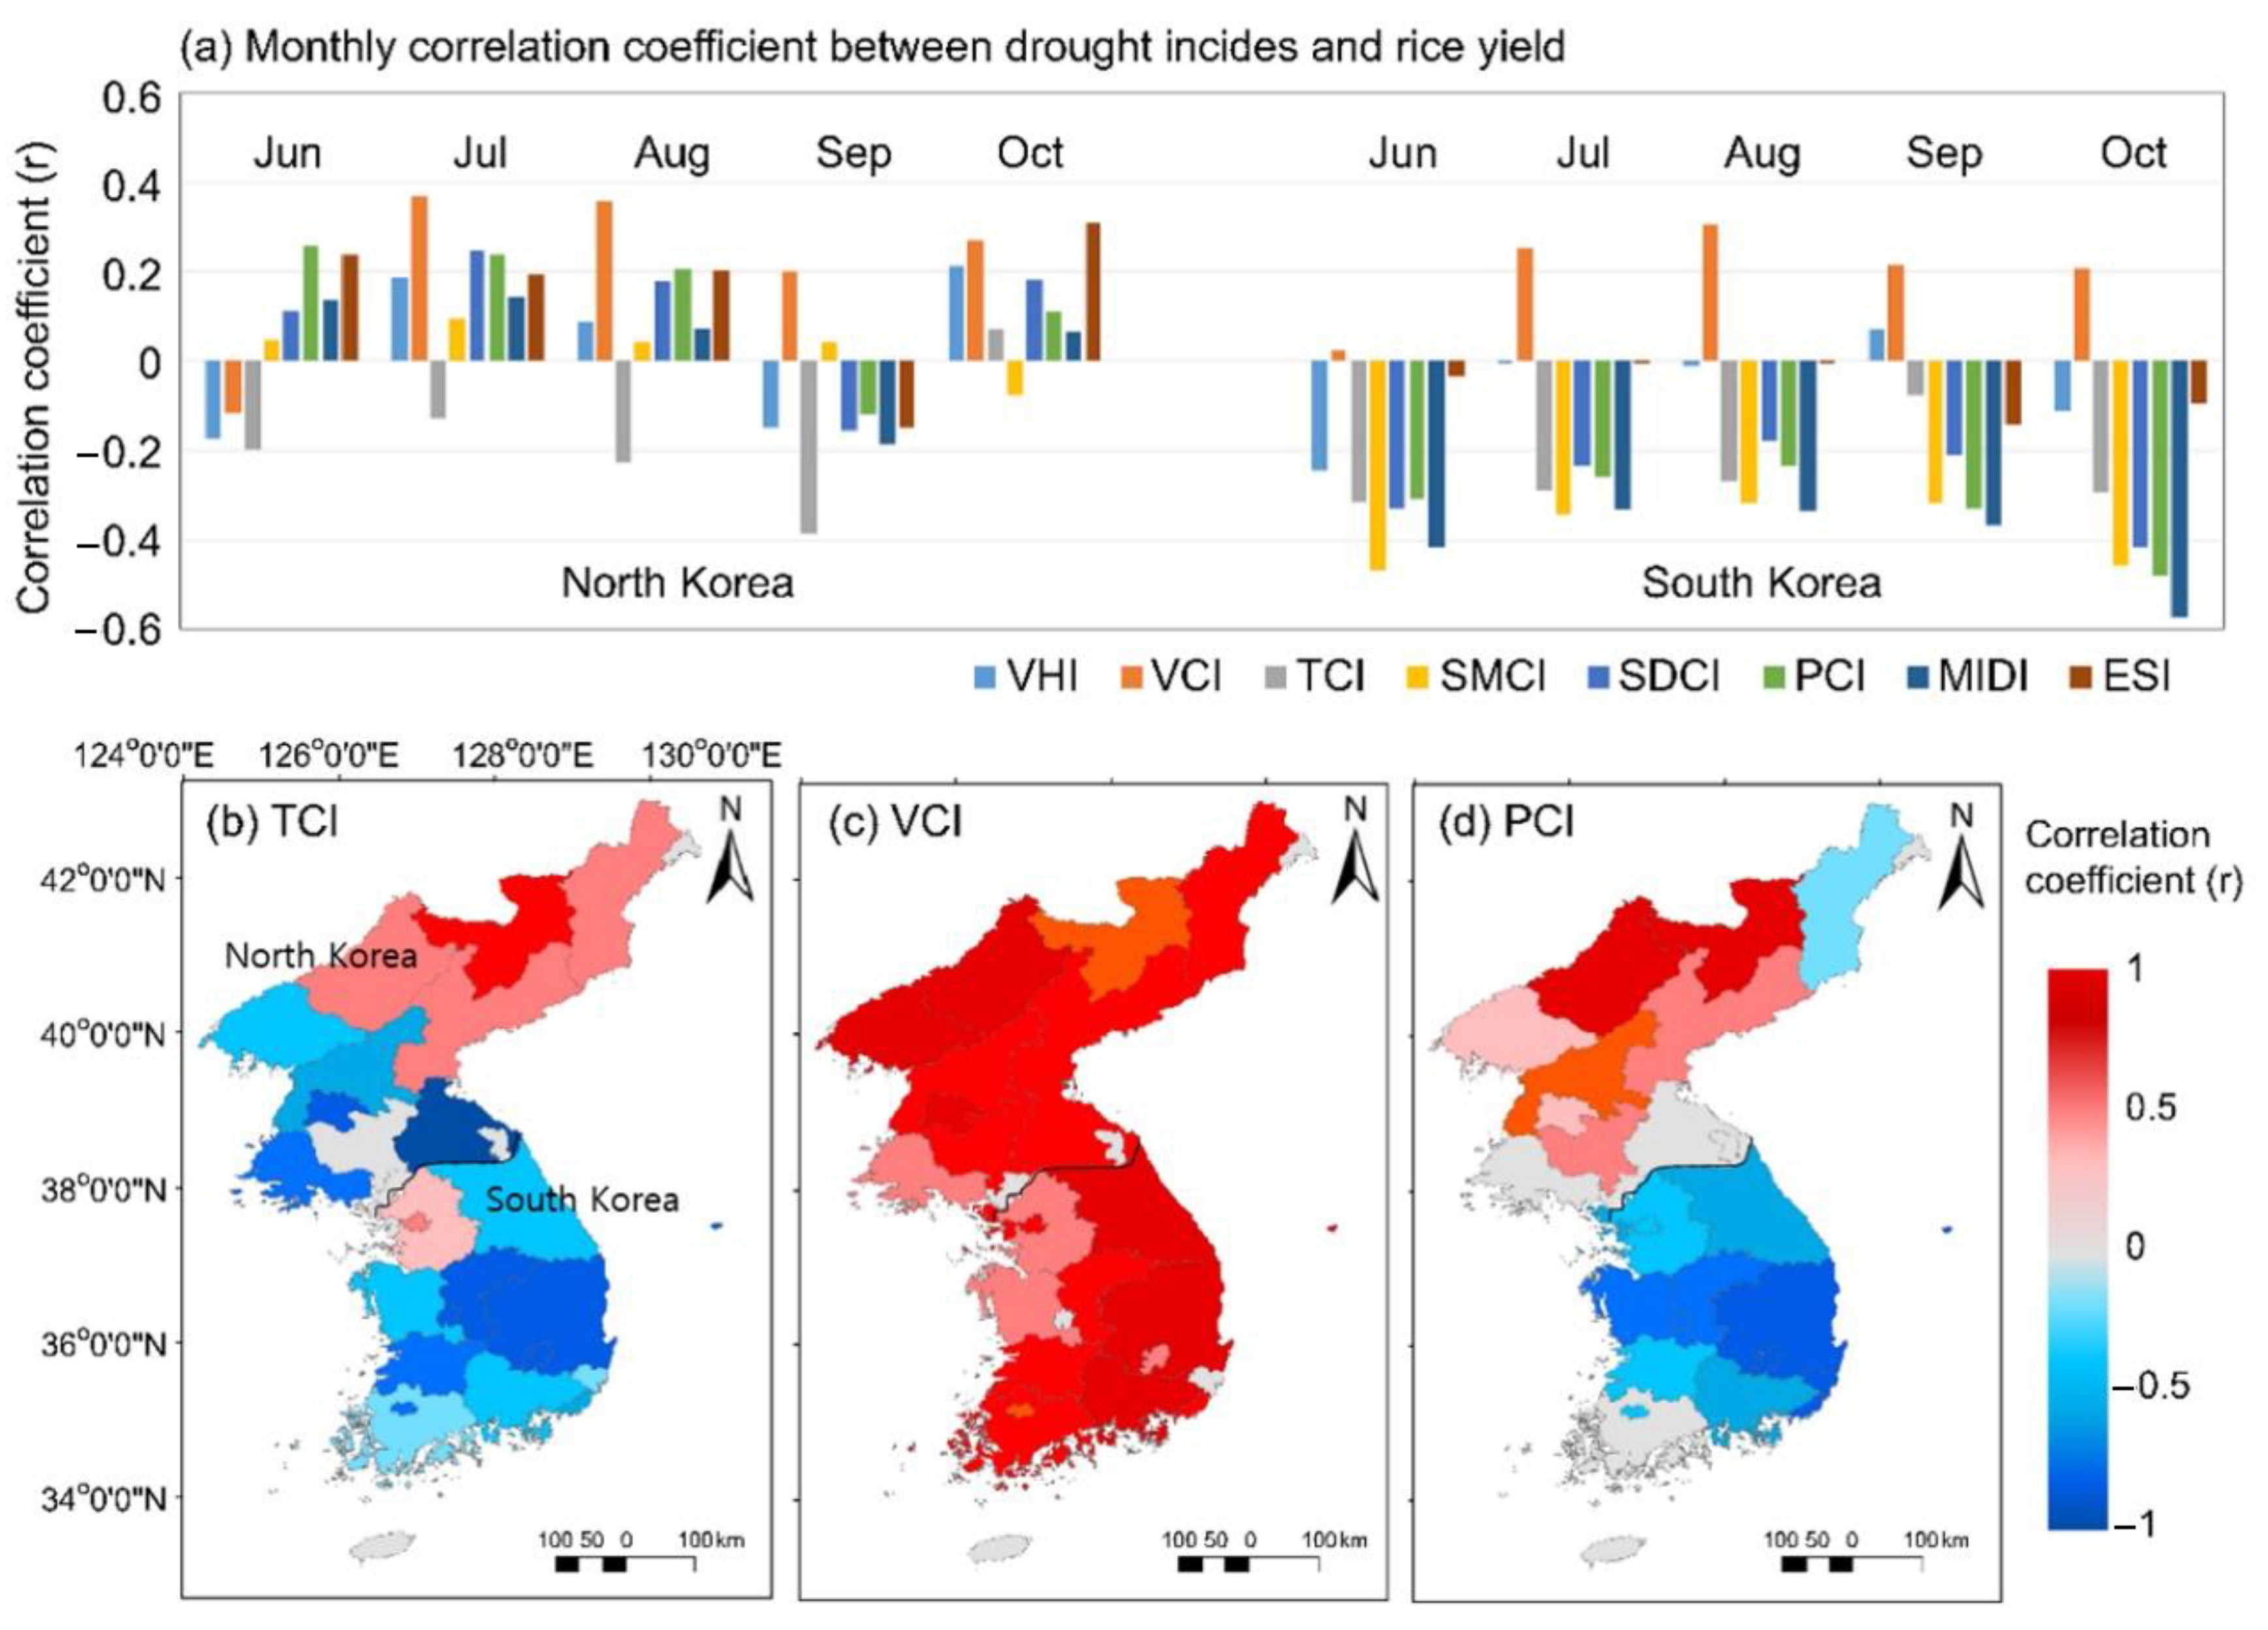
| VHI | 0.122 | 0.094 | 0.204 | 0.151 | 0.252 | 0.184 | 0.271 | 0.181 |
| ESI | 0.007 | 0.112 | 0.077 | 0.167 | 0.101 | 0.299 | 0.064 | 0.137 |
| SDCI | 0.120 | 0.286 | 0.261 | 0.454 | 0.348 | 0.502 | 0.353 | 0.458 |
| MIDI | 0.104 | 0.291 | 0.252 | 0.523 | 0.355 | 0.560 | 0.356 | 0.516 |
| TCI | 0.061 | 0.106 | 0.154 | 0.267 | 0.208 | 0.301 | 0.202 | 0.312 |
| VCI | 0.137 | 0.0257 | 0.183 | −0.039 | 0.199 | −0.033 | 0.230 | −0.077 |
| PCI | 0.090 | 0.305 | 0.243 | 0.500 | 0.336 | 0.539 | 0.330 | 0.496 |
| SMCI | 0.049 | 0.182 | 0.174 | 0.460 | 0.266 | 0.472 | 0.278 | 0.418 |
Publisher’s Note: MDPI stays neutral with regard to jurisdictional claims in published maps and institutional affiliations. |
© 2022 by the authors. Licensee MDPI, Basel, Switzerland. This article is an open access article distributed under the terms and conditions of the Creative Commons Attribution (CC BY) license (https://creativecommons.org/licenses/by/4.0/).
Share and Cite
Park, S.; Lee, J.; Yeom, J.; Seo, E.; Im, J. Performance of Drought Indices in Assessing Rice Yield in North Korea and South Korea under the Different Agricultural Systems. Remote Sens. 2022, 14, 6161. https://doi.org/10.3390/rs14236161
Park S, Lee J, Yeom J, Seo E, Im J. Performance of Drought Indices in Assessing Rice Yield in North Korea and South Korea under the Different Agricultural Systems. Remote Sensing. 2022; 14(23):6161. https://doi.org/10.3390/rs14236161
Chicago/Turabian StylePark, Seonyoung, Jaese Lee, Jongmin Yeom, Eunkyo Seo, and Jungho Im. 2022. "Performance of Drought Indices in Assessing Rice Yield in North Korea and South Korea under the Different Agricultural Systems" Remote Sensing 14, no. 23: 6161. https://doi.org/10.3390/rs14236161