Technical Note

Performance of Drought Indices in Assessing Rice Yield in North Korea and South Korea under the Different Agricultural Systems

1
Department of Applied Artificial Intelligence, Seoul National University of Science and Technology, Seoul 01811, Republic of Korea
2
School of Urban and Environmental Engineering, Ulsan National Institute of Science and Technology, Ulsan 44919, Republic of Korea
3
Satellite Application Division, Korea Aerospace Research Institute (KARI), Daejeon 59571, Republic of Korea
4
Department of Environmental Atmospheric Sciences, Pukyong National University, Busan 48513, Republic of Korea
5
Center for Ocean-Land-Atmosphere Studies, George Mason University, Fairfax, VA 22030, USA
*
Author to whom correspondence should be addressed.
Remote Sens. 2022, 14(23), 6161; https://doi.org/10.3390/rs14236161
Submission received: 22 November 2022 / Accepted: 25 November 2022 / Published: 5 December 2022
(This article belongs to the Special Issue Monitoring Environmental Changes by Remote Sensing)

Abstract

:
Drought affects a region’s economy intensively and its severity is based on the level of infrastructure present in the affected region. Therefore, it is important not only to reflect on the conventional environmental properties of drought, but also on the infrastructure of the target region for adequate assessment and mitigation. Various drought indices are available to interpret the distinctive meteorological, agricultural, and hydrological characteristics of droughts. However, these drought indices do not consider the effective assessment of damage of drought impact. In this study, we evaluated the applicability of satellite-based drought indices over North Korea and South Korea, which have substantially different agricultural infrastructure systems to understand their characteristics. We compared satellite-based drought indices to in situ-based drought indices, standardized precipitation index (SPI), and rice yield over the Korean Peninsula. Moderate resolution imaging spectroradiometer (MODIS), tropical rainfall measuring mission (TRMM), and global land data assimilation system (GLDAS) data from 2001 to 2018 were used to calculate drought indices. The correlations of the indices in terms of monitoring meteorological and agricultural droughts in rice showed opposite correlation patterns between the two countries. The difference in the prevailing agricultural systems including irrigation resulted in different impacts of drought. Vegetation condition index (VCI) and evaporative stress index (ESI) are best suited to assess agricultural drought under well-irrigated regions as in South Korea. In contrast, most of the drought indices except for temperature condition index (TCI) are suitable for regions with poor agricultural infrastructure as in North Korea.

1. Introduction

Drought is a complex environmental disaster that affects human beings worldwide. The characteristics or causes of the occurrence of drought can be divided into four types (i.e., meteorological, agricultural, hydrological, and socio-economic drought) [1]. Meteorological drought mainly occurs due to the prolonged shortage of precipitation. Agricultural drought originates from the reduced availability of soil moisture that is used for the growth of the plant. Hydrological drought is related to the deficiency of surface and sub-surface water resources such as groundwater. Finally, socio-economic drought is correlated with the failure of social infrastructure that manages water supply or management.
Regardless of the drought type, the occurrence of drought causes environmental and economic losses. However, one of the most severe damages often emerges in the agricultural sector, such as crop yield reduction. East Asia, including China, Japan, and the Korean Peninsula, is among the highest rice-producing [2] and -consuming regions of the world [3]. The frequency of drought in East Asia has increased in recent years mainly due to global warming [4,5] causing food security concerns [6]. For example, agricultural areas of Northern China suffered devastating economic losses over 40 million hectares due to drought [1]. Therefore, it is crucial to monitor drought and provide appropriate and accurate information for policymakers in a timely manner to mitigate its damage to the agricultural sector [7,8,9,10,11].
To quantify the damages from drought, an extensive effort has been made. The drought indices such as standardized precipitation index (SPI) [12], standardized precipitation evapotranspiration index (SPEI) [13], and Palmer drought severity index (PDSI) [14] are widely used in monitoring drought conditions. The calculation of those drought indices is requiring some geophysical variables such as precipitation, temperature, or evapotranspiration. In many studies or operational applications, calculation of those drought indices has been done using in situ measurement data. However, the use of ground-based drought indices is difficult in regions that do not have sufficient observation stations.
Satellite sensors provide consecutive spatiotemporal data of the globe [15,16,17], which can be used to document biophysical and environmental information including temperature, vegetation, evapotranspiration, soil moisture, and precipitation [18,19,20]. Therefore, many researchers have developed satellite-based drought indices, which were useful in monitoring its spatiotemporal characteristics [21,22,23,24,25,26]. Although the applicability of various drought indices has been validated, drought indices in terms of duration, severity, and extent of individual droughts vary [18,27]. This suggests that the drought indices reflect only those characteristics of environmental factors that are included in them. For instance, the vegetation condition index (VCI) [21] and vegetation health index (VHI) [22] are calculated based on vegetation conditions. The soil moisture condition index (SMCI) [28] and soil moisture agricultural drought index (SMADI) [29] were developed considering soil moisture. The evaporative stress index (ESI) [24] and evaporative demand drought index (EDDI) [30] focus on evapotranspiration.
Despite the variety of drought indices, the application of drought indices in the target area should be done carefully. This is because the designed purpose of drought indices and the characteristics of available infrastructures or environmental conditions in the target area may differ. Jiao et al. [27] showed that precipitation condition index (PCI) performed better for meteorological drought (1-month time scale SPI; SPI-1) in the eastern part of the contiguous United States, which is more humid than the western part. SMCI overestimated the severity of drought compared to United States Drought Monitor (USDM) [18], while VHI underestimated that in July 2011 and 2012. Zhang et al. [18] suggested that the choice of single condition indices (SCIs) to develop combined condition indices (CCIs) is an important factor that affects the performance of a drought index. Recently, Son et al. [31] developed a correlation coefficient-based combination of multiple drought indices called vector projection index of drought (VPID) to enable reflect various drought factors at once. In the paper, VPID not only reflected multiple drought indicators well but also showed a close relationship with the crop yield statistics.
The damage caused by agricultural drought in each country is determined by the degree of meteorological drought and the agricultural infrastructure that helps in mitigating its impact [32]. However, previous studies have not adequately dealt with these issues. Most researchers have focused on selecting optimal drought indices that can properly reflect the characteristics of the target region (e.g., climate). Therefore, an in-depth discussion on developing drought indices that can consider meteorological and agricultural infrastructure characteristics is required. From this perspective, North Korea and South Korea are suitable for a sensitivity analysis based on each of the drought indices as both have similar climatic conditions, but differing agricultural facilities and farming systems [32,33]. Drought monitoring over North Korea and South Korea was conducted using eight satellite-based drought indices that are commonly used and easy to calculate.
This research aims to arrive at an optimal drought index for monitoring rice yield in the Korean peninsula. The spatial extent and intensity inferred by drought indices for North Korea and South Korea were analyzed. The remaining part of this paper is as follows. In Section 2, a detailed descriptions of study area and data which were used in the calculation of drought indices and analysis were provided. Section 3 provides comparison between satellite-based drought indices and precipitation-based drought indices to find optimal drought indices for South and North Korea. Finally, in Section 4, we summarized our study with the detailed discussion of drought indices with available infrastructure of target area.

2. Study Area and Methods

2.1. North and South Korea

The study area comprises of North Korea and South Korea with the spatial extent lying within 34°N–43°N and 124.5°E–131°E. Forests (57.4%) and croplands (35.1%) are dominant land cover types in the region. The region enjoys four distinct seasons with the growing season from May to October. Annual precipitation is concentrated during the Asian monsoon (June to July). The annual mean temperature and precipitation experienced by North Korea are 10.7 °C and 596.3 mm, and by South Korea are 14.2 °C and 1196.4 mm, respectively [34].
Rice is one of the major food crops in both the countries (88% and 46.6% of total crop production in South Korea and North Korea, respectively) (Statistics Korea 2018). There is a significant difference in rice yield (i.e., crop production per cultivated area of crops; kg/ha) between North Korea and South Korea. Rice yield in South Korea was 4591.90 (kg/ha) and in North Korea it was 3838.87 (kg/ha) in 2017 (Statistics Korea 2018). Although both countries have similar climatic conditions, they have different levels of artificial controls in terms of irrigation facilities, reservoirs, and management systems [32]. South Korea has better developed agricultural infrastructure (17,516 reservoirs and 117,457 irrigation canals) than that of North Korea (1910 reservoirs and 51,400 irrigation canals) [32].

2.2. Study Methods

This study was conducted using drought indices that are based on satellite data and land surface model (LSM) outputs. Moderate resolution imaging spectroradiometer (MODIS) provides various drought related biophysical and environmental products obtained from. The GLDAS was designed to deliver global LSM outputs, which preserve the consistency of long-term climatology using in situ observation-based forcing data [35]. In this study, four MODIS products, tropical rainfall measuring mission (TRMM) precipitation, and GLDAS soil moisture were used to calculate drought indices (Table 1). This study was conducted using 1-km drought indices with a monthly temporal resolution. Since the satellite and reanalysis data have different temporal and spatial resolutions (Table 1), they were converted into monthly data considering the number of days used in a month or they were resampled to 1 km to match the spatial resolution using the nearest neighbor method. To investigate the relationship between drought indices and rice yields, all datasets were aggregated at the administrative level (si, gun, and gu). This is because the rice yield data provided were at the administrative level. Only pixels that are labeled as cropland in land cover were included in the datasets; all other pixels were excluded. TRMM data were gathered from March to October for the study years of 2001–2018, while other data were obtained from June to October (Table 1). Drought indices were calculated using accumulated precipitation over three months to reflect the time lags between vegetation and precipitation [36].
To identify the characteristics of drought related to the different infrastructures of North Korea and South Korea, both single- and multi-variable-based drought indices were used. The VCI [36], temperature condition index (TCI) [21], SMCI [28], and PCI [23] were calculated using the normalized difference vegetation index (NDVI), land surface temperature (LST), soil moisture, and precipitation (3-month accumulated), respectively. As discussed in Park et al. [34], indices calculated by normalization can represent the relative status of each region (pixel). The maximum and minimum values of each region (pixel) during the study period (2001 to 2018) were used for normalization (0 represents dryness and 1 means wetness) to consider the environmental potential (the driest or wettest). The VHI [22] is a weighted sum of VCI and TCI that reflect temperature and vegetation conditions. The scaled drought condition index (SDCI) [23] and microwave integrated drought index (MIDI) [28] were calculated using multi-sensor composition. The TCI, VCI, PCI, and SMCI were composed to produce SDCI and MIDI. The ESI [24] is based on the standardized anomaly of the ratio between the actual and potential evapotranspiration. The categories of drought indices were classified by matching with the drought categories given in the United States Drought Monitor (USDM) as follows: D4: 0.0 to <0.1, D3: 0.1 to <0.2, D2: 0.2 to <0.3, D1: 0.3 to <0.4, D0: 0.4 to <0.5, No Drought: 0.5 to ≤1 for condition index; and D4: <−2.5, D3: −2.5 to <−2.0, D2: −2.0 to −1.5, D1: −1.5 to <−1.0, D0: −1.0 to <−0.5, No Drought: −0.5 to ≤3 for ESI (refer to Figure 3).
SPI is the representative meteorological drought index. In this study, SPI was used as the reference for monitoring meteorological drought. SPIs from 61 observation stations (48 stations in South Korea and 13 stations in North Korea) were calculated using station-based monthly precipitation data for 30 years (Table 1). Multi-timescale SPIs (1-, 3-, 6-, and 9-month periods) were employed in this study. Our goal is to identify the characteristics of drought indices under different agricultural systems. Firstly, eight drought indices were compared with SPI to validate the usefulness of drought indices to evaluate meteorological drought. The monthly patterns of the relationship between eight drought indices (averaged over cropland) and rice yield were analyzed considering spatial variability. The spatial distribution of drought indices under the different agricultural systems in North Korea and South Korea were compared during the severe drought period of July 2015.

3. Results and Discussion

The relationships between drought indices and 1-month to 9-month SPIs were examined. Table 2 shows the mean value of the correlation coefficients between SPIs from 61 observation stations and the averaged drought indices over cropland in the 61 administrative districts in which the stations are located. Most of the drought indices showed higher correlation coefficient values in South Korea compared to North Korea except for VCI. The relationships between VCI to SPIs are positive in North Korea, while they are negative in South Korea. The evolution from meteorological drought to agricultural drought seems difficult in South Korea. VHI, which includes VCI and TCI, worked better in North Korea than in South Korea. Both VCI and TCI monitored meteorological drought well using different aspects (vegetation and temperature) in North Korea indicating that VHI had a synergetic effect. However, VHI was not useful in monitoring meteorological drought in South Korea due to the contrasting performances of VCI and TCI. SDCI, PCI, and SMCI including meteorological factors such as precipitation and soil moisture were highly correlated to the SPIs in both North Korea and South Korea. As expected, PCI produced the highest correlation coefficient values, especially in South Korea because SPI is based on precipitation. The drought indices VHI and SMCI showed moderately increased correlation coefficient values when they were combined with PCI (SDCI and MIDI). MIDI combined with SMCI, PCI, and TCI showed the best performance because of the synergetic effect from the meteorological components. The drought indices agreed better with the 6- and 9-month period SPIs than that of the other SPIs in the Korean Peninsula.
Figure 1 shows the boxplot of the monthly correlation coefficients between SPIs from 61 stations and PCI/VCI averaged over cropland. The monthly patterns were analyzed from July to October because transplanting was conducted in June (paddy is flooded) [33]. There is a notable difference between North Korea and South Korea in Figure 1. Both VCI and PCI show the same correlation patterns in North Korea, while the patterns are opposite in South Korea. As mentioned above, PCI has positive relationships with SPIs in both North Korea and South Korea whereas VCI has negative relationships with SPIs in South Korea. Although both PCI and SPI were calculated using precipitation, the correlations with SPIs were not as high as expected because of the normalizing approaches, data source, and different periods. PCI, which is based on the TRMM satellite data, was calculated using maximum and minimum values [23] of the data during the 18-year study period, while SPI based on station data was calculated using standardization [12] of the 30-year data. The relations of PCI to SPIs are higher in South Korea than in North Korea, and the boxplot also illustrates that the difference is more during the rainy season (July to August). In addition, the range of the correlation coefficients are bigger in North Korea than in South Korea because of the high variation at each station due to reliability. Normal data acquisition from the station-based precipitation data is ~90% in North Korea and ~99% in South Korea (KMA; http://data.kma.go.kr, accessed on 1 November 2022). The correlation coefficient values of the 6-month SPI were relatively high, while the values of the 1-month SPI were relatively low because PCI was calculated by accumulating 3-month precipitation, and VI reflects the time lag between precipitation and vegetation responses [36,37]. VCI and SPIs show the most definite relationship during the harvesting season (September).
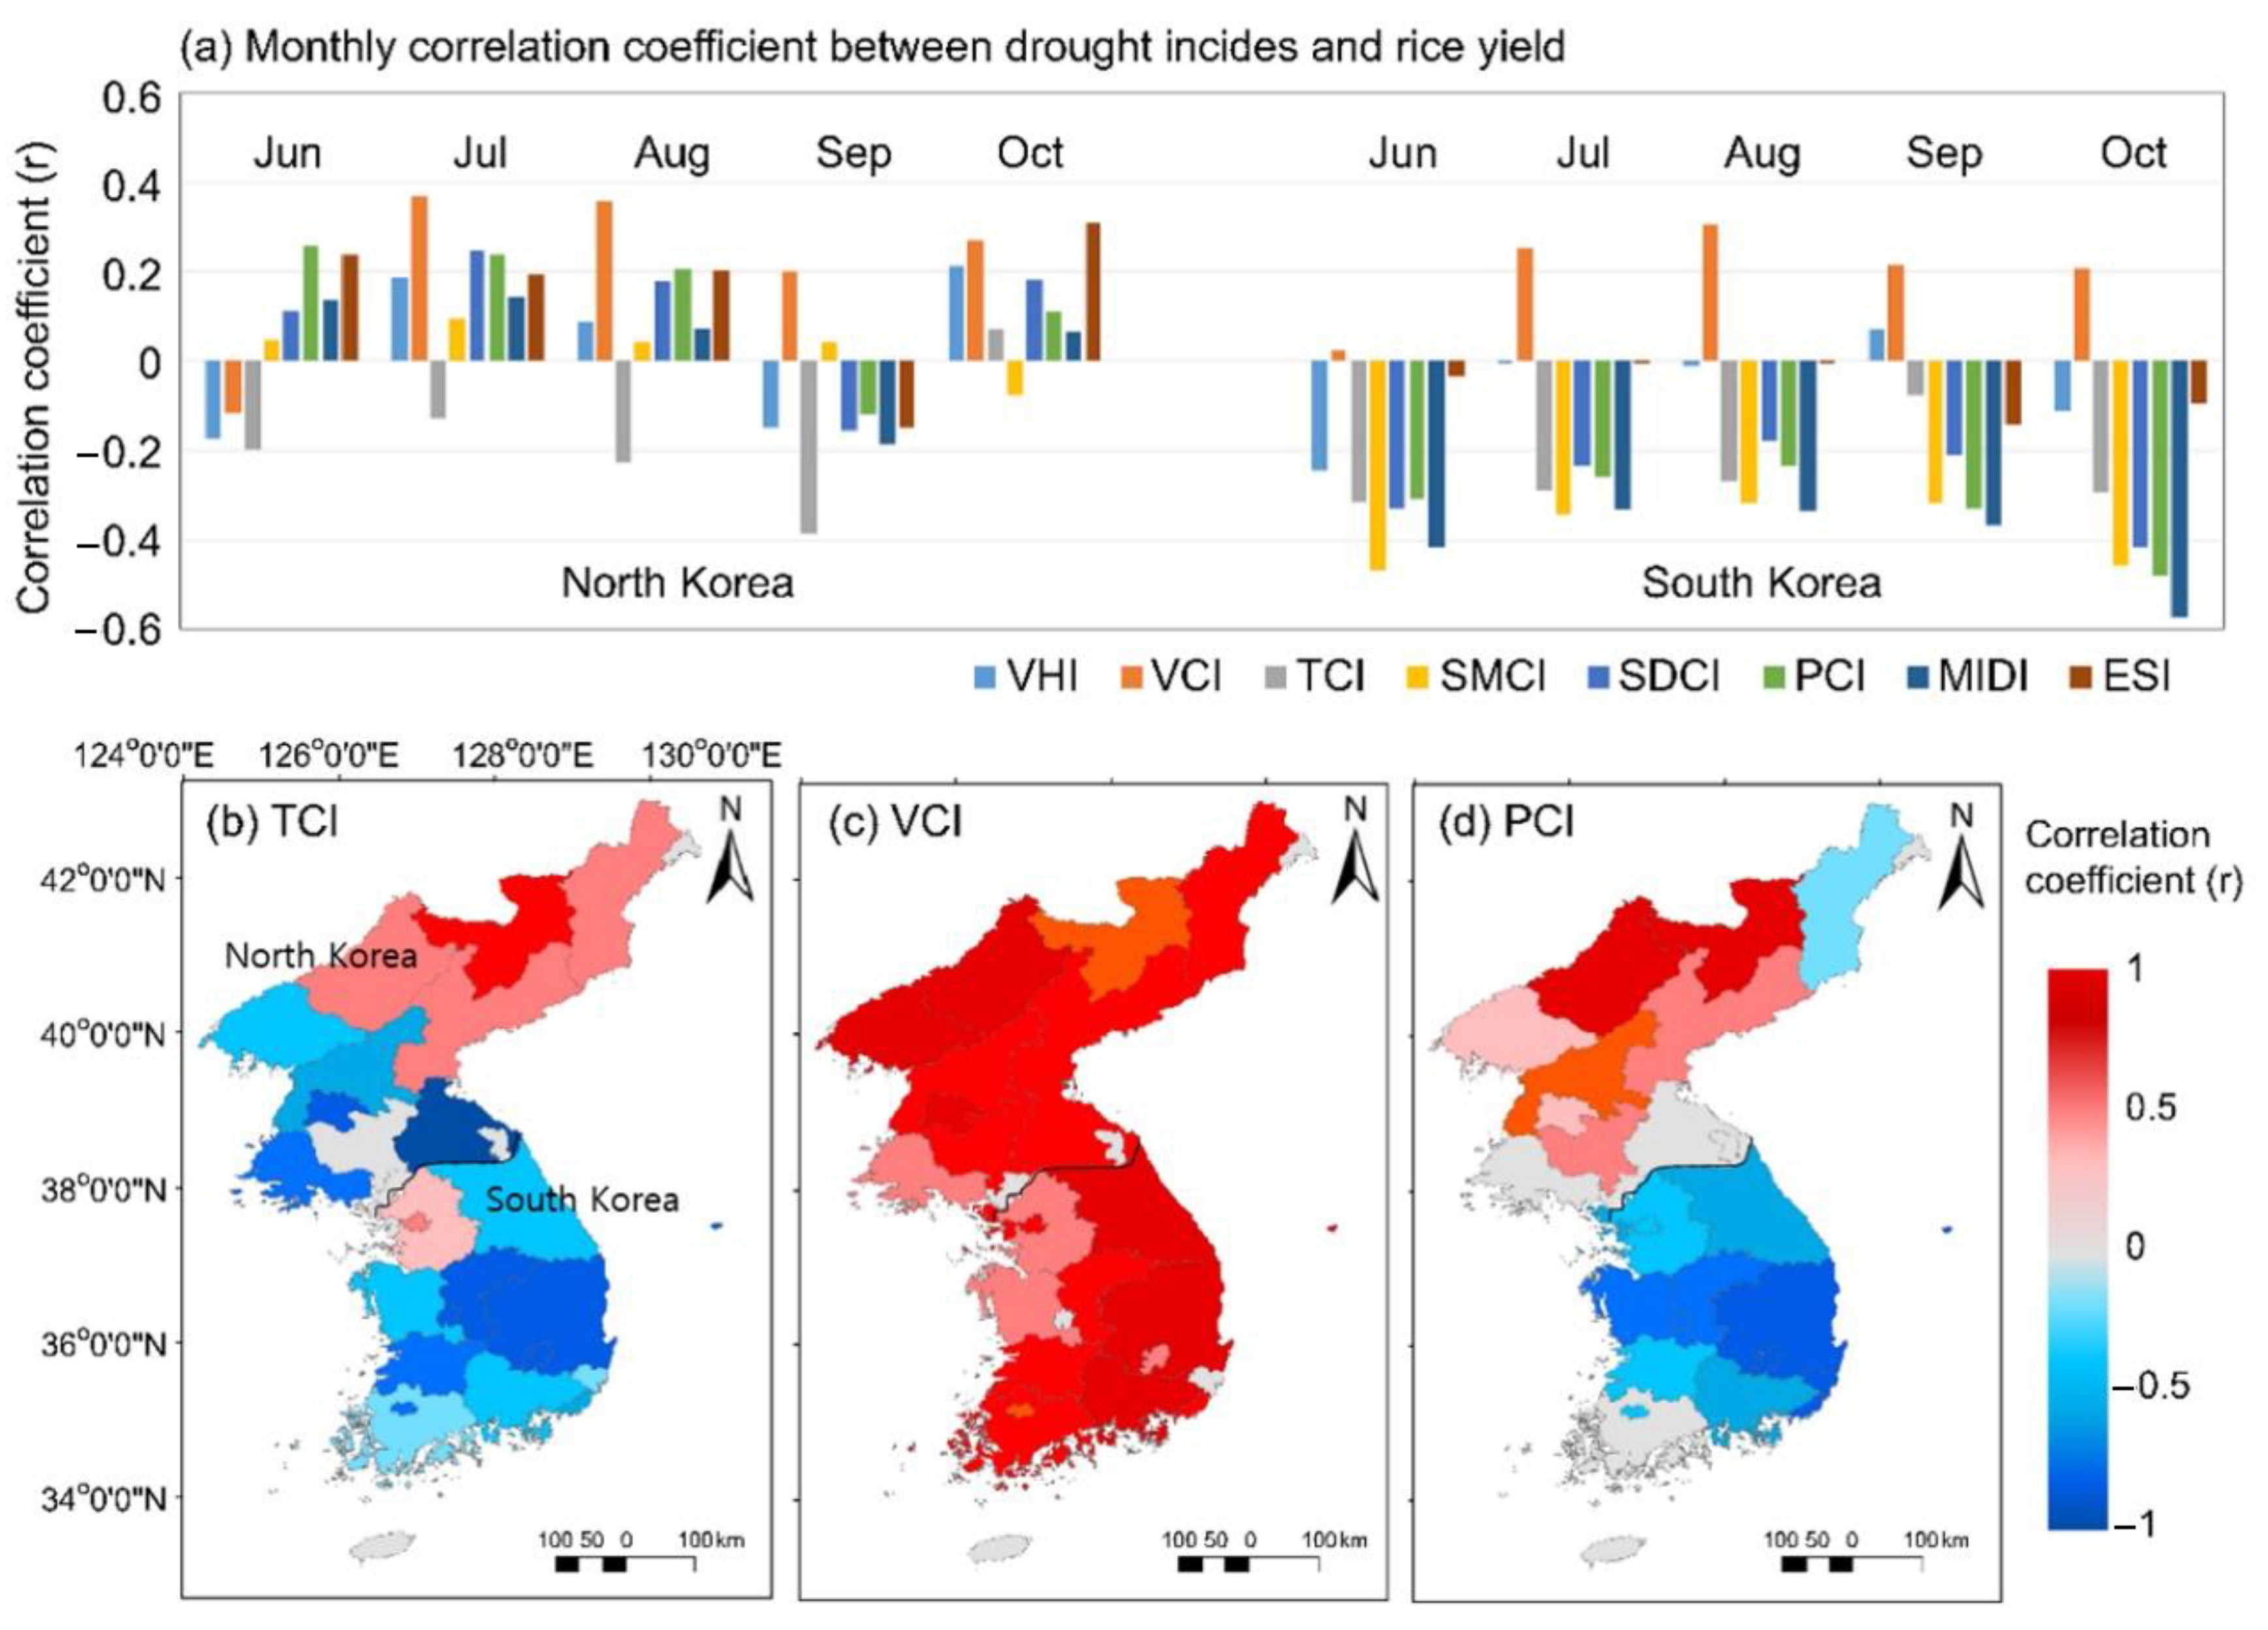
Figure 2 shows the correlation coefficients between rice yield and each of the drought indices from 2001 to 2018 using bar graphs (Figure 2a) and correlation maps of TCI (b), VCI (c), and PCI (d) for rice yield to evaluate the performance of drought indices in North Korea and South Korea. These three indices show marked differences depending on their characteristics. Figure 2a shows that the drought indices except TCI have a positive correlation with rice yield in North Korea, while only VCI shows a positive correlation with rice yields in South Korea. VCI showed the highest correlation with rice yield in both North Korea and South Korea for each month. The temporal patterns of the correlations of drought indices reflected the growth of rice. VCI shows the lowest correlation coefficient during the transplanting season (June) due to flooded paddy. VCIs are predominantly high in the tillering to flowering stage (July and August). On the other hand, TCI, which was widely used to monitor agricultural droughts in previous studies [32,38,39,40,41], showed a low correlation with rice yields. The precipitation-based drought index, PCI, reflects only spontaneous water supply; it is suitable for monitoring agricultural drought in rice in North Korea and not in South Korea. In Figure 2b–d, the spatial patterns of North Korea and South Korea with respect to drought indices such as TCI, VCI, and PCI are clearly established. Rice yield in North Korea is related to PCI, VCI, and ESI but not TCI, while only VCI has a valid relationship with rice yield in South Korea. It is considered that VCI is a good indicator for monitoring rice yield throughout the Korean Peninsula as shown in Figure 2c because it can explain the condition of rice growth accurately.
VCI can effectively assess the damage to vegetation caused by low precipitation and high temperature during a drought [21,39]. VCI also indirectly showed the difference in the irrigation systems of North Korea and South Korea. In the case of South Korea, meteorological drought caused by precipitation deficiency does less damage in terms of agricultural drought in rice yield because of the adequate irrigation facilities [32]. This implies that drought due to water shortage can be effectively alleviated through agricultural infrastructure systems. Therefore, it implies that South Korea exercises more artificial controls including irrigation, which makes it more resilient to stress from drought than North Korea. VCI represented the highest correlation coefficient with rice yield in both North Korea and South Korea (Figure 2). The correlation coefficient of VCI to rice yield had a temporal pattern due to the phenological sensitivity of its vegetation to soil moisture conditions [22,42]. As discussed in previous studies, the flowering season is vulnerable to drought, and it is important for the determination of crop yield [23,37]. TCI did not monitor agricultural drought in rice well in both North Korea and South Korea, although it monitored meteorological drought well as discussed in Ryu et al. 2019 [32]. This is because rice production tends to increase under high solar radiation [32,43]. Solar radiation is high under drought conditions with low precipitation and high temperature [44,45,46,47]. Although heat stress due to high temperature affects crop yield [34,48], it is considered that the effect of solar radiation is bigger than heat stress. Although high temperature is associated with decrease in crop yields [49], TCI was not useful in diagnosing agricultural drought in rice due to other influences such as solar radiation in both North Korea and South Korea.
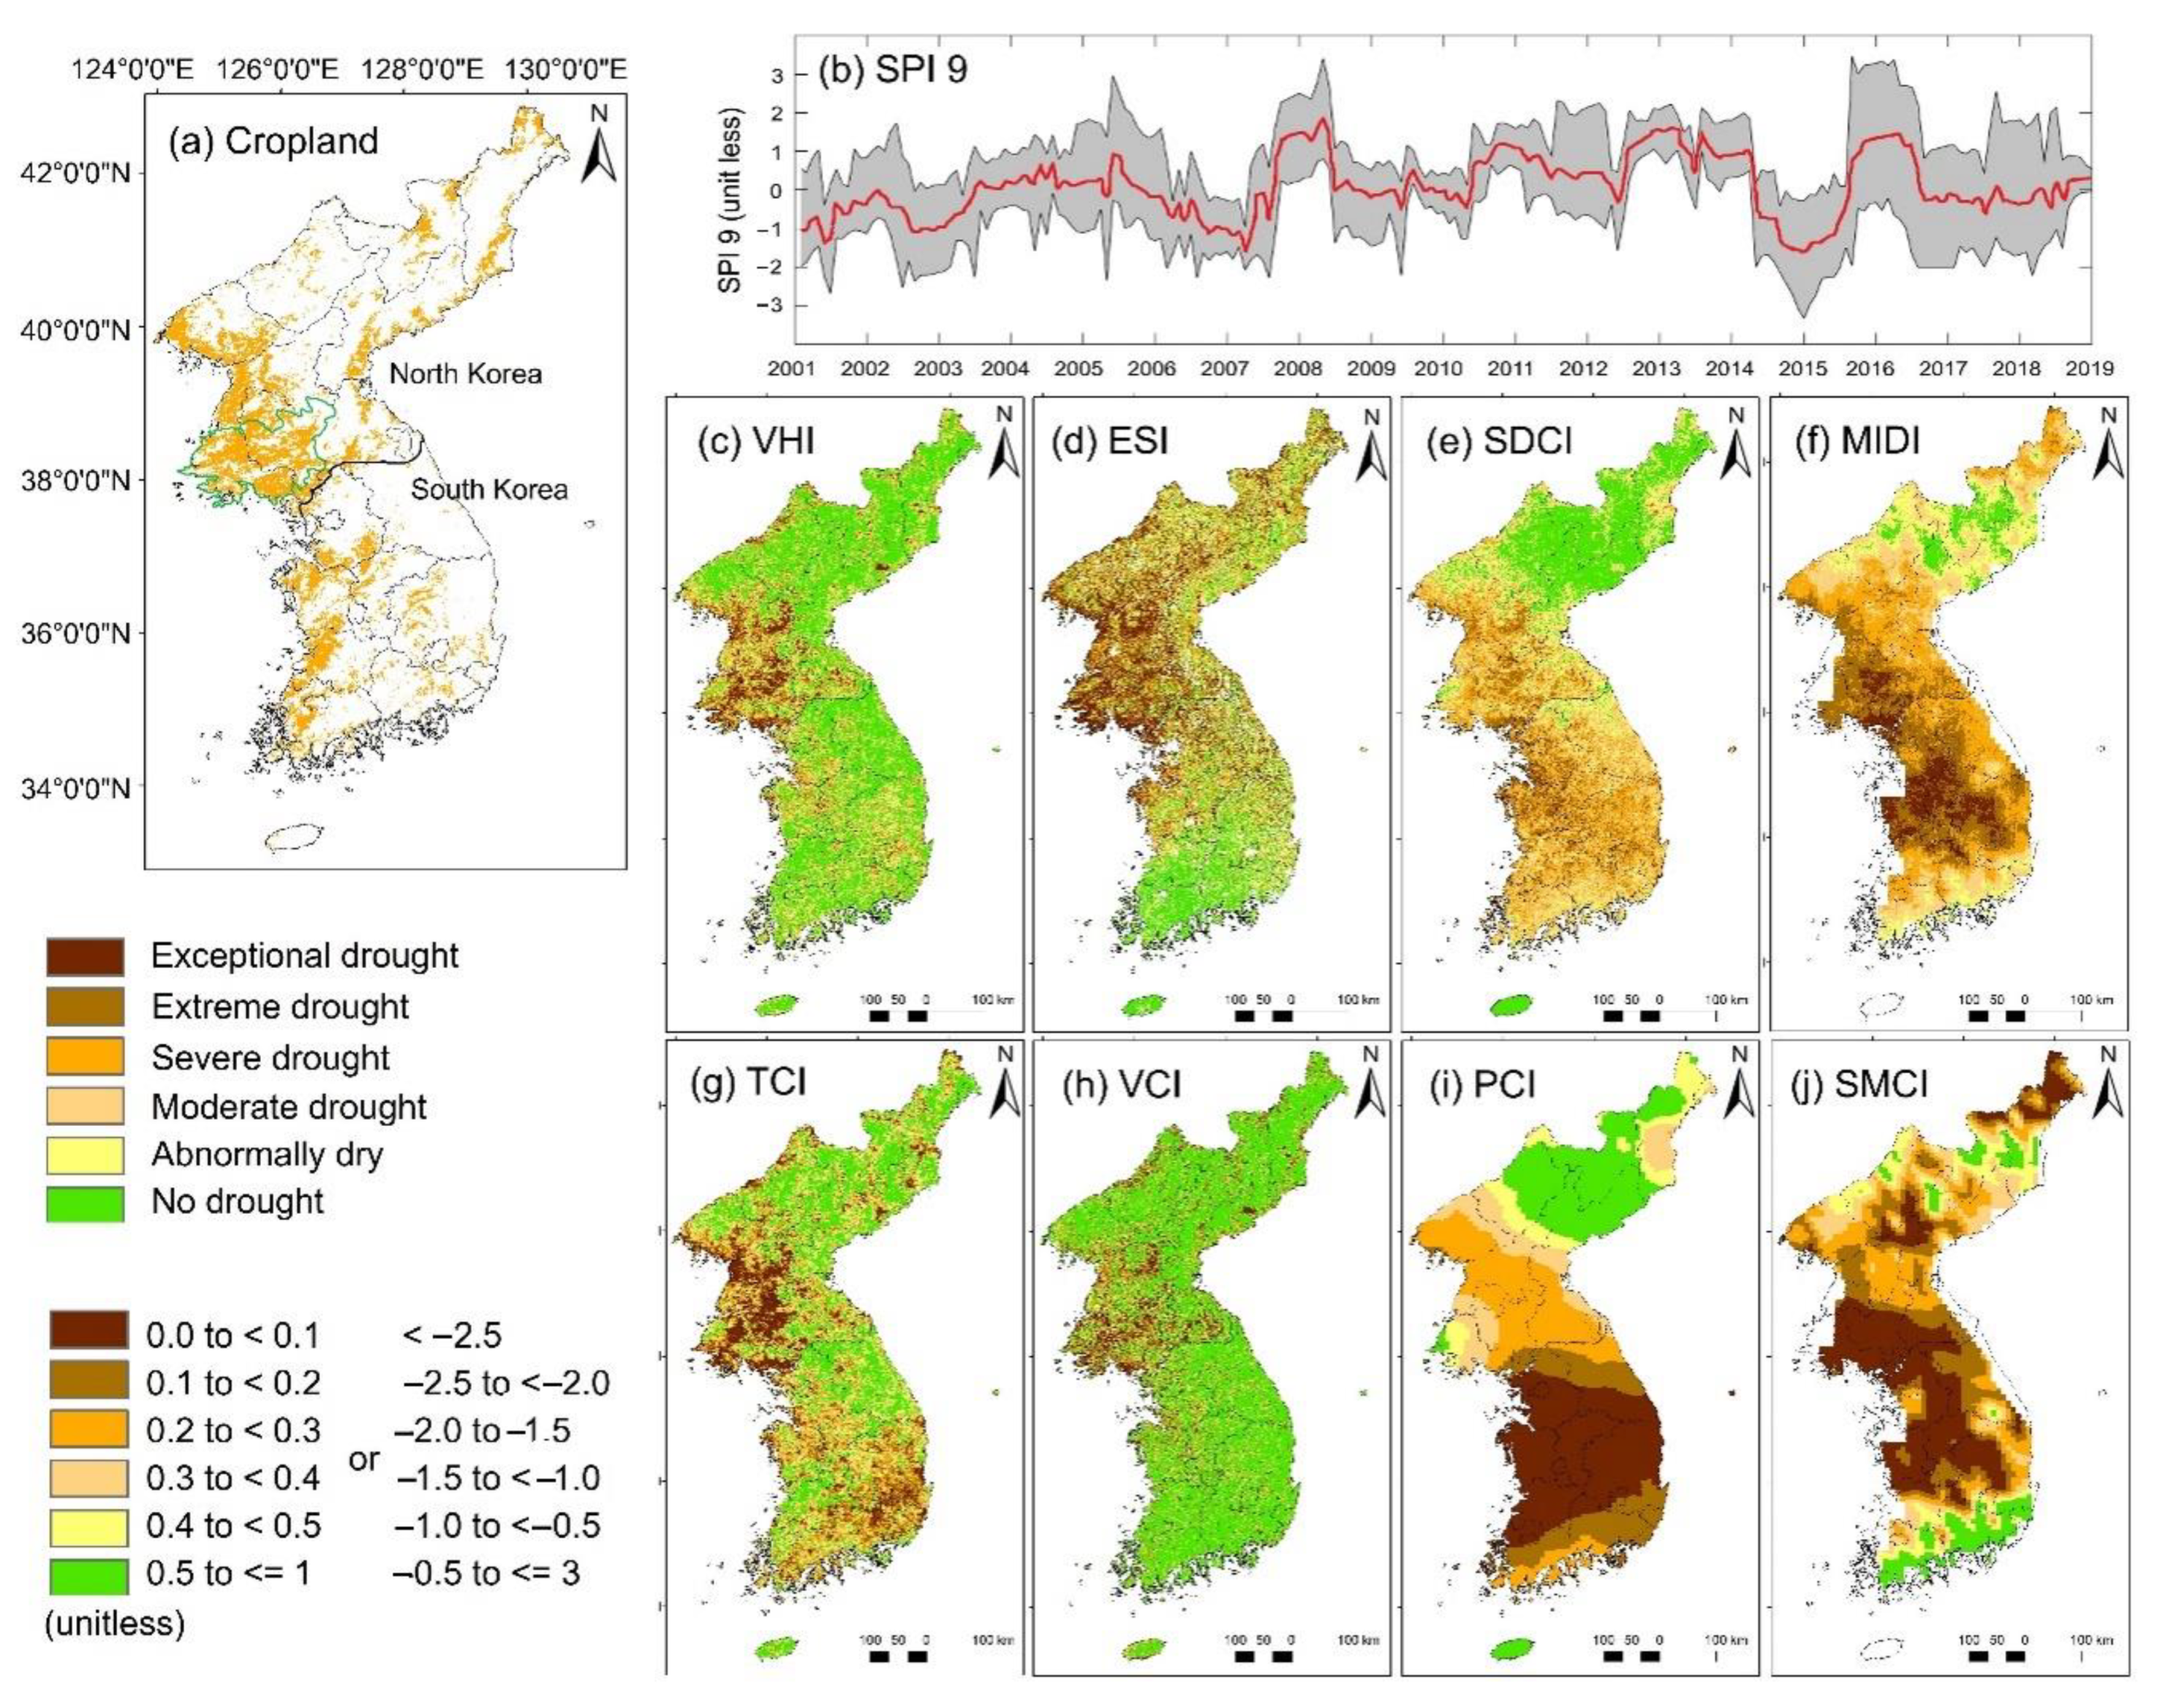
Figure 3 shows the spatial features of the drought indices in 2015, which was the most severe drought period based on the long-term variation of SPI 9 shown in Figure 3b. The drought indices based on the variables of precipitation, soil moisture, and temperature such as PCI, SMCI, SDCI, and MIDI indicate that most of the cropland on the Korean peninsula suffered from severe drought. In particular, the deficiency of precipitation was more serious in South Korea than in North Korea as shown in Figure 3i. TCI shows severe drought in both North Korea and South Korea, while VCI shows severe drought only in North Korea. ESI and SMCI represent soil moisture. Although the shortage of water supply due to high temperature and low precipitation is similar, the vegetation stress is more severe in North Korea than in South Korea. As per commodity intelligence reports (CIR) reported by UDSA, North and South Hwanghae provinces in North Korea (green line in Figure 3a) account for 34% of the total paddy rice crop area that is most affected by drought (80% and 58% of paddy rice crop area in 2015, respectively). As a result, the production of rice yield decreased by ~27% in the provinces. However, significant reduction in rice yields in South Korea was not witnessed in 2015 when compared to other years, suggesting that the effects of meteorological drought on rice yield were not serious in 2015. The rice yield is stable in South Korea. The standard deviations of rice yields from 2001 to 2018 on average are ~5% in South Korea and ~20% in North Korea. These results corroborate the inferences made from Figure 3, and effectively describe the spatial status of rice yield in response to VCI in both North Korea and South Korea.

4. Conclusions

Various drought indices were computed, compared, and validated to analyze their performances in terms of monitoring drought in different agricultural systems present in North Korea and South Korea and to suggest an appropriate drought index for the Korean Peninsula. This study identified the factors that are useful for the interpretation of drought severity considering regional characteristics including agricultural systems. The relationship between drought indices and SPIs were identified in the cropland area. Most indices showed positive relationships in both North Korea and South Korea, while only VCI in South Korea showed a negative relationship. This study focused on analyzing the effect of drought indices to monitor rice yield, and VCI showed the best performance. However, it is likely that other indices may work well for other crops (corn, soybean, etc.). Many studies have suggested the use of combining various drought indicators as more useful than the use of a single drought indicator due to the complexity of drought [7,37]. Many blending approaches have been developed [10,23,50]. Combined indices such as SDCI, MIDI, and VHI reflect characteristics of each component. In meteorological drought, blended hybrid indices including VHI, MIDI, and SDCI performed better than a single indicator in North Korea. However, the performance of hybrid indices decreased when they were blended with VCI in South Korea because agricultural infrastructure systems prevent a meteorological drought from propagating to an agricultural drought. MIDI was developed by blending meteorological indicators such as precipitation, temperature, and soil moisture, and it is the most useful index for monitoring meteorological drought in both North Korea and South Korea. The blended indices including VCI and excluding TCI performed well in monitoring agricultural drought in rice. Since meteorological indictors are not useful in an irrigated region to monitor agricultural drought, blended hybrid indices showed poor results in South Korea. Therefore, it is better to use a vegetation-related drought index that directly assesses the condition of rice. Thus, future studies shall consider hydrological factors such as dams, stream flow conditions, and area of reservoirs while assessing an irrigated region [51,52]. The 3-month and 6-month SPIs were normally used for monitoring agricultural drought [53]. However, drought indices worked differently as shown in Table 2 and Figure 2. Therefore, the characteristics of drought indices and the target region (e.g., crop types, infrastructures) should be considered to develop an adequate drought index in further studies.

Author Contributions

Conceptualization, S.P. and J.Y.; formal analysis, S.P., J.Y. and J.L.; investigation, S.P., J.Y., J.L. and E.S.; methodology, S.P., J.Y. and J.I.; supervision, J.Y.; writing—original draft, S.P. and J.Y.; funding acquisition, S.P. All authors have read and agreed to the published version of the manuscript.

Funding

This work was supported by Seoul National University of Science and Technology.

Data Availability Statement

MODIS products including 8-day LST (MOD11A2), monthly NDVI (MOD13A3), 8-day evapotranspiration (MOD16A2), and land cover (MCD12Q1), TRMM 3B43 monthly precipitation data, and version 2.1 Noah LSM surface (0~10cm) soil moisture data (kg/m2) are freely available at NASA EARTHDATA (https://search.earthdata.nasa.gov/, accessed on 1 November 2022). Monthly precipitation data from all 61 stations (48 stations in South Korea and 13 stations from North Korea) were obtained from the Korea Meteorological Administration (KMA). Rice yield data were obtained from official references including food and agricultural organization (FAO) and the United States Department of Agriculture (USDA, https://www.fas.usda.gov, accessed on 1 November 2022) reports, while for South Korea, observed rice yield was mainly obtained from Korean Statistical Information Service (KOSIS, http://kosis.kr, accessed on 1 November 2022).

Conflicts of Interest

The authors declare no conflict of interest.

References

  1. Mishra, A.K.; Singh, V.P. A review of drought concepts. J. Hydrol. 2010, 391, 202–216. [Google Scholar] [CrossRef]
  2. Maclean, J.L.; Dawe, D.C.; Hettel, G.P. Rice Almanac: Source Book for the Most Important Economic Activity on Earth; International Rice Research Institute: Los Banos, Laguna, 2002. [Google Scholar]
  3. Abdullah, A.B.; Ito, S.; Adhana, K. Estimate of rice consumption in Asian countries and the world towards 2050. In Proceedings of the Workshop and Conference on Rice in the World at Stake, Los Banos, Philippines, 31 March–3 April 2006; pp. 28–43. [Google Scholar]
  4. Spinoni, J.; Barbosa, P.; De Jager, A.; McCormick, N.; Naumann, G.; Vogt, J.V.; Magni, D.; Masante, D.; Mazzeschi, M. A new global database of meteorological drought events from 1951 to 2016. J. Hydrol. Reg. Stud. 2019, 22, 100593. [Google Scholar] [CrossRef] [PubMed]
  5. Zhang, L.; Zhou, T. Drought over East Asia: A review. J. Clim. 2015, 28, 3375–3399. [Google Scholar] [CrossRef]
  6. Matiu, M.; Ankerst, D.P.; Menzel, A. Interactions between temperature and drought in global and regional crop yield variability during 1961–2014. PLoS ONE 2017, 12, e0178339. [Google Scholar] [CrossRef] [PubMed] [Green Version]
  7. Wardlow, B.D.; Anderson, M.C.; Verdin, J.P. Remote Sensing of Drought: Innovative Monitoring Approaches; CRC Press: Boca Raton, FL, USA, 2012. [Google Scholar]
  8. Gao, Z.; Wang, Q.; Cao, X.; Gao, W. The responses of vegetation water content (EWT) and assessment of drought monitoring along a coastal region using remote sensing. GIScience Remote Sens. 2014, 51, 1–16. [Google Scholar] [CrossRef]
  9. Feng, P.; Wang, B.; Li, D.; Yu, Q. Machine learning-based integration of remotely-sensed drought factors can improve the estimation of agricultural drought in South-Eastern Australia. Agric. Syst. 2019, 173, 303–316. [Google Scholar] [CrossRef]
  10. Bayissa, Y.A.; Tadesse, T.; Svoboda, M.; Wardlow, B.; Poulsen, C.; Swigart, J.; Van Andel, S.J. Developing a satellite-based combined drought indicator to monitor agricultural drought: A case study for Ethiopia. GIScience Remote Sens. 2019, 56, 718–748. [Google Scholar] [CrossRef]
  11. Bhuiyan, C.; Saha, A.K.; Bandyopadhyay, N.; Kogan, F.N. Analyzing the impact of thermal stress on vegetation health and agricultural drought–a case study from Gujarat, India. GIScience Remote Sens. 2017, 54, 678–699. [Google Scholar] [CrossRef]
  12. McKee, T.B.; Doesken, N.J.; Kleist, J. The relationship of drought frequency and duration to time scales. In Proceedings of the 8th Conference on Applied Climatology, Anaheim, CA, USA, 17–22 January 1993; pp. 179–183. [Google Scholar]
  13. Vicente-Serrano, S.M.; Beguería, S.; López-Moreno, J.I. A multiscalar drought index sensitive to global warming: The standardized precipitation evapotranspiration index. J. Clim. 2010, 23, 1696–1718. [Google Scholar] [CrossRef] [Green Version]
  14. Palmer, W.C. Meteorological Drought; US Department of Commerce, Weather Bureau: Washington, DC, USA, 1965; Volume 30. [Google Scholar]
  15. Park, E.; Jo, H.W.; Lee, W.K.; Lee, S.; Song, C.; Lee, H.; Kim, T.H. Development of earth observational diagnostic drought prediction model for regional error calibration: A case study on agricultural drought in Kyrgyzstan. GIScience Remote Sens. 2022, 59, 36–53. [Google Scholar] [CrossRef]
  16. Ghazaryan, G.; Dubovyk, O.; Graw, V.; Kussul, N.; Schellberg, J. Local-scale agricultural drought monitoring with satellite-based multi-sensor time-series. GIScience Remote Sens. 2020, 57, 704–718. [Google Scholar] [CrossRef]
  17. Zhang, L.; Jiao, W.; Zhang, H.; Huang, C.; Tong, Q. Studying drought phenomena in the Continental United States in 2011 and 2012 using various drought indices. Remote Sens. Environ. 2017, 190, 96–106. [Google Scholar] [CrossRef]
  18. Padhee, S.K.; Nikam, B.R.; Dutta, S.; Aggarwal, S.P. Using satellite-based soil moisture to detect and monitor spatiotemporal traces of agricultural drought over Bundelkhand region of India. GIScience Remote Sens. 2017, 54, 144–166. [Google Scholar] [CrossRef]
  19. Mishra, A.K.; Singh, V.P. Drought modeling–A review. J. Hydrol. 2011, 403, 157–175. [Google Scholar] [CrossRef]
  20. Seo, E.; Dirmeyer, P.A. Improving the ESA CCI Daily Soil Moisture Time Series with Physically Based Land Surface Model Datasets Using a Fourier Time-Filtering Method. J. Hydrometeorol. 2022, 23, 473–489. [Google Scholar] [CrossRef]
  21. Kogan, F.N. Application of vegetation index and brightness temperature for drought detection. Adv. Space Res. 1995, 15, 91–100. [Google Scholar] [CrossRef]
  22. Kogan, F.N. Global drought watch from space. Bull. Am. Meteorol. Soc. 1997, 78, 621–636. [Google Scholar] [CrossRef]
  23. Rhee, J.; Im, J.; Carbone, G.J. Monitoring agricultural drought for arid and humid regions using multi-sensor remote sensing data. Remote Sens. Environ. 2010, 114, 2875–2887. [Google Scholar] [CrossRef]
  24. Anderson, M.C.; Hain, C.; Wardlow, B.; Pimstein, A.; Mecikalski, J.R.; Kustas, W.P. Evaluation of drought indices based on thermal remote sensing of evapotranspiration over the continental United States. J. Clim. 2011, 24, 2025–2044. [Google Scholar] [CrossRef]
  25. Park, S.; Seo, E.; Kang, D.; Im, J.; Lee, M.-I. Prediction of drought on pentad scale using remote sensing data and MJO index through random forest over East Asia. Remote Sens. 2018, 10, 1811. [Google Scholar] [CrossRef]
  26. Seo, E.; Lee, M.-I.; Reichle, R.H. Assimilation of SMAP and ASCAT soil moisture retrievals into the JULES land surface model using the Local Ensemble Transform Kalman Filter. Remote Sens. Environ. 2021, 253, 112222. [Google Scholar] [CrossRef]
  27. Jiao, W.; Tian, C.; Chang, Q.; Novick, K.A.; Wang, L. A new multi-sensor integrated index for drought monitoring. Agric. For. Meteorol. 2019, 268, 74–85. [Google Scholar] [CrossRef] [Green Version]
  28. Zhang, A.; Jia, G. Monitoring meteorological drought in semiarid regions using multi-sensor microwave remote sensing data. Remote Sens. Environ. 2013, 134, 12–23. [Google Scholar] [CrossRef]
  29. Sánchez, N.; González-Zamora, Á.; Piles, M.; Martínez-Fernández, J. A new Soil Moisture Agricultural Drought Index (SMADI) integrating MODIS and SMOS products: A case of study over the Iberian Peninsula. Remote Sens. 2016, 8, 287. [Google Scholar] [CrossRef] [Green Version]
  30. Hobbins, M.T.; Wood, A.; McEvoy, D.J.; Huntington, J.L.; Morton, C.; Anderson, M.; Hain, C. The evaporative demand drought index. Part I: Linking drought evolution to variations in evaporative demand. J. Hydrometeorol. 2016, 17, 1745–1761. [Google Scholar] [CrossRef]
  31. Son, B.; Park, S.; Im, J.; Park, S.; Ke, Y.; Quackenbush, L.J. A new drought monitoring approach: Vector Projection Analysis (VPA). Remote Sens. Environ. 2021, 252, 112145. [Google Scholar] [CrossRef]
  32. Ryu, J.-H.; Han, K.-S.; Lee, Y.-W.; Park, N.-W.; Hong, S.; Chung, C.-Y.; Cho, J. Different agricultural responses to extreme drought events in neighboring counties of South and North Korea. Remote Sens. 2019, 11, 1773. [Google Scholar] [CrossRef] [Green Version]
  33. Yeom, J.-m.; Jeong, S.; Jeong, G.; Ng, C.T.; Deo, R.C.; Ko, J. Monitoring paddy productivity in North Korea employing geostationary satellite images integrated with GRAMI-rice model. Sci. Rep. 2018, 8, 1–15. [Google Scholar] [CrossRef] [Green Version]
  34. Park, S.; Im, J.; Park, S.; Rhee, J. Drought monitoring using high resolution soil moisture through multi-sensor satellite data fusion over the Korean peninsula. Agric. For. Meteorol. 2017, 237, 257–269. [Google Scholar] [CrossRef]
  35. Rodell, M.; Houser, P.; Jambor, U.; Gottschalck, J.; Mitchell, K.; Meng, C.-J.; Arsenault, K.; Cosgrove, B.; Radakovich, J.; Bosilovich, M. The global land data assimilation system. Bull. Am. Meteorol. Soc. 2004, 85, 381–394. [Google Scholar] [CrossRef]
  36. Chen, Z.; Wang, W.; Fu, J. Vegetation response to precipitation anomalies under different climatic and biogeographical conditions in China. Sci. Rep. 2020, 10, 1–16. [Google Scholar] [CrossRef] [PubMed] [Green Version]
  37. Park, S.; Im, J.; Jang, E.; Rhee, J. Drought assessment and monitoring through blending of multi-sensor indices using machine learning approaches for different climate regions. Agric. For. Meteorol. 2016, 216, 157–169. [Google Scholar] [CrossRef]
  38. Cao, Y.; Chen, S.; Wang, L.; Zhu, B.; Lu, T.; Yu, Y. An agricultural drought index for assessing droughts using a water balance method: A case study in Jilin Province, Northeast China. Remote Sens. 2019, 11, 1066. [Google Scholar] [CrossRef] [Green Version]
  39. Li, Z.; Han, Y.; Hao, T. Assessing the consistency of remotely sensed multiple drought indices for monitoring drought phenomena in continental China. IEEE Trans. Geosci. Remote Sens. 2020, 58, 5490–5502. [Google Scholar] [CrossRef]
  40. Siebert, S.; Ewert, F.; Rezaei, E.E.; Kage, H.; Graß, R. Impact of heat stress on crop yield—On the importance of considering canopy temperature. Environ. Res. Lett. 2014, 9, 044012. [Google Scholar] [CrossRef] [Green Version]
  41. Wang, K.; Li, T.; Wei, J. Exploring drought conditions in the Three River Headwaters Region from 2002 to 2011 using multiple drought indices. Water 2019, 11, 190. [Google Scholar] [CrossRef] [Green Version]
  42. Du, L.; Tian, Q.; Yu, T.; Meng, Q.; Jancso, T.; Udvardy, P.; Huang, Y. A comprehensive drought monitoring method integrating MODIS and TRMM data. Int. J. Appl. Earth Obs. Geoinf. 2013, 23, 245–253. [Google Scholar] [CrossRef]
  43. XING, Z.-P.; Pei, W.; Ming, Z.; Qian, H.-J.; Hu, Y.-J.; Guo, B.-W.; Wei, H.-Y.; Ke, X.; Huo, Z.-Y.; Dai, Q.-G. Temperature and solar radiation utilization of rice for yield formation with different mechanized planting methods in the lower reaches of the Yangtze River, China. J. Integr. Agric. 2017, 16, 1923–1935. [Google Scholar] [CrossRef] [Green Version]
  44. McCaskill, M.R. Prediction of solar radiation from rainday information using regionally stable coefficients. Agric. For. Meteorol. 1990, 51, 247–255. [Google Scholar] [CrossRef]
  45. Hayhoe, H.N. Relationship between weather variables in observed and WXGEN generated data series. Agric. For. Meteorol. 1998, 90, 203–214. [Google Scholar] [CrossRef]
  46. Liu, D.; Scott, B. Estimation of solar radiation in Australia from rainfall and temperature observations. Agric. For. Meteorol. 2001, 106, 41–59. [Google Scholar] [CrossRef]
  47. Seo, E.; Lee, M.-I.; Schubert, S.D.; Koster, R.D.; Kang, H.-S. Investigation of the 2016 Eurasia heat wave as an event of the recent warming. Environ. Res. Lett. 2020, 15, 114018. [Google Scholar] [CrossRef]
  48. Teixeira, E.I.; Fischer, G.; Van Velthuizen, H.; Walter, C.; Ewert, F. Global hot-spots of heat stress on agricultural crops due to climate change. Agric. For. Meteorol. 2013, 170, 206–215. [Google Scholar] [CrossRef]
  49. Vogel, E.; Donat, M.G.; Alexander, L.V.; Meinshausen, M.; Ray, D.K.; Karoly, D.; Meinshausen, N.; Frieler, K. The effects of climate extremes on global agricultural yields. Environ. Res. Lett. 2019, 14, 054010. [Google Scholar] [CrossRef]
  50. Kamali, B.; Abbaspour, K.C.; Lehmann, A.; Wehrli, B.; Yang, H. Spatial assessment of maize physical drought vulnerability in sub-Saharan Africa: Linking drought exposure with crop failure. Environ. Res. Lett. 2018, 13, 074010. [Google Scholar] [CrossRef]
  51. Abhishek; Kinouchi, T. Multidecadal Land Water and Groundwater Drought Evaluation in Peninsular India. Remote Sens. 2022, 14, 1486. [Google Scholar] [CrossRef]
  52. Kim, H.Y.; Shin, C.; Park, Y.; Moon, J. Water Resources Management in the Republic of Korea: Korea’s Challenge to Flood & Drought with Multi-Purpose Dam and Multi-Regional Water Supply System; IDB: Washington, DC, USA, 2018. [Google Scholar]
  53. Bachmair, S.; Tanguy, M.; Hannaford, J.; Stahl, K. How well do meteorological indicators represent agricultural and forest drought across Europe? Environ. Res. Lett. 2018, 13, 034042. [Google Scholar] [CrossRef]
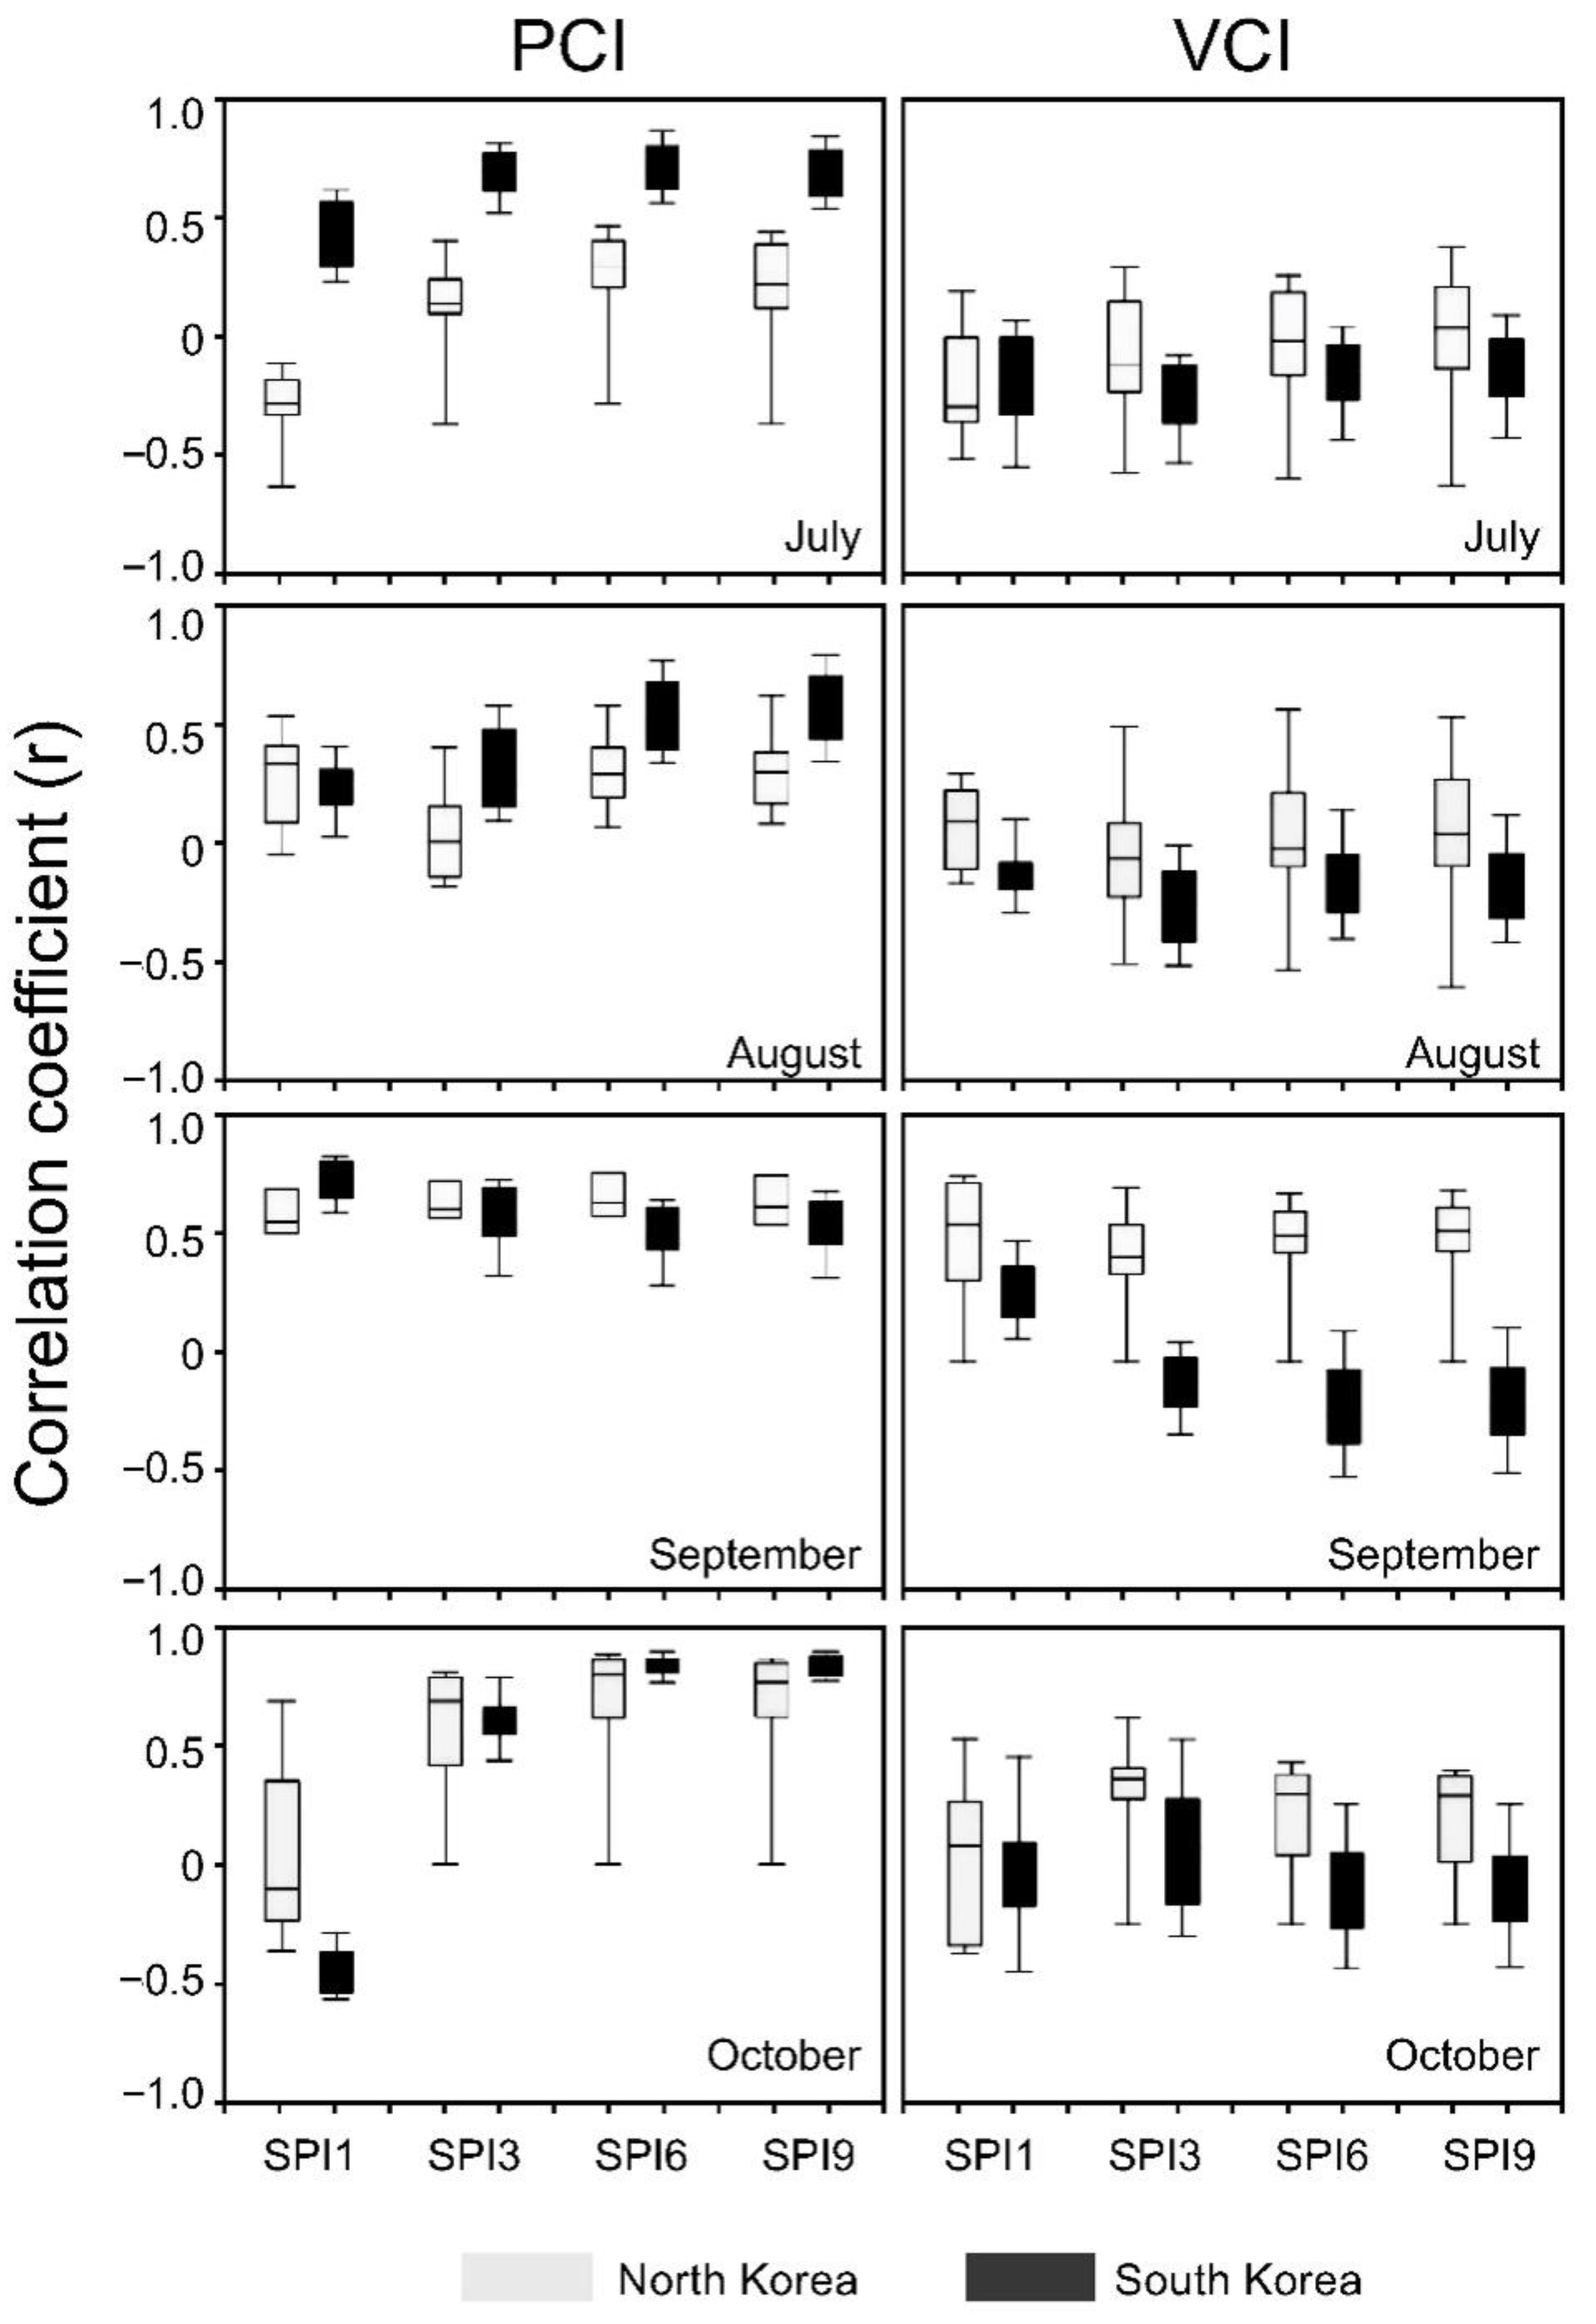
Figure 1. Boxplots of the correlation coefficients between PCI/VCI and SPIs from 61 stations.
Remotesensing 14 06161 g001
Figure 2. The correlation coefficients (r) between rice yields and each of the drought indices during the growing season over North Korea and South Korea (a). The correlation maps of TCI (b), VCI (c), and PCI (d) in July with respect to rice yield.
Remotesensing 14 06161 g002
Figure 3. Spatial distribution of drought indices over North Korea and South Korea in July 2015. (a) Spatial map of cropland from MODIS products, (b) Time series of SPI 9 from 2001 to 2018. The average of SPI 9 from 61 stations is shown by the dashed red line. Shaded lines indicate minimum and maximum range of SPI 9 from 61 stations. (cj) represent maps of each drought index.
Remotesensing 14 06161 g003
Table 1. Specification of the datasets used in this study.
DataProductTime PeriodResolution
(Spatial, Temporal)
Source
MODISLST (K)2001–2018
(May to October)
1 km, 8-dayNASA EARTHDATA
(https://search.earthdata.nasa.gov/, accessed on 1 November 2022)
NDVI1 km, Monthly
ET/PET
(mm/8-day)
500 m, 8-day
Land cover500 m, Yearly
GLDASSurface (0–10 cm)
Soil moisture
(kg/m2)
0.25°, Monthly
TRMMPrecipitation
(mm/month)
March, 2001 to October 20180.25°, Monthly
Station-based precipitationMarch, 1980 to October 2018Point, MonthlyKorea Meteorological Administration (KMA; http://data.kma.go.kr, accessed on 1 November 2022).
Rice yield (kg/ha)2001–2018YearlyFood and Agricultural Organization (FAO), United States Department of Agriculture (USDA; https://www.fas.usda.gov, accessed on 1 November 2022), and Korean Statistical Information Service (KOSIS; http://kosis.kr, accessed on 1 November 2022)
Table 2. Comparison of the correlation coefficients between various drought indices and station-based meteorological drought index (SPI). The highest correlation coefficient for each index is shown in bold.
Drought Indices1-Month SPI3-Month SPI6-Month SPI9-Month SPI
N. KoreaS. KoreaN. KoreaS. KoreaN. KoreaS. KoreaN. KoreaS. Korea
VHI0.1220.0940.2040.1510.2520.1840.2710.181
ESI0.0070.1120.0770.1670.1010.2990.0640.137
SDCI0.1200.2860.2610.4540.3480.5020.3530.458
MIDI0.1040.2910.2520.5230.3550.5600.3560.516
TCI0.0610.1060.1540.2670.2080.3010.2020.312
VCI0.1370.02570.183−0.0390.199−0.0330.230−0.077
PCI0.0900.3050.2430.5000.3360.5390.3300.496
SMCI0.0490.1820.1740.4600.2660.4720.2780.418
Publisher’s Note: MDPI stays neutral with regard to jurisdictional claims in published maps and institutional affiliations.