Article

Improved Dempster–Shafer Evidence Theory for Tunnel Water Inrush Risk Analysis Based on Fuzzy Identification Factors of Multi-Source Geophysical Data

1
Faculty of Geosciences and Environmental Engineering, Southwest Jiaotong University, Chengdu 611756, China
2
Innovation Center of Geological Survey Institute, China Railway Design Corporation, Tianjin 610081, China
3
China Railway 14TH Bureau Group Corporation Limited, Jinan 250014, China
*
Author to whom correspondence should be addressed.
Remote Sens. 2022, 14(23), 6178; https://doi.org/10.3390/rs14236178
Submission received: 23 October 2022 / Revised: 28 November 2022 / Accepted: 3 December 2022 / Published: 6 December 2022
(This article belongs to the Special Issue Multi-Data Applied to Near-Surface Geophysics)

Abstract

:
Water inrush is one of the most important risk factors in tunnel construction because of its abruptness and timeliness. Various geophysical data used in actual construction contain useful information related to groundwater development. However, the existing approaches with such data from multiple sources and sensors are generally independent and cannot integrate this information, leading to inaccurate projections. In addition, existing tunnel advanced geological forecast reports for risk projections interpreted by human operators generally contain no quantitative observations or measurements, but only consist of ambiguous and uncertain qualitative descriptions. To surmount the problems above, this paper proposes a tunnel water inrush risk analysis method by fusing multi-source geophysical observations with fuzzy identification factors. Specifically, the membership function of the fuzzy set is used to solve the difficulty in determining the basic probability assignment function in the improved Dempster–Shafer evidence theory. The prediction model of effluent conditions fuses seismic wave reflection data, ground penetrating radar data, and transient electromagnetic data. Therefore, quantitative evaluations of the effluent conditions are achieved, including the strand water, linear water, seepage and dripping water, and anhydrous. Experimental evaluations with a typical tunnel section were conducted, in which the state of the groundwater from a series of geological sketch reports in this sectionpaper were used as ground truth for verification. The experimental results revealed that the proposed method not only has high accuracy and robustness but also aligns well with different evidence effectively that generally contradicts manual interpretation reports. The results from 12 randomly selected tunnel sections also demonstrate the generalization abilities of the proposed method.

1. Introduction

China has the largest number of tunnels at the largest scale worldwide. However, in some remote, complex, and difficult mountainous areas in western China, the construction of long and deep buried tunnels running hundreds of kilometers is still enormously challenging [1]. Because of the sudden and destructive characteristics of tunnel water inrush, construction equipment and materials in the tunnel can be buried, which delays the construction period and seriously threatens the life and safety of construction personnel [2,3,4]. In addition, surface water resources outside the cave are depleted, thereby destroying the surface ecological environment. Therefore, how to use the existing data to correctly and efficiently predict the water abundance of the surrounding rock in front of the tunnel face is of great significance.
Advanced geological prediction can obtain the location and scale of water-rich areas in front of the tunnel face in advance and provide reasonable excavation methods and effective pre-support and pre-reinforcement measures for construction to reduce the possibility of a tunnel water inrush disaster [5,6,7]. It is one of the most important and basic means in current tunnel construction technology. Geophysical detection results are widely used in tunnel advanced geological prediction because of high precision, wide detection range, and high efficiency [8,9,10]. Based on the difference in the physical properties between the tunnel’s surrounding rock and the water-rich area, the geophysical exploration method analyzes the variation law of the geophysical field to predict the location and scope of water inrush [11,12]. The equipment used in the geophysical prospecting method is portable and does not affect the excavation of the tunnel face. Commonly used methods are seismic wave reflection, ground penetrating radar (GPR), and transient electromagnetic methods (TEM). The seismic reflection wave method mainly transmit seismic wave signals, and the wave speed and amplitude of seismic waves are severely attenuated when encountering a large amount of water, so the water-rich areas ahead can be judged according to the reflected signals [13,14]. The widely used equipment in the seismic wave reflection method is the tunnel seismic prediction system (TSP) developed and produced by Amberg [15]; the generated data is also called TSP data. The principle of GPR is to transmit electromagnetic wave signals through a transmitting antenna and then identify structures such as karst and water-rich areas by analyzing the waveform of electromagnetic wave propagation [16]. TEM is widely used to predict water enrichment because it can obtain the apparent resistivity distribution in front of the tunnel face according to the principle of electromagnetic induction [17]. Different geophysical methods have various advantages, disadvantages, prediction ranges, and accuracies. Because of this, the prediction results of the surrounding rock’s effluent from different geophysical data sometimes differ. Therefore, the fusion method of multi-source geophysical exploration data is not only the current development direction but also an important means to solve the problem of tunnel disasters under complex geological conditions.
Most existing fusion methods are used to establish a comprehensive advanced forecasting system, but this method depends on manual identification [18,19,20]. It is challenging to meet the project requirements using a comprehensive forecast. Therefore, there are still some difficulties in fusing various geophysical data containing uncertain information to form a more accurate analysis result of water output, mainly including some characteristics of multi-source geophysical data itself, namely heterogeneity and complex correlation.
(1)
Heterogeneity of the multi-source geophysical data. Different advanced geological prediction methods have been implemented for the same tunnel face to detect the water outlet of the tunnel. The TSP data store the attenuation parameters of seismic waves propagating in the tunnel, including longitudinal wave velocity, shear wave velocity, Poisson’s ratio of rock, Young’s modulus, and positive and negative reflection interfaces of seismic waves. The GPR data store the distribution of the amplitude, frequency, event axis, and energy of the electromagnetic wave signal propagation in the tunnel’s surrounding rock. Additionally, the TEM data measure the resistivity distribution of the surrounding rock. In addition, these parameters are presented in different formats (tables, images). Based on the generation method of the data field, the propagation characteristics of the wave, signal processing method, and characteristic parameters are all different. Therefore, we require a complementary method of fusing multi-source geophysical data to extract more valuable information.
(2)
Complex correlation characteristics of multi-source geophysical data. Although the detection objects of different data are all water output conditions of the same tunnel mileage section, it is difficult to have a unified method to correlate these data. In one case, the water-rich region deduced from the change in the physical property parameters of the TSP data reflect the absence of water in the electromagnetic waveform attenuation characteristics of the GPR data or high resistance to the resistivity value of the TEM data. Therefore, there may be contradictions in the performance results of these data in water-rich areas and there is no way to determine the internal relationship between the characteristics of these data. This was determined by the multi-source heterogeneity of the data. Nevertheless, the characteristics of these data are closely related to the water outflow in this area, and it is difficult to make full use of the interpreted results of these geophysical data to establish a unified water inrush risk analysis model.
To solve these problems, we propose an improved Dempster–Shafer evidence theory (D-S theory) for tunnel water inrush risk analysis based on the fuzzy characteristics of multi-source geophysical data. The D-S theory is an effective means to deal with uncertain information, which can realize multi-source information fusion without prior information, and is widely used in expert systems, pattern recognition, intelligence analysis, and other fields [21,22,23,24]. In the face of evidence conflict, the results obtained using classical D-S theory are often ambiguous [25]. At the same time, the basic probability assignment (BPA) is the basis of the D-S theory, and its value represents the credibility of a given result. The corresponding fusion results are different with different methods of constructing the BPA [26]. The construction of BPA remains a question worth studying. Jiang et al. obtained a BPA based on an improved similarity measure between generalized fuzzy numbers [27]. Tang et al. proposed a triangular fuzzy number model membership function to generate a generalized BPA [28]. There is no fixed mode for the determination of BPA, and it is based on practical applications to obtain the proper BPA. The interpretation of the results of different geophysical data is ambiguous, and a considerable amount of sample data is accumulated during tunnel excavation. For this reason, an improved fuzzy D-S theory model integrating multi-source geophysical data was proposed in this study.
In summary, by inputting the TSP, GPR, and TEM data, the membership function of different physical property identification parameters in each type of data was established, and the fuzzy comprehensive function was applied to different membership functions to obtain the water-rich judgment of each geophysical data. Finally, the improved D-S theory synthesis rules were used to integrate the three types of geophysical identification results, and the water effluent status of the section was determined, namely strand water, linear water, seepage water, or no water. Finally, the data from 12 tunnel sections were randomly selected to establish three groups of comparative experiments. The classical D-S theory, fuzzy D-S theory, and improved fuzzy D-S theory were used to conduct experiments in different areas, and it was concluded that the prediction accuracy of this model was higher than that of other methods.
The remainder of this paper is organized as follows. Section 2 introduces the characteristics of three types of geophysical data and their corresponding fuzzy identification factors and fusion methods. In Section 3, a tunnel was selected for experimental research and the fusion prediction results of the effluent of surrounding rock were obtained. Section 4 compares the results of a single data source and three different fusion methods. Section 5 presents the conclusions of this study.

2. Data and Methods

2.1. Multi-Source Geophysical Data

In this study, three types of tunnel advanced prediction geophysical data were used to conduct a fusion analysis of water inrush risk aiming to make full use of the potential information and the associated value of each data. Figure 1 shows in detail the various characteristics of the three types of data, including the physical field, detection range, physical parameters, and characteristics of the field. The dashed boxes represent the physical parameters of each dataset, which are also the basis for the fusion of this study.

2.1.1. TSP Data

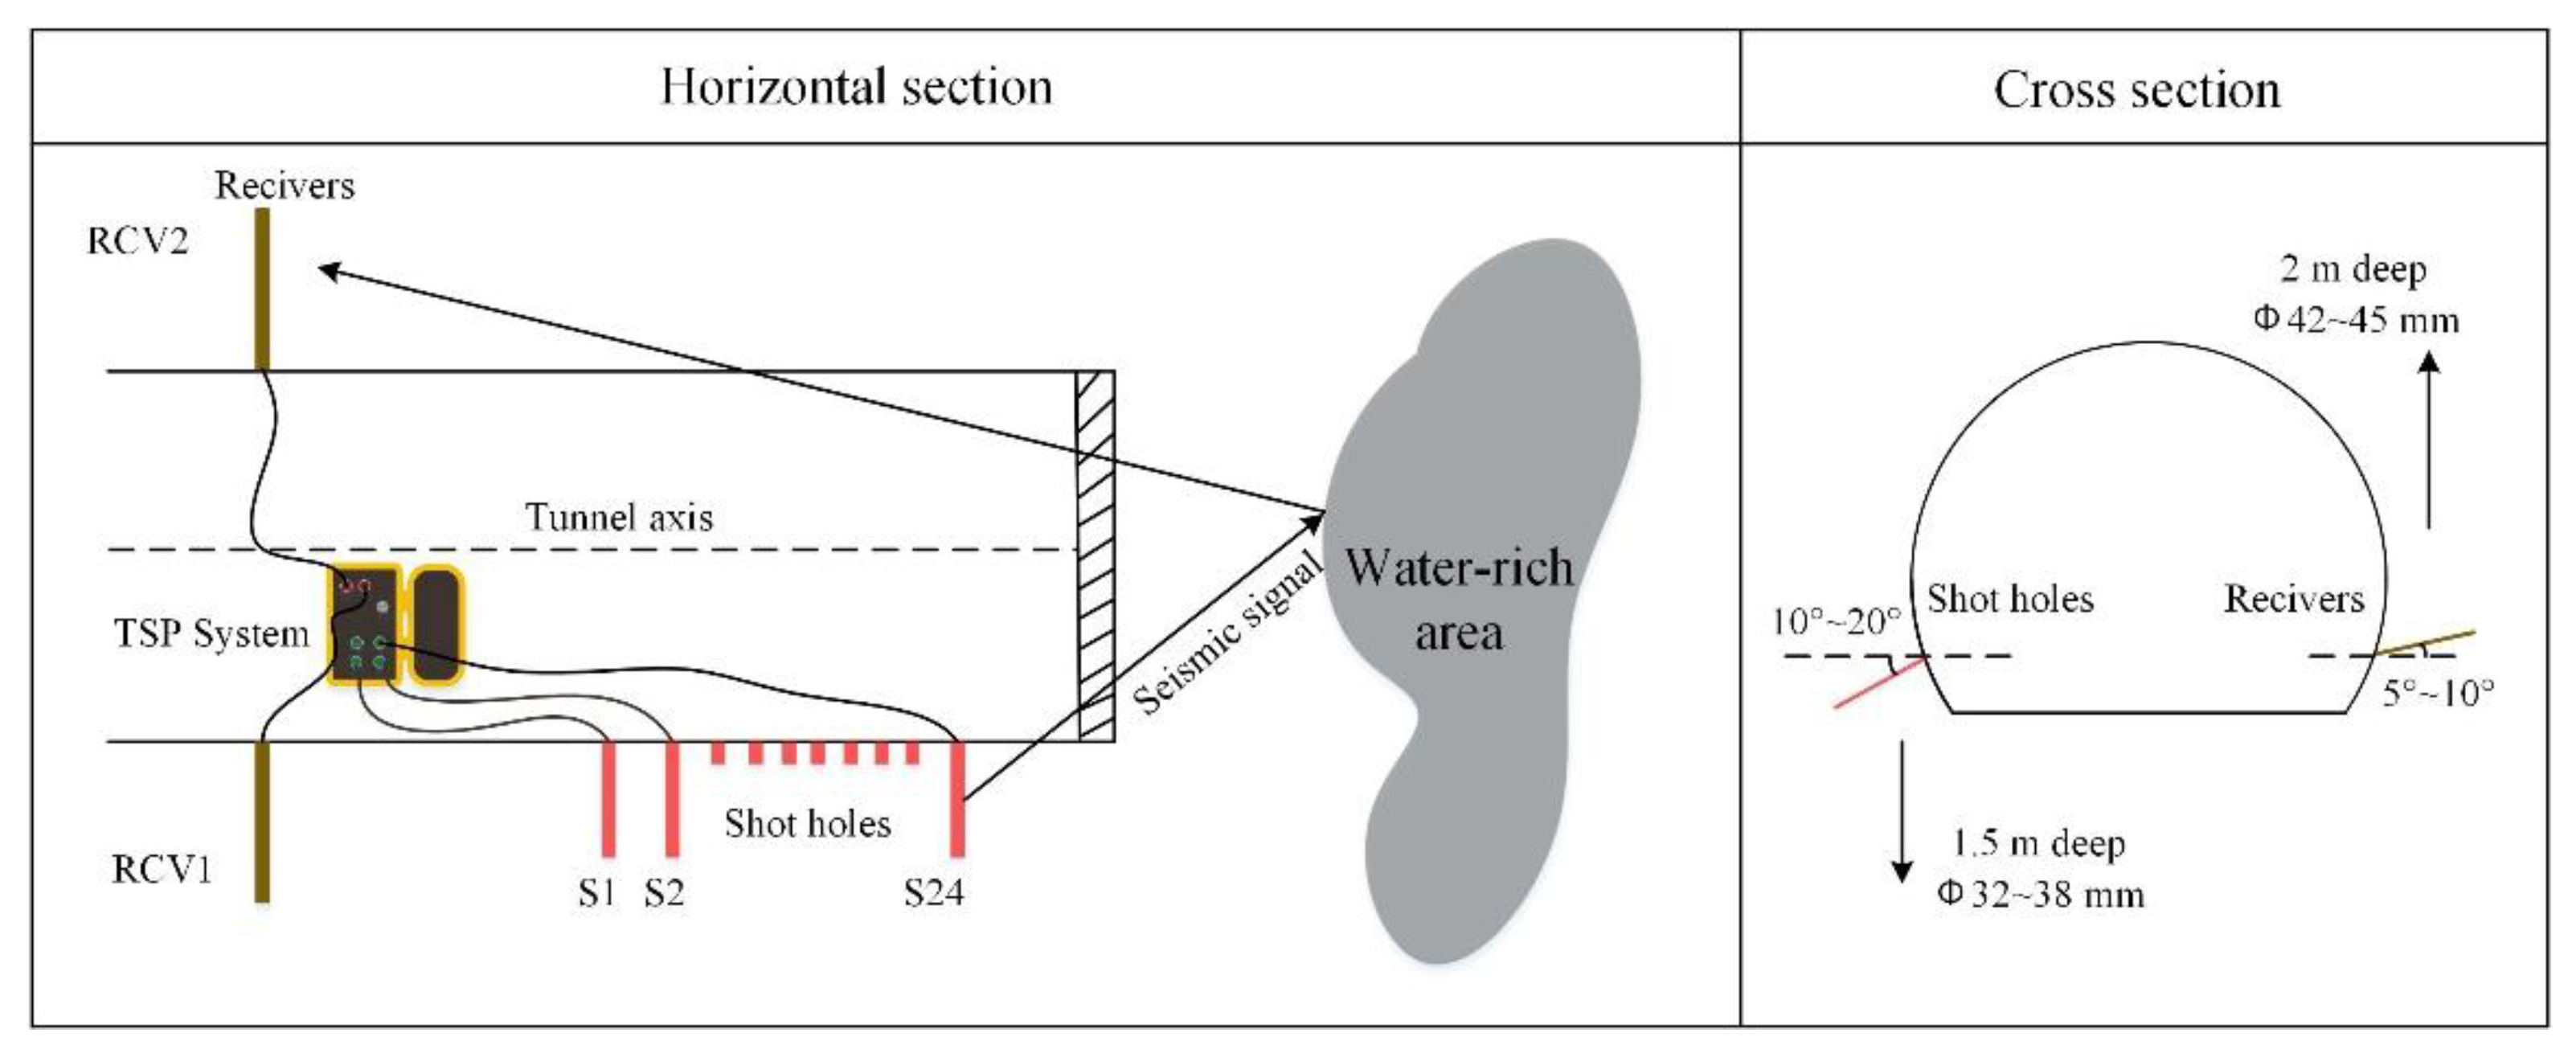
Figure 2 shows the schematic of the TSP observation system. The general observation system consisted of 24 blast holes and 2–4 receivers. The buried depth and inclination of the blast hole and receiver are shown in the cross-section in Figure 2.
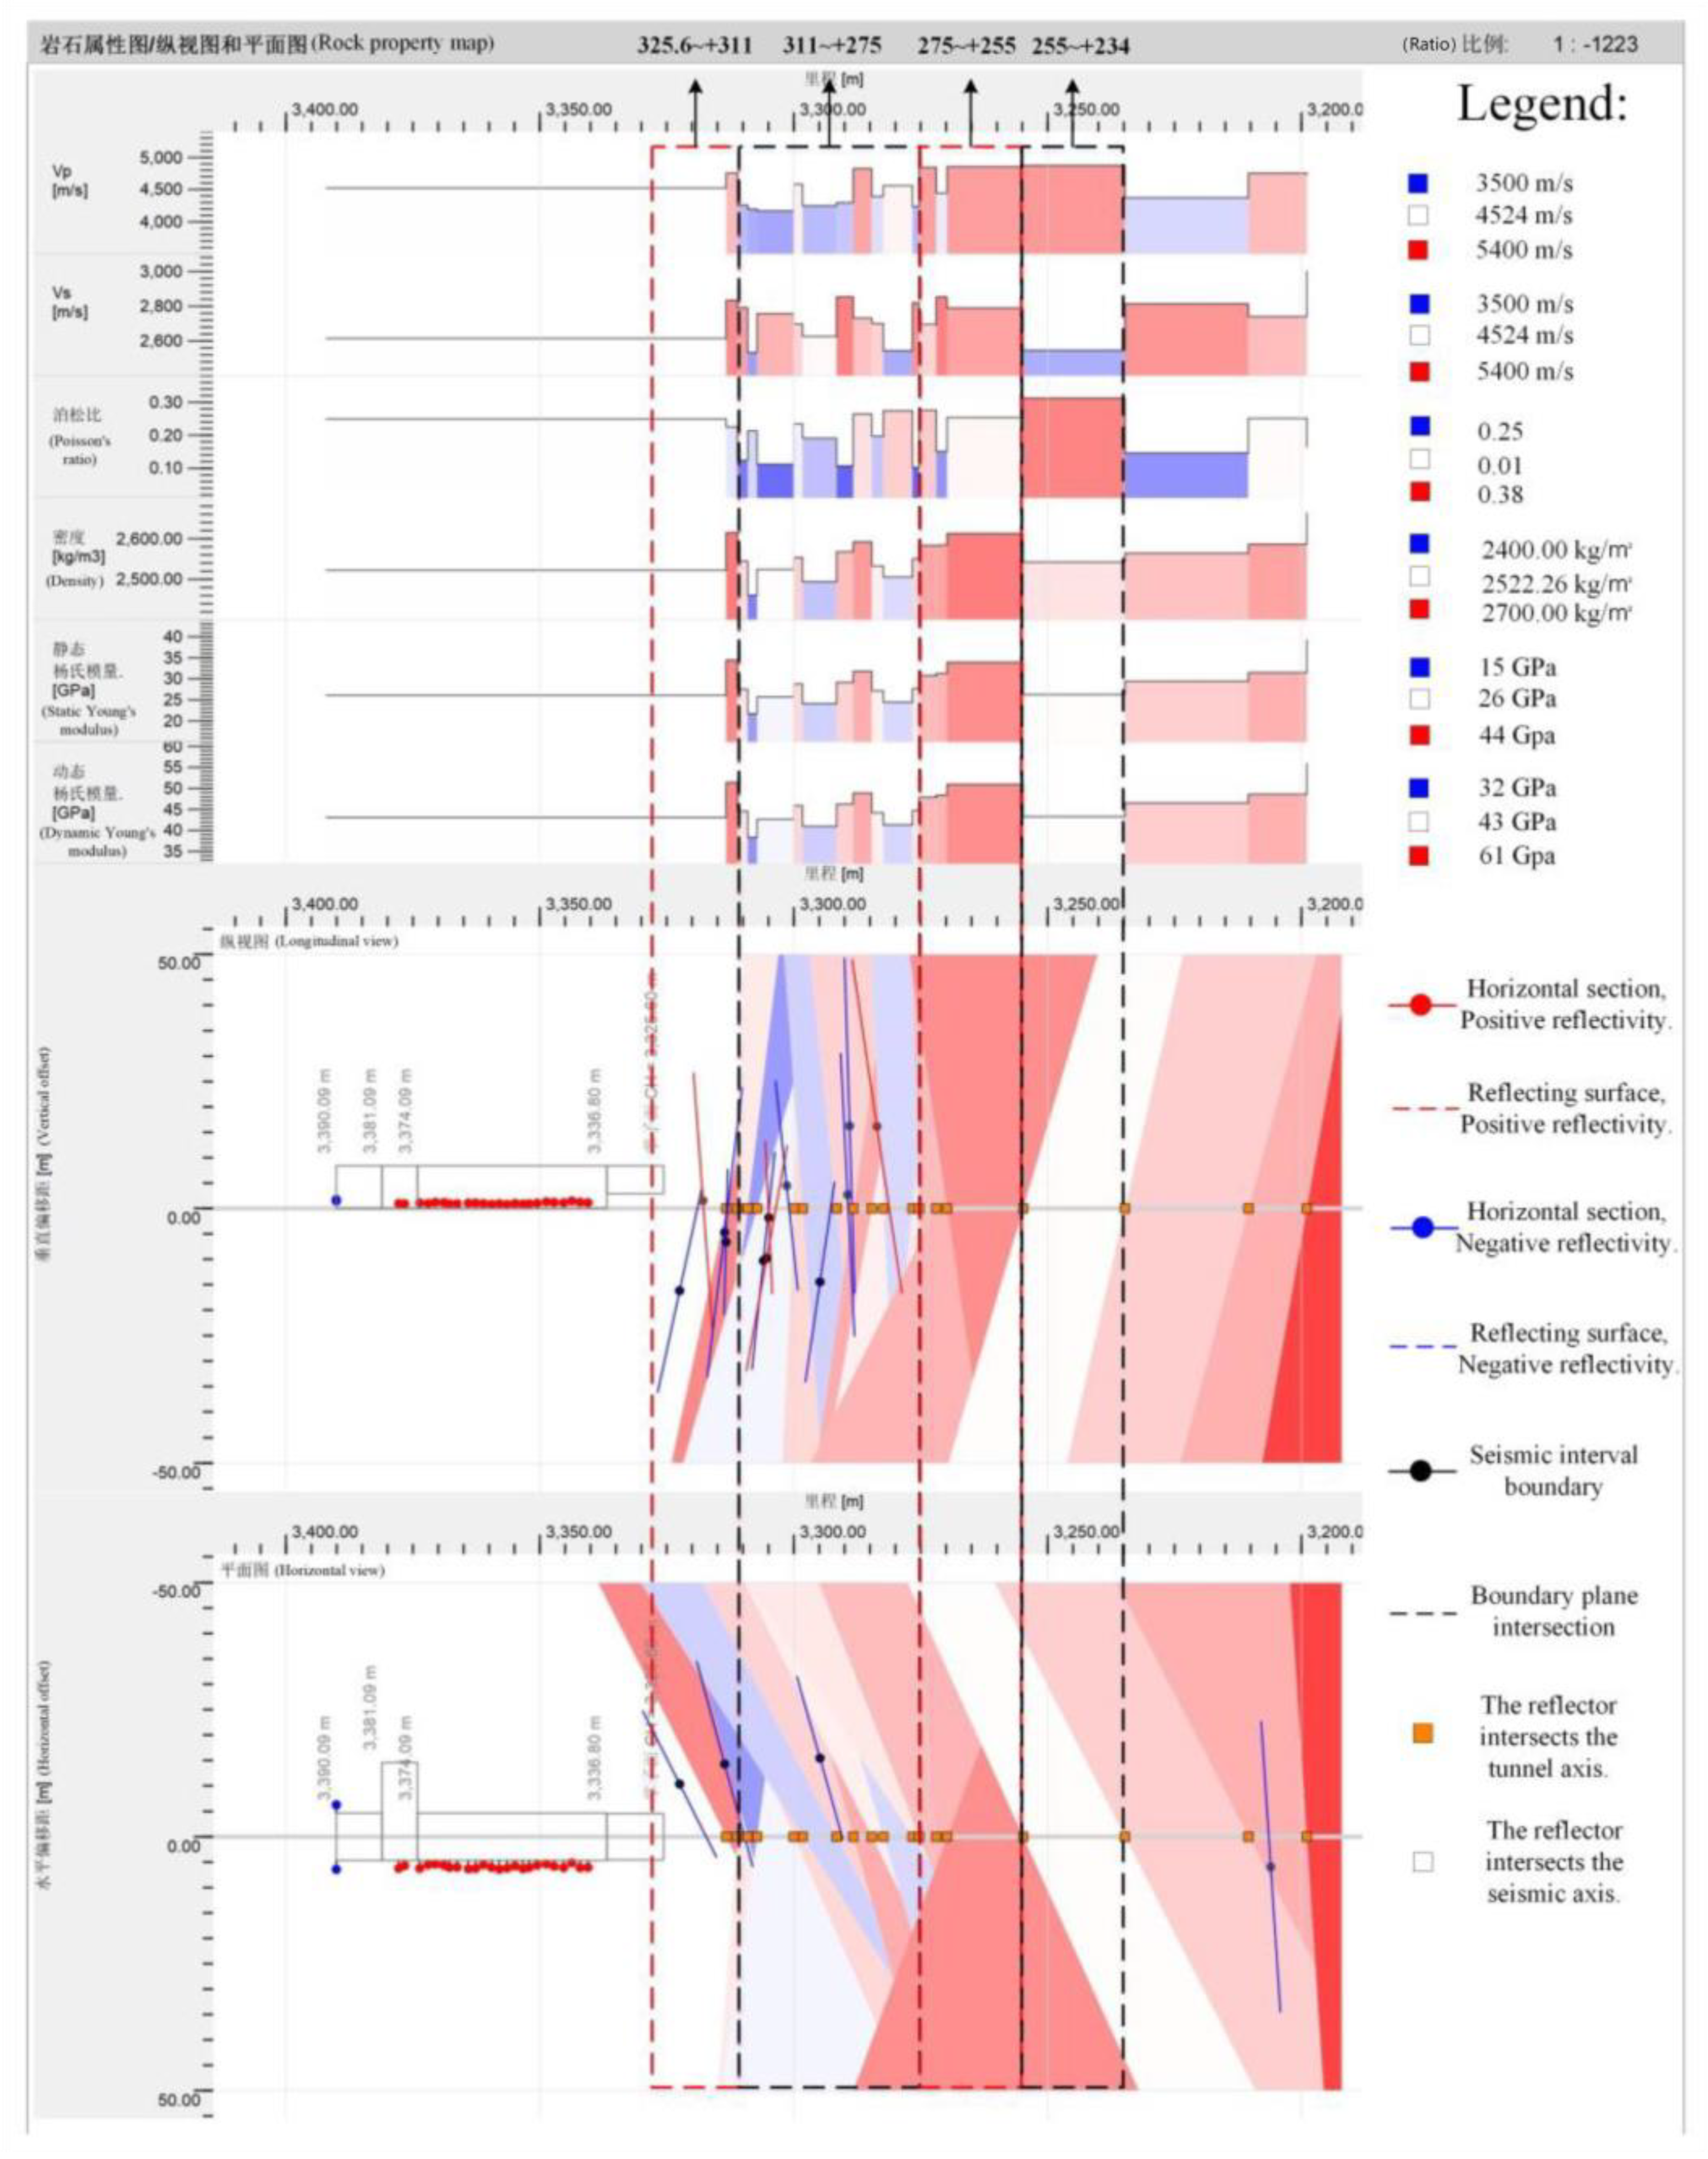
First, the seismic wave produced by the explosive blast in the hole propagates around, and reflection occurs when it meets the interface of different wave-impedance media. By converting the reflected information into electrical signals and performing a series of processes, including observation system editing, tunnel modeling, data setting, time-varying height, bandpass filtering, first break picking, direct wave adjustment, Q-analysis, reflected wave extraction, P-S-wave separation, 3D-modeling, velocity analysis, depth migration, reflector extraction, and inversion results, the changes in P-wave velocity, S-wave velocity, P-S-wave velocity ratio, Poisson’s ratio, dynamic Young’s modulus, and the distribution of the reflection interface were obtained [15]. The results are shown in Figure 3.
The tunnel face mileage of the section shown in Figure 3 was 325.6 m, and the forecast range was 325.6~+ 234 m. The tunnel face lithology was granite with a relatively broken rock mass, and the surrounding rock grade was V. According to the change in parameters, the result of the unfavorable geological condition is divided into four parts, as shown in Figure 3. The segmented prediction results obtained by the interpreters were as follows:
  • Range 325.6~+ 311 m: The surrounding rock is basically the same as the current face, partially broken, with more developed joints, containing water (mainly linear and strand-shaped water).
  • Range 311~+ 275 m: The surrounding rock is mainly fragmented, partially fragmented, with developed joints, and densely developed fissures, containing water (increased local water volume), and there is a risk of water inrush locally. Sufficient attention must be paid during the construction process.
  • Range 275~+ 255 m: the surrounding rock is relatively broken, with relatively developed joints, and contains water (mainly linear and strand-shaped water).
  • Range 255~+ 234 m: the surrounding rock is relatively broken, with relatively developed joints and fissures, and contains water (the local water volume increases).

2.1.2. GPR Data

The basic principle of the geological radar method is to work together through a transmitting antenna, a receiving antenna, and a host computer. When collecting sample points, the control unit first sends a control signal to the transmitter and the receiver. After receiving the signal, the transmitter transmits an electromagnetic pulse wave of a determined main frequency to a measurement point through the transmitting antenna (T). In the process of propagation through various media, the electromagnetic pulse wave meets the physical interface of different media (the difference interface of resistivity and dielectric constant), and wave reflection occurs [29]. The reflected wave is received by the receiving antenna (R). Figure 4a shows the GPR detection principle, and Figure 4b shows the corresponding waveform generation principle.
A GPR machine is easily disturbed by machines and pipelines in tunnels. Currently, it is primarily used for the detection and prediction of karst caves, water-bearing zones, and fractured zones [30]. It uses the change in the dielectric constants of different media to make judgments, which requires a rich detection experience. The radar image contains rich information about the detected body, which is qualitatively interpreted according to the characteristics of the radar image (such as the dense zone of joints, voids, reflection interface, etc.). Figure 4c shows the GPR waveform with a mileage of 332.8~+ 306 m, from which the interpreter draws the following conclusions. The reflected GPR signal in this section is strong, and the waveform is relatively chaotic. The conclusion is that the surrounding rock is partially broken with more developed joints and contains water (mainly in the form of linear and strand-shaped water). Among them, the 327~+ 320 m sections have densely developed joints.

2.1.3. TEM Data

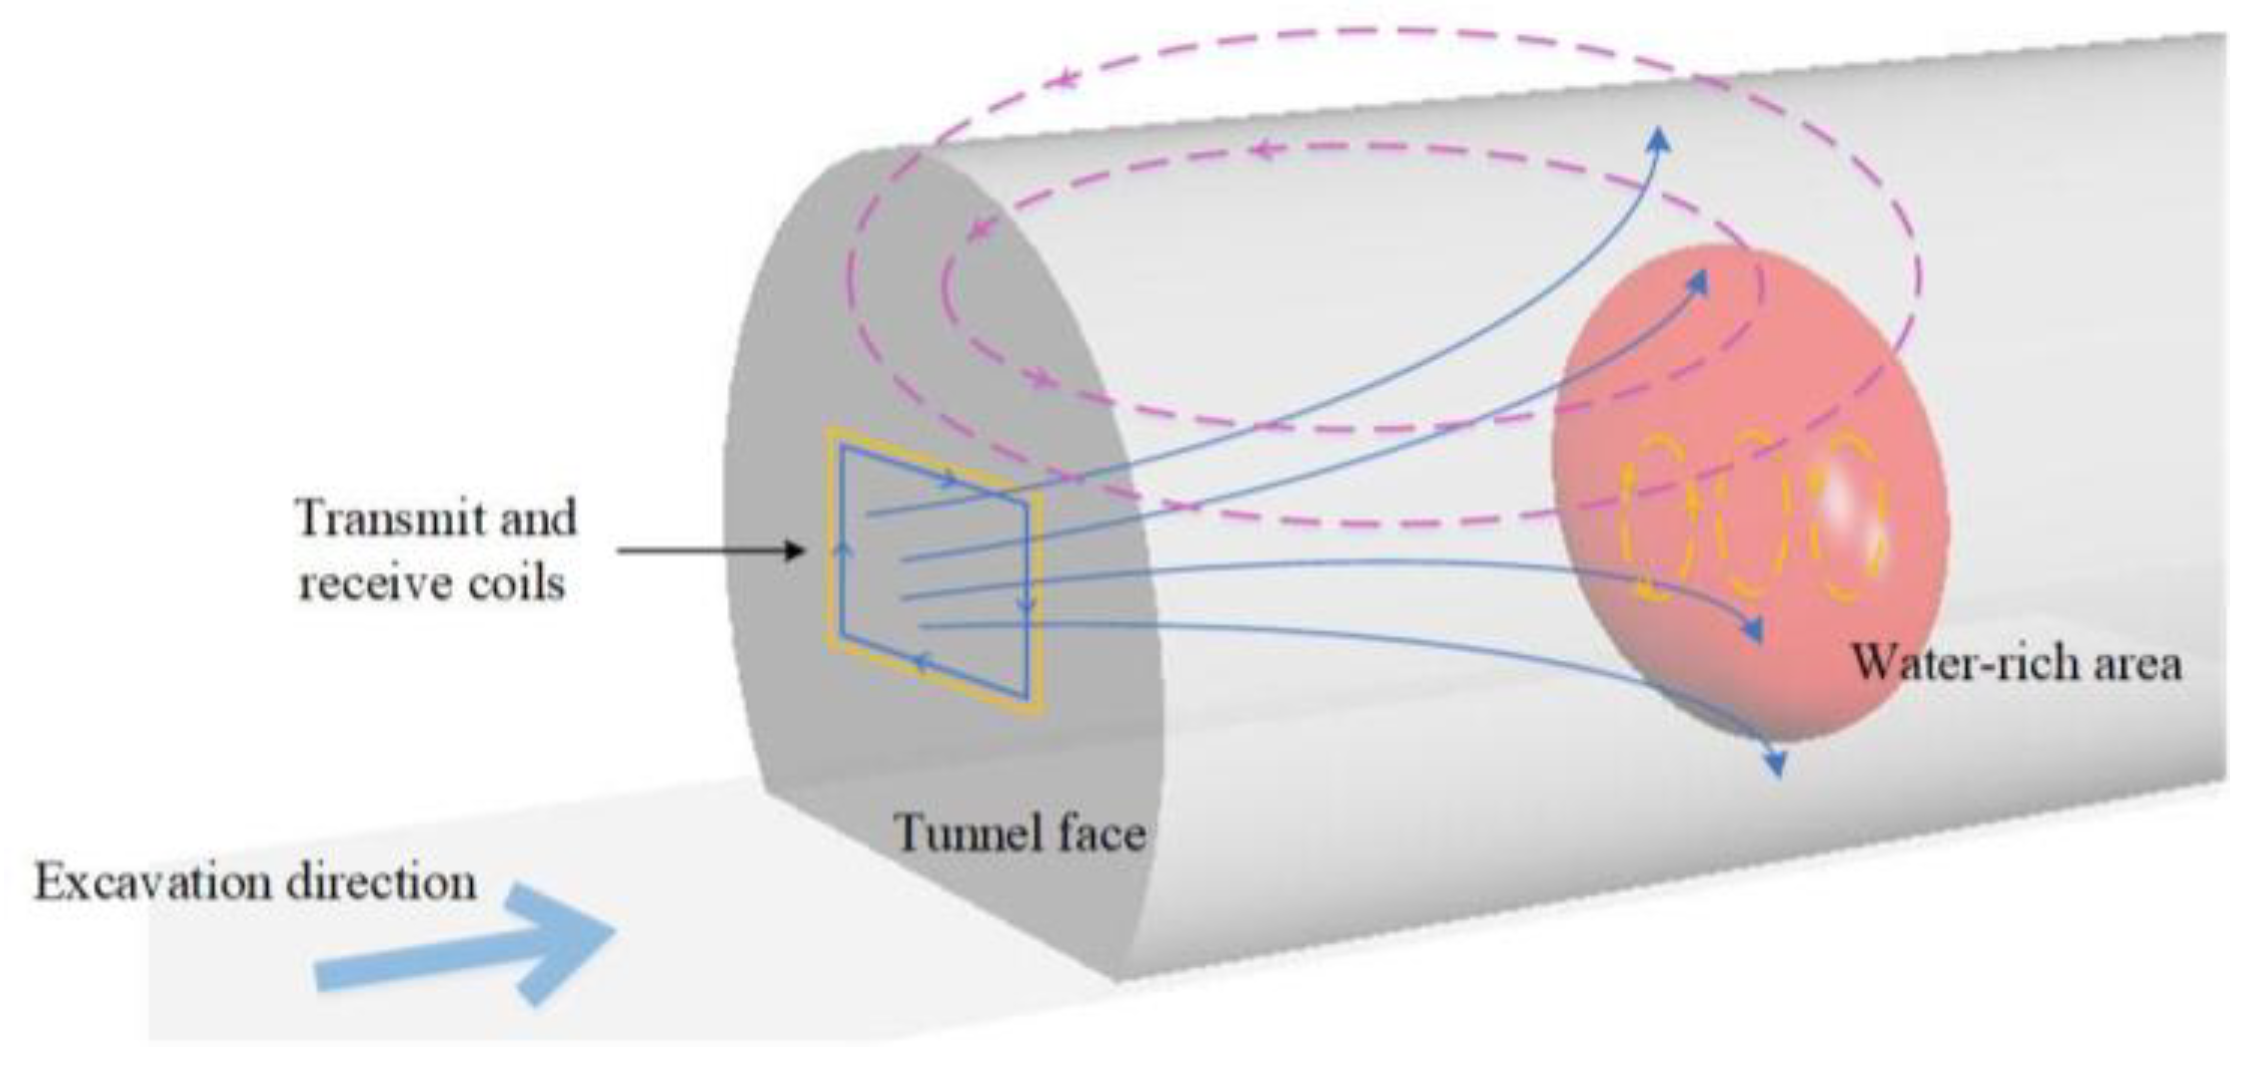
The transient electromagnetic method uses eddy currents generated by the electromagnetic induction principle to detect objects with good conductivity and is often used to detect metal orebodies in the early stage. During tunnel construction, the electrical conductivity of the water-rich area is stronger than that of the surrounding dry area; therefore, it is widely used to explore water [31]. The working principle of the transient electromagnetic method is shown in Figure 5.
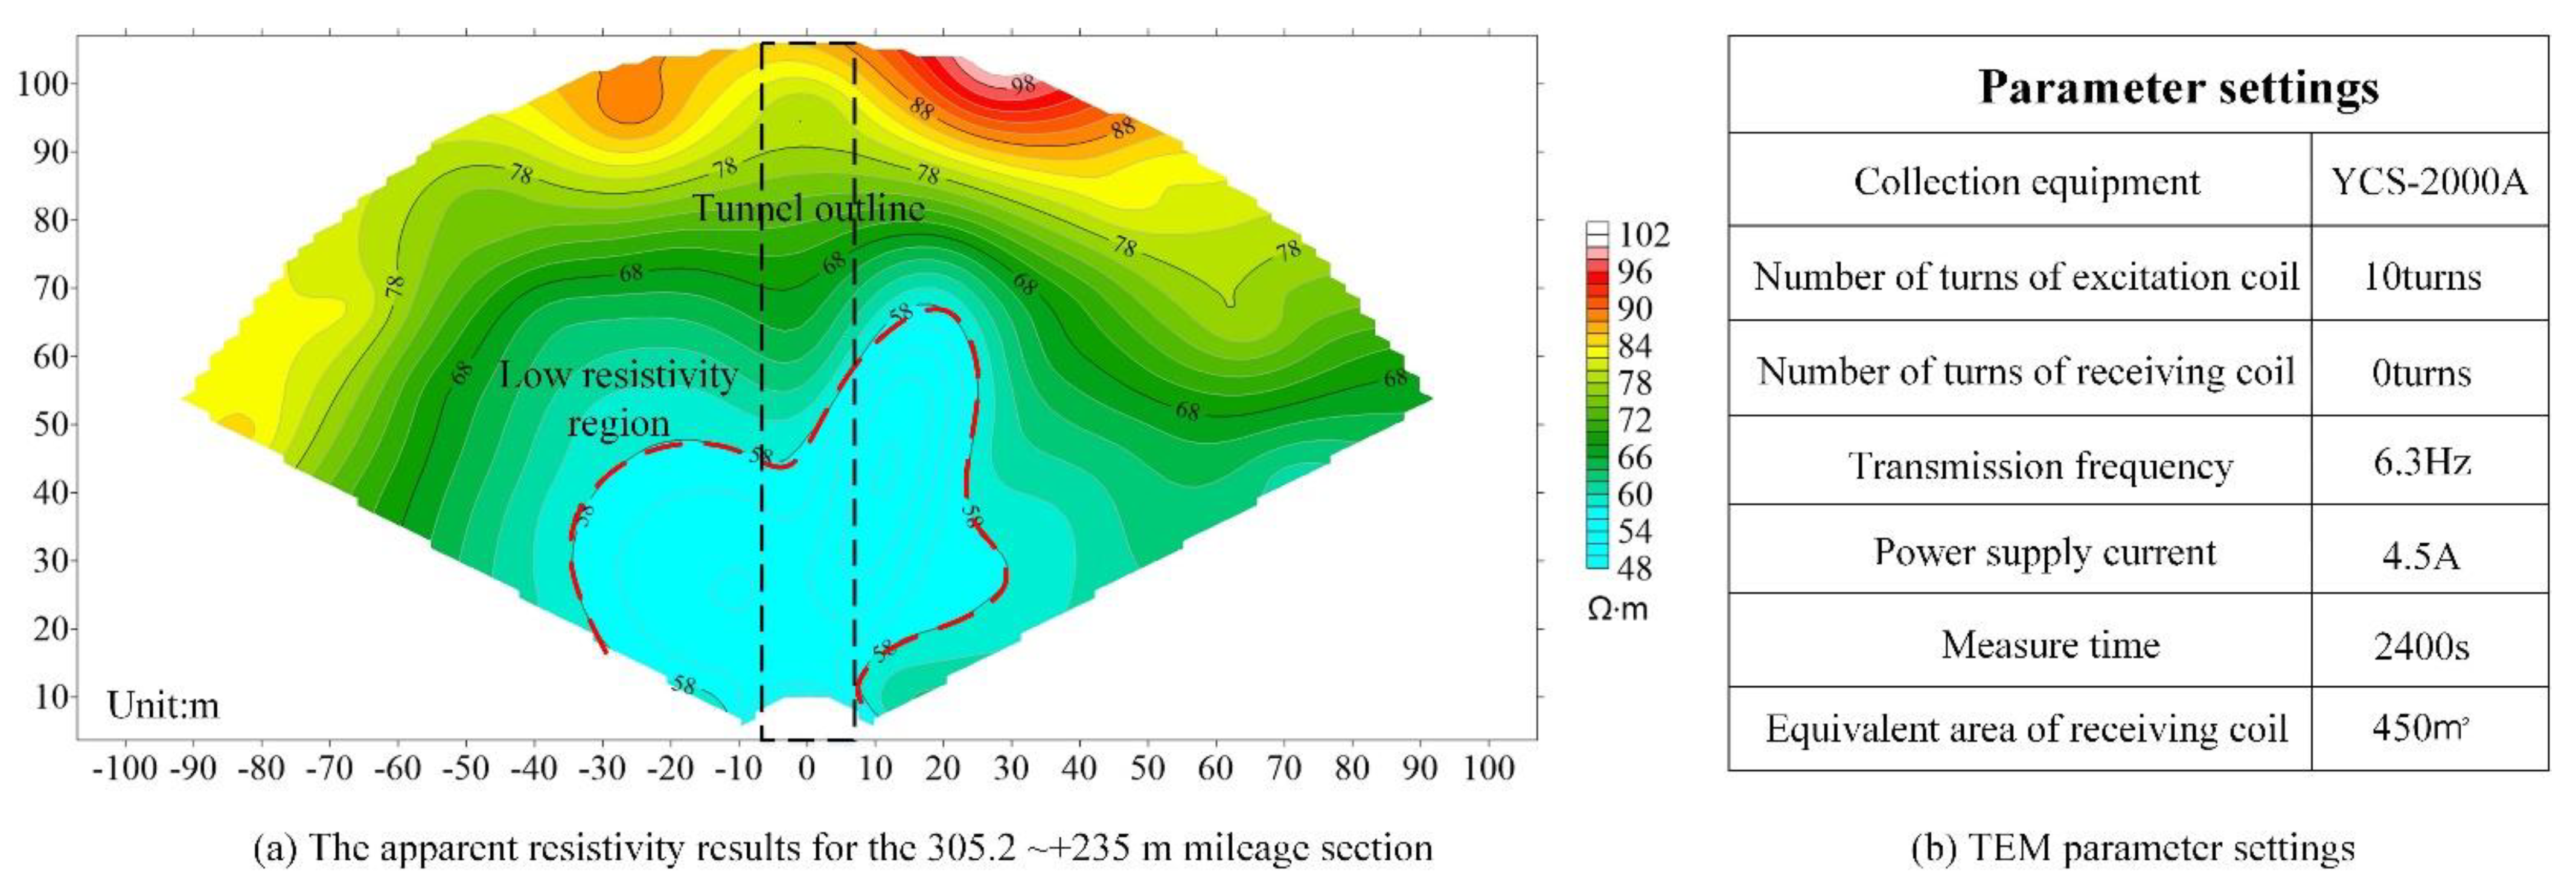
By passing a pulse current through the transmitting coil, the generated magnetic field generates an eddy current when encountering a good conductor, such as a rich water body, and then generates a secondary magnetic field. The receiving coil, in turn, generates a new induced current under the influence of the secondary magnetic field [32]. The front apparent resistivity distribution map is obtained by further analysis. Figure 6a shows the apparent resistivity results for the 305.2~+ 235 m mileage section, with a tunnel face mileage of 305.2 m and a transmitting coil mileage of 307 m. The black dotted frame indicates the range of the tunnel, and the red dotted frame represents the area with low resistivity, which is also considered the area with a higher risk of water inrush.
Figure 6b shows the relevant parameters of the collected data. The prediction conclusion drawn by the interpreters based on this result is that the water volume of the surrounding rock in this section is essentially the same as that of the current tunnel face, and the water volume is still large, mainly linear and strand effluent.

2.1.4. Fuzzy Identification Factors

Considering the physical parameters of shear wave velocity v s , the ratio of longitudinal wave velocity to shear wave velocity v p / v s , Poisson’s ratio in TSP data, waveform parameter amplitude variation, in-phase axis continuity, reflected signal intensity in GPR data, and apparent resistivity in TEM data, these parameters are fundamental factors for the interpreter to judge the water outlet of the tunnel; they directly reflect the affluent state of the surrounding rock, which we call the identification factors in this study.
These identification factors changed correspondingly in water-rich areas. For example, when encountering water-rich areas, the v s of seismic waves often drops significantly, v p / v s rises, Poisson’s ratio increases, the amplitude of the reflected signal of electromagnetic waves changes strongly, the continuity of the in-phase axis is poor, the signal strength is strong, and the apparent resistivity is significantly reduced. However, these parameters are relative changes concerning the effluent of the tunnel face because different lithologies, degree of joint development, and degree of rock fragmentation will affect the magnitude of these parameter values. Therefore, in the advanced geological prediction report, the manually interpreted forecast analysis is usually a description of the changes in these parameters, such as rising significantly, falling slightly, and other fuzzy terms. There is no quantitative mapping between these fuzzy terms and effluent results, resulting in different interpreters drawing different conclusions. Therefore, this study proposes a fusion method based on fuzzy characteristics to form a risk analysis model from fuzzy identification to effluent situations.

2.2. Fusion Methods

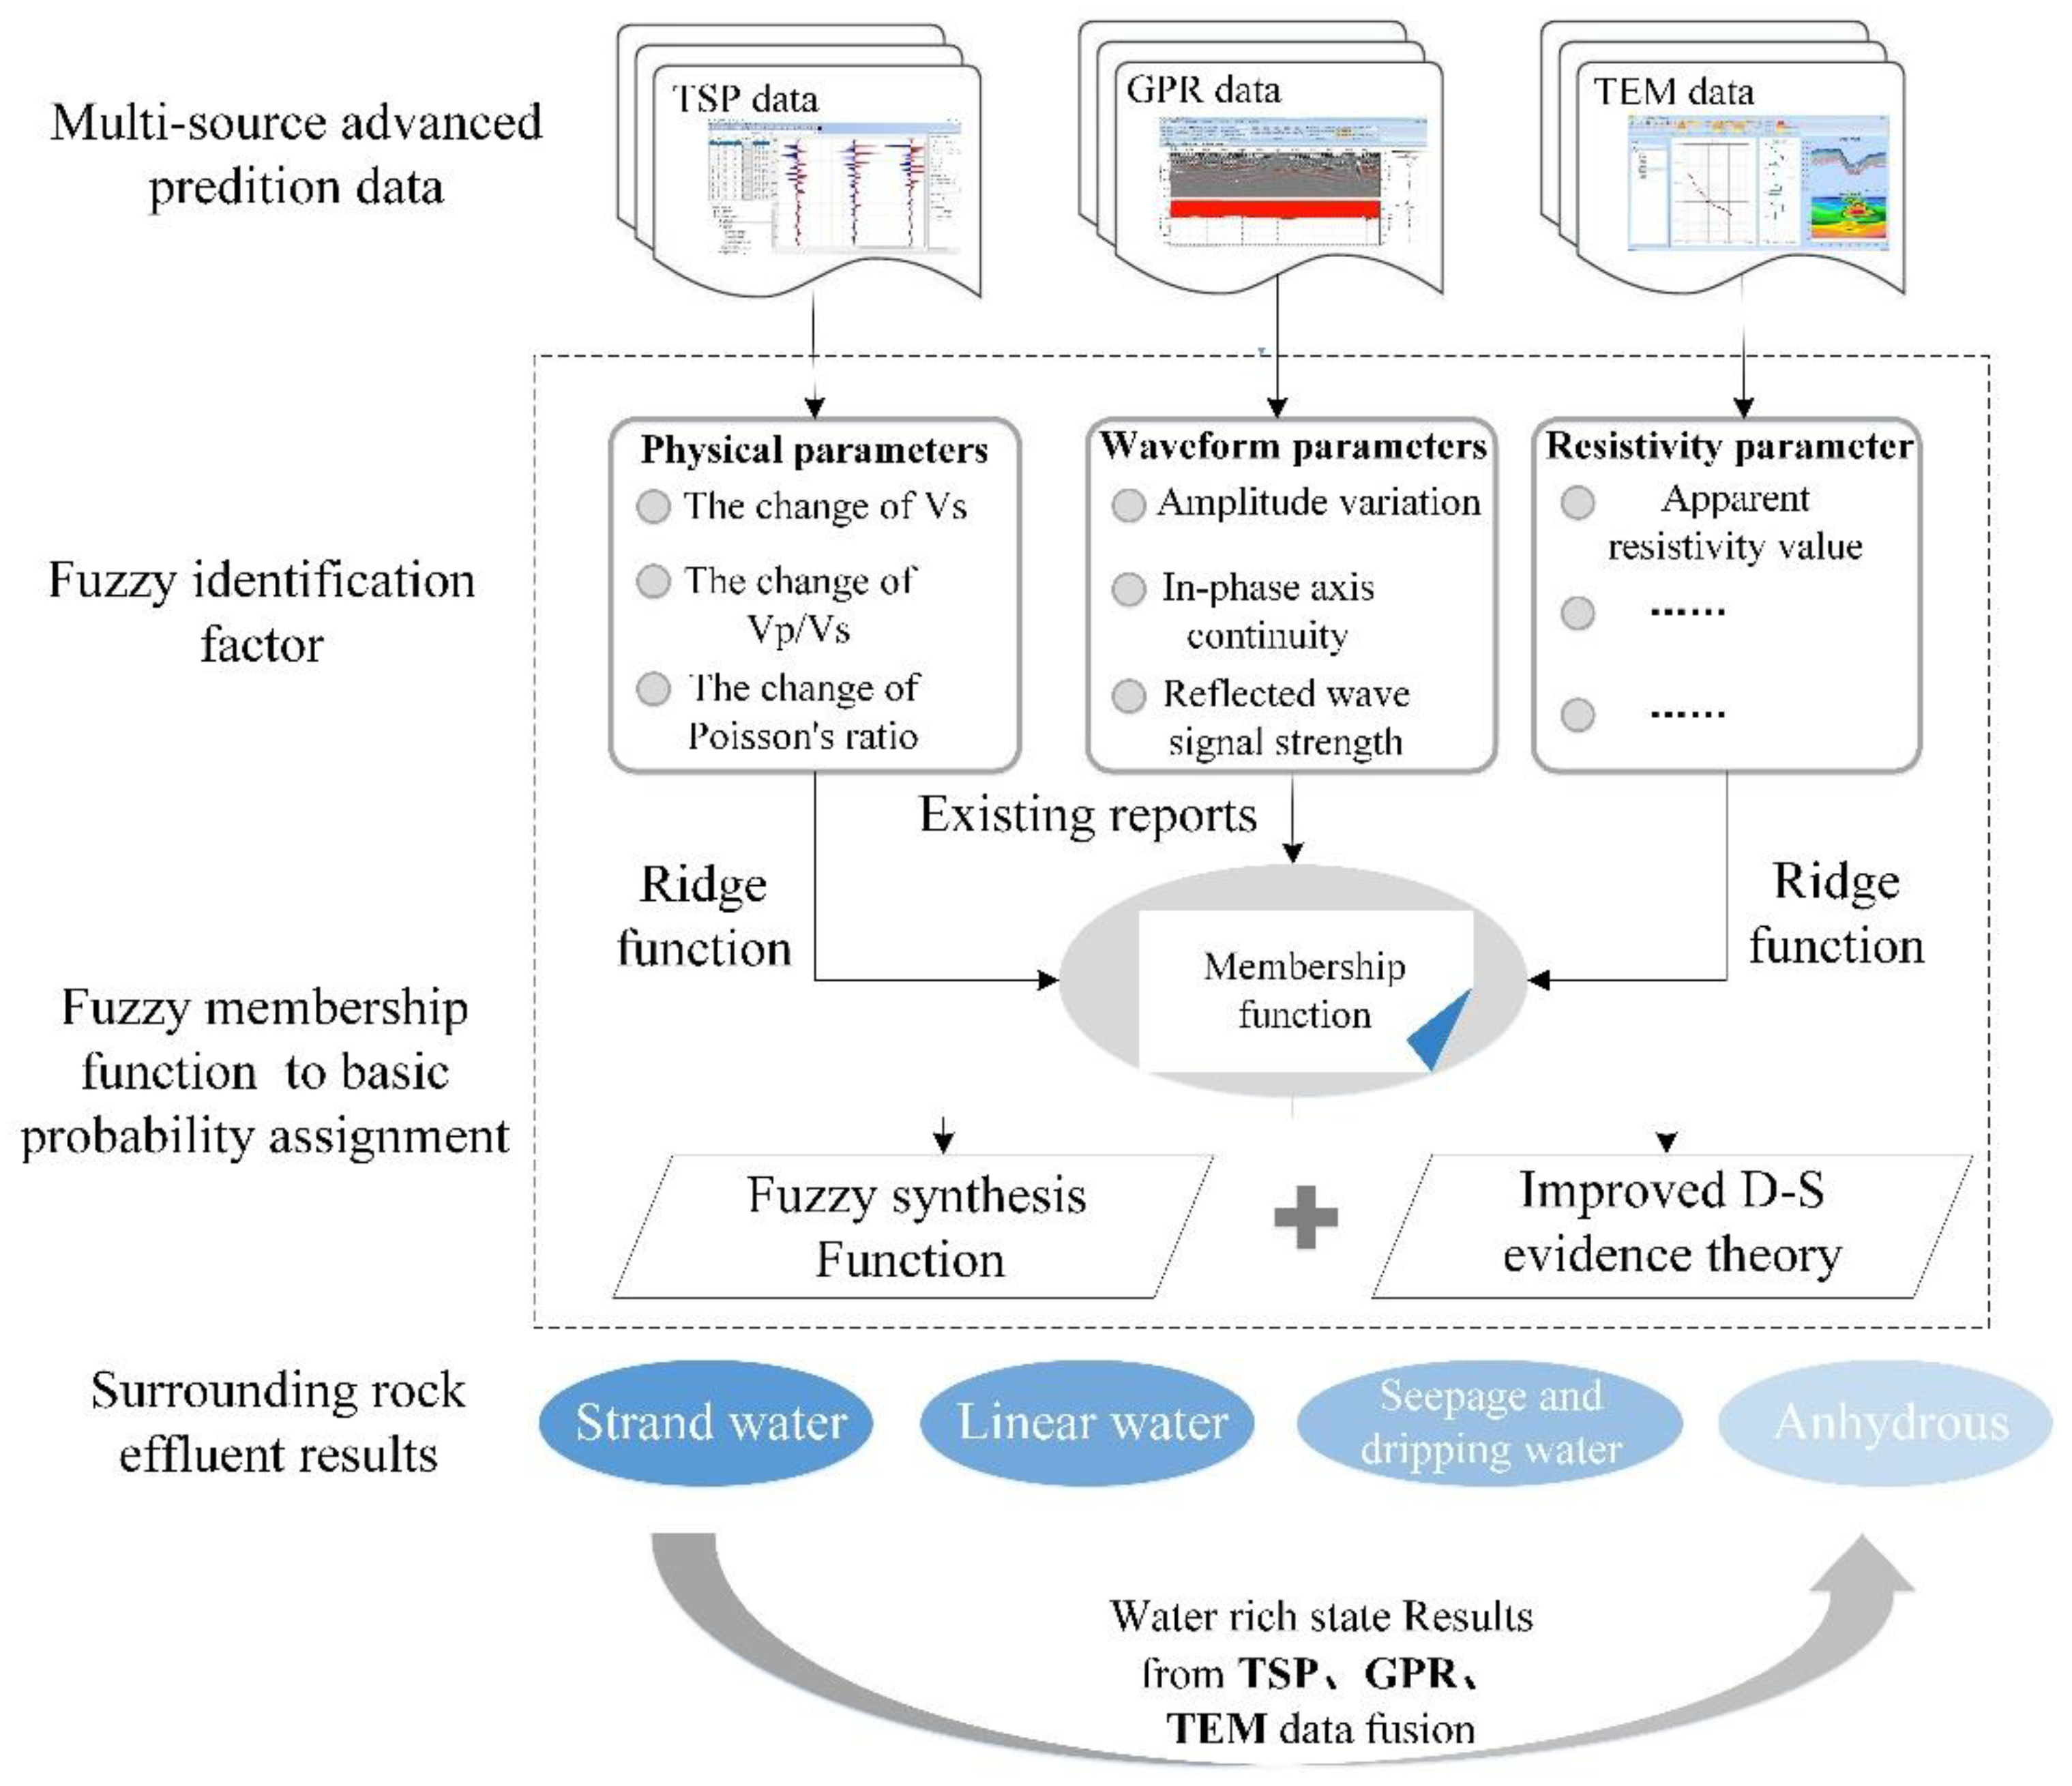
Given the description of the uncertain conclusions in the existing advanced prediction technical reports, such as little change in wave velocity, high Poisson’s ratio, and strong GPR waveform reflection signal, these words are a fuzzy qualitative concept, obtained by professional interpreters. Therefore, it is highly specialized and requires comprehensive interpretation by experts with rich geophysical knowledge and geological experience to correctly identify the effluent condition of the tunnel. In addition, different geophysical exploration data are typically interpreted by different geophysical exploration experts. Owing to their strong subjectivity, identification results are often inconsistent. To fully explore the relationship between various data sources and improve the accuracy of the identification results, this study combined fuzzy sets and the improved D-S theory integrating TSP, GPR, and TEM data to establish a fusion model to obtain more accurate water output forecast results. The fusion principle model is shown in Figure 7.
The input data consist of three types of geophysical data. Taking TSP data as an example, the fuzzy physical parameters used to judge water richness in TSP data are shear wave velocity v s , the ratio of longitudinal wave velocity to shear wave velocity v p / v s , and Poisson’s ratio, which are also called the identification factors in this study. The value of each identification factor is calculated by its respective membership function, and then the fuzzy comprehensive function acts on these three factors. Finally, the comprehensive identification result of the TSP on water effluent is obtained. The prediction results of the GPR and TEM data were obtained similarly. The prediction results of each type of data may be different, and the improved evidence theory can fully solve the conflict between evidence to obtain a more reliable fusion result; thus, the final water-rich state result is predicted.

2.2.1. Membership Functions of Different Identification Factors

Fuzzy set theory was developed by L.A. Zadeh in 1965 [33]. In the language system of the real world, many words such as “young”, “very” and “almost” are fuzzy concepts. In the theory proposed by Zadeh, the fuzzy set A on the domain U is determined, and the following mapping μ A is called the membership function of A [34].
μ A : U 0 , 1   x U , μ A x 0 , 1 ,
x is a certain identification factor, and μ A x is the degree of belonging of x to A, referred to as the degree of membership. In this study, there were four fuzzy sets corresponding to the degree of water discharge in front of the tunnel face: A = {Strand water}, B = {Linear water}, C = {Seepage and dripping water}, and D = {Anhydrous}. The identification factors were divided into three categories according to the three types of geophysical data, represented by x, y, and z. In the TSP, the identification factors v s , v p / v s and Poisson’s ratio are expressed as x 1 , x 2 , x 3 , respectively. In the GPR, the amplitude of the reflected wave signal changes, the continuity of the event axis, and the signal strength of the reflected wave are expressed as y 1 , y 2 , y 3 , respectively. There is only one identification factor, the apparent resistivity in the TEM, denoted as z.
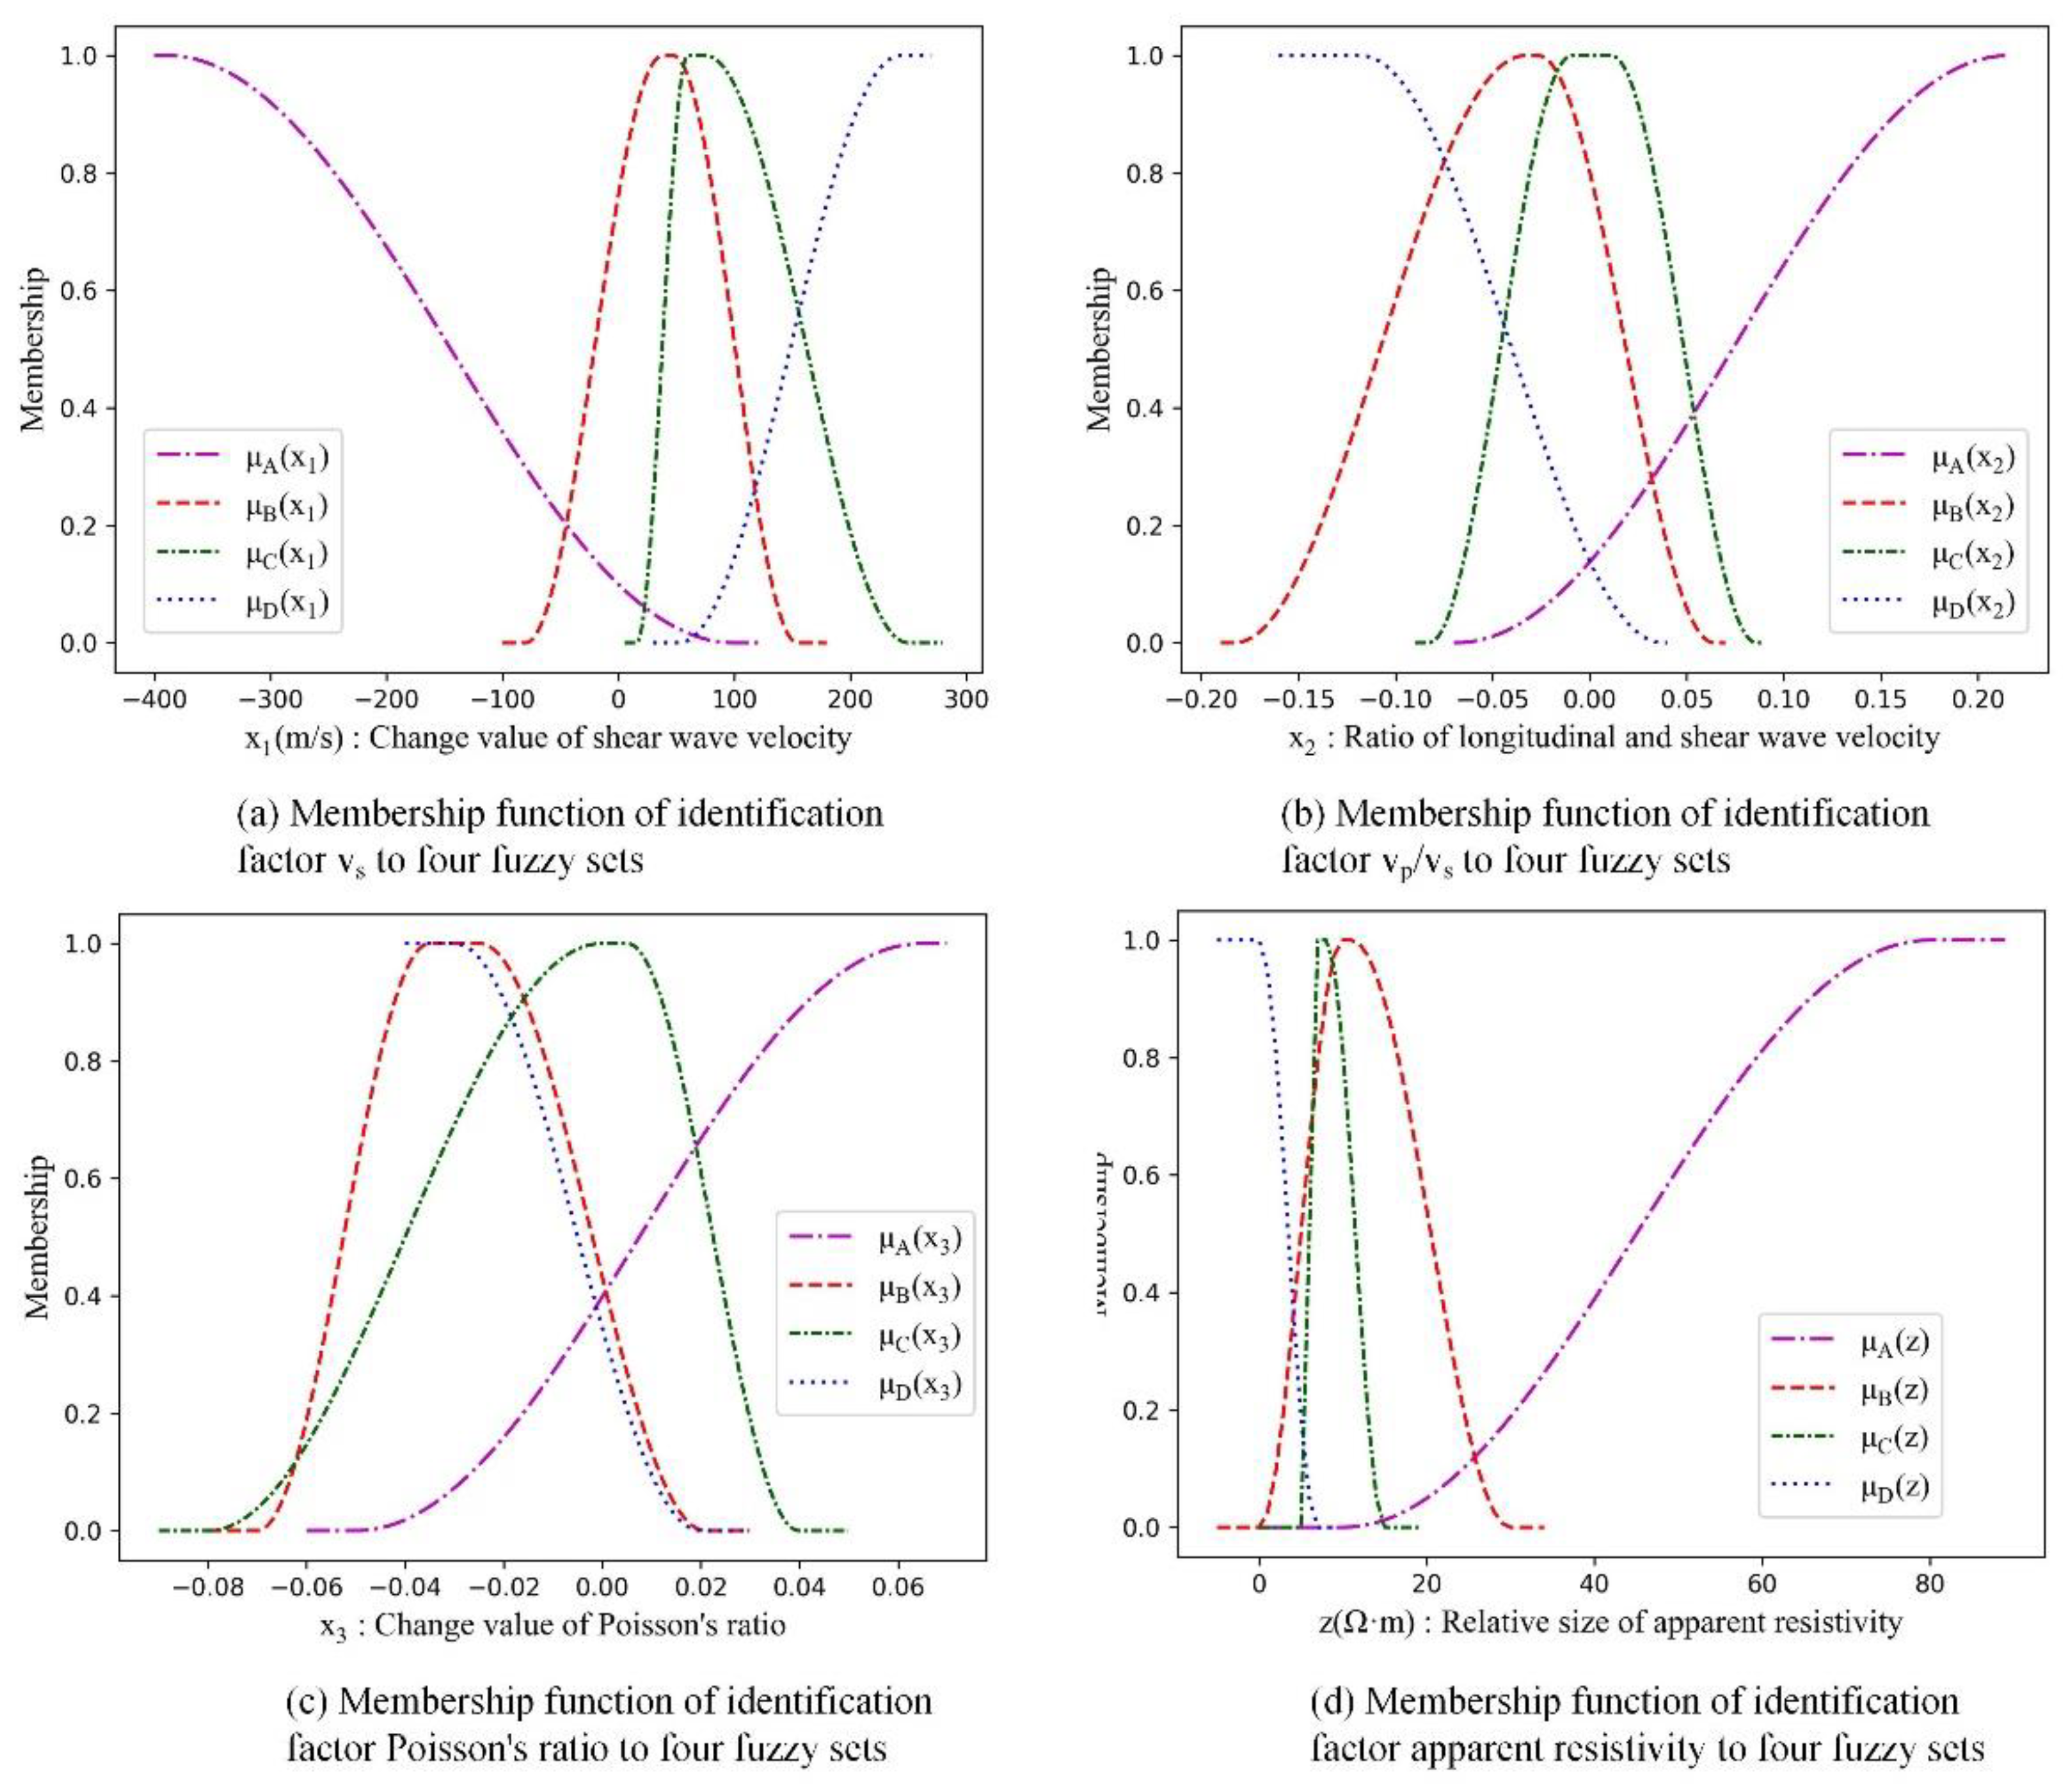
Through the collection of a large number of advanced geological prediction reports, the membership functions of these identification factors can be approximated by a ridge distribution or semi-ridge distribution function using statistical analysis [35]. Figure 8 shows the membership functions of the different identification factors obtained from statistics.
The horizontal axis in Figure 8a represents the change in the shear wave velocity in front of the face relative to that at the face. Note that this time it is not based on the magnitude of the velocity value, but on the relative change; because the rock and lithology are different, the inherent propagation velocity is different. The water-rich situation can only be determined according to this change. The vertical axis in Figure 8a represents the corresponding membership degrees of the different velocity change values in the four fuzzy sets. Similarly, the horizontal axes in Figure 8b–d represent the changes in v p / v s , Poisson’s ratio, and apparent resistivity, respectively. The change in the identification factors corresponding to the four effluent grades was based on the tunnel face as the linear effluent. If the effluent conditions of the tunnel face are different, the membership function must be recalculated. Because the identification factors are all changed values, when the basis is different, the range of change is also different. For the identification factors of GPR data with its non-numerical characteristics, after analyzing the existing reports, the study gives their membership value as shown in Table 1.
After obtaining the membership degree of each type of identification factor for the four effluent fuzzy sets, the prediction results of geophysical data to the effluent condition are output using the fuzzy synthesis function to fuse various kinds of factors. The fuzzy synthesis function is defined as follows [36]
S μ 1 , μ 2 , μ 3 , μ n = 1 n i = 1 n μ i 1 / n ,
where μ 1 ~ μ n are the membership values of the different identification factors for the same type of geophysical data.

2.2.2. BPA Based on the Degree of Membership for the Improved D-S Theory

Whether it is the classical D-S theory or the improved D-S theory, the BPA function is obtained through relevant experience in a specific environment, and different BPA functions have quite different fusion results, which makes the fusion results susceptible to subjective influence. Considering that the prediction conclusion of the water outlet in front of the tunnel face has a fuzzy concept, a probability distribution function generation method based on the degree of membership was proposed.
The classical D-S theory was first proposed by Dempster, the so-called upper and lower limit probability derived from multi-valued mapping, and later developed by Shafer to make evidence theory a complete method for dealing with uncertainty problems [37]. It takes the BPA function instead of probability as a metric. In the D-S theory, Θ is used to represent an identification frame, which consists of a series of mutually exclusive objects, namely, [38]
Θ = θ 1 , θ 2 , , θ n ,
In this study, there are three identification frameworks for three kinds of geophysical data categories, and the objects in each identification framework are four uncertain expressions of effluent, namely, strand effluent, linear water, seepage and dripping water, and anhydrous. Where 2 Θ is the set composed of all subsets of Θ , and the BPA function φ is defined as the mapping of 2 Θ 0 , 1 , which satisfies the following [39]
A Θ   φ A = 1 φ = 0 0 φ A 1 ,   A Θ ,
where A is an arbitrary subset of the identification space and φ A represents the degree of trust in hypothesis set A in a certain environment. The three types of geophysical data were judged independently for their respective identification frames and then combined using the Dempster combination rule. The Dempster combination rule is defined as follows. Suppose φ 1 and φ 2 are two different BPA functions; then, their orthogonality sum φ = φ 1 φ 2 satisfies [40]
φ = 0 φ A = 1 K 1 × x y = A φ 1 x × φ 2 y
where, K = x η = ϕ   φ 1 x × φ 2 y , K is the conflict factor, which reflects the conflicting degree of the evidence; 1 K 1 is the normalization factor, and this combination rule is equivalent to assigning conflicts to each set in equal proportions in the combination. Classical D-S theory cannot resolve serious conflicts between evidence, such as evidence φ 1 :   φ 1 A = 0.9 , φ 1 B = 0.1 , φ 1 C = 0 and evidence φ 2 :   φ 2 A = 0 , φ 2 B = 0.9 , φ 1 C = 0.1 . The results after fusion are φ A = 0 , φ B = 1 , φ C = 0 , which is inconsistent with the actual situation. When combining multi-source geophysical data, owing to the subjectivity of manual interpretation, the results of different data identified as water outflow conditions can be completely contradictory; therefore, the evidence theory needs to be improved.
After a series of discoveries by Sun [41], when there are n number of evidence sources, the corresponding BPA functions are φ 1 , φ 2 , φ n . At this time, let the conflict coefficient between evidence sources i and j be k i j , and the improved D-S theory is as follows
φ ( ) = 0 φ A = p A + k ε q A , A , X φ X = p X + k ε q X + k 1 ε ,
In Equation (6),
p A = A 1 A 2 A n = A   φ 1 A 1 φ 2 A 2 φ n A n ,
k i j = A i A j =   φ i A i φ j A j = 1 A 1 A 2   φ i A i φ j A j ,
ε = e k ^ , k ^ = 2 n n 1 i < j   k i j ,
The equation holds that when there is a conflict between the evidence, some of the conflicting parts are still useful, and information other than useful is given to the unknown part, which is represented as the set X. ε indicates the credibility of the evidence, which is a useful part of the conflict. The larger ε is, the larger the useful information of the conflicting part.
Finally, the membership degrees obtained using different identification factors are used as the value of the probability distribution function for the fusion application of the improved evidence theory, and a more accurate prediction result can be obtained.

3. Results and Analysis

3.1. Study Area

A tunnel in China was selected as the study area, as shown in Figure 9. The tunnel exit section overlies the Quaternary system slope residual silty clay, coarse breccia, gravel soil, Quaternary Pleistocene moraine layer coarse (fine) breccia, gravel soil, and the soil layer is about 8–15 m thick. The underlying bedrock of the tunnel is coarse-grained biotite monzonitic granite with strong tectonics and active faults. In addition, two sets of shear conjugate joints are developed, which have different degrees of water conductivity and water abundance and are also the main migration and storage structures of mountain groundwater. The surrounding rock of the tunnel is mainly adamellite, dark gray, partly brownish yellow, and grayish white. It is mainly weakly weathered, with local strong weathering. The joint fissures are relatively developed and extend well.
The ridge of the mountain where the tunnel is located is cut by several northeast surface trenches. The experimental section is located in the part passing through the trench, which is conducive to rainfall or snow melting catchment and concentrated in-filtration. In terms of hydrogeology, the entrance of the tunnel is recharged by river tributaries, a water-rich strip is formed on the right side of the tunnel under the influence of river tributaries, and there is a direct hydraulic relationship. Therefore, the tunnel area has rich water-bearing conditions, which may also cause water inrush disasters. It is reasonable to select this tunnel as the experimental area to predict the quantitative water abundance in front of the tunnel face during excavation. The mileage of this section of the tunnel is 325~+ 234 m, and the advanced geological prediction method in the construction drawing design is geophysical (seismic wave reflection, geological radar, and transient electromagnetic methods).

3.2. Result of Effluent Condition

In the mileage sections 325~+ 234 m, the identification factors of the 13 parts changed. Therefore, a comprehensive prediction of water inrush was made for each part. Here, we took the first section, 352~+ 311 m, as an example to describe the experimental process in detail. Section 2.1 introduced the process and results of obtaining three types of data in this mileage section and briefly described the results of manual interpretation. Here, the improved fuzzy D-S theory model was used to fuse these three types of data and automatically obtain comprehensive results.
According to the corresponding membership function in Figure 6, the membership values of the three types of identification factors of the TSP data to the effluent fuzzy set are listed in Table 2. Using the fuzzy synthesis function, it was determined that the membership degree of the TSP data to fuzzy set A was μ A T S P = 0.099, fuzzy set B μ B T S P = 0.676 , fuzzy set C μ C T S P = 0.905 and fuzzy set D μ D T S P = 0.454 . The fuzzy set with the largest degree of membership was the effluent state identified by the TSP data. Combined with the results in Table 2, we can see that the recognition result of a single identification factor was different from the comprehensive membership degree of the fusion of multiple recognition factors.
Table 3 shows the membership values of three types of identification factors of GPR data to the effluent fuzzy set; similarly, μ A G P R = 0.700,   μ B G P R = 0.900 ,     μ C G P R = 0.633 , and μ D G P R = 0.433 . It can be seen that the identification result of GPR was different from that of the TSP. The recognition result of GPR was linear effluent, whereas TSP was seepage and dripping water.
Table 4 shows the membership value of the apparent resistivity identification factor of the TEM data to the effluent fuzzy set and directly obtained μ A T E M = 0.000,   μ B T E M = 0.655 ,     μ C T E M = 0.500 , μ D T E M = 0.050 . The prediction result of single TEM data was the same as the GPR data but different from the TSP data, and the membership value of strand effluent was zero.
In summary, for the identification framework Θ = {A, B, C, D}, the degree of support of different geophysical data for the water effluent situation is shown in Table 5.
The results were normalized and fused. The classical D-S theory, fuzzy D-S theory, and improved fuzzy D-S theory were used to fuse the data, and the fusion results are presented in Table 6.
Table 6 shows the fusion results of the fuzzy D-S theory and improved fuzzy D-S theory were all linear water. However, if the fuzzy D-S theory fusion method was used, because the BPA function value of TEM data to fuzzy set A was zero, no matter how large the values of TSP and GPR were, the final fusion result was still zero, which is contrary to the actual fusion situation.
When using the classical D-S theory fusion method, because the value of the BPA function depends on experience, it is highly likely that the BPA functions given by different interpreters would be different, resulting in contrasting results. The conclusions of the existing advance prediction reports are similar to those described in Section 2.1. The professionals can directly infer the water outflow state from different geophysical data according to the interpretation results, including strand water, linear water, seepage and dripping water, and anhydrous. Then, the conclusions of different geophysical data are fused with the classical D-S theory. Based on this, the fusion result here is strand water.
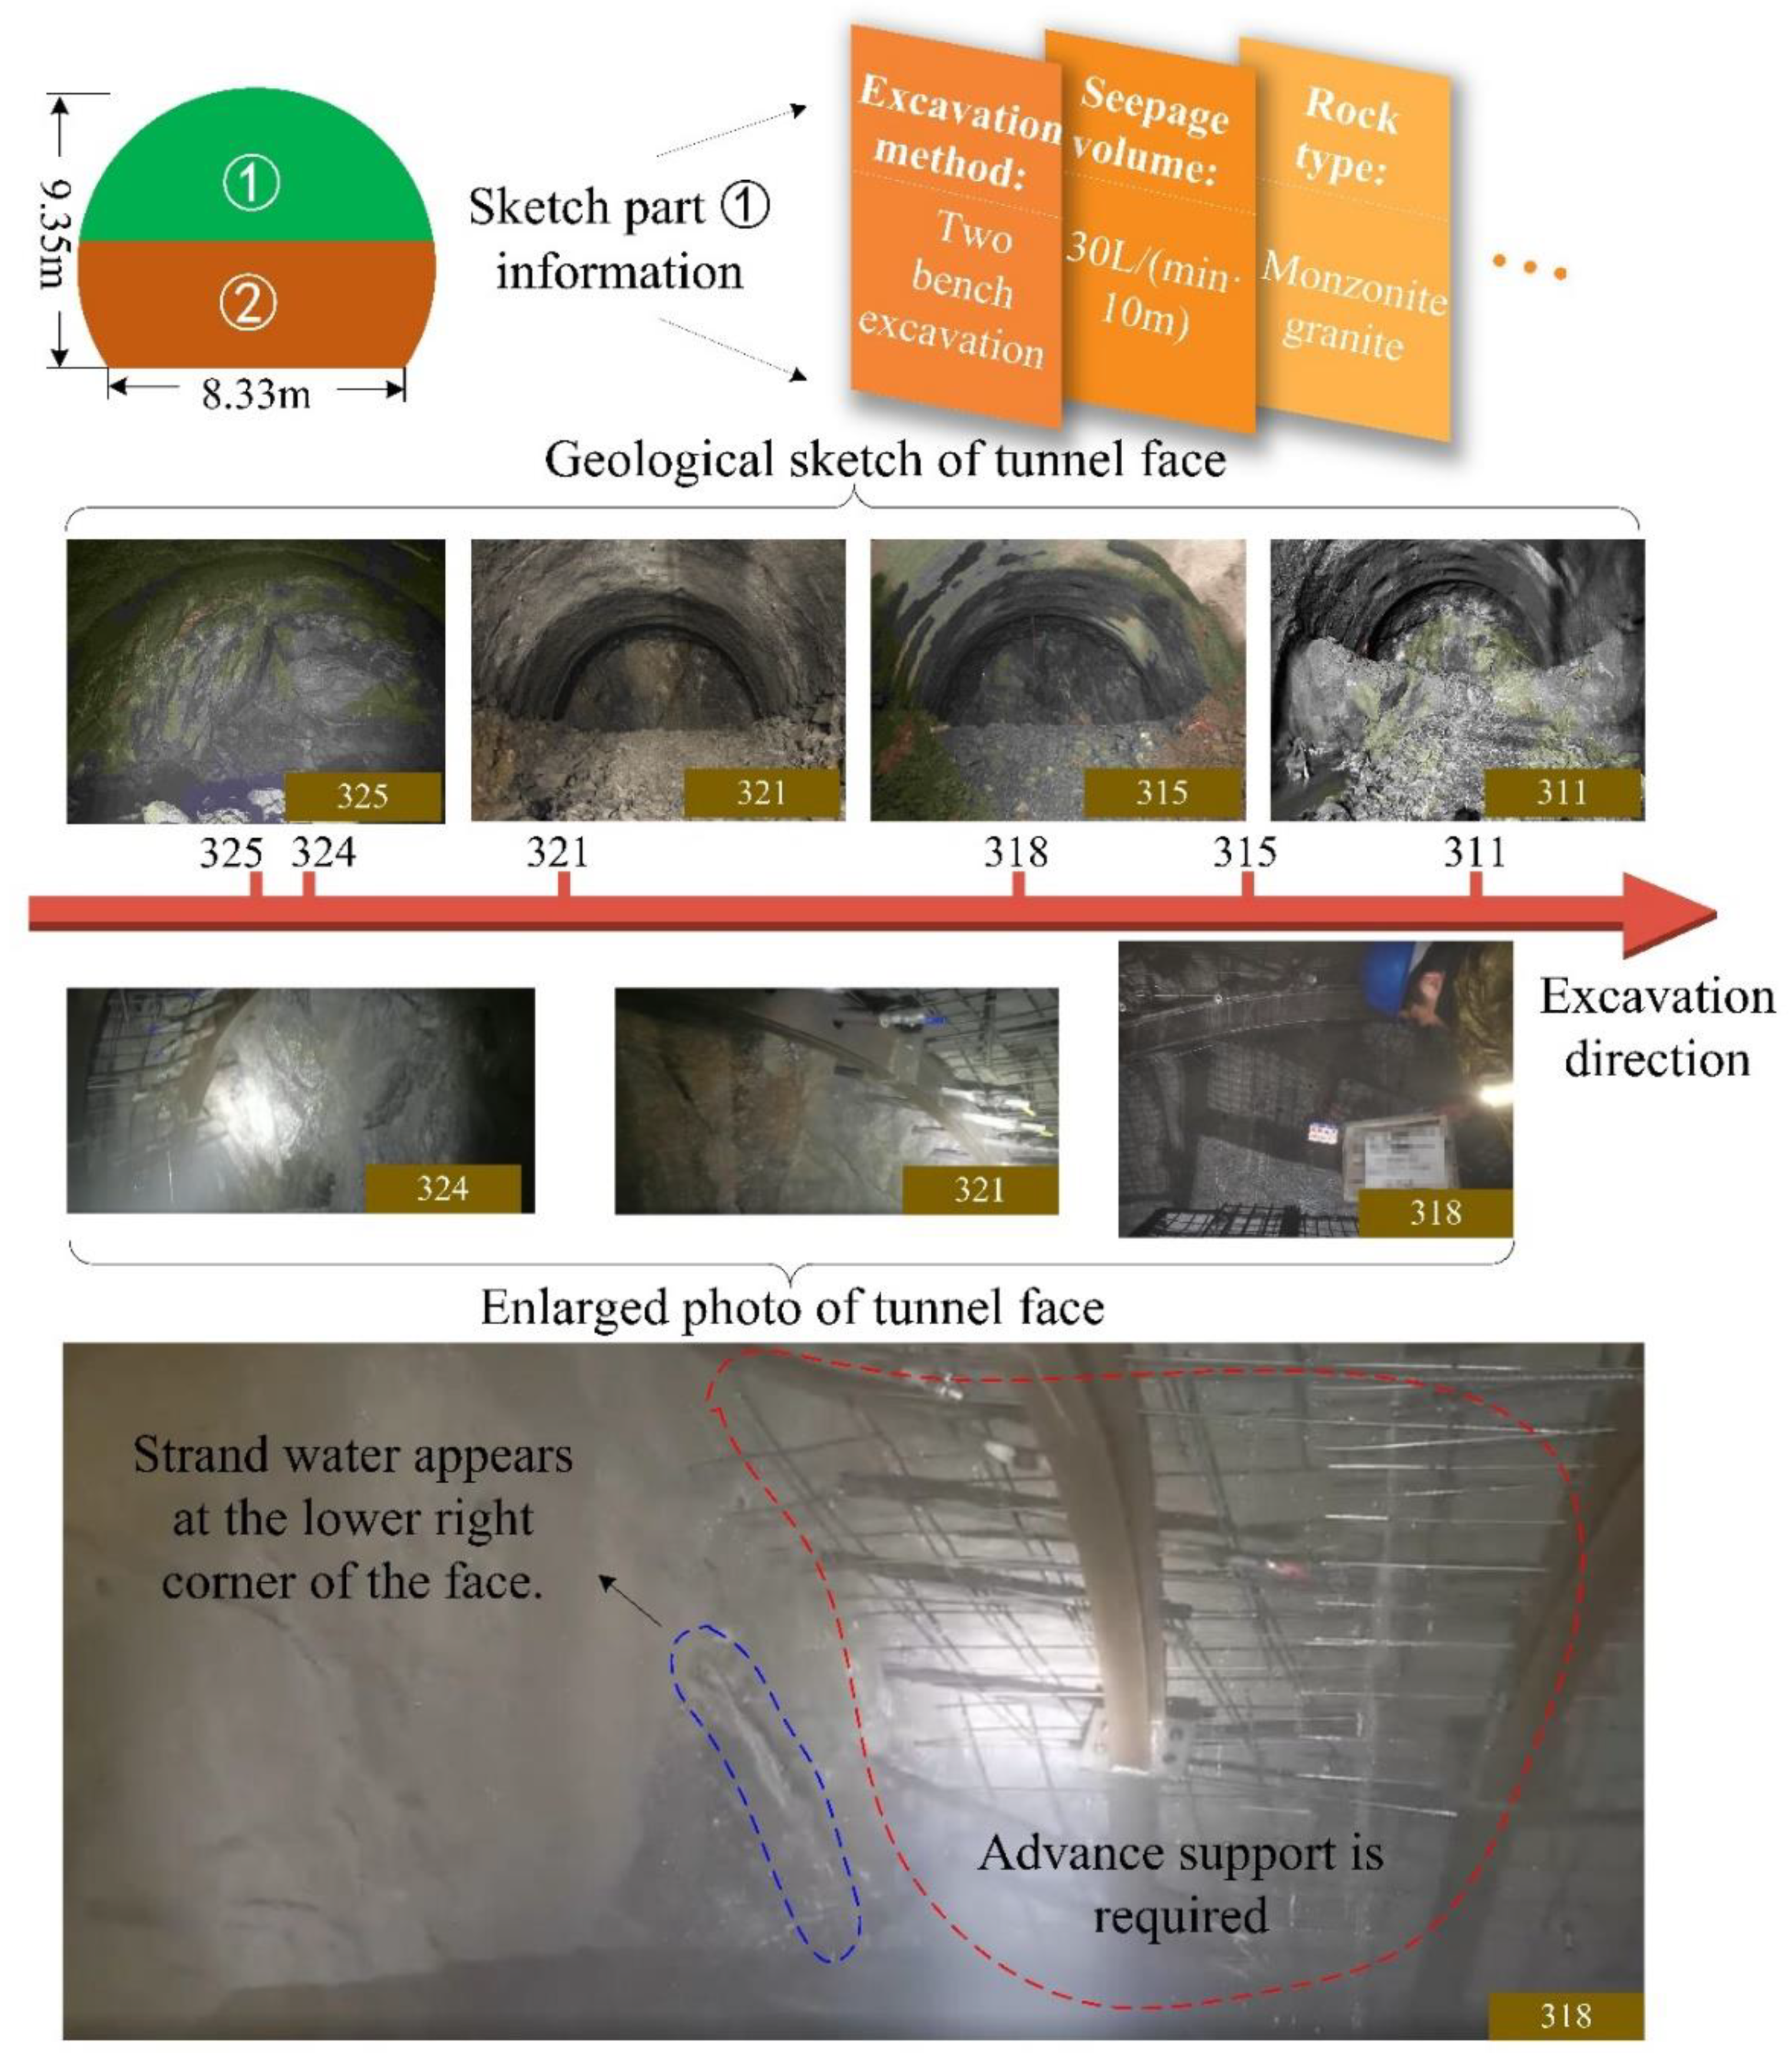
In this study, the water effluent conditions in this section were verified using the geological sketch of the tunnel face. The geological sketch of the tunnel face involves observing and recording the surrounding rock of the exposed tunnel, which mainly includes the size, state, rock strength, water gushing state, crack width, karst development degree, and design surrounding rock grade [42,43]. Therefore, the prediction results can be verified based on the water-gushing state. Figure 10 shows a part of the geological sketch of the face and the corresponding pictures in the mileage sections 325~+ 311 m. A two-step excavation method was adopted in this section of the tunnel, and the content of the report was a description of the geological conditions of the upper half of the tunnel face. The report indicated that the water output of this series of tunnel faces was approximately 30 L/(min·10 m), which was evaluated as a linear effluent and was consistent with the experimental results of the fusion model.
When the mileage was 318 m in Figure 10, the experimental results only showed that most of the water in this entire section was linear water, but there was still strand water in the lower right corner of the tunnel face. Although the amount of water was not large, advanced support was needed, such as leading a small conduit and pipe shed.
When the space between rock blocks is filled with water, the stability of the surrounding rock is reduced, and the tunnel is prone to deformation and instability collapse. Therefore, as an important unfavorable geological body that threatens the safety and efficient excavation of the tunnel, water-rich area requires more accurate control of the effluent in front of the tunnel. The fusion method proposed in this study can effectively predict the water outflow to reduce the occurrence of water inrush during tunnel construction.
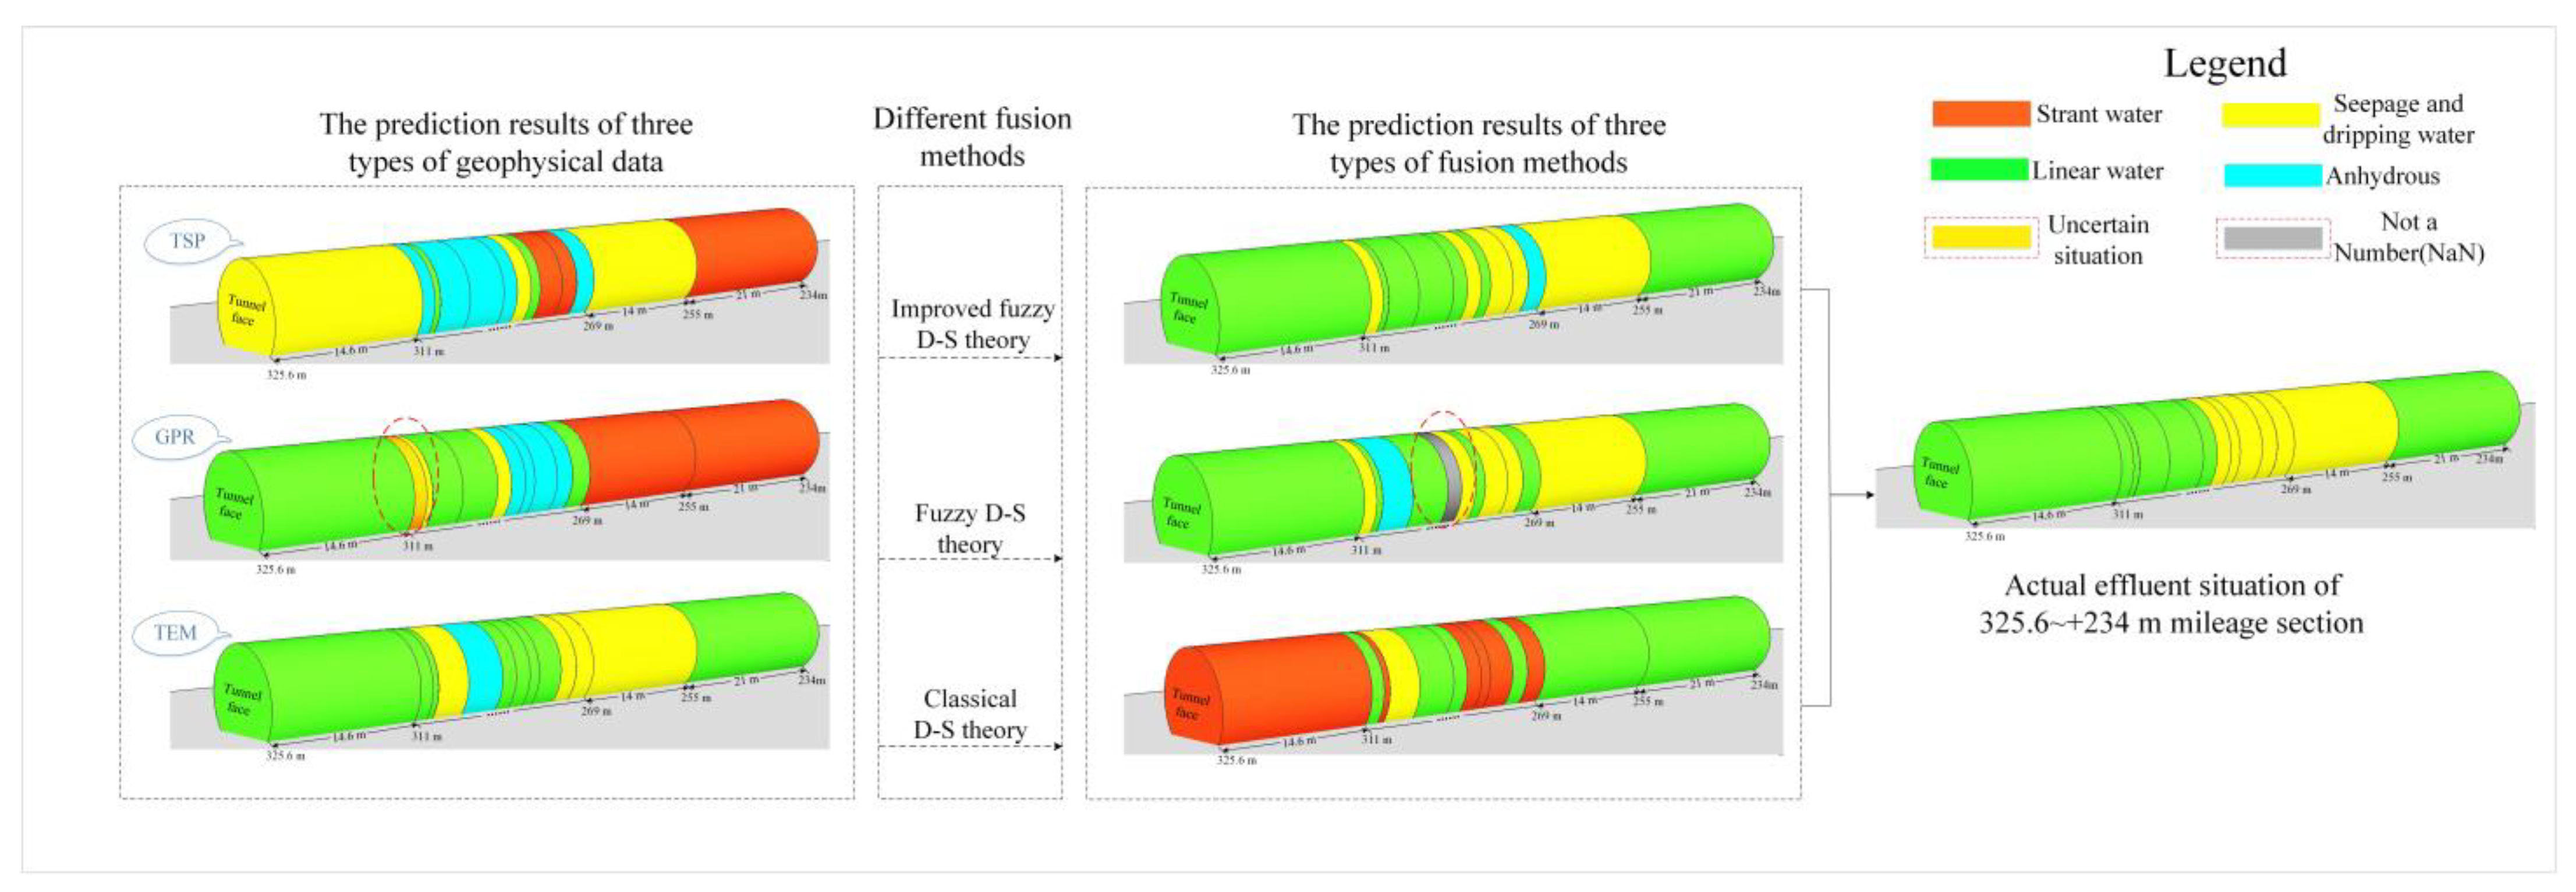
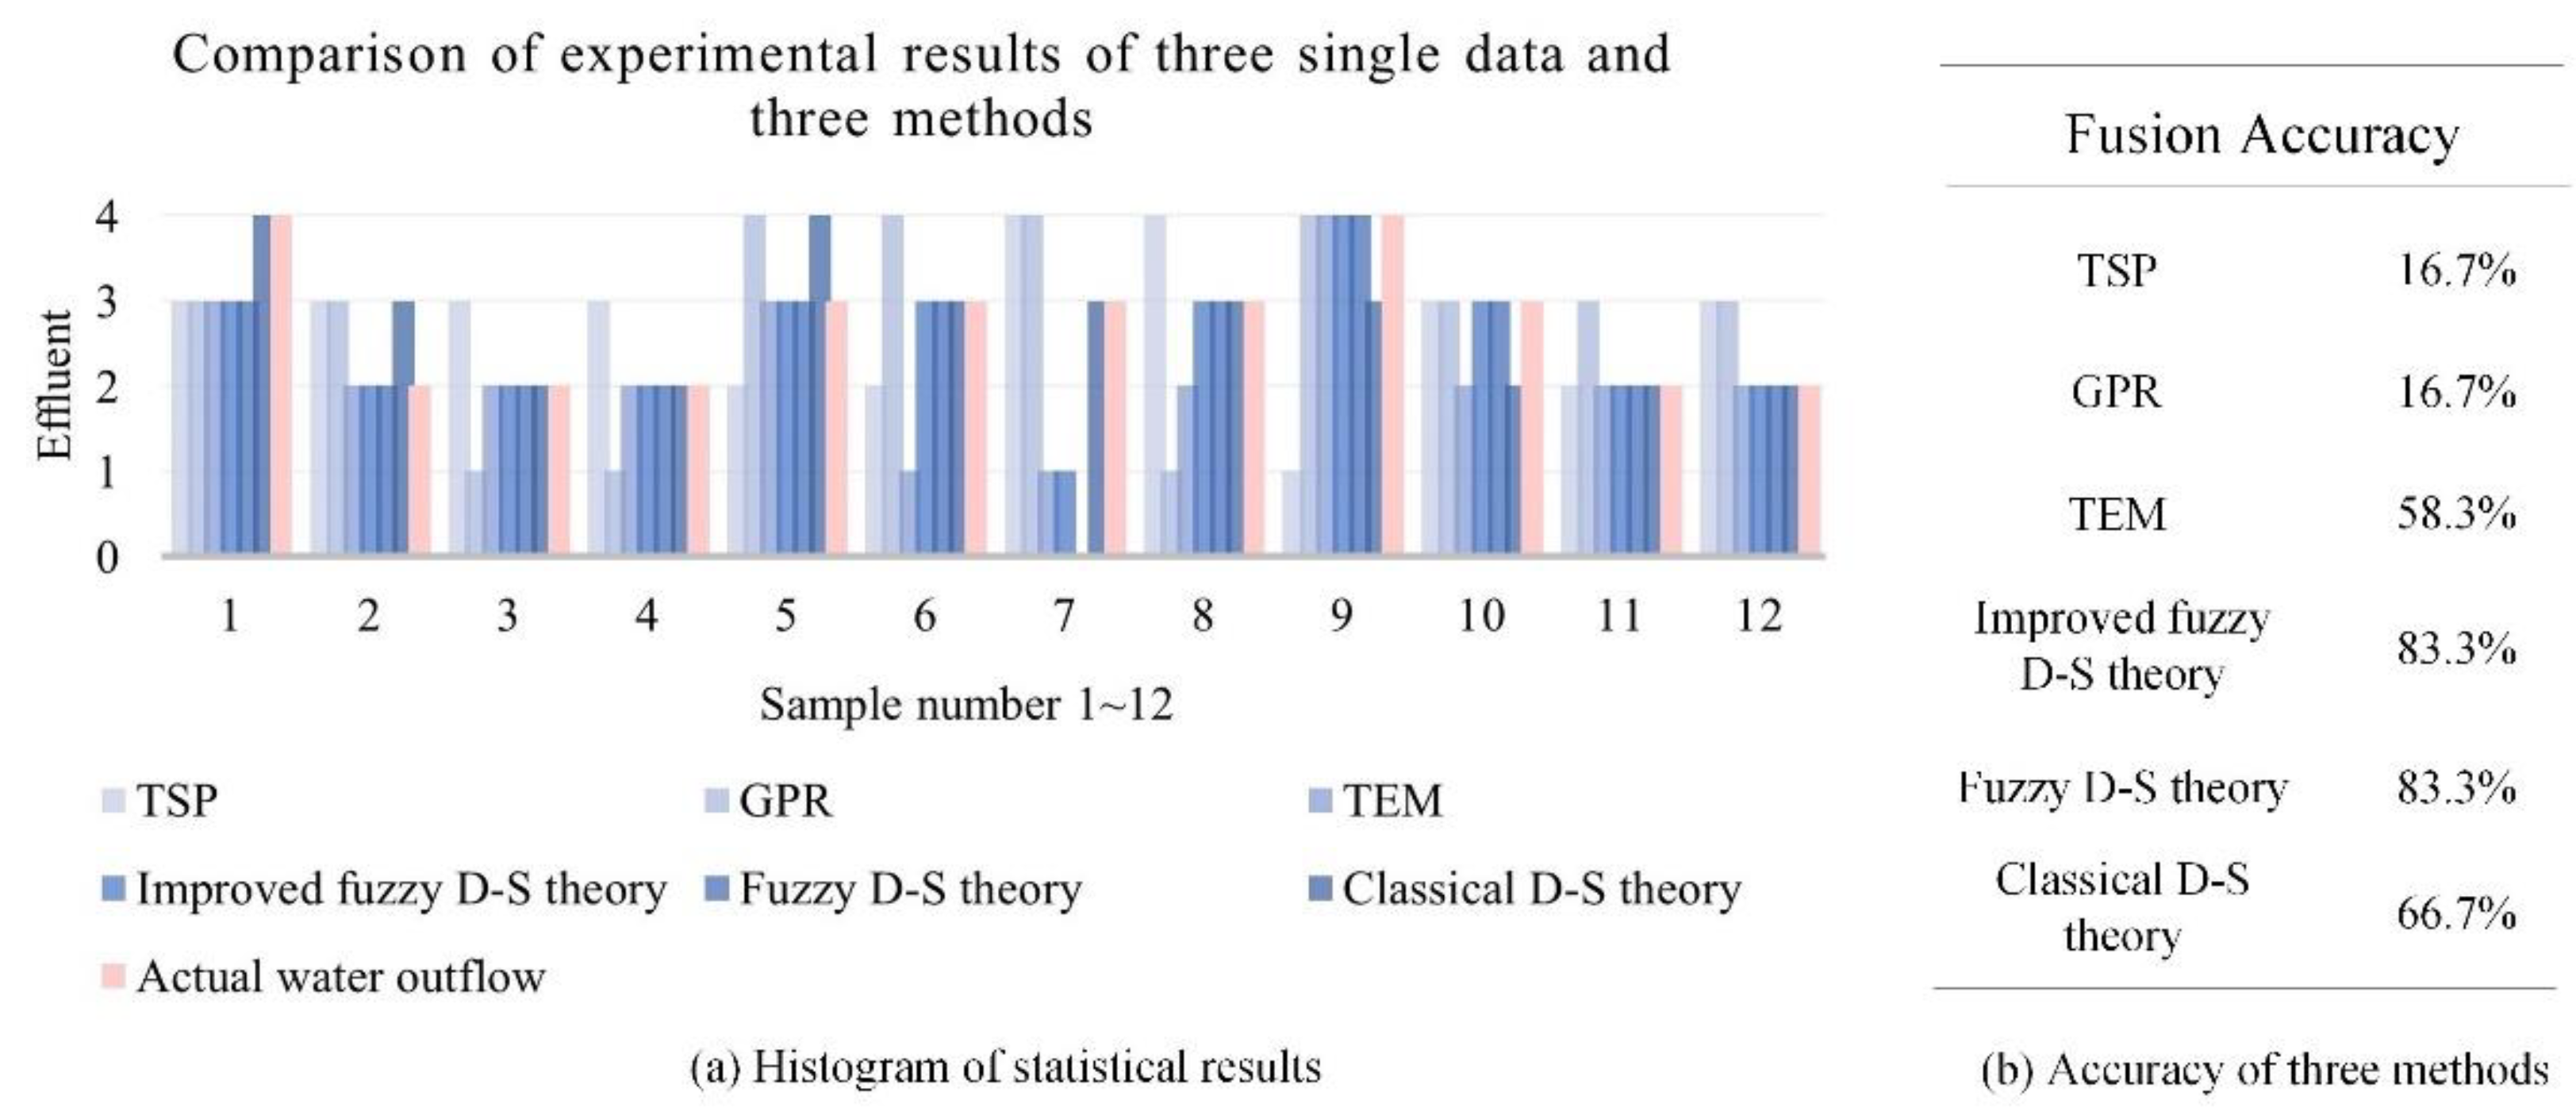
Here, is a detailed explanation of the prediction process for the 325~+ 311 m mileage segments. Figure 11 shows all the prediction results of the 325~+ 234 m mileage segments, including the single prediction result of each geophysical dataset and the prediction results of the three different methods. It can be observed that our method has a higher fusion accuracy than the other methods. In fact, the accuracy of the fuzzy D-S theory was very close to that of our proposed method, but there is a situation where it cannot handle conflicts, resulting in a lack of robustness.

4. Discussion

In the experimental part, the 325~+ 311 mileage section was selected to predict the effluent, and it was concluded that the improved fuzzy D-S theory prediction model proposed in this study was consistent with the actual situation, while the fuzzy D-S theory could not make a reasonable prediction of the evidence, and the traditional D-S theory was less accurate.
To generalize the results, three methods were used to predict the effluent of another 12 random sections; the predicted results are shown in Figure 12. Figure 12a shows the histogram of the statistical results. The abscissa was 12 sets of mileage data, and ordinates 1–4 corresponded to anhydrous water, seepage and dripping water, linear water, and strand water, respectively. The results of the three single geophysical data and the three fusion methods were compared to those of the actual effluent. From the accuracy results in Figure 12b, the prediction accuracy of TEM was higher than that of TSP and GPR data, but lower than that of other fusion methods. Then, the improved fuzzy D-S theory was the same as the fuzzy D-S theory. However, the fuzzy D-S theory fusion result of the seventh group of samples was not a number (NaN). This was because the denominator was zero when calculating the attribution factor, which made the calculation meaningless. This situation was caused by the conflict of prediction results between different geophysical data, which was avoided by the improved fuzzy D-S theory. However, the BPA function of the classical D-S theory was based on the experience of on-site interpreters, making the prediction results unstable and fluctuating, and the accuracy was only 66.7%.
Similarly, according to the comparative experiments of these 12 groups, it was proven that the method proposed in this paper is feasible for the fusion of multi-source tunnel geophysical data and has high accuracy and robustness. In general, from the experimental results of 12 groups randomly selected here and the tunnel mileage section selected in Section 3.2, the method proposed in this study has good performance in predicting water yield and is superior to the prediction results of single geophysical data and other fusion methods. Moreover, since the BPA value was obtained based on the change degree of different identification factors relative to the tunnel face, this fusion method is applicable to different surrounding rock lithology, and only needs to obtain the identification factor value at the tunnel’s face. Therefore, the prerequisite for the use of this method is the correct acquisition of the initial identification factor, which is suitable for different tunnel environments.

5. Conclusions

To predict tunnel water inrush geological disasters, we proposed a prediction model combining multi-source geophysical exploration data to solve the discrepancy between the prediction results and reality caused by the subjectivity and uncertainty of traditional single data. Compared to single data, the fusion results were more dependable and stable. In addition, the fusion model proposed in this study has great practical value in several aspects.
  • The model improves the automation of geophysical data interpretation and can reduce the number of interpreters used in tunnel construction, thus reducing cost.
  • The results of this study can also be used as auxiliary reference information for interpreters, prompting the careful examination of problems when the conclusions of the model are inconsistent with those of interpreters.
  • The prediction results of the water effluent obtained by the model in this study have high accuracy, robustness, and important reference values for practical engineering applications.

Author Contributions

Conceptualization, Y.D. and B.Y.; methodology, B.Y.; software, B.Y.; validation, B.Y.; investigation and visualization, B.Y.; resources, G.X.; writing—original draft preparation, B.Y.; writing—review and editing, Y.D.; supervision, Y.D., B.Y., G.X. and X.W.; funding acquisition, Y.D. All authors have read and agreed to the published version of the manuscript.

Funding

This research was funded in part by the Project of Science and Technology Research and Development Plan of China National Railway Group Co., Ltd. (Project No. K2021G027), in part by the Science and Technology for the Sichuan-Tibet Railway Special Project (XZ202101ZD0001G).

Data Availability Statement

The synthetic data underlying this article will be shared upon reasonable request to the corresponding author.

Acknowledgments

We would like to thank the editor and reviewers for spending time reading this manuscript and giving us valuable suggestions.

Conflicts of Interest

The authors declare no conflict of interest.

References

  1. Chen, X.-S.; Xu, Z.-H.; Bao, X.-H.; Wang, W.-T.; Fu, Y.-B. Challenges and technological breakthroughs in tunnel construction in China. China J. Highw. Transp. 2020, 33, 1. [Google Scholar]
  2. Qian, Q.; Lin, P. Safety risk management of underground engineering in China: Progress, challenges and strategies. J. Rock Mech. Geotech. Eng. 2016, 8, 423–442. [Google Scholar] [CrossRef] [Green Version]
  3. Sun, W.; Liang, Q.; Qin, S.; Yuan, Y.; Zhang, T. Evaluation of groundwater effects on tunnel engineering in loess. Bull. Eng. Geol. Environ. 2021, 80, 1947–1962. [Google Scholar] [CrossRef]
  4. Zhu, Y.; Zhou, J.; Zhang, B.; Wang, H.; Huang, M. Statistical analysis of major tunnel construction accidents in China from 2010 to 2020. Tunn. Undergr. Space Technol. 2022, 124, 104460. [Google Scholar] [CrossRef]
  5. Li, S.; Liu, B.; Xu, X.; Nie, L.; Liu, Z.; Song, J.; Sun, H.; Chen, L.; Fan, K. An overview of ahead geological prospecting in tunneling. Tunn. Undergr. Space Technol. 2017, 63, 69–94. [Google Scholar] [CrossRef]
  6. Xu, L.; Zhang, J.-q.; Qi, Z.-f. Comparison research on comprehensive advanced geological prediction of hydraulic tunnels. Prog. Geophys. 2018, 33, 411–417. [Google Scholar]
  7. Shi, S.; Xie, X.; Tian, S.; Wen, Z.; Bu, L.; Zhou, Z.; Song, S.; Zhao, R. Advanced geological prediction. In Tunnel Engineering-Selected Topics; IntechOpen: London, UK, 2019. [Google Scholar]
  8. Chalikakis, K.; Plagnes, V.; Guerin, R.; Valois, R.; Bosch, F.P. Contribution of geophysical methods to karst-system exploration: An overview. Hydrogeol. J. 2011, 19, 1169–1180. [Google Scholar] [CrossRef]
  9. Chen, Y.-l.; Gan, F.-p.; Lu, C.-j.; Wei, J.-y.; Zhao, W. The study of underground river course detection by integrated geophysical methods in bare karst area. Prog. Geophys. 2013, 28, 1608–1616. [Google Scholar]
  10. Xue, G.-q.; Pan, D.-m.; Yu, J.-c. Review the applications of geophysical methods for mapping coal-mine voids. Prog. Geophys. 2018, 33, 2187–2192. [Google Scholar]
  11. Lu, T.; Liu, S.-d.; Wang, B. Application of integrated mining geophysical method in detection of water-bearing faults. Prog. Geophys. 2015, 30, 1371–1375. [Google Scholar]
  12. Lu, T.; Liu, S.; Wang, B.; Wu, R.; Hu, X. A review of geophysical exploration technology for mine water disaster in China: Applications and trends. Mine Water Environ. 2017, 36, 331–340. [Google Scholar] [CrossRef]
  13. Pugin, A.J.M.; Pullan, S.E.; Hunter, J.A.; Oldenborger, G.A. Hydrogeological prospecting using P-and S-wave landstreamer seismic reflection methods. Near Surf. Geophys. 2009, 7, 315–328. [Google Scholar] [CrossRef]
  14. Brossier, R.; Operto, S.; Virieux, J. Velocity model building from seismic reflection data by full-waveform inversion. Geophys. Prospect. 2015, 63, 354–367. [Google Scholar] [CrossRef]
  15. Choudary, K.; Dickmann, T. 3D-TSP–Advanced geological prediction during construction of hydro tunnels in the Himalayas. In Proceedings of the Indo-Rock Conference, Mumbai, India, 17–18 June 2016. [Google Scholar]
  16. Annan, A. Electromagnetic principles of ground penetrating radar. Ground Penetrating Radar Theory Appl. 2009, 1, 1–37. [Google Scholar]
  17. Xue, G.; Li, H.; He, Y.; Xue, J.; Wu, X. Development of the inversion method for transient electromagnetic data. IEEE Access 2020, 8, 146172–146181. [Google Scholar] [CrossRef]
  18. Shi, S.; Bu, L.; Li, S.; Xiong, Z.; Xie, X.; Li, L.; Zhou, Z.; Xu, Z.; Ma, D. Application of comprehensive prediction method of water inrush hazards induced by unfavourable geological body in high risk karst tunnel: A case study. Geomat. Nat. Hazards Risk 2017, 8, 1407–1423. [Google Scholar] [CrossRef]
  19. Bu, L.; Li, S.; Shi, S.; Li, L.; Zhao, Y.; Zhou, Z.; Nie, L.; Sun, H. Application of the comprehensive forecast system for water-bearing structures in a karst tunnel: A case study. Bull. Eng. Geol. Environ. 2019, 78, 357–373. [Google Scholar] [CrossRef]
  20. Huang, C.-f.; Zhang, S.-l.; Wu, S.-c.; Gao, Y.-t. Research and application of a comprehensive forecasting system for tunnels in water-bearing fault fracture zones: A case study. Arab. J. Geosci. 2022, 15, 171. [Google Scholar] [CrossRef]
  21. Kuang, Y.; Li, L. Speech emotion recognition of decision fusion based on DS evidence theory. In Proceedings of the 2013 IEEE 4th International Conference on Software Engineering and Service Science, Beijing, China, 23–25 May 2013; pp. 795–798. [Google Scholar]
  22. Yan, R.; Li, G.; Liu, B. Knowledge fusion based on DS theory and its application on Expert System for software fault diagnosis. In Proceedings of the 2015 Prognostics and System Health Management Conference (PHM), Beijing, China, 21–23 October 2015; pp. 1–5. [Google Scholar]
  23. Li, Y.; Chen, J.; Ye, F.; Liu, D. The improvement of DS evidence theory and its application in IR/MMW target recognition. J. Sens. 2016, 2016, 1903792. [Google Scholar] [CrossRef] [Green Version]
  24. Chen, Y.; Wen, G.; Dong, X.; Zhang, Z. Research on rotor condition monitoring based on DS evidence theory. In Proceedings of the 2016 13th International Conference on Ubiquitous Robots and Ambient Intelligence (URAI), Xi’an, China, 19–22 August 2016; pp. 848–853. [Google Scholar]
  25. Wang, H.; Guo, L.; Dou, Z.; Lin, Y. A new method of cognitive signal recognition based on hybrid information entropy and DS evidence theory. Mob. Netw. Appl. 2018, 23, 677–685. [Google Scholar] [CrossRef]
  26. Gong, Y.; Su, X.; Qian, H.; Yang, N. Research on fault diagnosis methods for the reactor coolant system of nuclear power plant based on DS evidence theory. Ann. Nucl. Energy 2018, 112, 395–399. [Google Scholar] [CrossRef]
  27. Jiang, W.; Yang, Y.; Luo, Y.; Qin, X. Determining basic probability assignment based on the improved similarity measures of generalized fuzzy numbers. Int. J. Comput. Commun. Control 2015, 10, 333–347. [Google Scholar] [CrossRef]
  28. Tang, Y.; Wu, D.; Liu, Z. A new approach for generation of generalized basic probability assignment in the evidence theory. Pattern Anal. Appl. 2021, 24, 1007–1023. [Google Scholar] [CrossRef]
  29. Rasol, M.; Pérez-Gracia, V.; Fernandes, F.M.; Pais, J.C.; Santos-Assunçao, S.; Roberts, J.S. Ground Penetrating Radar System: Principles. Handb. Cult. Herit. Anal. 2022, 25, 705–738. [Google Scholar]
  30. Liu, B.; Zhang, F.; Li, S.; Li, Y.; Xu, S.; Nie, L.; Zhang, C.; Zhang, Q. Forward modelling and imaging of ground-penetrating radar in tunnel ahead geological prospecting. Geophys. Prospect. 2018, 66, 784–797. [Google Scholar] [CrossRef]
  31. Li, R.; Hu, X.; Xu, D.; Liu, Y.; Yu, N. Characterizing the 3D hydrogeological structure of a debris landslide using the transient electromagnetic method. J. Appl. Geophys. 2020, 175, 103991. [Google Scholar] [CrossRef]
  32. Yu, C.; Liu, X.; Liu, J.; Li, E.; Yue, P.; Yan, S. Application of transient electromagnetic method for investigating the water-enriched mined-out area. Appl. Sci. 2018, 8, 1800. [Google Scholar] [CrossRef]
  33. Zadeh, L.A. Fuzzy sets. Inf. Control 1965, 8, 338–353. [Google Scholar] [CrossRef] [Green Version]
  34. Jones, A.; Kaufmann, A.; Zimmermann, H.-J. Fuzzy Sets Theory and Applications; Springer Science & Business Media: Berlin/Heidelberg, Germany, 2012; Volume 177. [Google Scholar]
  35. Liu, N.; Zou, S.; Huang, B. Research on optimal maintenance cycle model of nuclear equipment based on left and right fuzzy sorting method. In Proceedings of the IOP Conference Series: Earth and Environmental Science, Raipur, India, 25–26 February 2022; p. 012095. [Google Scholar]
  36. Li, H.; Wang, P. Fuzzy Mathematics; National Defence Industry Press: Beijing, China, 1994. [Google Scholar]
  37. Shafer, G. Dempster-shafer theory. Encycl. Artif. Intell. 1992, 1, 330–331. [Google Scholar]
  38. Sentz, K.; Ferson, S. Combination of Evidence in Dempster-Shafer Theory, Sandia Report No: SAND2002-0835; Sandia National Laboratories: Albuquerque, NH, USA, 2002.
  39. Qi, X.-M.; Zhang, S.-C. Application of seismic multi-attribute fusion method based on DS evidence theory in prediction of CBM-enriched area. Appl. Geophys. 2012, 9, 80–86. [Google Scholar] [CrossRef]
  40. Ye, F.; Chen, J.; Li, Y.; Kang, J. Decision-making algorithm for multisensor fusion based on grey relation and DS evidence theory. J. Sens. 2016, 2016, 3954573. [Google Scholar] [CrossRef] [Green Version]
  41. Sun, Q.; Ye, X.-Q.; Gu, W.-k. A new combination rules of evidence theory. Acta Electonica Sin. 2000, 28, 117. [Google Scholar]
  42. Qiu, W.; Jian, L.; Cheng, Y.; Bai, H. Three-Dimensional Reconstruction of Tunnel Face Based on Multiple Images. Adv. Civ. Eng. 2021, 2021, 8837309. [Google Scholar] [CrossRef]
  43. Yusoff, I.N.; Ismail, M.A.M.; Tobe, H.; Date, K.; Yokota, Y. Quantitative granitic weathering assessment for rock mass classification optimization of tunnel face using image analysis technique. Ain Shams Eng. J. 2022, 14, 101814. [Google Scholar] [CrossRef]
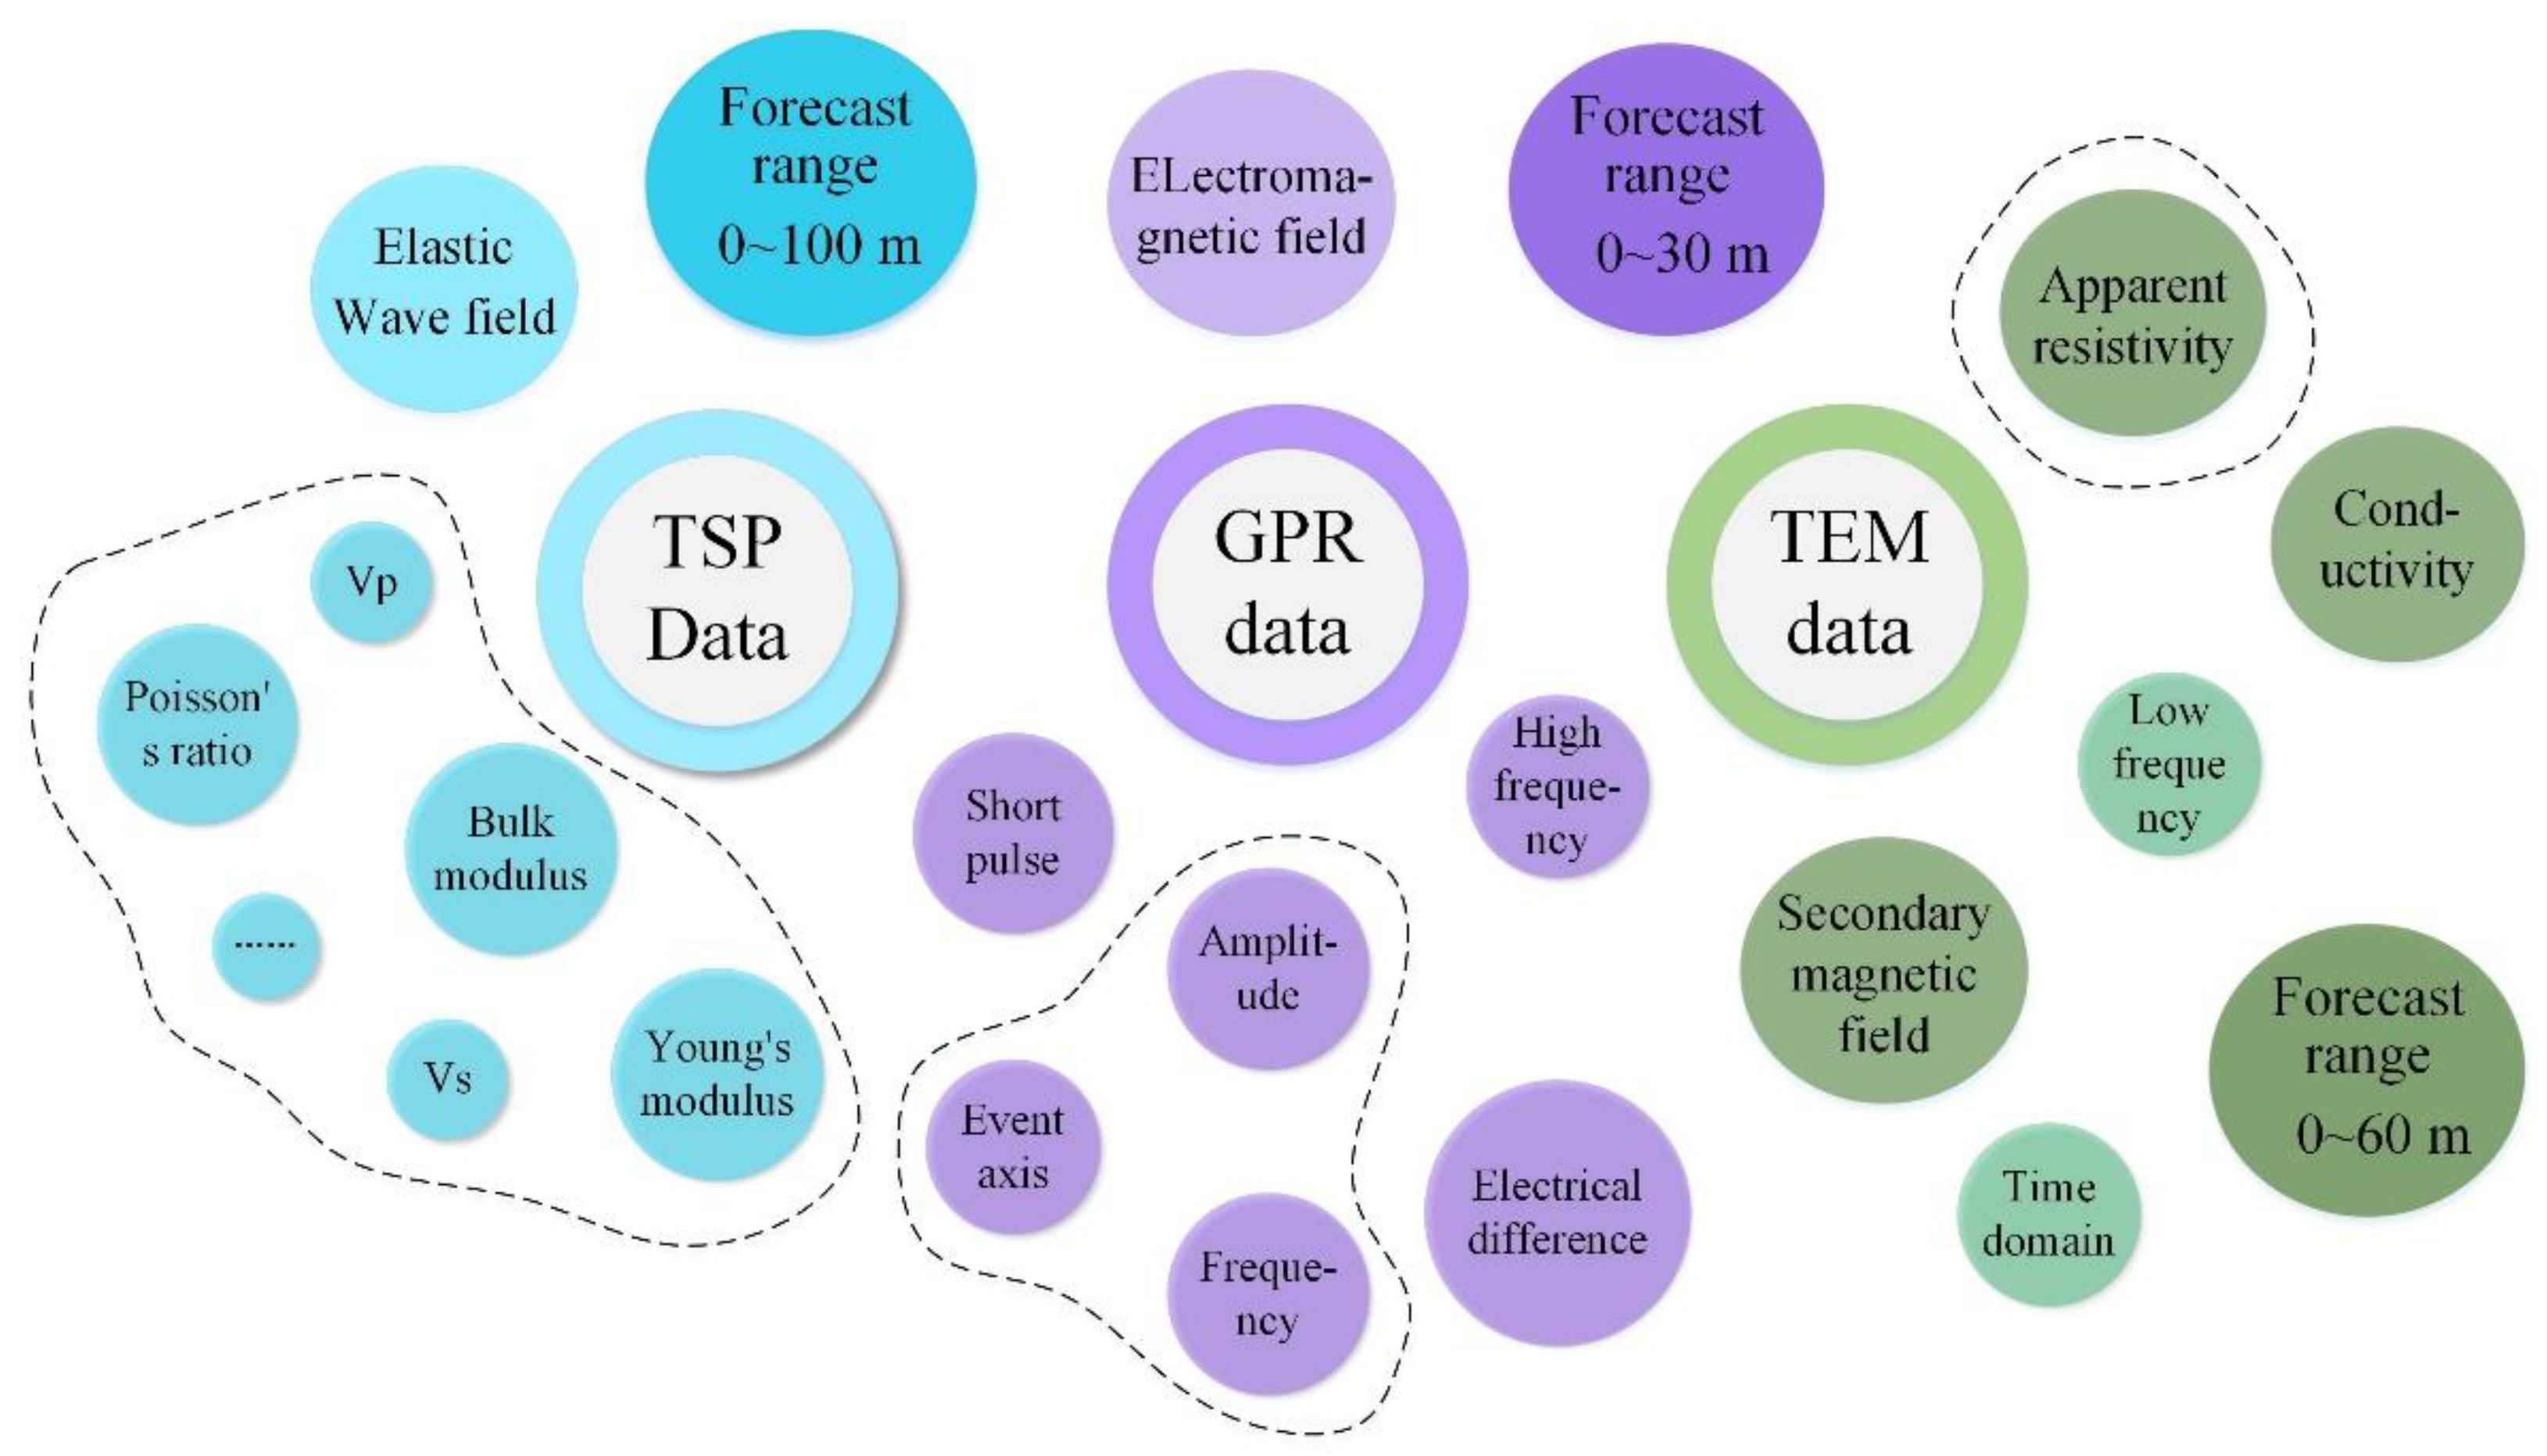
Figure 1. Features of multi-source geophysical data.
Remotesensing 14 06178 g001
Figure 2. Schematic diagram of the TSP observation system.
Remotesensing 14 06178 g002
Figure 3. Mileage 325.6~+ 234 segment TSP output result.
Remotesensing 14 06178 g003
Figure 4. Mileage 325.6~+ 311 segment TSP output result.
Remotesensing 14 06178 g004
Figure 5. The working principle of the transient electromagnetic method.
Remotesensing 14 06178 g005
Figure 6. Transient electromagnetic prediction of the 305.2~+ 235 m mileage section.
Remotesensing 14 06178 g006
Figure 7. Transient electromagnetic prediction of the 305.2~+ 235 m mileage section.
Remotesensing 14 06178 g007
Figure 8. Membership functions of different identification factors.
Remotesensing 14 06178 g008
Figure 9. Study area location.
Remotesensing 14 06178 g009
Figure 10. Geological sketch of a series of tunnel face in the mileage 325~+ 311 m.
Remotesensing 14 06178 g010
Figure 11. Prediction results of the effluent conditions for mileage 325~+ 234 m.
Remotesensing 14 06178 g011
Figure 12. Three methods to predict the water output of 12 sections.
Remotesensing 14 06178 g012
Table 1. Membership degree of GPR identification factors to effluent fuzzy sets.
Discriminating FactorDegreeStrand
Water (A)
Linear
Water (B)
Seepage and Dripping Water (C)Anhydrous
(D)
Amplitude changes of the reflected wave signalFairly obvious0.20.10.40.8
Quite obvious0.60.90.60.2
Very obvious0.90.70.60.4
The continuity of the event axisPoor0.90.60.30.4
Quite poor0.80.90.70.6
Quite continuous0.30.20.80.8
Continuous0.10.10.10.6
Reflected wave signal strengthStrong0.90.50.10.1
Relatively strong0.70.90.60.5
Normal0.30.30.60.9
Table 2. Membership degree of TSP identification factors to fuzzy sets.
Mileage SectionDiscriminating FactorStrand Water (A)Linear Water (B)Seepage and Dripping Water (C)Anhydrous (D)
325~+ 311 m v s ( x 1 )0.0000.1800.8150.312
v p / v s x 2 0.0860.9600.9840.257
Poisson’s ratio ( x 3 )0.2120.8880.9160.794
Table 3. Membership degree of GPR identification factors to fuzzy sets.
Mileage SectionDiscriminating FactorStrand Water (A)Linear Water (B)Seepage and Drip-Ping Water (C)Anhydrous(D)
325~+ 311 mAmplitude change in reflected wave signal ( y 1 )0.6000.9000.6000.200
In-phase axis continuity ( y 2 )0.8000.9000.7000.600
Reflected wave signal strength ( y 3 )0.7000.9000.6000.500
Table 4. Membership degree of GPR identification factors to fuzzy sets.
Mileage SectionDiscriminating FactorStrand Water (A)Linear Water (B)Seepage and Drip-Ping Water (C)Anhydrous (D)
325~+ 311 mApparent resistivity (z)0.0000.6550.5000.050
Table 5. Support degree of different geophysical data for water abundance.
Geophysical DataWater Abundance
Strand Water (A)Linear Water (B)Seepage and Drip-Ping Water (C)Anhydrous (D)
TSP0.0990.6760.9050.454
GPR0.7000.9000.6330.433
TEM0.0000.6550.5000.050
Table 6. Fusion results from the three different methods.
Fusion MethodWater Abundance Fusion Results
Strand Water (A)Linear Water (B)Seepage and Drip-Ping Water (C)Anhydrous
(D)
Unknown Proposition (X)
Classical D-S theory0.5050.3930.1000.002/
Fuzzy D-S theory0.0000.5740.4120.014/
Improved fuzzy D-S theory0.0460.2360.2020.0630.448
Publisher’s Note: MDPI stays neutral with regard to jurisdictional claims in published maps and institutional affiliations.