Technical Note

Near-Field 3D Sparse SAR Direct Imaging with Irregular Samples

1
College of Electronic Science and Technology, National University of Defense Technology, Changsha 410073, China
2
The State Key Laboratory of Astronaute Dynamics Xi’an, Xi’an 710000, China
*
Author to whom correspondence should be addressed.
These authors contributed equally to this work.
Remote Sens. 2022, 14(24), 6321; https://doi.org/10.3390/rs14246321
Submission received: 31 October 2022 / Revised: 27 November 2022 / Accepted: 9 December 2022 / Published: 13 December 2022

Abstract

:
Sparse imaging is widely used in synthetic aperture radar (SAR) imaging. Compared with the traditional matched filtering (MF) methods, sparse SAR imaging can directly image the scattered points of a target and effectively reduce the sidelobes and clutter in irregular samples. However, in view of the large-scale computational complexity of sparse reconstruction with raw echo data, traditional sparse reconstruction algorithms often require huge computational expense. To solve the above problems, in this paper, we propose a 3D near-field sparse SAR direct imaging algorithm for irregular trajectories, adopting a piece of preliminary information in the SAR image to update the dictionary matrix dimension, using the Gaussian iterative method, and optimizing the signal-processing techniques, which can achieve 3D sparse reconstruction in a more direct and rapid manner. The proposed algorithm was validated through simulations and empirical study of irregular scanning scenarios and compared with traditional MF and sparse reconstruction methods, and was shown to significantly reduce the computation time and effectively preserve the complex information of the scenes to achieve high-resolution image reconstruction.

1. Introduction

Traditional near-field synthetic aperture radar (SAR) imaging systems and security scanners use high-precision motion control devices to build ideal regular synthetic arrays to achieve imaging [1,2], which is limited by the Nyquist sampling theorem. The amount of echo data acquired by applying this regime is large and the acquisition time is high. In contrast, a near-field imaging system with an irregular sampling method has the advantages of high flexibility, low cost, and various application scenarios. In addition, with the emergence of the new generation of millimeter-wave (mmWave) devices, near-field synthetic aperture radar (SAR) imaging has moved from indoor scenarios such as medical diagnostics [3,4], gesture recognition [5,6], nondestructive testing (NDT) [7,8], and concealed threat detection [9,10] to many new application scenarios and has attracted wide attention. However, several scenarios, such as unmanned aerial vehicle (UAV) SAR [11,12,13,14], automotive SAR [15,16,17], and freehand imaging [18,19,20] remain hampered by irregular scanning geometries that do not conform to the classic array geometries needed for high-resolution image reconstruction algorithms.
Previous work has proposed the use of traditional imaging methods for irregular SAR geometric arrays, such as the back-projection algorithm (BPA) [21,22,23] and the nonuniform fast Fourier-transform range-migration algorithm (NUFFT-RMA) [24,25,26,27,28]. These two algorithms belong to the time-domain and frequency-domain imaging algorithms, respectively, which are essentially imaging-optimization algorithms within the framework of matched filtering (MF). The traditional MF method, as a simple linear filtering process, is limited by the system bandwidth and Nyquist sampling theorem, which make it hard to break the Rayleigh boundary without exploiting any prior information. Moreover, the primary lobes’ expansion, higher sidelobes, and grating lobes inevitably occur in the case of sparse data cubes and a large amount of coherent speckle noise appears in the image, resulting in the degradation of SAR image quality.
In the past few decades, many methods have been developed to suppress the sidelobes/grating lobes and enhance the radar image, such as coherence factor (CF)-like methods [29,30] and sparsity recovery [22,31,32,33]. The CF algorithm can effectively suppress sidelobes/grating lobes and clutter by masking the target image with the coherence factor. However, it also weakens the weak targets around strong targets. Based on the CF algorithm, some scholars have also proposed related improvement methods, such as the exponential phase coherence factor (EPCF) method based on the phase difference of each channel echo at the primary lobes and the grating lobes, which makes full use of the phase information and offers a certain improvement on the gate-side lobe suppression effect [34]. However, it does not completely solve the problem of mutual influence between the targets of the CF algorithm, and the computational complexity is significantly increased.
Sparse reconstruction algorithms such as the orthogonal matching pursuit (OMP) algorithm [31,35,36] have an advantage in many fields due to their sparse characteristic of requiring an extremely high signal-to-noise ratio and extremely accurate physical models to break through the limitation of the Nyquist sampling criterion and use a sub-Nyquist sampling rate to achieve high-fidelity imaging results [31,37,38]. They can also effectively suppress clutter and sidelobes/grating lobes. However, they require conversion of the entire echo data matrix into vectors and optimization of iterations as well, which generates huge time-consuming iteration calculations. In addition, nonguaranteed stabilization and robustness through a mismatch of the sensing matrix with noise and interference prevents rapid implementation of 3D reconstruction.
In this article, taking into consideration the advantages and disadvantages of the approaches mentioned above, we propose a 3D sparse SAR direct imaging framework with irregular samples. In our framework, mmWave radar is used to detect the target and then perform 3D imaging. In contrast to existing imaging algorithms, we first perform initial imaging of the scene using the MF algorithm to determine the target location information, and then apply it as a priori information to reduce the matrix dimensionality and decrease the matrix storage via signal-processing techniques to speed up the computation. Our research will satisfy the demand for 3D direct imaging with irregular sampling, such as in UAV SAR, automotive SAR, concealed detection, nondestructive testing, etc. The main contributions of our paper are summarized as follows:
  • A 3D sparse direct image reconstruction framework is established to solve the SAR imaging problem of irregular samples.
  • We designed a NUFFT-RMA method to obtain the initial image position information. Subsequently, a threshold filtering method is put forward to reduce the dimensionality of the observation matrix. Finally, signal-processing techniques, such as storing the matrix in advance, are applied to achieve fine 3D sparse imaging.
  • In contrast to previous compressed sensing methods, we propose replacing the interpolated data organized into vectors with raw data to avoid interpolation errors.
  • This is the first attempt to develop a hybrid imaging algorithm of matched filtering combined with sparse reconstruction for 3D imaging in an irregular sampled scene. It can provide better performance in the suppression of sidelobes/grating lobes, the reduction of computation time and storage, and a significant improvement in the imaging quality of multiple targets.
The proposed algorithm was validated using simulation and empirical investigation. Our algorithm can perform 3D high-resolution SAR imaging under arbitrary array configurations. Within the paper, Section 2 introduces the relevant research theories, including the signal model, the BPA, the NUFFT-RMA, the OMP, and the novel sparse enhancement technique. Section 3 discusses the imaging results and parameter metrics of image quality presented to demonstrate the superiority of the proposed algorithm. Section 4 summarizes the whole article.

2. Relevant Research Theories

2.1. MF Model

The near-field 3D mmWave SAR imaging framework using irregular samples is shown in Figure 1. The computer controls the scanning of the radar antenna to form a randomly sampled synthetic aperture plane at z = 0, where the radar antenna transmits and receives the electromagnetic wave signal during the movement. Assuming that the transmitting signal of the system is a linear frequency-modulated continuous wave (FMCW) signal [21], the transmitted signal can be expressed as
m ( t ) = e j 2 π ( f c t + 0.5 K t 2 ) 0 t T c
where f c is the instantaneous carrier frequency at time t = 0 , K = B / T c is the chirp of the frequency slope, B is the sweep band of the signal, and T c is the duration of the fast time. After dechirping, the complex echo signal is obtained as follows:
s ( t ) = σ R 2 m ( t ) m ( t τ ) = σ R 2 e j 2 π ( K τ t + f c τ 0.5 K τ 2 ) R = ( x x ) 2 + ( y y ) 2 + ( z z ) 2
where τ is the pulse round-trip time delay with σ representing the target scattering coefficient, f ( t ) = f c + K t denotes the signal carrier frequency at each sampling point, and k ( t ) = 2 π f ( t ) / c is the wave number. The last phase term is known as the residual video phase (RVP), which is ignored. Finally, the signal model can be represented as
s ( k ) = σ e j 2 k R R 2 2 π f c c k 2 π f c
We model the target as a continuous set of point targets located in a volume V in the ( x , y , z ) space. Expanding the signal model in (3), we can obtain
s ( x , y , k ) = f ( x , y , z ) p p 2 e j 2 k p p d x d y d z
where f ( x , y , z ) represents the radar cross-section (RCS) coefficient of the target. The amplitude decay is considered here. Assuming the scattering points of the distributed target scene are closely located, p p 2 = R 2 can be approximated as p p [21]. In this case, the raw data cube contains three-dimensional information in the range dimension, azimuthal direction, and altitude direction [39]. The data cube in Equation (4) is obtained via range compression on a range direction with the Fourier transform.
s ( x , y , z ) = FFT 1 D ( s ( x , y , k ) )
Using the classic BPA, Equation (5) can be reformulated to recover the 3D complex image.
f ( x , y , z ) = p p s ( x , y , z ) e - j 2 k p p d x d y d z
The Fourier-based algorithm in the subsequent analysis is known as the range-migration algorithm (RMA); Equation (5) can be rewritten as
s ( x , y , k ) = f ( x , y , z ) e j 2 k R R d x d y d z
Using the spherical wave as an approximate superposition of plane waves [40,41],
e j 2 k R R e j [ k x ( x x ) + k y ( y y ) + k z ( z z ) ] k z d k x d k y
Taking Equation (8) into (7), the signal can be written as
s ( x , y , k ) = f ( x , y , z ) e j [ k x ( x x ) + k y ( y y ) + k z ( z z ) ] k z d k x d k y d x d y d z
where k z = 4 k 2 k x 2 k y 2 , k x 2 + k y 2 4 k 2 .
Leveraging the conjugate symmetry of the spherical wavefront, (10) can be rewritten in the following form to exploit the spatial Fourier transform on z :
s ( x , y , k ) = f ( x , y , z ) e j [ k x ( x x ) + k y ( y y ) k z ( z z ) ] k z d k x d k y d x d y d z
where ( ) is the complex conjugate operation. Using the 3D spatial Fourier transform and rearranging the terms in (10), Equation (10) becomes
s ( x , y , k ) = F ( k x , k y , k z ) e j k z z k z e j ( k x x + k y y ) d k x d k y
The outer double integral above represents a 2D inverse Fourier transform. Hence, Equation (11) becomes
s ( k x , k y , k ) = F ( k x , k y , k z ) e j k z z k z
The backscattered data spectrum s ( k x , k y , k ) is assumed to be uniformly sampled in the k domain. Hence, the backscattered data are resampled to uniformly spaced positions in the k z domain. Therefore, the 3D RMA image reconstruction can be carried out as follows:
f ( x , y , z ) = IFFT 3 D k x , k y , k z Stolt ( k k z ) s ( k x , k y , k ) k z e j k z z
where Stolt ( k k z ) means the interpolation to resample the data cube to uniformly spaced positions in k z domain. The 3D RMA image reconstruction for a 2D rectilinear synthetic array requires the signal to be uniformly sampled in the frequency and spatial domains. However, signals are randomly sampled in the spatial domain, which also prevents the RMA algorithm being used for 3D image reconstruction of general irregular sampled arrays. To overcome the above problem, the NUFFT-RMA is introduced to tackle the nonuniform spatial sampling in this paper [27]. NUFFT is a fast algorithm for converting time-domain nonuniform to frequency-domain uniform sampling, changing the data directly via NUFFT without interpolating the data before imaging, which can reduce the errors and unnecessary operations caused by interpolation. Equation (13) can be reformulated as
f ( x , y , z ) = IFFT 3 D ( k x , k y , k z ) Stolt ( k k z ) NUFFT 2 D ( x , y ) S ( x , y , k ) k z e j k z z

2.2. The Proposed Algorithm

Compared with MF algorithms, sparse imaging algorithms can effectively suppress sidelobes and clutter, significantly improving the image quality. However, an observation-matrix-based sparse imaging algorithm demands conversion of the echo data matrix into vectors and reconstruction of the imaging scene, for which the computational complexity is high. Therefore, a direct 3D sparse reconstruction algorithm is proposed. Using the original data, instead of interpolating data, can effectively save time and reduce the error rates. Firstly, the SAR-based imaging model can be expressed as
Y = A X + θ
Equation (15) describes the decomposition of the measurement signal; it presents the signal formation process, where Y is the measurement vector (raw data), A represents the dictionary matrix, and X is the scattering coefficient matrix. The OMP algorithm mainly solves the minimization problem of the complex domain l 0 norm.
X = m i n X 0 s . t . Y A X 2 ε
For our purposes, we use the l P norm to solve the above problem. By bringing the compressive sensing theory into Equation (15) and adding the regularization constraint [31], the sparse reconstruction of the observation scene can be expressed as
X = m i n ( Y A X 2 2 + μ X p p )
where p is the l p norm of a matrix, p ( 0 < p < 1 ) represents the shrinkage parameter, and μ is the regularization parameter [31]. In actual imaging scenes, most areas of the scene are not essential, and the target areas of interest often account for a small percentage of the scene which is sufficient for 3D reconstruction. Therefore, we chose to perform dimension reduction on the observation matrix dictionary to improve the imaging speed and reconstruction accuracy. Imaging algorithms based on the matched filtering framework can all perform preliminary imaging of the target to initially select the target region. Here, we use the NUFFT-RMA method to obtain the initial imaging results X and those characteristic of the target area with stronger scattering intensity to select the threshold τ . The threshold τ is the value of the boundary between the initial screening target area and the clutter. Supposing the target area is C, Q l o c is the local mean, Q a l l is the global mean, k is the constant of the scale factor, and β is the standard deviation of the image. Slide the 3 × 3 window of the image through the whole image in order, and we can obtain
C = { ( x i , y i , z i ) X ˜ ( x i , y i , z i ) > τ i = 1 N = { X ( x i , y i , z i ) } i = 1 N Q ( i , j ) = N a N , Q l o c < k β Q a l l   Q ( i , j ) ,   Q l o c k β Q a l l     τ = m i n ( Q ( i , j ) )
where X ( x i , y i , z i ) is the N scattering objects which correspond to the target area C . A detailed explanation is given in Figure 2. While reducing the number of measurements due to the sparsity of the scene, a sensing matrix is introduced to multiply the dictionary matrix, where Θ is the sensing matrix [42,43]. Assume that the original dimension of the observation matrix A is M × N , and the observation matrix A is now updated to M × N . We can rewrite Equation (17) as
Y = Θ A X + θ = A X + θ X = m i n ( Y A X 2 2 + μ X p p )
Taking the idea of Cetin’s process [44], the cost function can be defined as
f = ( Y A X 2 2 + μ X p p )
Calculating the partial derivative of f with respect to X gives the following:
X f = ( 2 A H A + μ p Λ ) X 2 A H Y
where 2 A H A + μ p Λ can be assumed to be an approximate Hessian matrix and Λ = d i a g ( ( X n ) p / 2 1 ) , where d i a g indicates the diagonal matrix. We can use the Gaussian iterative method to obtain the 3D sparse reconstruction:
X n + 1 = X n Δ n + 1 ( 2 A H A + μ p Λ ) 1 X n f X = X n + 1 X n + 1 X n 2 2 / X 2 2 ξ  
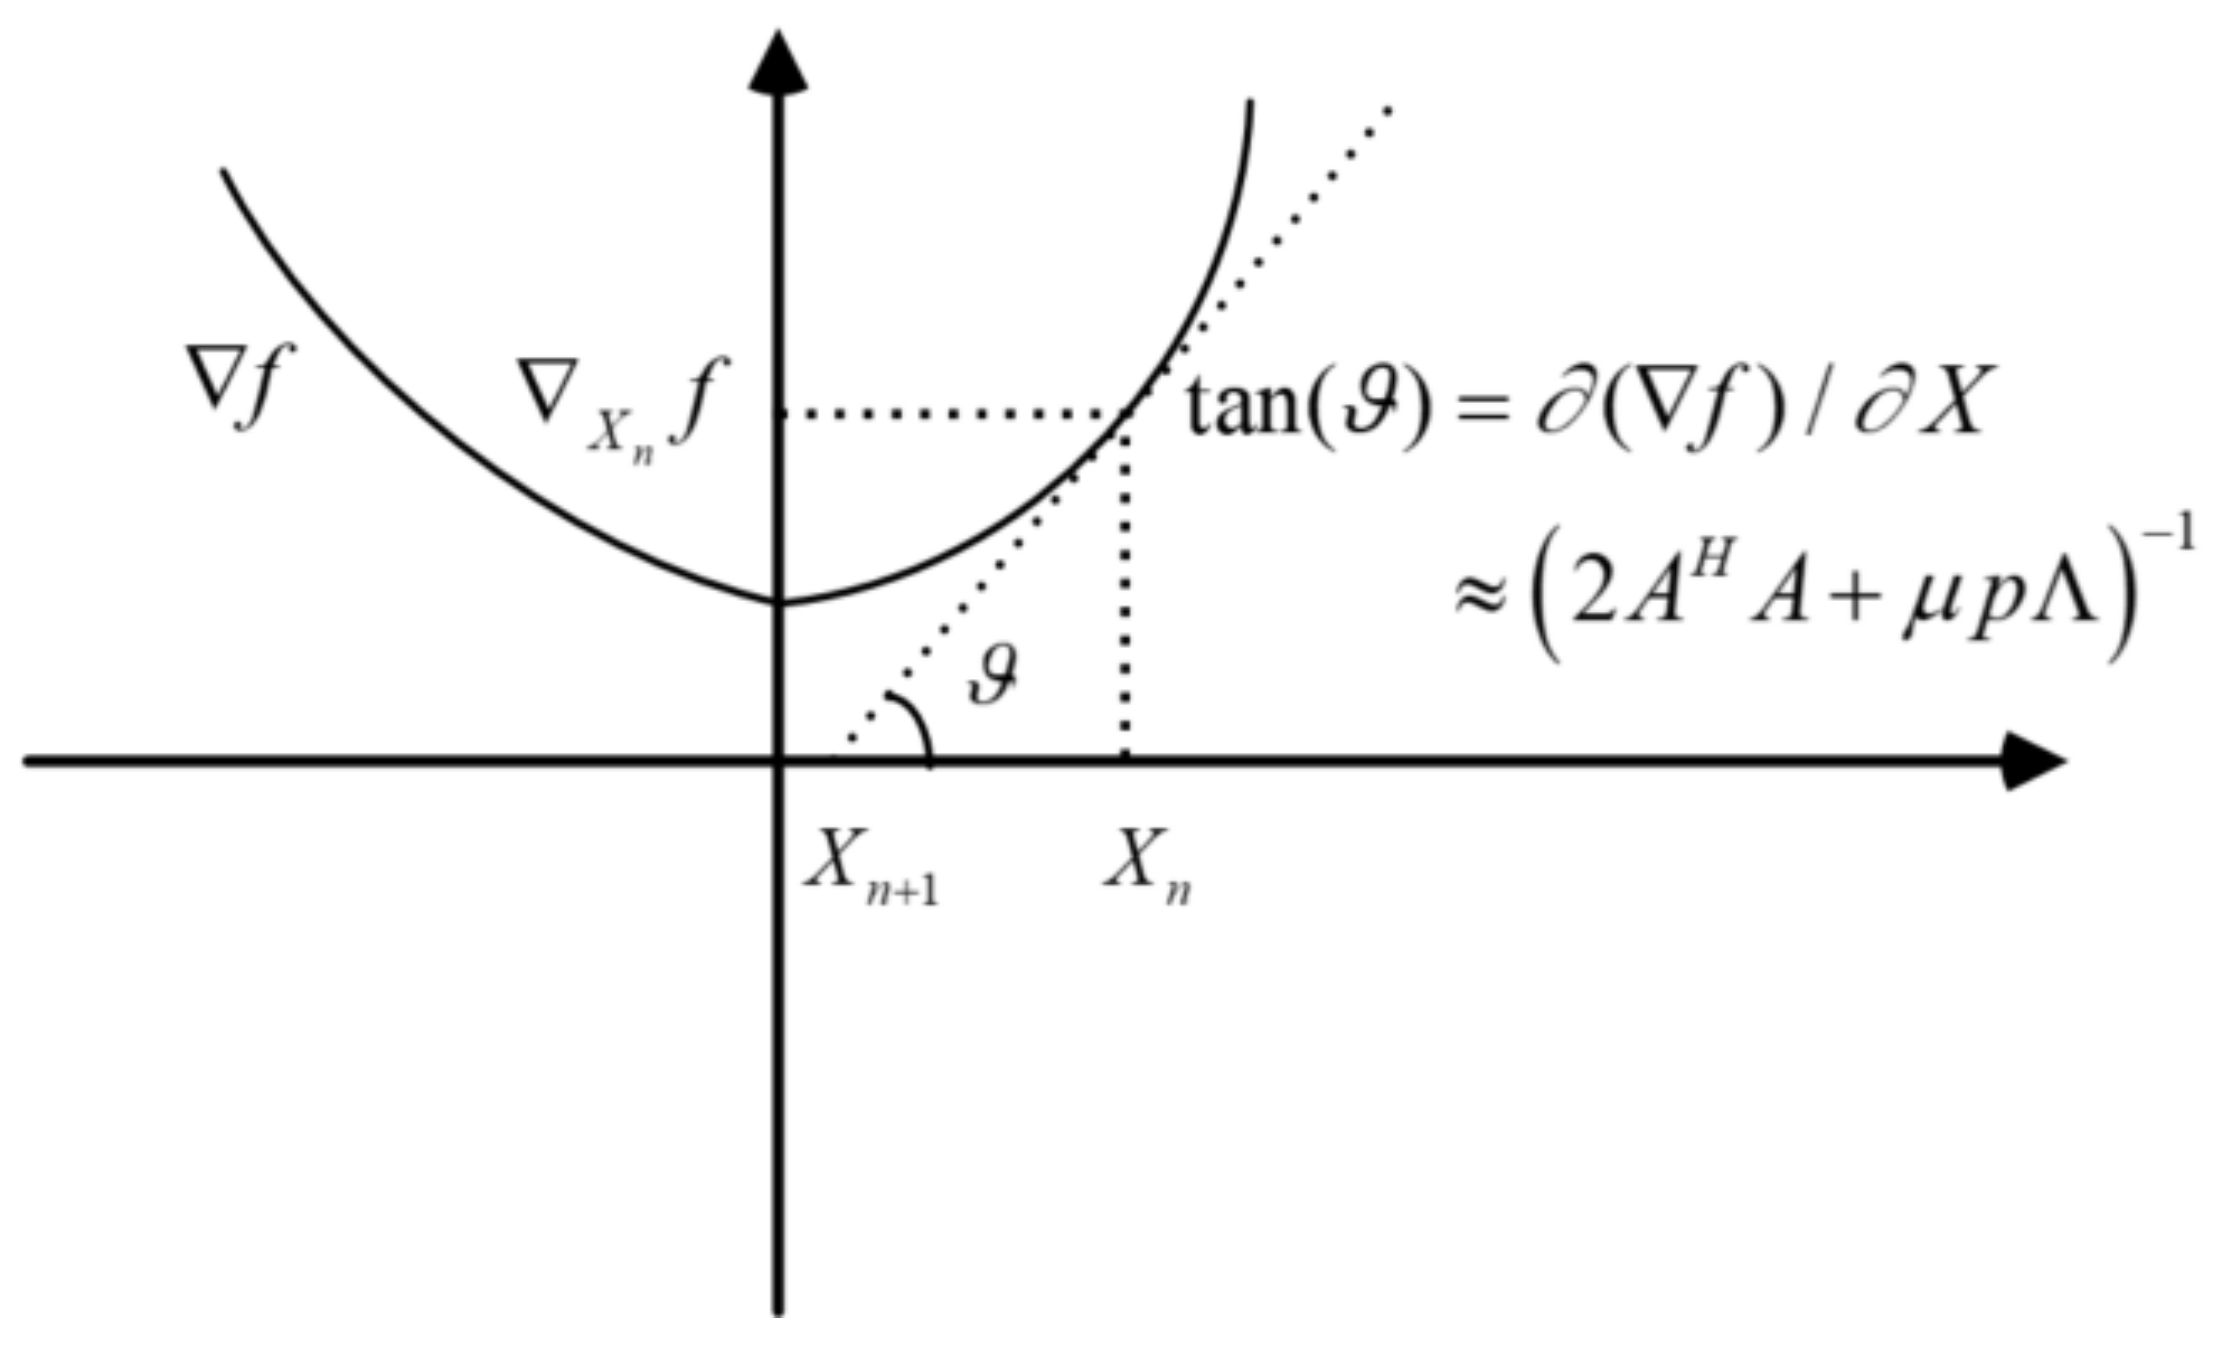
The geometric explanation of the iterative operation is given in Figure 3, where ξ represents the iteration termination threshold and Δ n + 1 = Δ n 0.8 is applied to accelerate the convergence of the iteration In fact, the 3D sparse direct imaging model without threshold selection presents large storage and computational challenges; assuming the size of the raw data in the 3D imaging dimension is 5 × 200 × 200 , then M is approximately 2 × 10 5 units of storage. If the size of the reconstructed 3D scene is also 5 × 200 × 200 , then N is approximately 2 × 10 5 units of storage. One storage cell is 8 bytes, meaning that the observation matrix A requires a storage space of about 298 GB. Generally, A cannot be stored, and it requires a huge amount of computation to compute A H A and A H Y in the iteration process. Because of the mentioned huge storage and computational challenges, it is impractical to apply 3D sparse reconstruction directly. Therefore, using threshold selection to reduce the observation matrix dimensions, we can obtain A H A = M × d i a g ( o n e s ( N ) ) and the dimension of A H A is N × N . The dimension of A H Y is N × 1 , and A H Y can be obtained after filtering Y with a threshold τ . By estimating A H A and A H Y in advance, the speed of the iterative operations can be enhanced and the amount of storage will be reduced, thus allowing implementation of 3D image reconstruction. Based on the above idea, the challenges of massive calculations related to the 3D sparse SAR direct reconstruction are resolved. The specific steps of the proposed sparse imaging algorithm are summarized in Table 1.

3. Imaging Results and Evaluation

In this section, simulated and real measured data are shown to demonstrate the effectiveness and reliability of the proposed algorithm. The simulated and measured scanning sizes were 200 × 200 mm2 and300 × 300 mm2. In the setup, all the computations were implemented using MATLAB in Windows 10 on an Intel Core i7-8250K [email protected] GHz and 16 GB memory. No parallel computing or GPU was adopted and the data acquisition time was not considered. The radar system parameters are shown in Table 2.

3.1. Imaging Results

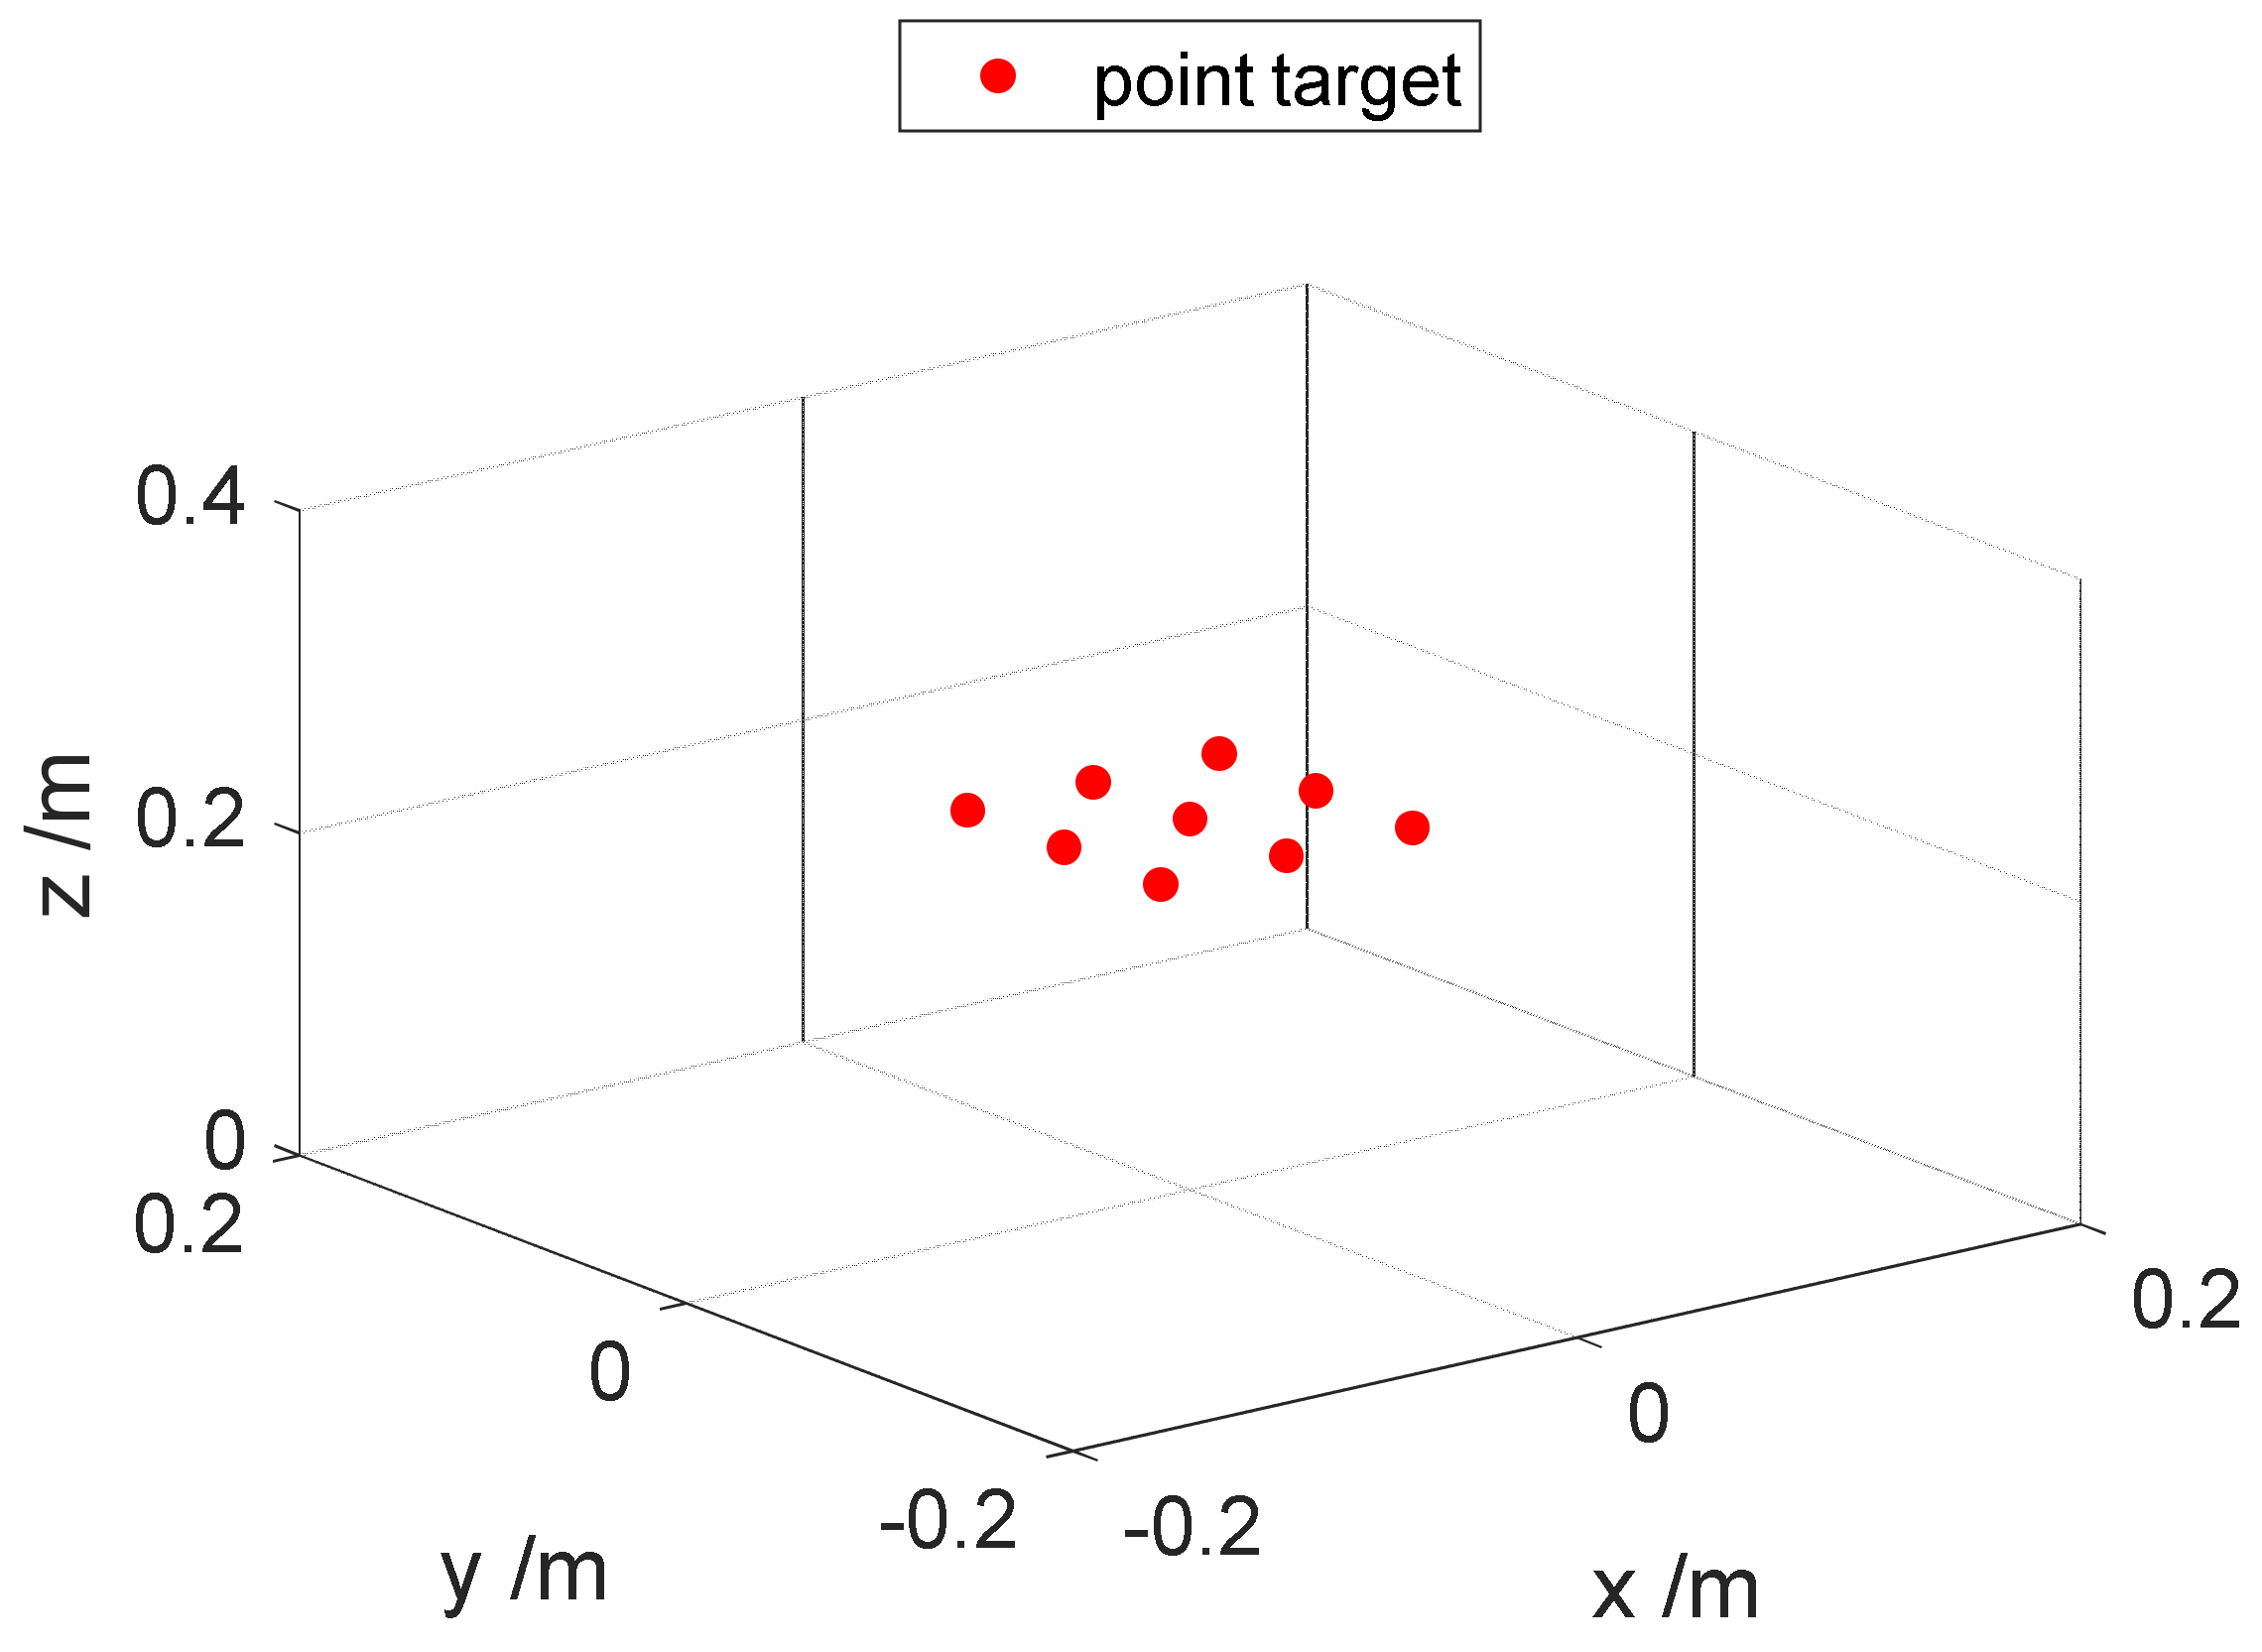
Figure 4 indicates the geometric model of the nine ideal point targets distributed in space. Figure 5a–d shows the simulation imaging results of BPA, NUFFT-RMA, OMP, and the proposed algorithm, respectively. The target center was 0.23 m away from the array aperture of the reference plane. The number of spatial sampling positions was selected along x and y orientations from −100 mm to 100 mm for an irregular array, and the operational frequency was 77–81 GHz with 201 points.
After obtaining the original data cube, these four algorithms were used to reconstruct the point target images. The image reconstruction by these algorithms used 35% random samples and added 60 dBW Gaussian white noise. By comparing these methods, it can be clearly seen that with the irregular sampling, the signal was severely attenuated with the MF algorithm and the images from the BPA and the NUFFT-RMA had greater ghosts and streaks on the contours of the object. However, the OMP and proposed algorithm effectively suppressed sidelobes and clutters. Although the OMP algorithm was able to almost completely reconstruct the image, its huge imaging computational complexity is not sufficient to satisfy the requirements of real-time imaging. Furthermore, compared with the image results based on these algorithms, the proposed algorithm improved the measurement accuracy of the target RCS and had better image-focusing performance than OMP.
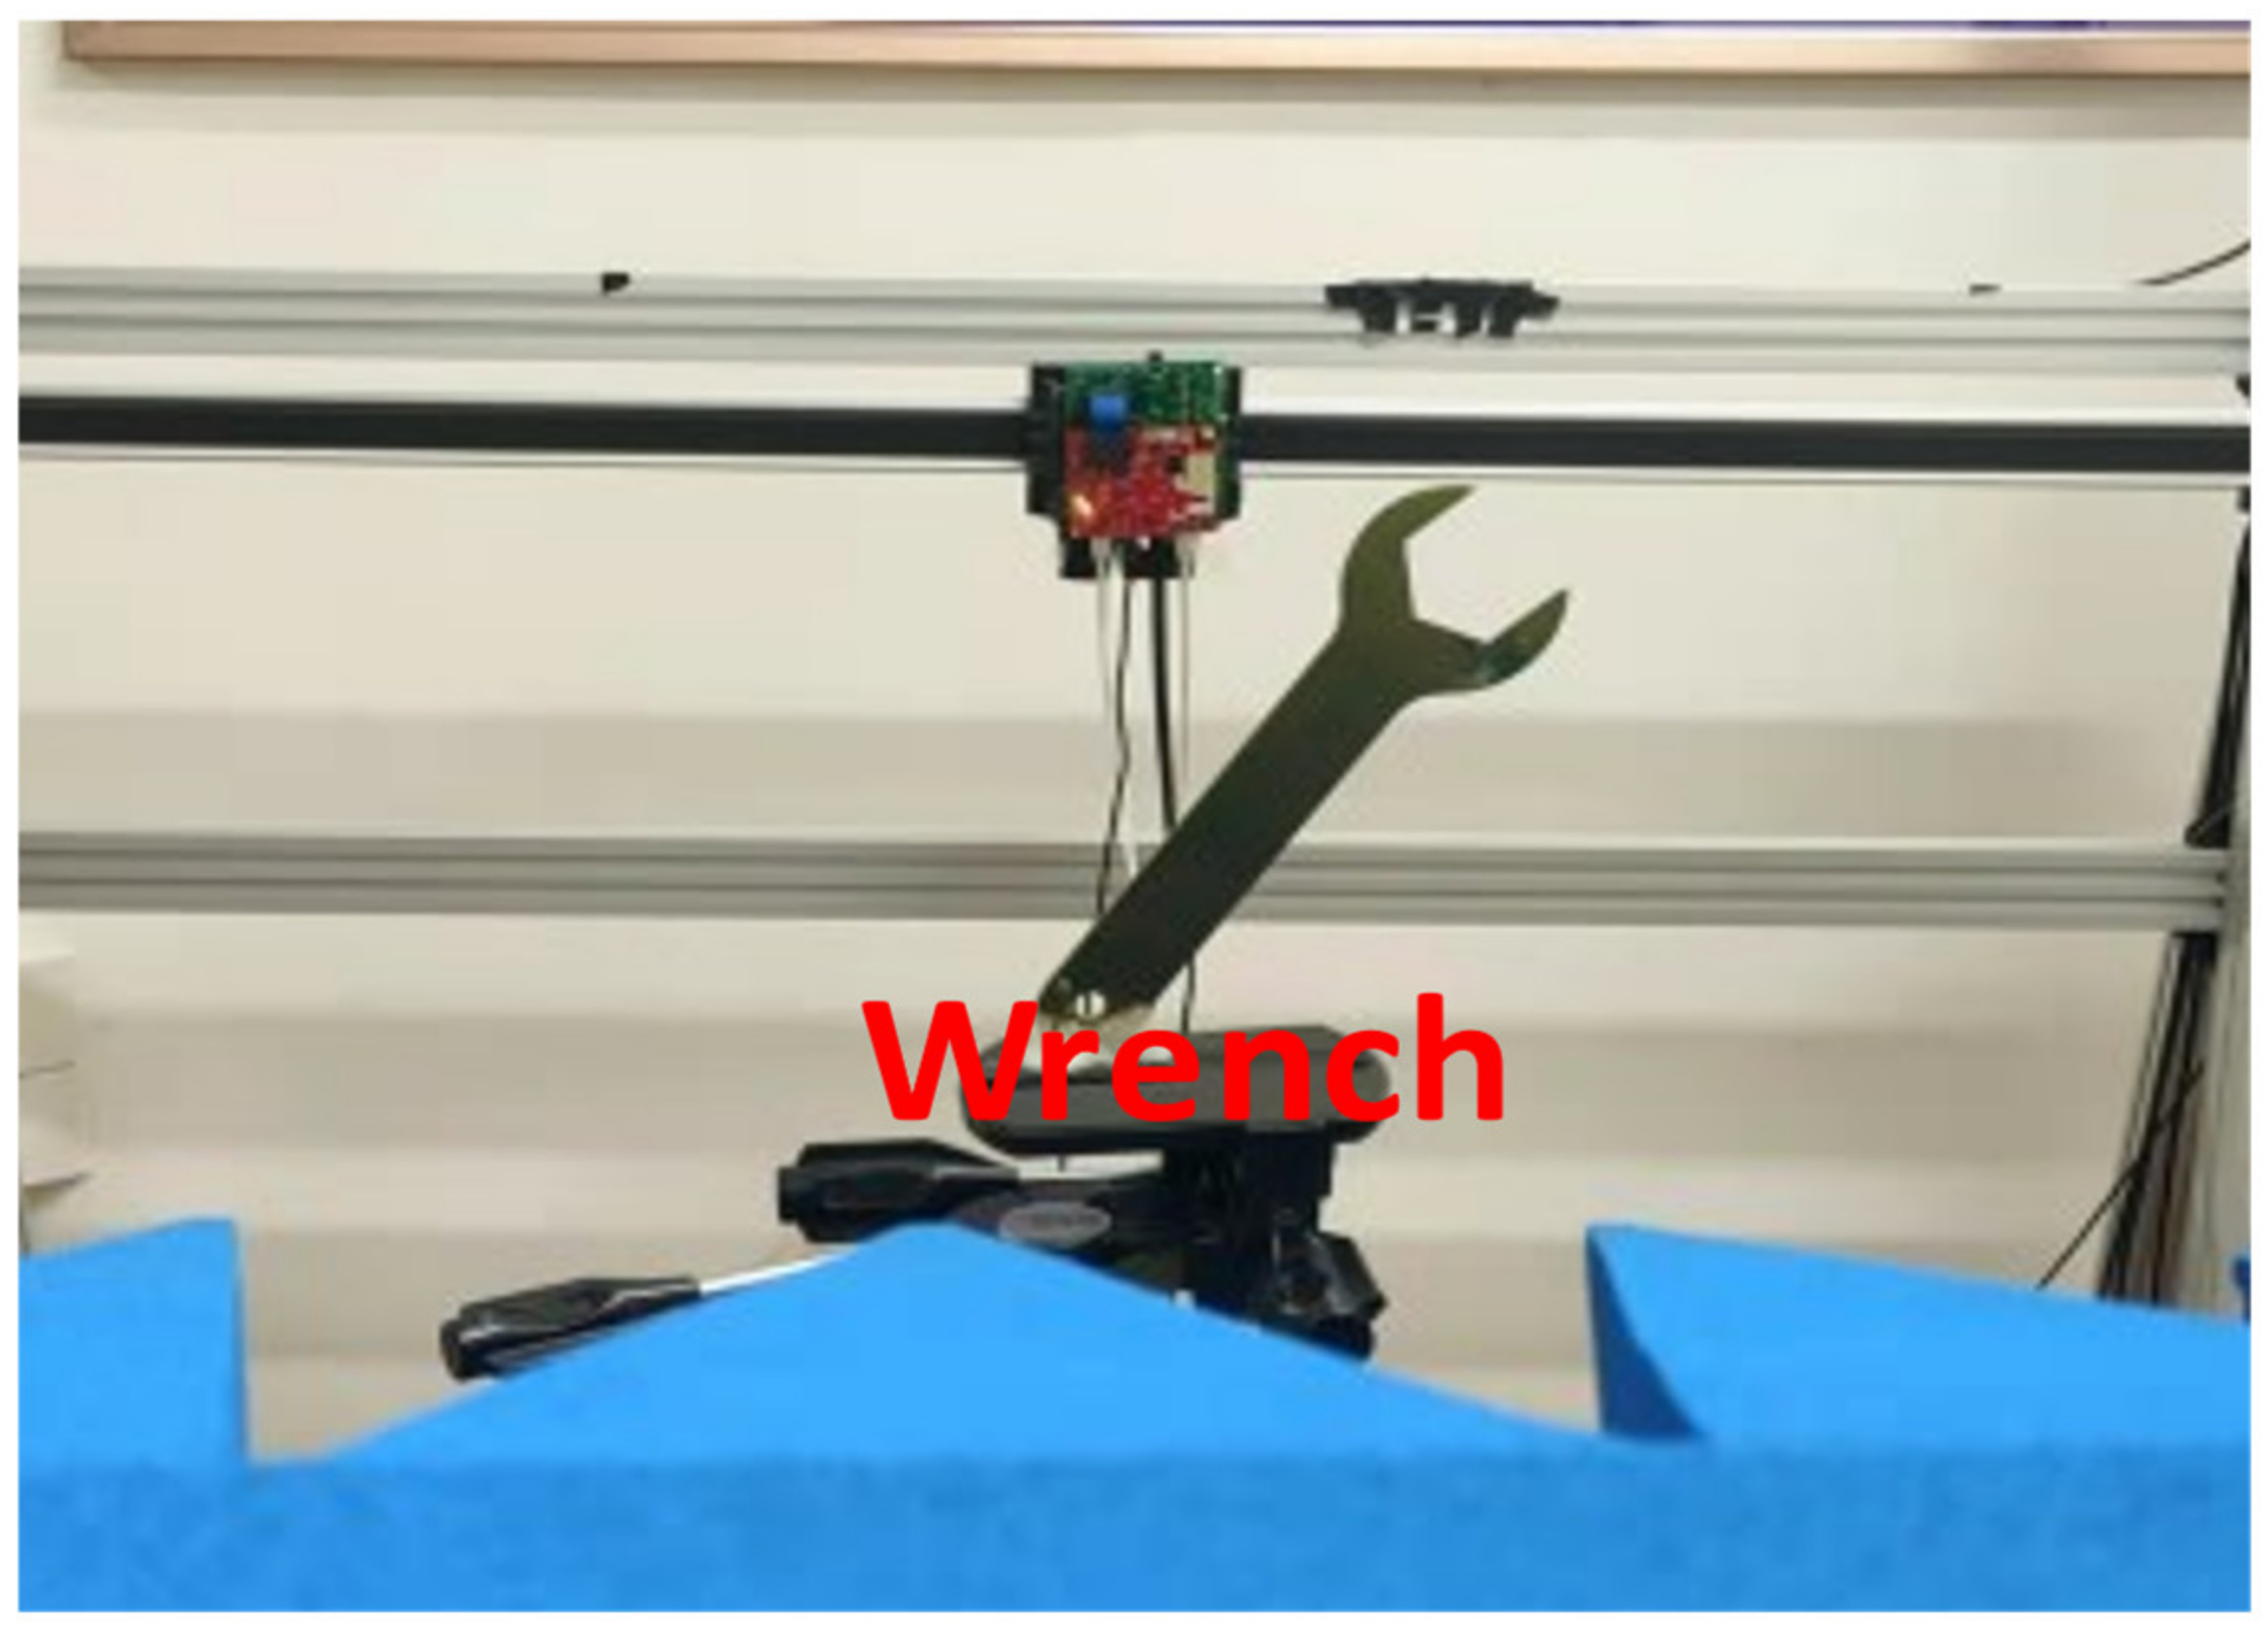
In this paper, to verify the superiority of the proposed algorithm in real scenarios, the optical imaging of an experimental wrench model was targeted, as shown in Figure 6.
The PC as the control center was connected to an IWR1843 mmWave radar, a high-performance DCA1000 raw data acquisition card, and a three-axis controllable stepper to capture the echo. The distance between the reference planar and the target center was 0.3 m. The platform operated by scanning a Z-shaped trajectory to collect data and carried out irregular sampling in the later signal processing. The mmWave radar imaged the wrench in the forward- and side-facing modes. The number of spatial sampling locations was chosen in an irregular array along x and y directions from −150 mm to 150 mm. The imaging dynamic range was set to 14 dB, and the operational frequency was set to 77–81 GHz with 256 points.
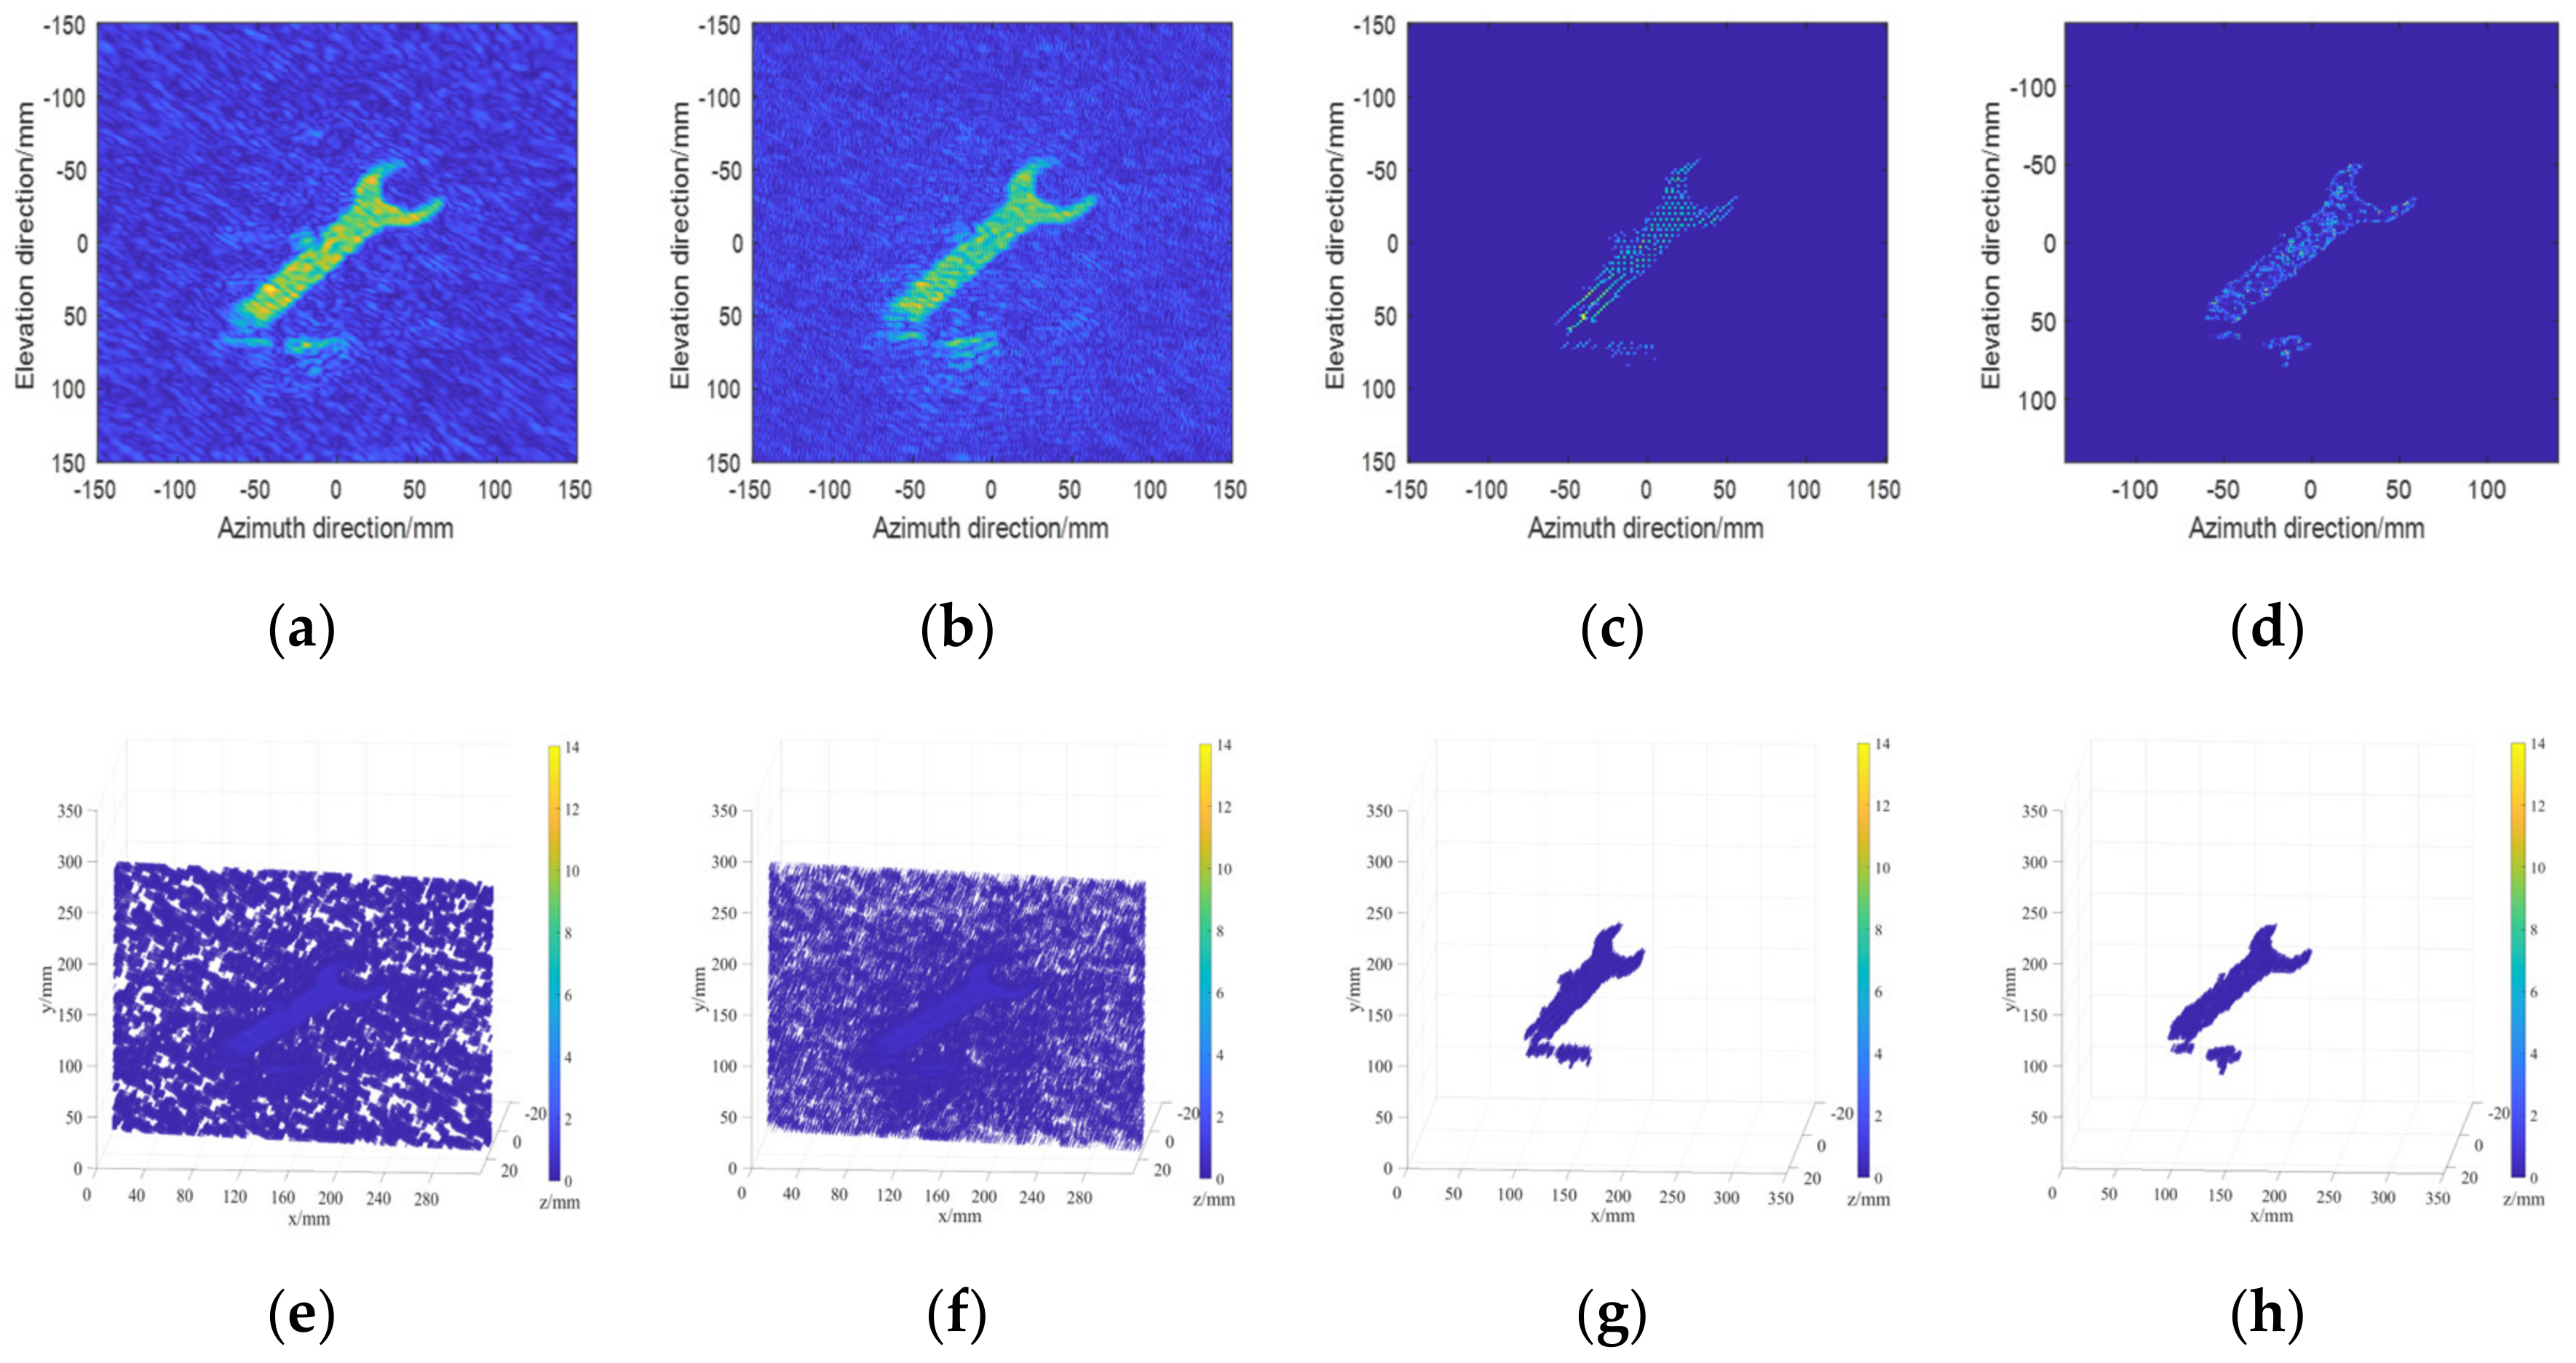
Using 30% random samples to reconstruct images, the 3D SAR imaging results of the various methods are presented in Figure 7. It can be clearly seen that the target was drowned out by clutter and sidelobes, and the image quality severely deteriorated when using the BPA and NUFFT-RMA. A comparison between Column 3 and Column 4 of Figure 7 indicates that a loss of detail and edge diffraction can be observed and the image quality of detail at the edges slightly deteriorated when using the OMP algorithm. In contrast, the measurement accuracy and image quality were improved and the image edge detail was recovered most effectively by the proposed algorithm. These results verify the practical applicability of the method.

3.2. Evaluation of Imaging Results’ Characteristics

To further evaluate the performance gap between the proposed algorithm and the other algorithms, we discuss the characteristics of these methods below.
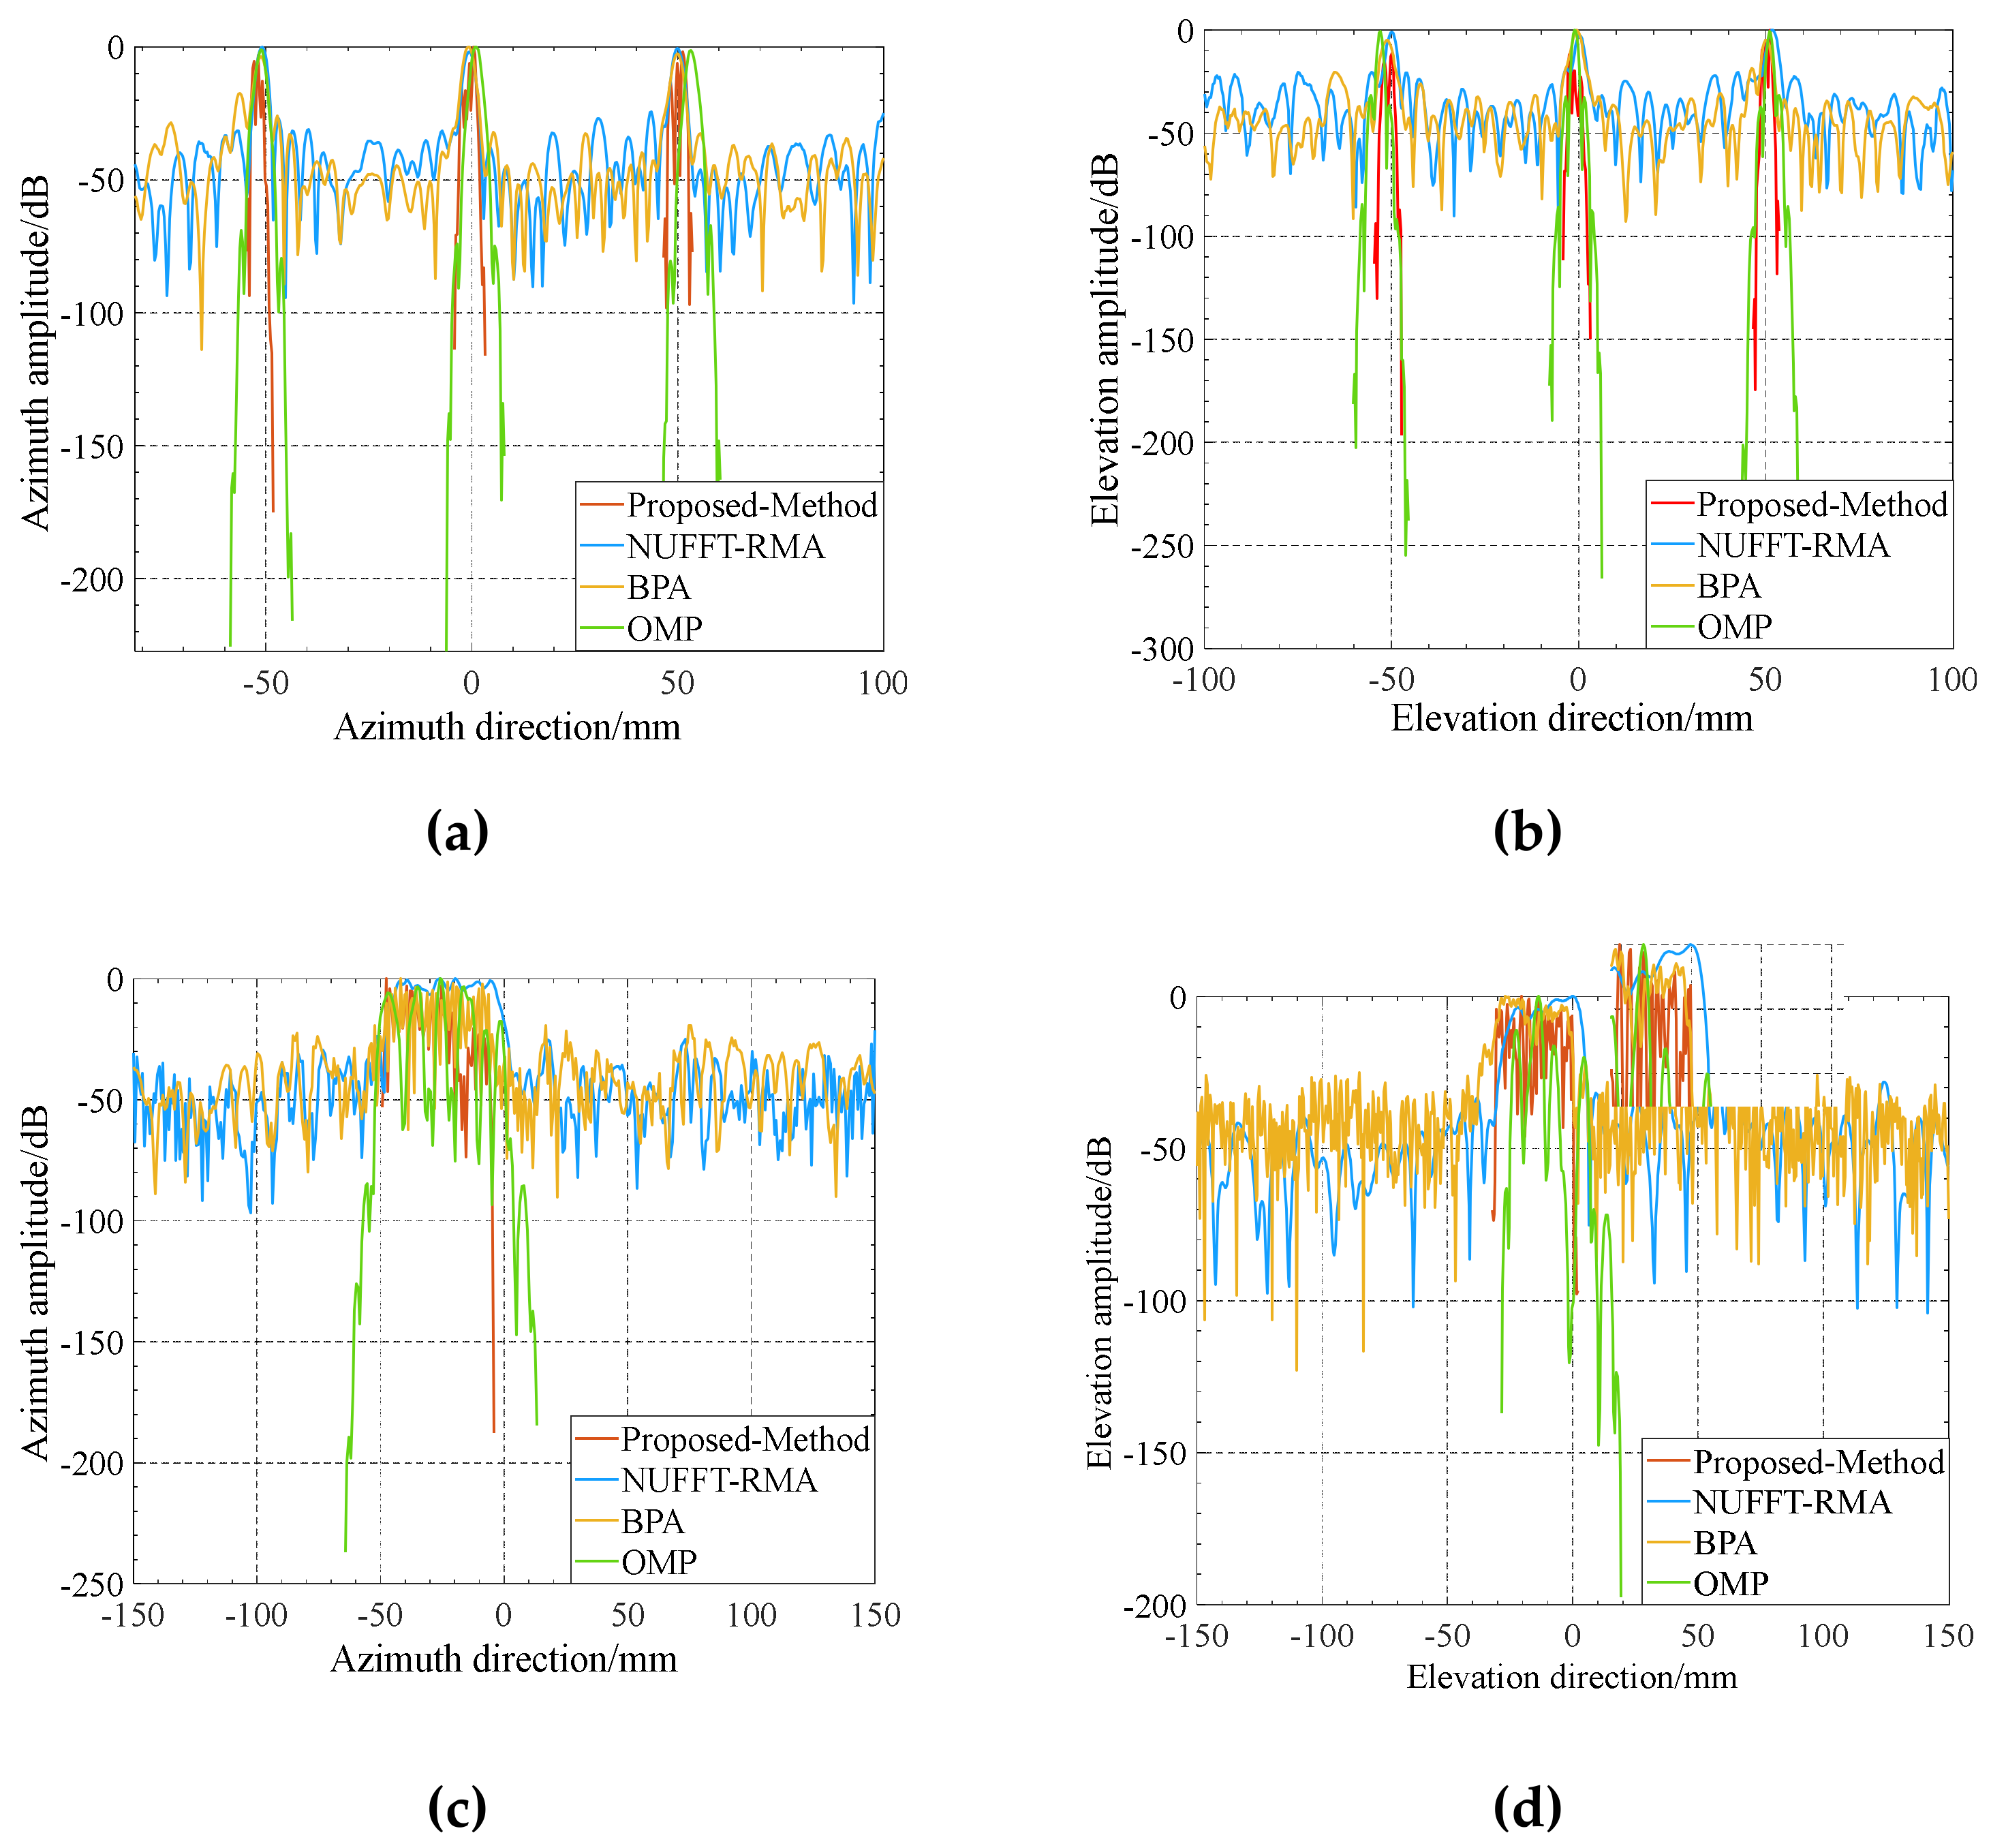
(1) Amplitude: In order to directly compare the effect of sidelobe suppression and detail retaining capability, we sliced the imaging amplitude results of the nine ideal point targets and the wrench along the azimuth and elevation directions, as shown in Figure 8. The results showed that the proposed method sharpened the principal lobes more than the traditional algorithms, which showed a narrower impulse response.
The mean differences of principal lobes in the results of the BPA, NUFFT-RMA, OMP, and proposed method were −6.24 dB, −2.23 dB, −18.96 dB, and −3.68 dB in the simulation, respectively. The mean differences in the results of the BPA, NUFFT-RMA, OMP, and proposed method were −3.18 dB, −7.62 dB, −9.26 dB, and −2.49 dB in the real data, respectively, which shows that the measurement intensity and stability of the proposed method were improved compared to the other methods. In addition, the principal lobes based on the proposed algorithm were narrower than those of the other three algorithms, and the principal lobes were more focused. This also indicates the enhancement of the sidelobe clutter suppression effect and image details by the sparse method, as shown in Figure 8. The mean differences of principal lobes are shown in Table 3.
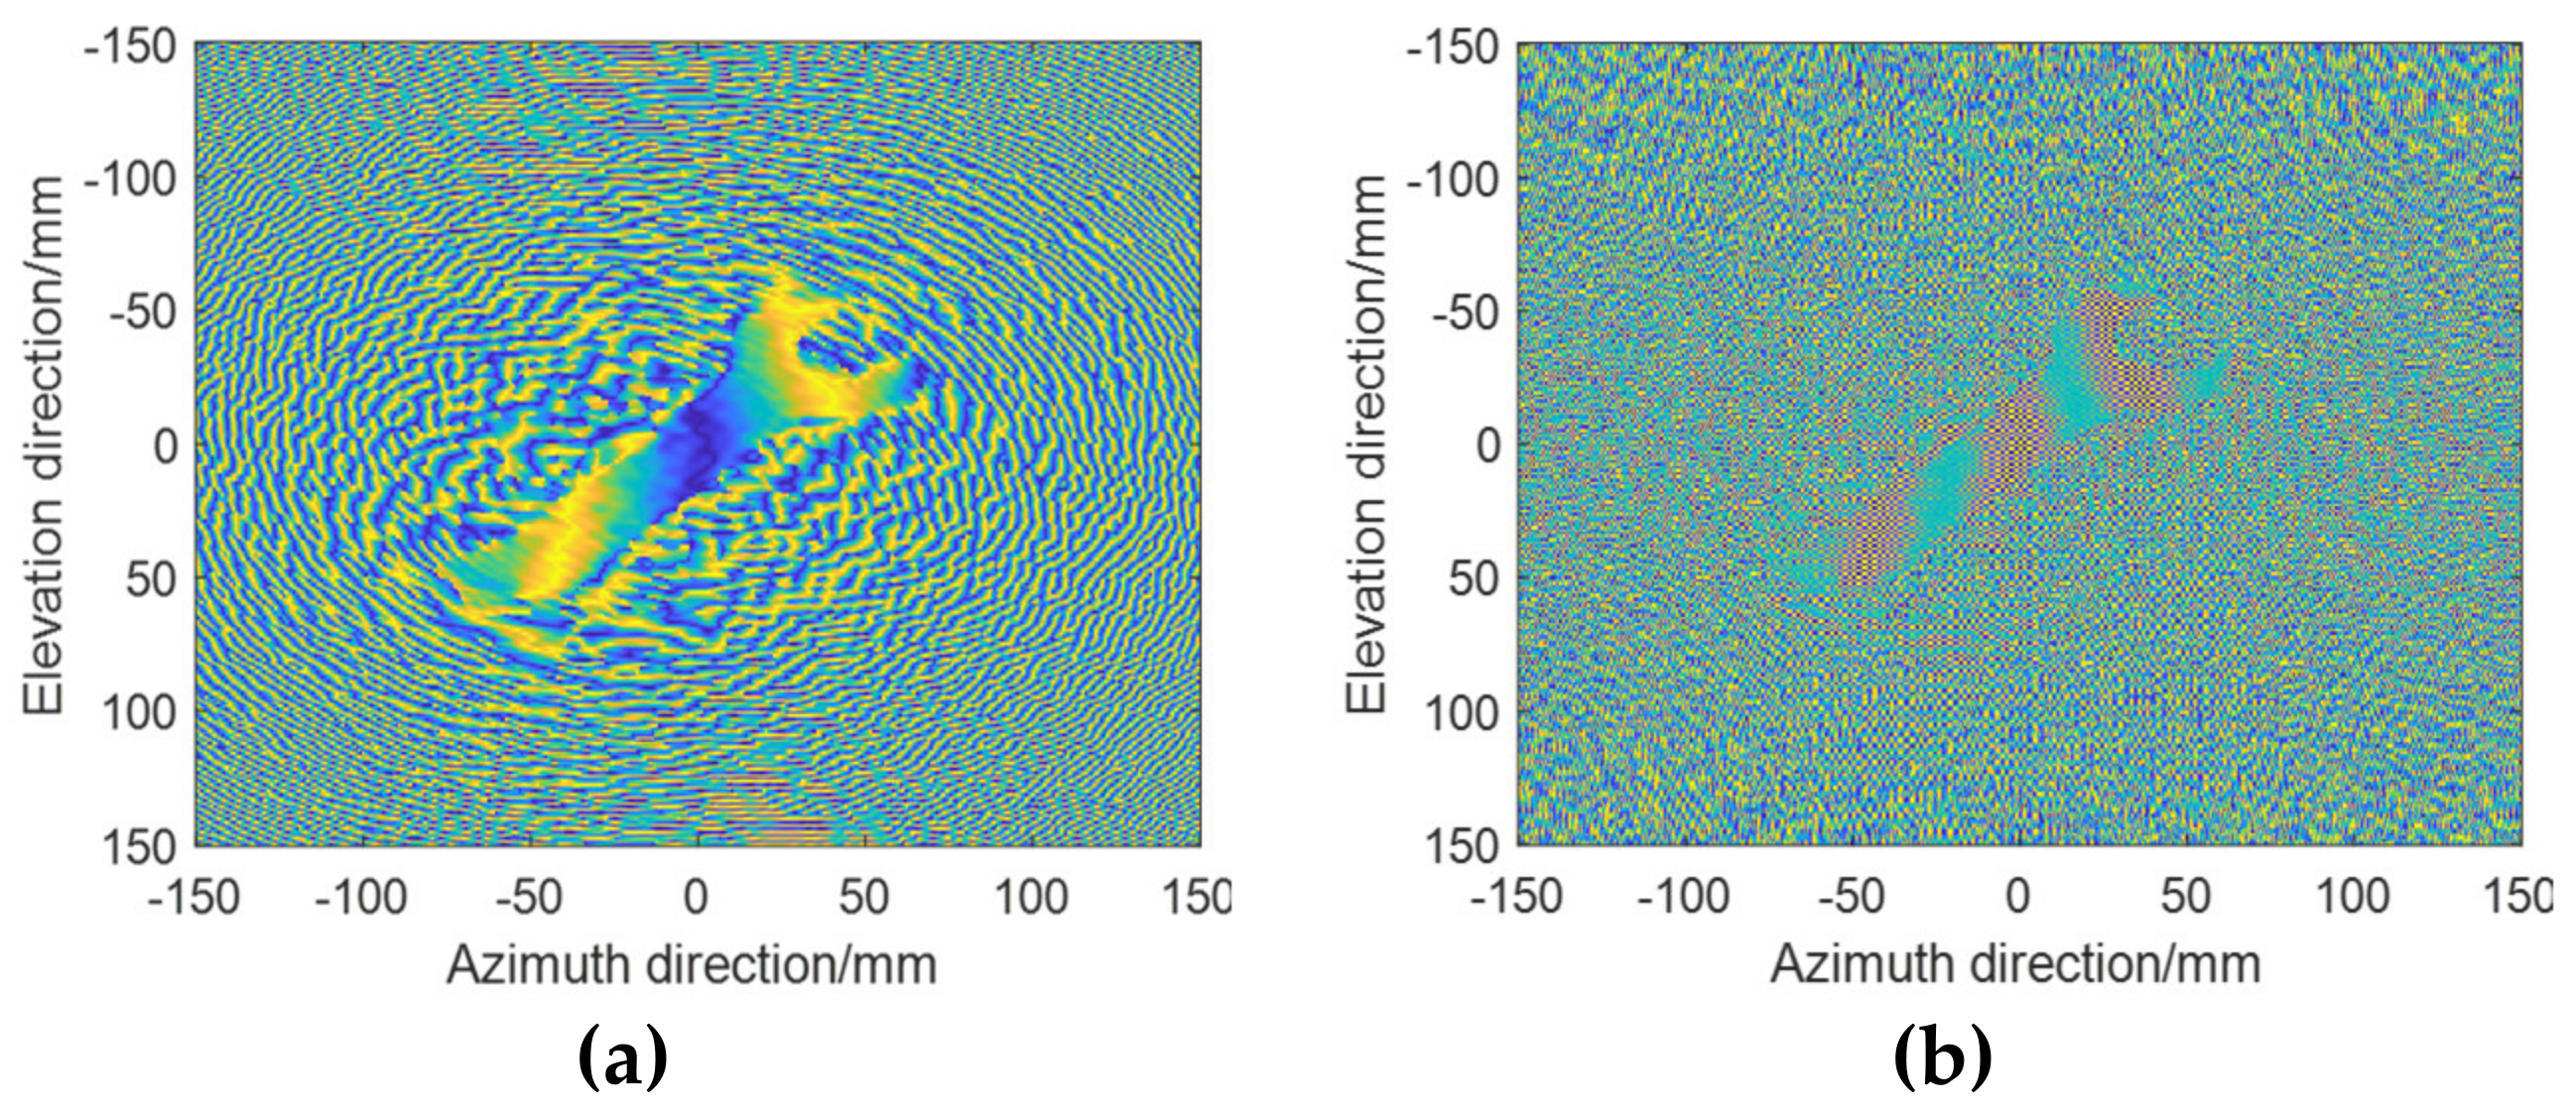
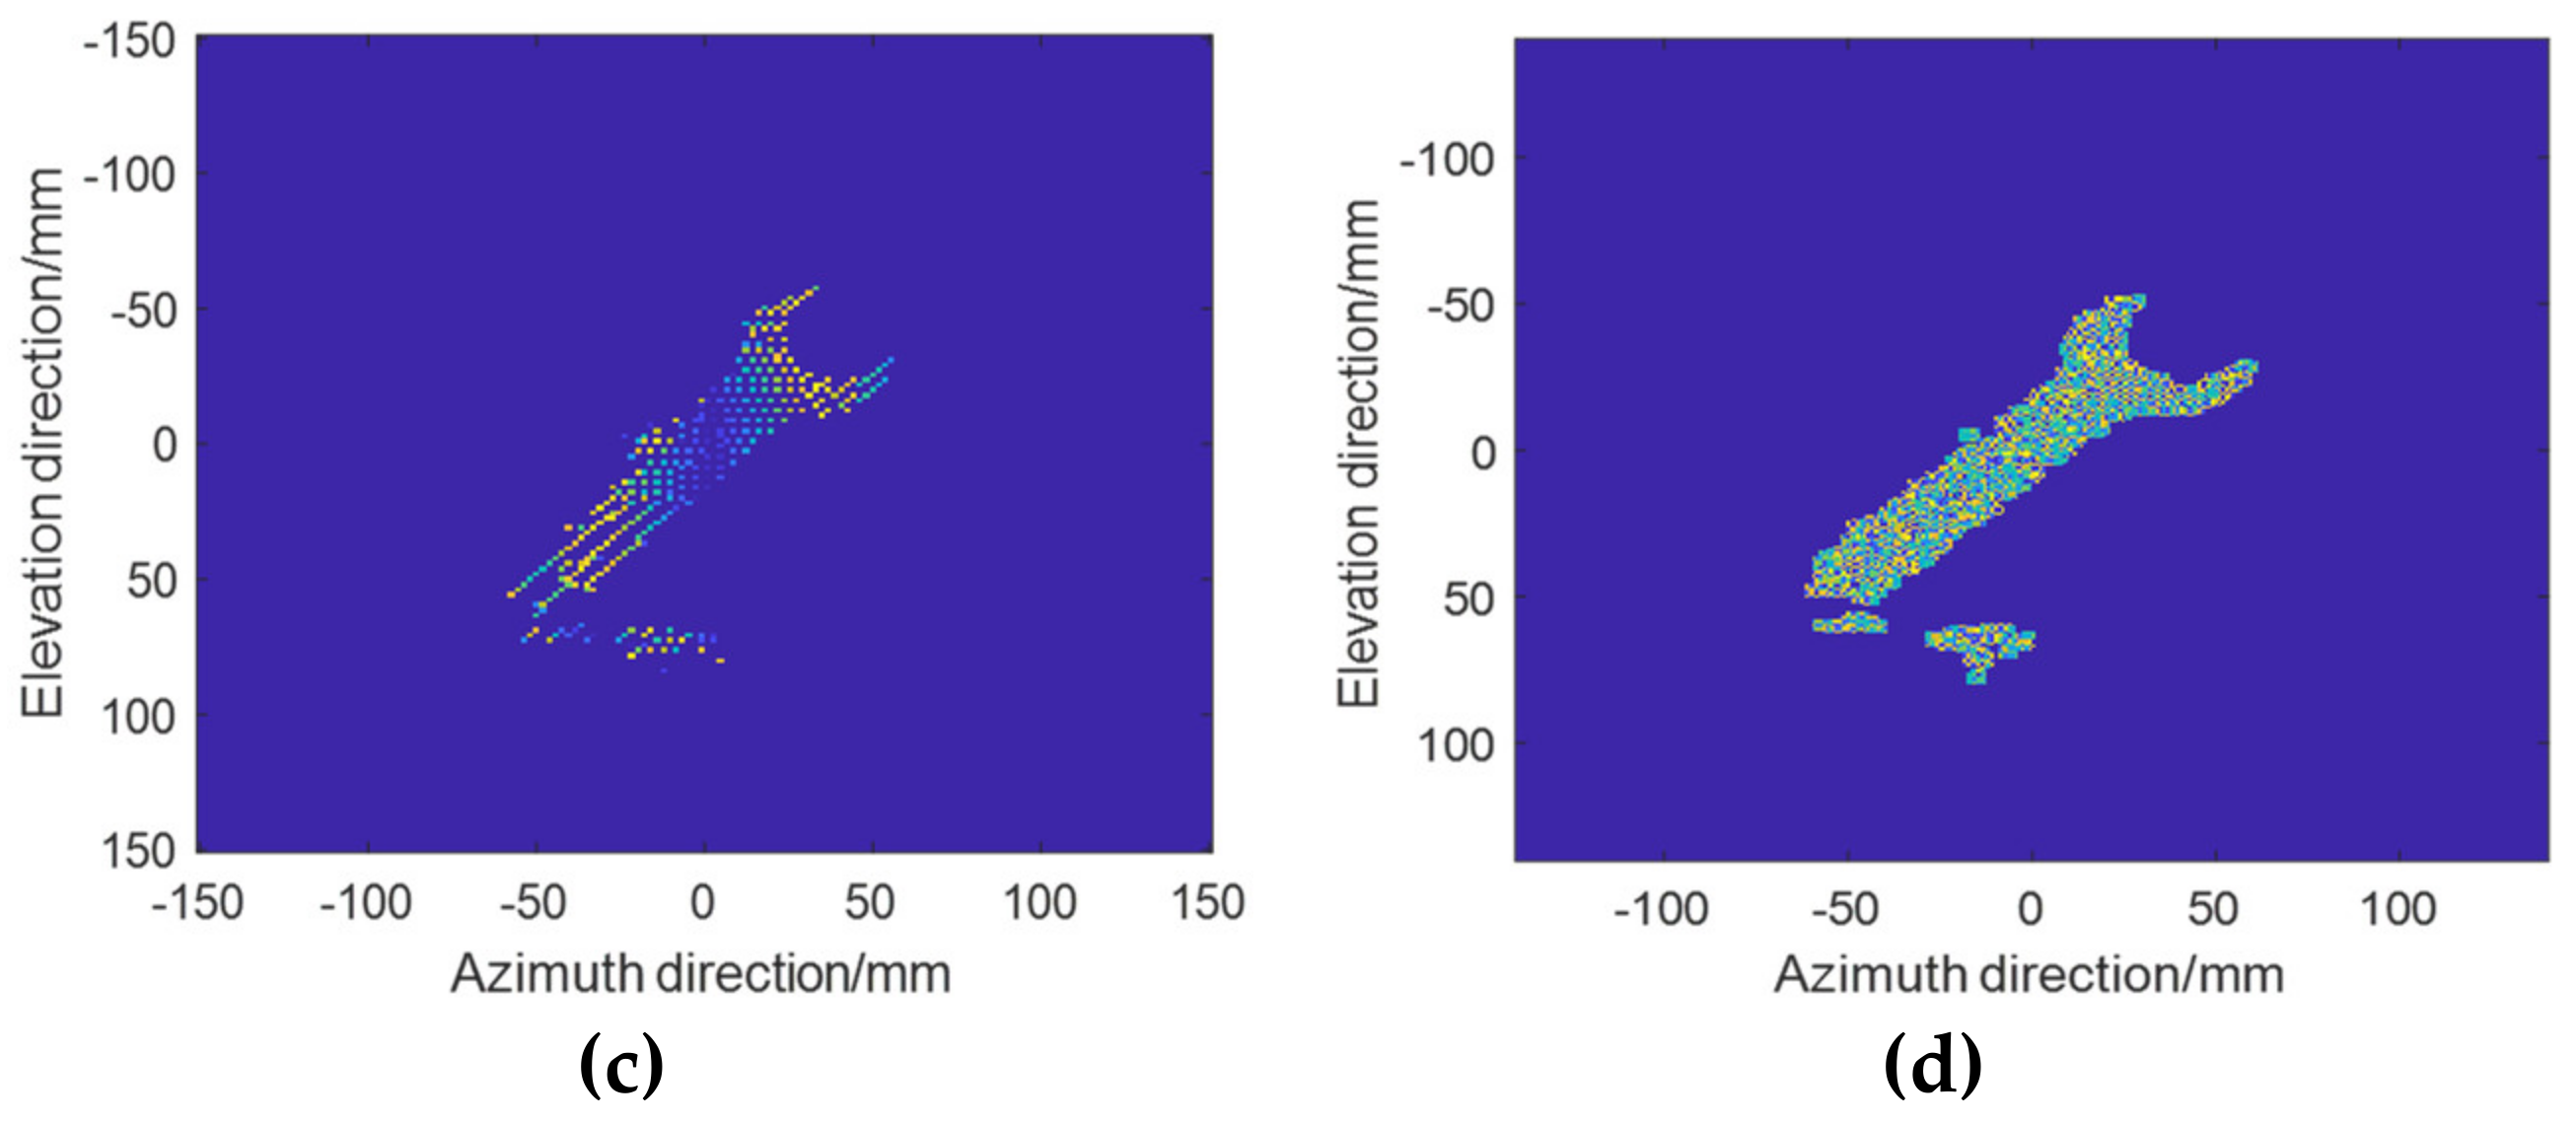
(2) Phase: Figure 9a–d shows the phases of BPA, NUFFT, OMP, and the proposed method, respectively. It can be clearly seen that the images underwent severe detail loss when using OMP, while there was a lot of clutter on the images when using MF-based approaches, which affected the image quality. Furthermore, these results indicate that the reconstruction of the image via the proposed algorithm maintained the phase information of the image, i.e., the complete complex scattered field was estimated instead of the field with only amplitude.
(3) Image quality and time complexity: To quantitatively verify the image quality metrics and the computational load of these methods, the image entropy (IE), image contrast (IC), and computational time for each algorithm are shown in Table 4 [45]. The image entropy shows the image-focus quality. The lower the entropy, the better the effectiveness of focusing. Image contrast is the difference in color within the image and indicates the texture characteristics of the image. The greater the contrast, the more visible the image details. Compared with the other three algorithms, the contrast of the images was improved and the image entropy was reduced by an order of magnitude when using the proposed method. These results show that the image quality of the proposed method was superior to that of the other algorithms and achieved a good focus on the target. Furthermore, it is obvious that the time complexity of the proposed method was only 1.5% that of the BPA, 0.3% that of the OMP, and close to that of the NUFFT-RMA. Its imaging efficiency can offer good performance in such scenarios as near-field real-time SAR imaging.
I C o n t r a s t = M N α i j 2 2 i = 1 M j = 1 N α i j 4 I E n t r o p y = i = 1 M j = 1 N α i j 2 α i j 2 2 log α i j 2 α i j 2 2

3.3. Imaging Evaluation with Multiple Targets

The imaging effect of multiple targets is determined by many factors, such as target scattering characteristics, data sparsity, etc. In this section, to further validate the strong robustness of the proposed algorithm for multiple targets, we randomly selected 50% of the 3DRIED [22] raw data and reconstructed the images from these imaging algorithms. Since the radar antenna spacing in 3DRIED is greater than half a wavelength, the SAR images based on conventional algorithms appeared as ghost images. Figure 10 shows the optical images of multiple targets. These include a pistol, knife, and stiletto. The 2D multi-target imaging results and the 3D imaging envelope are shown in Figure 11, and a brief analysis is provided.
Observing the images for the multiple targets with different scattering coefficients in the space, their outlines on the reconstructed image were varied. The sidelobe/grating lobes clutter of the images obtained using different algorithms was diverse, which was reflected in the purity of the background. The sidelobe/grating lobes generated by the traditional MF method were relatively severe, and the operation using beam compensation efficiently decreased the sidelobe clutter [21]; this is outside the scope of this paper. The imaging results obtained using the OMP showed that a weak scattering target, such as a pistol, could not be imaged properly. Therefore, these results show that OMP is weak in robustness, requiring high SNR, and the computational efficiency of the algorithm is poor, which demands a large computational load. Compared with these methods, the proposed method effectively reduced the sidelobes/grating lobes and reconstructed the image of multiple targets with high efficiency by combining MF and sparse reconstruction algorithms. The image entropy and contrast of the imaging results obtained by the proposed method also reached an excellent level, as described in the previous paragraph, and the image quality was significantly improved.

4. Conclusions

In this paper, we describe the design of a 3D near-field millimeter-wave SAR imaging platform and propose a 3D near-field sparse direct imaging algorithm for irregular trajectories. Our proposed algorithm provided better performance in suppressing side lobes/grating lobes compared with traditional methods such as BPA in the time domain, NUFFT-RMA in the frequency domain, and OMP using compressed sensing theory; it required less computation time and storage space and provided significant improvement in the imaging quality of multiple targets. The algorithm has good robustness and obtained higher focusing performance. Use of the algorithm is feasible in typical applications such as freehand imaging, UAV SAR, and automotive imaging. We demonstrated through simulation and experimental studies that our algorithm achieved much higher SAR image quality compared with the traditional algorithms. Our goal is to contribute to the promotion of a complete and effective imaging process for industrial research.

Author Contributions

Conceptualization, S.S. and S.X.; methodology, S.S. and S.X.; software, S.S.; validation, S.S. and S.Q.; formal analysis, S.S., S.Q. and J.W.; investigation, S.S. and J.W.; resources, S.X., S.Q. and Y.L.; data curation, S.S. and D.S.; writing—original draft preparation, S.S.; writing—review and editing, S.S. and S.Q.; visualization, S.S., S.Q. and S.X.; supervision, J.W. and D.S.; project administration, S.X., S.Q. and Y.L.; funding acquisition, S.X. and Y.L. All authors have read and agreed to the published version of the manuscript.

Funding

This research was funded by the National Natural Science Foundation of China (61971429, 61921001, 62001487).

Data Availability Statement

Not applicable.

Acknowledgments

The authors would like to thank the anonymous reviewers and editors for their selfless help to improve our manuscript. Thanks to School of Information and Communication Engineering, University of Electronic Science and Technology of China, Chengdu Shunjun Wei providing 3DRIED dataset.

Conflicts of Interest

The authors declare no conflict of interest.

References

  1. Sheen, D.; McMakin, D.; Hall, T. Three-Dimensional Millimeter-Wave Imaging for Concealed Weapon Detection. IEEE Trans. Microw. Theory Tech. 2001, 49, 1581–1592. [Google Scholar] [CrossRef]
  2. Sheen, D.M.; McMakin, D.L.; Hall, T.E. Combined Illumination Cylindrical Millimeter-Wave Imaging Technique for Concealed Weapon Detection. In Proceedings of the Conference on Passive Millimeter-Wave Imaging Technology IV, Orlando, FL, USA, 20 July 2000; pp. 52–60. [Google Scholar]
  3. Di Meo, S.; Matrone, G.; Pasian, M.; Bozzi, M.; Perregrini, L.; Magenes, G.; Mazzanti, A.; Svelto, F.; Summers, P.E.; Renne, G.; et al. High-Resolution Mm-wave Imaging Techniques and Systems for Breast Cancer Detection. In Proceedings of the IEEE MTT-S International Microwave Workshop Series on Advanced Materials and Processes for RF and THz Applications, Pavia, Italy, 20–22 September 2017; pp. 1–3. [Google Scholar]
  4. Mirbeik-Sabzevari, A.; Li, S.; Garay, E.; Nguyen, H.-T.; Wang, H.; Tavassolian, N. Synthetic Ultra-High-Resolution Millimeter-Wave Imaging for Skin Cancer Detection. IEEE Trans. Biomed. Eng. 2018, 66, 61–71. [Google Scholar] [CrossRef]
  5. Smith, J.W.; Thiagarajan, S.; Willis, R.; Makris, Y.; Torlak, M. Improved static hand gesture classification on deep convolutional neural networks using novel sterile training technique. IEEE Access 2021, 9, 10893–10902. [Google Scholar] [CrossRef]
  6. Smith, J.W.; Furxhi, O.; Torlak, M. An FCNN-based super-resolution mmWave radar framework for contactless musical instrument interface. IEEE Trans. Multimed. 2021, 24, 2315–2328. [Google Scholar] [CrossRef]
  7. Kharkovsky, S.; Zoughi, R. Microwave and Millimeter Wave Nondestructive Testing and Evaluation-Overview and Recent Advances. IEEE Instrum. Meas. Mag. 2007, 10, 26–38. [Google Scholar] [CrossRef]
  8. Ghasr, M.T.; Kharkovsky, S.; Bohnert, R.; Hirst, B.; Zoughi, R. 30 GHz linear High-resolution and Rapid Millimeter Wave Imaging System for NDE. IEEE Trans. Antennas Propag. 2013, 61, 4733–4740. [Google Scholar] [CrossRef]
  9. Liu, T.; Zhao, Y.; Wei, Y.; Zhao, Y.; Wei, S. Concealed object detection for activate millimeter wave image. IEEE Trans. Ind. Electron. 2019, 66, 9909–9917. [Google Scholar] [CrossRef]
  10. Yanik, M.E.; Torlak, M. Near-field 2-D SAR imaging by millimeter-wave radar for concealed item detection. In Proceedings of the 2019 IEEE radio and Wireless Symposium (RWS), Orlando, FL, USA, 20–23 January 2019; pp. 1–4. [Google Scholar]
  11. Xing, M.; Jiang, X.; Wu, R.; Zhou, F.; Bao, Z. Motion Compensation for UAV SAR based on Raw Radar Data. IEEE Trans. Geosci. Remote Sens. 2009, 47, 2870–2883. [Google Scholar] [CrossRef]
  12. Rankin, G.; Tirkel, A.; Leukhin, A. Millimeter Wave Array for UAV Imaging MIMO Radar. In Proceedings of the 2015 16th International Radar Symposium, Dresden, Germany, 24–26 June 2015; pp. 499–504. [Google Scholar]
  13. Elgy, J.; Andre, D.; Finnis, M. Volumetric SAR near-field upsampling and basebanding. Electron. Lett. 2020, 56, 622–624. [Google Scholar] [CrossRef] [Green Version]
  14. Zhao, S.; Zhang, Z.; Zhang, T.; Guo, W.; Luo, Y. Transferable SAR Image Classification Crossing Different Satellites under Open Set Condition. IEEE Geosci. Remote Sens. Lett. 2022, 19, 1–5. [Google Scholar] [CrossRef]
  15. Kan, T. Implementation of Real-time Automotive SAR Imaging. In Proceedings of the 11th Sensor Array and Multichannel Signal Processing Workshop, Hangzhou, China, 8–11 June 2020; pp. 1–4. [Google Scholar]
  16. Song, S.; Xing, S.; Wang, J.; Li, Y.; Pang, B. Validation of near-field millimeter wave radar-based RD and RMA time-frequency domain imaging algorithms. In Proceedings of the 2022 IEEE 6th Information Technology and Mechatronics Engineering Conference (ITOEC), Chongqing, China, 4–6 March 2022; pp. 1885–1889. [Google Scholar]
  17. Kan, Y.; Zhu, Y.; Zhou, J.; Yang, L.; Tang, L.; Fu, Q. Perturbation-based method for near-field cross-section imaging. Electron. Lett. 2016, 53, 110–111. [Google Scholar] [CrossRef]
  18. Alvarez-Narciandi, G.; Laviada, J.; Las-Heras, F. Towards turning smartphones into mmWave scanners. IEEE Access 2021, 9, 45147–45154. [Google Scholar] [CrossRef]
  19. Smith, J.W.; Torlak, M. Efficient 3-D Near-Field MIMO-SAR Imaging for Irregular Scanning Geometries. IEEE Access 2022, 10, 10283–10294. [Google Scholar] [CrossRef]
  20. Alvarez-Narciandi, G.; Laviada, J.; Alvarez-Lopez, Y.; Ducournau, G.; Luxey, C.; Belem-Goncalves, C.; Gianesello, F.; Nachabe, N.; Del Rio, C.; Las-Heras, F. Freehand system for antenna diagnosis based on amplitude-only data. IEEE Trans. Antennas Propag. 2021, 69, 4988–4998. [Google Scholar] [CrossRef]
  21. Song, S.; Lu, J.; Xing, S.; Quan, S.; Wang, J.; Li, Y.; Lian, J. Near Field 3-D Millimeter-Wave SAR Image Enhancement and Detection with Application of Antenna Pattern Compensation. Sensors 2022, 22, 4509. [Google Scholar] [CrossRef] [PubMed]
  22. Wei, S.; Zhou, Z.; Wang, M.; Wei, J.; Liu, S.; Shi, J.; Zhang, X.; Fan, F. 3DRIED: A high-resolution 3-D millimeter-wave radar dataset dedicated to imaging and evaluation. Remote Sens. 2021, 13, 3366. [Google Scholar] [CrossRef]
  23. Ren, K.; Wang, Q.; Burkholder, R.J. A fast back-projection approach to diffraction tomography for near-field microwave imaging. IEEE Antennas Wirel. Propag. Lett. 2019, 18, 2170–2174. [Google Scholar] [CrossRef]
  24. Wang, J.; Aubry, P.; Yarovoy, A. 3-D Short-Range Imaging With Irregular MIMO Arrays Using NUFFT-Based Range Migration Algorith. IEEE Trans. Geosci. Remote Sens. 2020, 58, 4730–4742. [Google Scholar] [CrossRef]
  25. Yanik, M.E.; Torlak, M. Near-Field MIMO-SAR Millimeter-Wave Imaging with Sparsely Sampled Aperture Data. IEEE Access 2019, 7, 31801–31819. [Google Scholar] [CrossRef]
  26. Chen, X.; Wang, H.; Yang, Q.; Zeng, Y.; Deng, B. An Efficient MMW 3D Imaging Algorithm for Near-Field MIMO-SAR with Nonuniform Transmitting Array. IEEE Antennas Wirel. Propag. Lett. 2022, 21, 2035–2039. [Google Scholar] [CrossRef]
  27. Yong, W.; Song, H.; Shang, X.; Zheng, J. Improved RMA based on Nonuniform Fast Fourier Transforms(NUFFT’s). In Proceedings of the 2008 9th International Conference on Signal Processing, Beijing, China, 26–29 October 2008. [Google Scholar]
  28. Chen, X.; Wang, H.; Deng, G.; Yang, Q.; Zeng, Y.; Deng, B. Efficient Millimeter-Wave Imaging Algorithm for Layered Dielectrics Based on MIMO-SAR with Nonuniform Transmitting Array. IEEE Antennas Wirel. Propag. Lett. 2022, 1–5. [Google Scholar] [CrossRef]
  29. Burkholder, R.J.; Browne, K.E. Coherence factor enhancement of through-wall radar images. IEEE Antennas Wirel. Propag. Lett. 2010, 9, 842–845. [Google Scholar] [CrossRef]
  30. Jiang, Y.; Qin, Y.; Wang, H.; Deng, B.; Liu, K.; Cheng, B. A side-lobe suppression method based on coherence factor for terahertz array imaging. IEEE Access 2018, 6, 5584–5588. [Google Scholar] [CrossRef]
  31. Jungang, Y.; Xiaotao, H.; Tian, J. Compressed Sensing Radar Lmaging; Publishing House of Sciense: Beijing, China, 2014. [Google Scholar]
  32. Wang, Y.; Zhang, X.; Zhan, X.; Zhang, T.; Zhou, L.; Shi, J.; Wei, S. An RCS Measurement Method Using Sparse Imaging Based 3-D SAR Complex Image. IEEE Antennas Wirel. Propag. Lett. 2021, 21, 24–28. [Google Scholar] [CrossRef]
  33. Tian, B.; Zhang, X.; Li, L.; Pu, L.; Pu, L.; Shi, J.; Wei, S. Fast Bayesian Compressed Sensing Algorithm via Relevance Vector Machine for LASAR 3D Imaging. Remote Sens. 2021, 13, 1751. [Google Scholar] [CrossRef]
  34. Lu, B.; Sun, X.; Zhao, Y.; Zhou, Z. Phase coherence factor for mitigation of sidelobe artifacts in through-the-wall radar imaging. J. Electromagn. Waves Appl. 2013, 27, 716–725. [Google Scholar] [CrossRef]
  35. Cai, T.T.; Wang, L. Orthogonal matching pursuit for sparse signal recovery with noise. IEEE Trans. Inf. Theory 2011, 57, 4680–4688. [Google Scholar] [CrossRef]
  36. Qian, Y.; Zhu, D. High-resolution SAR imaging from azimuth periodically gapped raw data via generalised orthogonal matching pursuit. Electron. Lett. 2018, 54, 1235–1237. [Google Scholar] [CrossRef]
  37. Zhu, X.X.; Bamler, R. Super-resolution of sparse reconstruction for tomographic SAR imaging-demonstration with real data. In Proceedings of the EUSAR 2012, 9th European Conference on Synthetic Aperture Radar, Nuernberg, Germany, 23–26 April 2012; pp. 215–218. [Google Scholar]
  38. Wei, S.-J.; Zhang, X.-L.; Shi, J.; Xiang, G. Sparse reconstruction for SAR imaging based on compressed sensing. Prog. Electromagn. Res. 2010, 109, 63–81. [Google Scholar] [CrossRef] [Green Version]
  39. Yanik, M.E. Millimeter-Wave Imaging Using MIMO-SAR Techniques; The University of Texas at Dallas: Richardson, TX, USA, 2020. [Google Scholar]
  40. Brekhovskikh, L.M.; Godin, O.A. Acoustics of Layered Media II: Point Sources and Bounded Beams; Springer Science & Business Media: New York, NY, USA, 2013; Volume 10. [Google Scholar]
  41. Weyl, H. Ausbreitung elektromagnetischer Wellen über einem ebenen Leiter. Ann. Phys. 1919, 365, 481–500. [Google Scholar] [CrossRef]
  42. Lazarov, A.; Minchev, D. 2-D Sparse Decomposition and L 0 Norm Minimization in SAR Imaging. In Proceedings of the 2020 21st International Radar Symposium (IRS), Warsaw, Poland, 5–8 October 2020; pp. 45–50. [Google Scholar]
  43. Zhang, L.; Wang, H.; Qiao, Z.-J. Resolution enhancement for ISAR imaging via improved statistical compressive sensing. EURASIP J. Adv. Signal Process. 2016, 2016, 80. [Google Scholar] [CrossRef] [Green Version]
  44. Cetin, M.; Karl, W. Feature-Enhanced Synthetic Aperture Radar Image Formation Based on Nonquadratic Regularization. IEEE Trans. Image Process. 2001, 10, 623–631. [Google Scholar] [CrossRef] [PubMed] [Green Version]
  45. Zhang, S.; Liu, Y.; Li, X. Fast Entropy Minimization Based Autofocusing Technique for ISAR Imaging. IEEE Trans. Signal Process. 2015, 63, 3425–3434. [Google Scholar] [CrossRef]
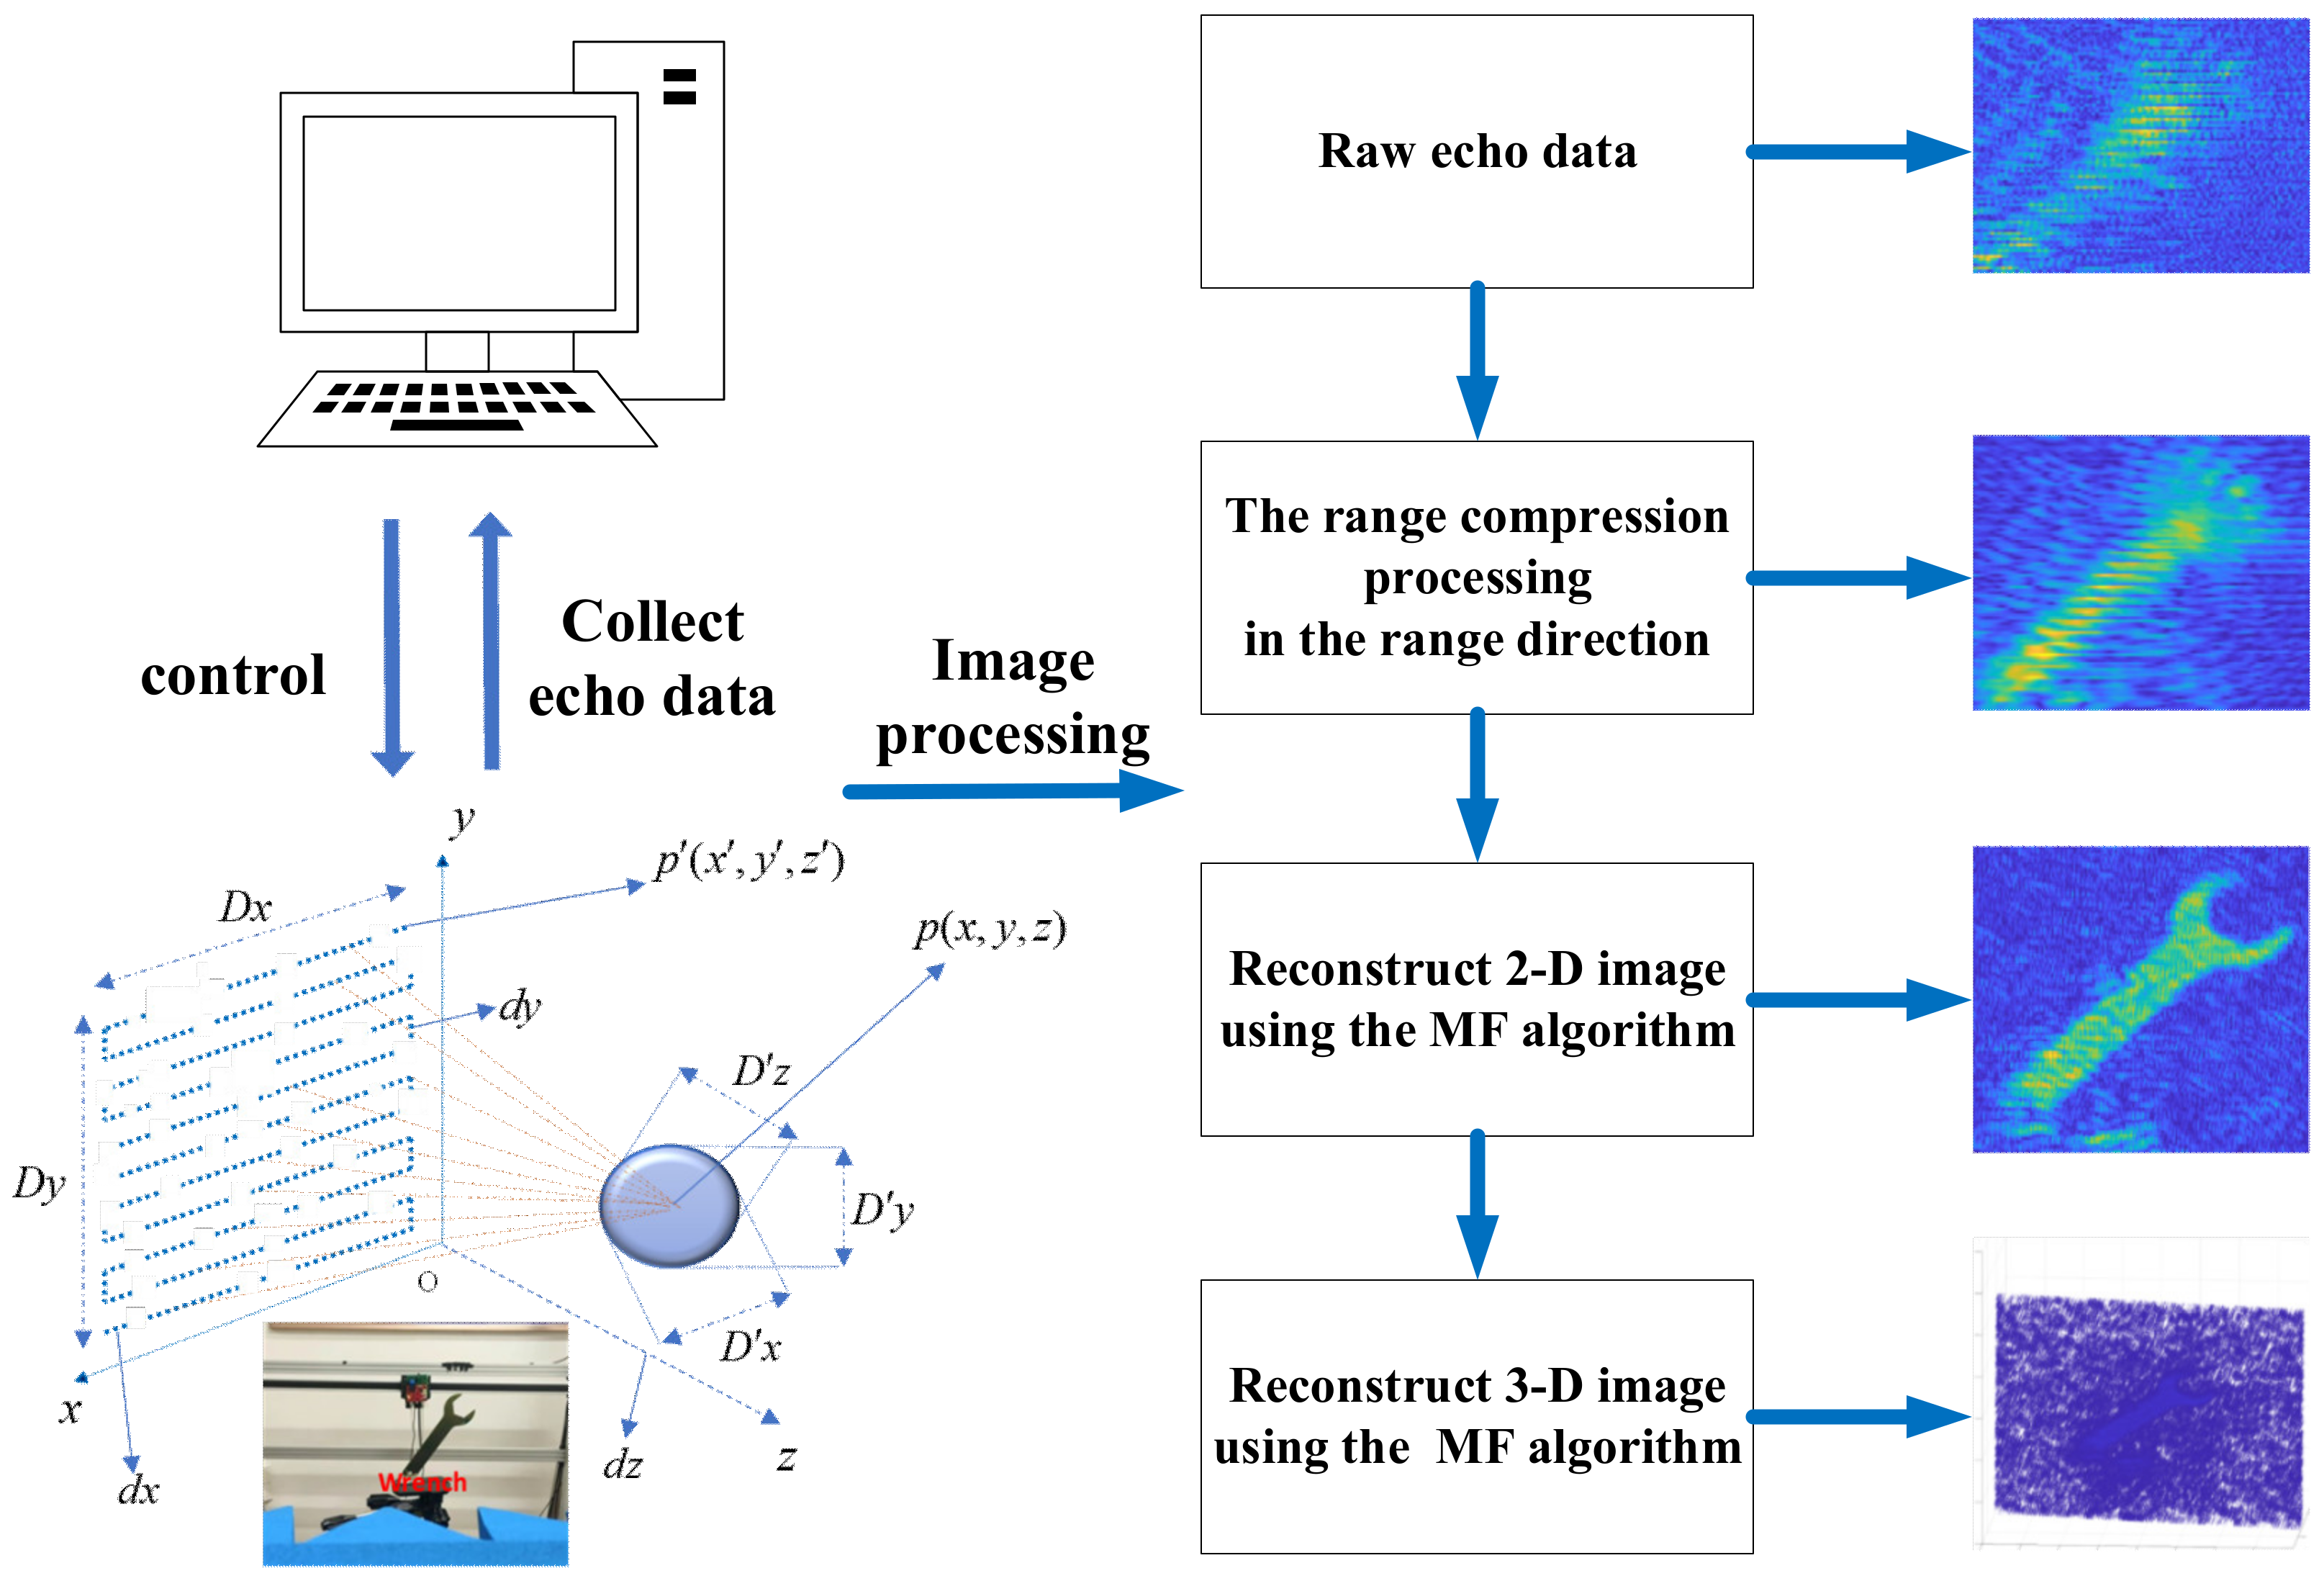
Figure 1. The mmWave SAR imaging framework.
Remotesensing 14 06321 g001
Figure 2. The target scattering area selection map.
Remotesensing 14 06321 g002
Figure 3. The geometric explanation of the iterative operation.
Remotesensing 14 06321 g003
Figure 4. The geometric model of the point target.
Remotesensing 14 06321 g004
Figure 5. Spatial target model of multiple points in an ideal space. (a) The 2D multiple-point imaging result of BPA. (b) The 2D multiple-point imaging result of NUFFT-RMA. (c) The 2D multiple-point imaging result of OMP. (d) The 2D multiple-point imaging result of the proposed method.
Remotesensing 14 06321 g005
Figure 6. The wrench optical image.
Remotesensing 14 06321 g006
Figure 7. Imaging results. Row 1 (ad) is the 2D wrench imaging results of the four imaging algorithms. Row 2 (eh) is the 3D wrench imaging results of the four imaging algorithms. Column 1 is the BPA imaging results; Column 2 is the NUFFT‐RMA imaging results; Column 3 is the OMP imaging results; Column 4 is the proposed method’s imaging results.
Remotesensing 14 06321 g007
Figure 8. Azimuthal and elevation profiles. (a) The azimuthal profiles of the multiple targets. (b) The elevation profiles of the multiple targets. (c) The azimuthal profile of the wrench. (d) The elevation profile of the wrench.
Remotesensing 14 06321 g008
Figure 9. Imaging results of phase. (a) The imaging result of phase when using BPA. (b) The imaging result of phase when using NUFFT-RMA. (c) The imaging result of phase when using OMP. (d) The imaging result of phase when using the proposed method.
Remotesensing 14 06321 g009aRemotesensing 14 06321 g009b
Figure 10. The optical images of multiple targets.
Remotesensing 14 06321 g010
Figure 11. Imaging results of multiple targets using different algorithms. Rows 1 (ad) and 3 (il) are the 2D imaging results; Rows 2 (eh) and 4 (mp) are the 3D imaging results; Rows 1 and 2 are the results for the pistol and knife; Rows 3 and 4 are the results for the pistol and stiletto; Column 1 is the BPA imaging results; Column 2 is the RMA imaging results; Column 3 is the OMP imaging results; Column 4 is the proposed method imaging results.
Remotesensing 14 06321 g011aRemotesensing 14 06321 g011b
Table 1. The steps of the proposed sparse imaging algorithm.
3D Sparse SAR Direct Imaging with Irregular Samples
1. Initial imaging by NUFFT-RMA to get the imaging result X .
2. According to Equation (18), determine the target area C .
3. For the sparse SAR imaging
   a. According to the target area C and imaging result X ,take the idea of Cetin’s process, and obtain the cost function f .
   b. Using the Gaussian iterative method to Simplify the derivative equation.
   c. Obtain and store A H A and A H Y in advance and Calculate X n + 1 iteratively according to Equation (21), and get the final calculation results
X = X n + 1 X n + 1 X n 2 2 / X 2 2 ξ
Table 2. The parameters of the SAR platform.
Parameter TypeNumerical ValueUnit
Centre carrier frequency79GHz
Platform speed20mm/s
Bandwidth4GHz
Simulation synthetic aperture size200 × 200 mm2
Measured wrench synthetic aperture size300 × 300mm2
Vertical distance between scissor and radar230mm
Vertical distance between wrench and radar300mm
Table 3. The mean difference of principal lobes.
MethodMean Difference of Principal Lobes in SimulationMean Difference of Principal Lobes in Real Data
BPA −6.24 dB−3.18 dB
NUFFT-RMA −2.23 dB−7.62 dB
OMP −18.96 dB−9.26 dB
Proposed method −3.68 dB−2.49 dB
Table 4. Quality and time complexity.
MethodContrastEntropyTime (s)
BPA 210.00244.7544213.6
NUFFT-RMA 216.16025.03803.1
OMP 232.11753.9752998.4
Proposed method 240.25253.80083.2
Publisher’s Note: MDPI stays neutral with regard to jurisdictional claims in published maps and institutional affiliations.