Article

Sentinel-1 Backscatter Time Series for Characterization of Evapotranspiration Dynamics over Temperate Coniferous Forests

by
Marlin M. Mueller
1,2,*,
Clémence Dubois
2,
Thomas Jagdhuber
3,4,
Florian M. Hellwig
2,3,
Carsten Pathe
2,
Christiane Schmullius
2 and
Susan Steele-Dunne
5
1
Institute of Data Science, German Aerospace Center, Maelzerstraße 3-5, 07745 Jena, Germany
2
Department for Earth Observation, Friedrich Schiller University, Leutragraben 1, 07743 Jena, Germany
3
Microwaves and Radar Institute, German Aerospace Center, 82234 Wessling, Germany
4
Institute of Geography, University of Augsburg, 86159 Augsburg, Germany
5
Department of Geoscience and Remote Sensing, Delft University of Technology, 2628 CN Delft, The Netherlands
*
Author to whom correspondence should be addressed.
Remote Sens. 2022, 14(24), 6384; https://doi.org/10.3390/rs14246384
Submission received: 24 November 2022 / Revised: 14 December 2022 / Accepted: 15 December 2022 / Published: 16 December 2022

Abstract

:
Forests’ ecosystems are an essential part of the global carbon cycle with vast carbon storage potential. These systems are currently under external pressures showing increasing change due to climate change. A better understanding of the biophysical properties of forests is, therefore, of paramount importance for research and monitoring purposes. While there are many biophysical properties, the focus of this study is on the in-depth analysis of the connection between the C-band Copernicus Sentinel-1 SAR backscatter and evapotranspiration (ET) estimates based on in situ meteorological data and the FAO-based Penman–Monteith equation as well as the well-established global terrestrial ET product from the Terra and Aqua MODIS sensors. The analysis was performed in the Free State of Thuringia, central Germany, over coniferous forests within an area of 2452 km2, considering a 5-year time series (June 2016–July 2021) of 6- to 12-day Sentinel-1 backscatter acquisitions/observations, daily in situ meteorological measurements of four weather stations as well as an 8-day composite of ET products of the MODIS sensors. Correlation analyses of the three datasets were implemented independently for each of the microwave sensor’s acquisition parameters, ascending and descending overpass direction and co- or cross-polarization, investigating different time series seasonality filters. The Sentinel-1 backscatter and both ET time series datasets show a similar multiannual seasonally fluctuating behavior with increasing values in the spring, peaks in the summer, decreases in the autumn and troughs in the winter months. The backscatter difference between summer and winter reaches over 1.5 dB, while the evapotranspiration difference reaches 8 mm/day for the in situ measurements and 300 kg/m2/8-day for the MODIS product. The best correlation between the Sentinel-1 backscatter and both ET products is achieved in the ascending overpass direction, with datasets acquired in the late afternoon, and reaches an R2-value of over 0.8. The correlation for the descending overpass direction reaches values of up to 0.6. These results suggest that the SAR backscatter signal of coniferous forests is sensitive to the biophysical property evapotranspiration under some scenarios.

1. Introduction

Forests play a major role in the global carbon cycle with their huge carbon storage potential while providing large heterogenous ecosystems vital for a diverse fauna and flora [1]. The temperate and boreal forests provide an estimated yearly carbon sink of around one to two billion tons of atmospheric CO2 [2], of which up to 80% is stored in the temperate regions with fire suppression and plantation forestry [3,4]. Even with extensive research, the absolute contribution of forests to terrestrial carbon storage still shows uncertainties of 20% [5]. Information with higher spatial and temporal resolution is not only necessary for conservation and scientific studies of forests but can also be required for the economic evaluation of forest areas. Besides its role as a diverse natural habitat, forests provide an important socio-economic function, for example, by providing recreational areas as well as sustainable building materials [6]. Due to climate change, a slow change of tree type distribution is foreseeable in central Europe with the urgency to shift to more resilient tree types. The trend is turning away from coniferous trees such as spruce or pine towards deciduous tree types including beech, oak or sycamore and towards more diverse mixed forest stands instead of monocultures [7].
With forests being an ecosystem under pressure due to climate change, monitoring and studying their short-term, seasonal and long-term changes and developments are paramount [8,9,10,11,12]. This demands quantitative and timely characterization of a multitude of different biophysical properties of forest areas. More advanced biophysical forest properties, such as physiology/structure, dry and wet biomass, water and sap flux information, vegetation water content or transpiration are covered by the standard inventory measurements either with low precision or not at all [7]. One important metric is evapotranspiration which describes the gas and energy exchange between the Earth’s surface and its atmosphere. In particular for forests, the large volumetric surface area means that these exchanges are relevant on a local, regional and continental scale [13]. A better understanding of these water-, gas- and energy fluxes (in short, evapotranspiration) is important, to quantify these developments for large research fields such as climatology, meteorology or hydrology [14,15].
The incoming solar radiation at the Earth’s surface is at least partially re-emitted as heat radiation by all surface features to a varying degree. Due to the inflowing energy, water is lost to the atmosphere through soil evaporation [16]. As plants uptake water through the roots in the process of the photosynthetic cycle to produce energy, a varying percentage of this water is lost as water vapor through the leaf stomatal pores [17]. This process is called transpiration. The combined evapotranspiration (ET) is, therefore, one of the major components of the global water and energy exchange and functions as the driving force of land–atmosphere interactions which is inherently difficult to analyze at a larger scale [16]. Due to its linkage to both heat flux systems and soil moisture systems, it is a very important metric for monitoring plants’ water demand, productivity and agricultural management systems [18] as well as a very useful indicator for drought monitoring, early warning systems and even flood warning [19]. An extensive review and overview of the most common ground-based and remotely sensed evapotranspiration estimation approaches are presented by Talsma et al. [20] and Verstraeten et al. [19]. Evapotranspiration is also regarded as an important factor in the monitoring of the essential climate variables “Evaporation” and “Soil Moisture” by the Global Climate Observing System (GCOS) which is using latent heat flux and surface soil moisture as estimation products [21].
Evapotranspiration calculations are very sensitive to the available input parameters and can present vastly different behavior if the input datasets are not of very high quality [22]. For this reason, the scale of evapotranspiration measurement or estimation is a very important factor to consider for each individual analysis. With increasing scale from single-plant to landscape or national levels, the estimation difficulty and effort increases exponentially with in situ measurements, and the high accuracy of small-scale measurements cannot be maintained [22]. Therefore, remote sensing capabilities are integrated for large-scale evapotranspiration estimations, especially if a higher temporal resolution is necessary [19]. While there are multiple approaches for calculating the evapotranspiration based on either meteorological and/or remotely sensed input datasets, this study focuses on the Penman–Monteith-based approach, adapted by the Food and Agriculture Organization of the United Nations (FAO), which combines different ET estimation approaches based on the work by Monin and Obukhov [23], Penman [24] and Monteith [17] into one generalized approach [25]. Its basic input variables consist of temperature, wind speed, solar radiation and vapor pressure (see Section 3.3), but for most parameters alternative substitute variables are presented by the FAO approach [25]. In addition to comparatively easily obtainable meteorological datasets, the FAO Penman–Monteith approach can be used to calculate evapotranspiration based on remotely sensed datasets.
Most remotely sensed evapotranspiration acquisition approaches utilize optical sensors, capable of detecting near- and thermal infrared wavelengths to estimate the land surface temperature (LST) [19]. Commonly used optical sensors in the estimation of evapotranspiration are the Terra/Aqua Moderate Resolution Imaging Spectroradiometer (MODIS) sensors with high temporal resolution and moderate spatial resolution (500 m) for the infrared wavelengths. Previous studies [26] could show that LST data alone are insufficient for a precise evapotranspiration estimation by the MODIS sensors, which is why the current models utilize a combination of remote sensing and meteorological datasets for the estimation [20,27].
With the introduction of radar remote sensing with high temporal and spatial resolution, different approaches are presented to utilize the advantages of radar systems for a more advanced evapotranspiration estimation using remote sensing data. Due to its sensitivity to soil moisture and vegetation water content, a connection to optical-remote-sensing-based evapotranspiration estimation seems obvious [28]. Most analyses utilizing radar remote sensing datasets either focus on the correlation of backscatter and soil moisture or the fusion of optical evapotranspiration estimation with supporting radar remote sensing data [13,28,29,30,31]. Other approaches estimate the influence of soil moisture and evapotranspiration together on the water drainage volume (irrigation quantification) based on Sentinel-1 datasets and are able to distinguish between both influences individually [32]. In other studies, the correlation between Sentinel-1 backscatter and evapotranspiration was created indirectly by correlating evapotranspiration and optical vegetation indices and afterwards correlating vegetation indices and radar backscatter [33,34]. Even though the study by El-Shirbeny and Abutaleb [33] does not utilize a huge number of acquisitions, a high degree of correlation between evapotranspiration and radar backscatter was observed.
To our knowledge, no direct correlation of Sentinel-1 backscatter with ground-based and remotely sensed evapotranspiration was done for forested areas over a long period of time with such a high temporal and geometric resolution. We present here, therefore, a direct assessment of the potential of SAR backscatter to give information about the seasonal behavior of evapotranspiration over coniferous forest in order to get better insight into energy fluxes over these ecosystems.

2. Materials and Study Site

2.1. Study Site

The considered study site is shown in Figure 1. It is located in the southeast of the Free State of Thuringia in central Germany. While the northwestern and southeastern regions are dominated by agricultural land cover, the center and southwest regions consist mainly of coniferous forests in the lower mountain ranges of the Thuringian Forest [35]. Four areas of interest (AOI) were defined within the study site (blue circles in Figure 1), with a radius of 5 km each. These areas are centered around four weather stations (see Section 2.2.3) and cover a total area of roughly 315 km2. The AOIs are named after the closest villages to the weather stations in the center of each AOI, with “Lotschen” in the northeast, “Burkersdorf” in the southeast, “Treppendorf” in the northwest and “Oberweissbach” in the southwest. The land cover around all four stations is dominated by agriculture with interspersed coniferous forested areas (119 km2) [36]. For the further analysis, we selected 25 patches of coniferous forest (yellow dots on Figure 1) within each AOI. The coniferous areas in the AOI are characterized by a tree canopy density (TCD) ranging from 70% up to 94% and with a mean TCD of 85% [37]. In the study site, the main coniferous tree species are spruce, pine and fir. All four AOIs show light to moderate topography ranging from 1° up to 24° with a median slope of 6° across 100 measured sites (25 per AOI) [38].
The temperate climate in the study area is dominated by the Westerlies with average monthly temperatures between −1 °C and 19 °C and a resulting vegetation period of around seven months. Average cumulative precipitation of the long-term reference (1961–1990) lies between 530 and 690 mm per year, measured across ten weather stations throughout the study site [39]. Within the last ten years, only two (2013, 2017) showed above average cumulative precipitation, while four years (2011, 2015, 2018, 2019) showed a decrease in yearly precipitation of at least 10% compared to the reference time period [39,40]. In addition to rising average temperatures, an increase of sunshine hours can be observed for the Free State of Thuringia as well. According to the Thuringian climate report of 2020, a clear trend of rising average temperatures, increasing CO2-levels and decreasing precipitation has led to more occurrences of droughts during the summer months [40].

2.2. Datasets

A portfolio of different data products was used, ranging from in situ ground station data to spaceborne remote sensing observations of different platforms. The main datasets consist of weather station data, Sentinel-1 C-band SAR time series as well as Terra/Aqua MODIS evapotranspiration time series. All remote sensing datasets were acquired for the period between July 2016 and June 2021. In the preliminary selection of suitable test sites, additional Copernicus Land Monitoring Service datasets such as “land cover”, “tree canopy density” and “tree type” products were utilized [36,37,41,42].

2.2.1. Sentinel-1 Time Series

To characterize evapotranspiration with active radar remote sensing data, the widely used Copernicus Sentinel-1 synthetic aperture radar (SAR) data are utilized. Sentinel-1 provides C-band SAR data with a frequency of 5.405 GHz. In this study, ground-range-detected SAR scenes acquired in interferometric wide swath mode (IW GRD) of both satellites (Sentinel-1 A and B) are used (rel. radiometric accuracy: <0.42 dB [43]). All scenes are pre-processed to a radiometrically terraincorrected (RTC) product through the application of orbit files, radiometric calibration to gamma0, multi-looking to 20 m pixel size, radiometric terrain flattening and geocoding by utilizing the pyroSAR code library [44]. The data collection is a continued time series of the dataset presented in a previous study [45] (see Figure 2). A summary of the Sentinel-1 dataset is presented in Table 1.
Three relative orbits are considered (two datasets in ascending overpass direction and one dataset in descending overpass direction). Due to the availability of both Sentinel 1 A and Sentinel 1 B for the study period, a temporal resolution of 6 days is achieved. Descending overpasses are acquired roughly around 05:25 UTC, while ascending overpasses are acquired at 16:59 UTC and 17:08 UTC depending on the relative orbit. For all datasets, co- (VV) and cross-polarized (VH) scenes were considered and analyzed separately. Only the coniferous forested areas (yellow dots in Figure 1) were considered for the time series data extraction for each AOI.

2.2.2. Terra/Aqua MODIS ET Time Series

The well-established and mature Global Terrestrial Evapotranspiration Product (MOD16A2) Version 6 was used as a spaceborne, remotely sensed evapotranspiration (ET) product [46]. MOD16A2 is a composite product utilizing eight days of Moderate Resolution Imaging Spectroradiometer (MODIS) remote sensing data along with meteorological data to determine evapotranspiration and latent heat flux based on the Penman–Monteith approach [17]. The scenes have a geometric resolution of 500 m with ET being represented by the total evapotranspiration in kg/m2/8 day (= mm/8 day) (see Figure 3). A dataset size of 470 individual scenes is available between July 2016 and June 2021, 235 each for Terra MODIS and Aqua MODIS. Terra’s local day overpass time is during the morning around 10:30, while Aqua’s local day overpass time is in the early afternoon around 13:30 [47]. Using the same locations as for the Sentinel-1 time series extraction, only the coniferous forested areas were considered, ensuring that most of the 500 m sample pixel was covered by coniferous forests.

2.2.3. In Situ Meteorological Data

Ground-based meteorological data were collected from the four available weather stations at the center of the AOIs and used to calculate the in situ evapotranspiration (in mm/day) time series (see Figure 4). The stations were selected based on availability of collected meteorological information, as specific datasets must be available for the subsequent calculation of the evapotranspiration based on the Penman–Monteith approach [17]. The respective elevation of each station is as follows: “Burkersdorf” (height: 422 m), “Lotschen” (height: 228 m), “Oberweissbach” (height: 682 m) and “Treppendorf” (height: 421 m). All four stations are maintained and the data are distributed directly by or on behalf of the “Thuringian State Office for Agriculture and Rural Areas” [48]. The diurnal data necessary for the Penman–Monteith approach [25], namely average temperature (°C), minimum daily temperature (°C), maximum daily temperature (°C), average wind speed (m/s), sum of daily precipitation (mm) and sum of global radiation (Wh/m2) were acquired from July 2016 through June 2021. Temperature is measured at 2 m above the ground, while the wind speed is measured at 2.5 m above the ground.

2.2.4. Auxiliary Datasets

For this analysis, precise information about the land cover, tree cover and forest type were required on a high geometric resolution. These datasets were utilized to extract the coniferous forested areas within the AOIs, which are the basis of the remote sensing data analysis. The freely accessible “CORINE Land Cover” (CLC) and “High Resolution Layers” datasets provided by the European Environment Agency (EEA) through the “Copernicus Land Monitoring Service” provide the desired datasets [42]. To gain a general understanding of the land cover composition of the study site, the Copernicus Land Monitoring Service (CLMS) CLC2018 layer was used. Updated every six years, last revised in May of 2020, the current CLC2018 is based on data acquisitions (Sentinel-2 A and B and Landsat-8) from 2017 and 2018 and provides land cover information with a minimum mapping unit of 25 hectares and a minimum width of linear elements of 100 m [36]. As the focus of this study is the investigation of forested areas, the CLMS “Forests High Resolution Layers” for “Tree Cover Density” (TCD) and “Forest Type” (FTY) were additionally utilized to help define the coniferous forested areas as exactly as possible. Both products are provided in 10 m pixel resolution and are based on Sentinel-2 A and B data, collected between March and October of 2018 [37,41].

3. Methods

3.1. Data Selection

As the rough extent and location of the areas of interest within the study site are defined by the location of the four available weather stations, all forest sites for the analyses had to be located within a radius of 5 km around the weather stations in order to keep comparable meteorological conditions. The average distance of the observation sites from the corresponding weather stations is between 3.1 and 3.6 km. For each of the four AOIs, 25 sites were selected over coniferous forest, resulting in 100 individual observation/data collection sites (yellow dots in Figure 1). All points were manually selected based on the FTY layer and visually reviewed using the most recent Google Earth imagery to obtain only the most homogeneous areas of each forest class (see Figure 5). By considering slope information, forested areas with least slope angle were preferably selected to reduce incidence and the aspect angles’ influence. This data selection approach was chosen to ensure the same number of data points for each AOI.

3.2. SAR Time Series Preprocessing

For each of the data observation sites, a square buffer of 120 m was created to extract all pixel information of the Sentinel-1 time series stack based on [35], while ensuring the coniferous land cover stays homogenous. With a 20 m pixel size of the Senti-nel-1 data, this leads to a patch of six-by-six Sentinel-1 pixels for each data observation site. The spatial stability analysis in another study suggests homogenous results of the Sentinel-1 data for multiple neighboring pixels [45]. All backscatter datasets were aggregated again by spatially averaging all data observations around the respective weather station to subsequently compare. This results in a one-dimensional time series per weather station. To examine the behavior of the backscatter signal throughout the study site, the backscatter is visualized in its four different acquisition settings, VH/ascending (VH_Asc), VH/descending (VH_Desc), VV/ascending (VV_Asc), VV/descending (VV_Desc). This allows for the differentiation between morning (5:30 am) and evening (5:00 pm) acquisitions as well as pointing directions of the Sentinel-1 sensor. This is in line with previous studies, as the influence of evaporation and general water content changes throughout the day [49,50]. In addition, the influence of the polarization on wave–canopy interaction can be examined.
In order to remove outliers due to external influences (not related to ET), frost and snow days were removed from the time series of all datasets. Different filtering approaches were also applied to the time series datasets to reduce high-frequency temporal variation while carefully maintaining the seasonal variations of each time series. A simple moving average filter (SMA) with a window size of 10 was applied to the time series [51]. This corresponds to roughly two months of time aggregated for each filtering step. A Singular Spectrum Analysis (SSA) was additionally implemented as a more advanced approach based on [52]. The SSA with a window length of n/2 (n = no. of acquisitions) was used to extract only the seasonal component of each time series while removing very low (interannual) and high-frequency (daily and weekly) temporal variation as much as possible without prior knowledge of the composition of the time series. A comprehensive characterization of the capabilities of SSA for time series analysis is provided in [53].

3.3. ET Time Series Preprocessing

In order to estimate the evapotranspiration based on meteorological parameters of the weather stations, the FAO Penman–Monteith equation was applied [25].
E T 0 = 0.408 Δ R n G + γ 900 T + 273 u 2 e s e a Δ + γ 1 + 0.34 u 2
where ET0 is the reference evapotranspiration (mm/day), Rn is the net radiation at crop surface (MJ/m2/day), G is the soil heat flux density (MJ/m2/day), T is the mean daily air temperature at 2 m height (°C), u2 is the wind speed at 2 m height (m/s), es is the saturation vapor pressure (kPa), ea is the actual vapor pressure (kPa), Δ is the slope vapor pressure curve (kPa/°C) and γ is the psychrometric constant (kPa/°C). This reference equation describes the theoretical evapotranspiration for grass vegetation, and a so-called crop coefficient is needed for different vegetation types [25]. A crop coefficient of 0.95 for coniferous trees was applied based on the suggestion of the FAO [25].
As the weather stations used in this study do not provide all the necessary meteorological parameters, estimates of the missing data are needed. The missing data estimates are already provided by the FAO as standardized equations, requiring only global radiation, mean temperature, minimum temperature, wind speed and elevation for the calculation of the modified FAO Penman–Monteith ET equation. Missing humidity data can be estimated by assuming a dew point equal to the daily minimum temperature Tmin as well as assuming nearly fully saturated air at the minimum temperature, which allows one to calculate the actual vapor pressure ea. The saturation vapor pressure es can be calculated similarly but should take the maximum and minimum temperatures into account as well. For daily or weekly evapotranspiration calculations, the soil heat flux density G is very small compared to the Rn, which is why it can be ignored in this analysis and is set to zero [25]. The slope of the saturation vapor pressure curve Δ is given by the following equation and describes the relationship between es and T:
Δ = 4098 × e s T + 237.3 2
The specific heat at constant pressure (psychrometric constant) γ is a function of altitude z, as pressure is expected at standard atmosphere P (1013.25 hPa, 20 °C) and calculated as [25]:
γ = 0.665 × 10 3 × P
with
P = 101.325 × 293 0.0065 × z 293 5.26
As wind speed measurements u2 are required to be at 2 m above the surface and the wind speed measured at the weather stations is measured at a height of 2.5 m, a logarithmic wind speed adjustment is performed [25].

4. Results and Discussion

4.1. Sentinel-1 Backscatter Time Series

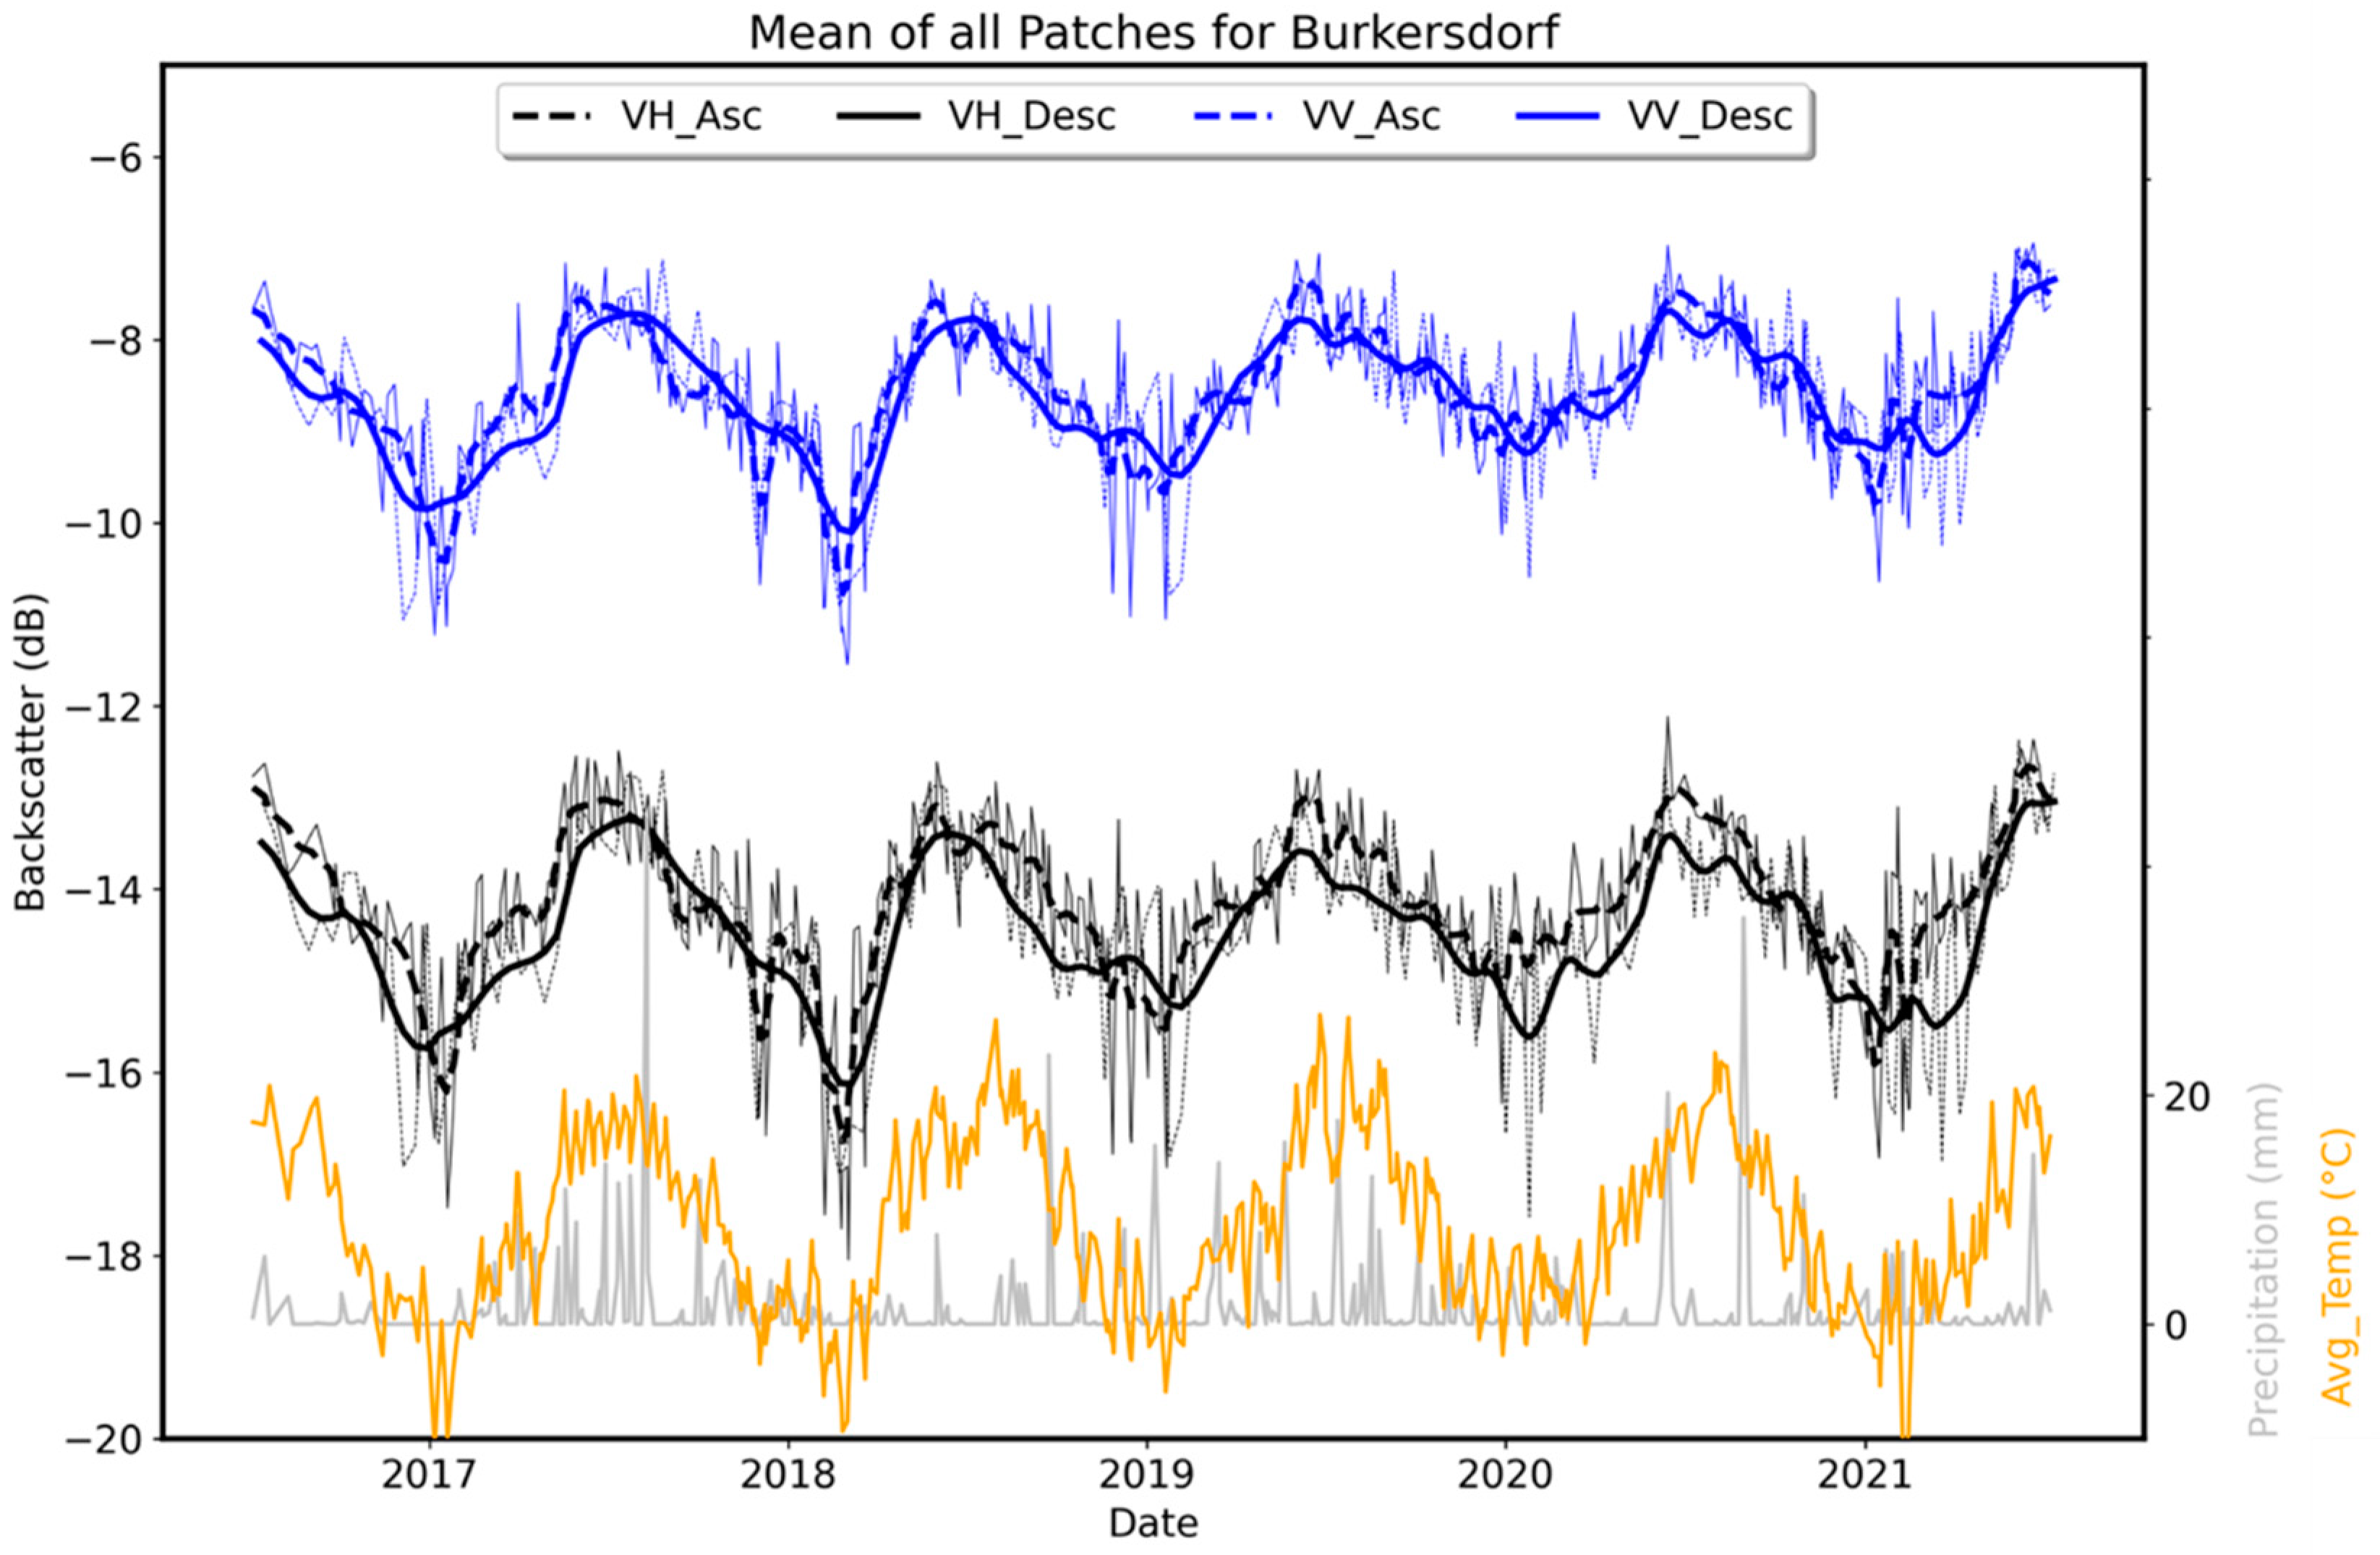
Over coniferous forests, a clear seasonal pattern is recognizable (see Figure 2) with a decrease of backscatter in autumn and an increase of backscatter in spring. The average backscatter difference between the meteorological summer (1 June–31 August) and meteorological winter (1 December–28 February) is 1.50 dB for cross-polarized data and 1.23 dB for co-polarized data [54]. The mean backscatter ranges from −13.73 dB to −14.45 dB for cross-polarized data and from −8.29 dB to 8.98 dB for co-polarized data across all four AOIs. Compared with other studies, the Sentinel-1 backscatter of coniferous forests shows similar behavior with maxima in the summer and minima in the winter months [35,55]. This behavior is congruent with the yearly temperature, water, and carbon cycle, which in turn controls the photosynthetic cycle, leading to a plant growing season represented by the peak of the yearly backscatter curve from spring to autumn in northern latitudes. While this general behavior of coniferous forests in Europe has been described in different studies using C-band SAR data, such as by Rüetschi et al. [56], this holds true only for dense forests, and the behavior weakens in sparsely vegetated coniferous forests [55]. This behavior could be dominated by the changing vegetation water content when having constant biomass conditions (no structural change). This can be assumed, as there should be no dominant influence of the soil moisture at C-band wavelengths in these forests [57].
This behavior is opposite to the findings by Monteith and Ulander [58], who observed a decrease of backscatter intensity in the spring and summer months and an increase of backscatter values in autumn and winter. These behaviors could be explained by the different wavelengths, as Monteith and Ulander [58] used a longer wavelength P-band microwave sensor for their study, where more influence of the ground (soil moisture) and the tree trunks instead of the canopy should be more prominent. Additionally, more sparse boreal forests were studied compared to the temperate forests in this study.
Both ascending and descending overpass directions show very similar seasonal behavior which is also true for all four AOIs. Throughout the time series, “Lotschen” shows the smallest temporal standard deviation of backscatter with 0.48 dB in ascending direction, with “Burkersdorf” showing the highest temporal standard deviation with 0.75 dB in ascending direction. Although special attention was set on the selection of preferably homogenous forest areas without disturbances such as forest roads or forest clearings in close proximity to the coniferous sampling site, some areas classified as coniferous forested areas may still contain a small number of deciduous trees within the forest stand, which could explain the observable differences between the stations. Especially mixed forests present different characteristics compared to coniferous or deciduous forests [35].
Comparing the distribution of VH backscatter between the morning (descending) and evening (ascending) acquisition times [59] as well as between summer and winter season for “wet” (2017, 2021) and “dry” (2016, 2018, 2019) years shows a discernible difference only for the summer months (Figure 6). In the years with less precipitation compared to the long-term average (1961–2010) [39,60], the morning acquisitions show a decreased backscatter by around 0.5 dB compared to years with above average precipitation. In the winter months, this phenomenon cannot be observed with the same scale. This decrease is also only present in the morning acquisitions, suggesting some influence of the time of day on the backscatter which can be attributed to the different vegetation water content levels present at different times of the day. In the morning hours (around 7:30 am local time), the water storage of the plant is replenished after refilling during the night. A smaller backscatter intensity in the morning for dry years would suggest that the water storage is not entirely replenished during the night in dry years. Here not addressed, additional effects of dew present on the vegetation in the morning could also have an influence on this difference [61,62].
As shown in previous works using time series analyses, even small differences in seasonal behavior can be observed with Sentinel-1 C-band data [45]. The different incidence angle for each relative orbit, in addition to the fact that objects are observed from a southwesterly direction in ascending overpass direction and from southeasterly direction in descending overpass direction, renders a direct comparison of backscatter behavior very complex let alone a correlation analysis of different datasets. This is especially true for the small-parceled forests in this study site. Most radiometric and geometric differences should be minimized by the preprocessing applied to all Sentinel-1 scenes based on [44]. Nevertheless, the influence of different look-direction between ascending and descending overpass direction as well as the different local incidence angles could have a stronger effect in forested areas compared to other land cover types [63]. Studies show a significant L-band backscatter decrease of forested areas with increasing incidence angle, where near-range (low incidence angle) objects had a systematically higher backscatter compared to far-range (high incidence angle) objects [63,64]. This behavior was observed in dense forests with L-band sensors compared to the current study with C-band, where the range of incidence angle difference is significantly smaller throughout the study site compared to the study by [64]. In the end, some degree of influence based on the incidence angle cannot be ruled out completely.

4.2. Evapotranspiration Time Series

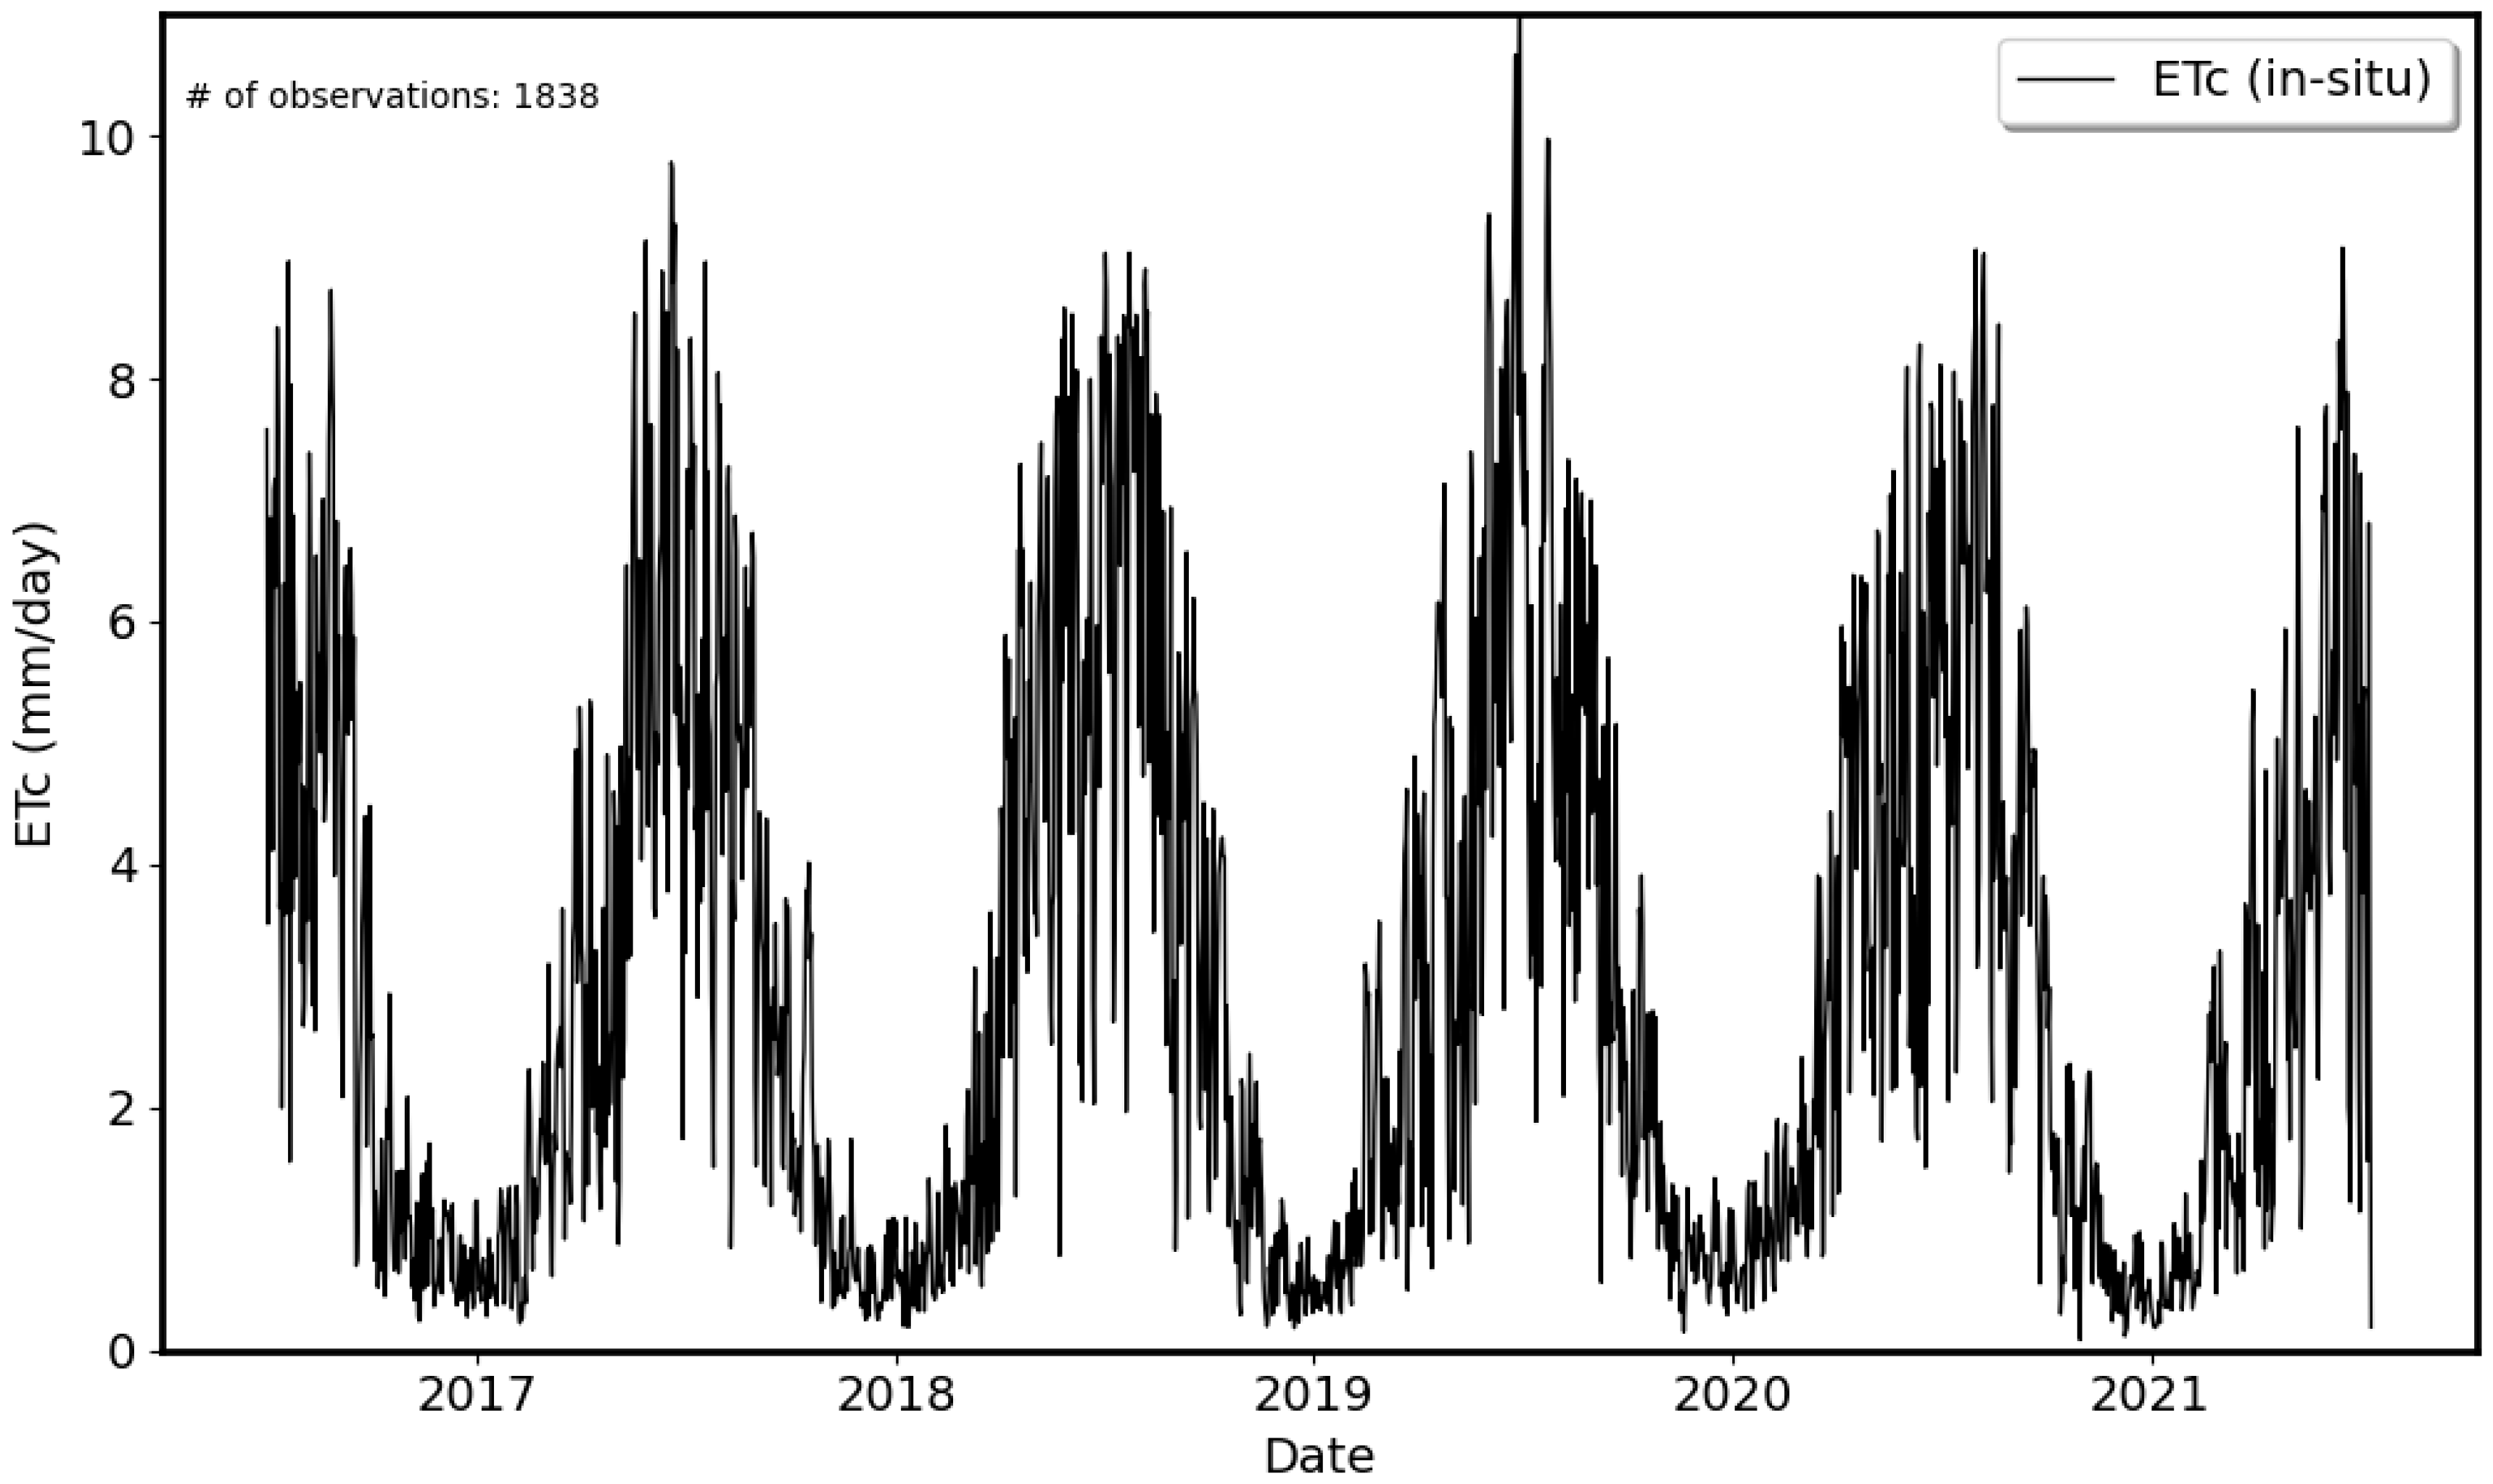
The in situ evapotranspiration shows very similar seasonal patterns to the Sentinel-1 backscatter signal with the maximum values during the summer months and the minimum values during the winter (see Figure 4). The in situ evapotranspiration time series consists of daily measurements with between 1818 and 1838 valid acquisitions depending on the weather station. The mean evapotranspiration over the observation period ranges from 2.62 to 3.06 mm/day between the four AOIs while the median ranges from 1.91 to 2.29 mm/day with a difference between meteorological summer and winter of 4.26 to 4.94 mm/day. The estimated in situ evapotranspiration ranges from 0 mm/day in the winter months to >11 mm/day in July of 2019 at station “Burkersdorf”.
As a result of the stand-in equations for the missing climate variables, the entire FAO evapotranspiration equation is based on four physical base units—temperature, solar radiation, wind speed and elevation—and uses different constants or coefficients to derive the needed additional information. It becomes apparent, that the most influential variable is the temperature, as transpiration and evaporation are significantly linked to the energy cycle (the heat fluxes created by the sun). Due to missing direct measurements of variables such as actual (ea) and saturation (es) vapor pressure, instead of using approximations from other measurements, additional inaccuracies or error sources are introduced. Simultaneously, the dependence on the temperature variable is leading to higher inaccuracies if the values do not represent reality in some instances. It should also be noted here that the Sentinel-1 C-band SAR is directly sensitive not to air temperature but rather to water content variations driven by environmental changes of several variables including air temperature [65].
It is important to note here that the goal of the study is not the comparison of absolute evapotranspiration values or validate absolute results on individual daily or weekly time scales, but rather the focus is on the relative comparability of the seasonal behavior of the different datasets. The interpretation and analysis of the absolute values of the two evapotranspiration products is only done on a comparative basis.
It should be considered that the weather stations are based in open fields at ground level with measurements two meters above the ground while the considered forest canopies reach heights of 20 to 30 m [66], where some meteorological values may be different. Wind speeds, for example, generally increase with increasing distance from the ground [67] and could have a bigger influence at the canopy level compared to the ground-proximate level. As we are comparing only the relative seasonal behavior of the different time series, these influences should be minimal.
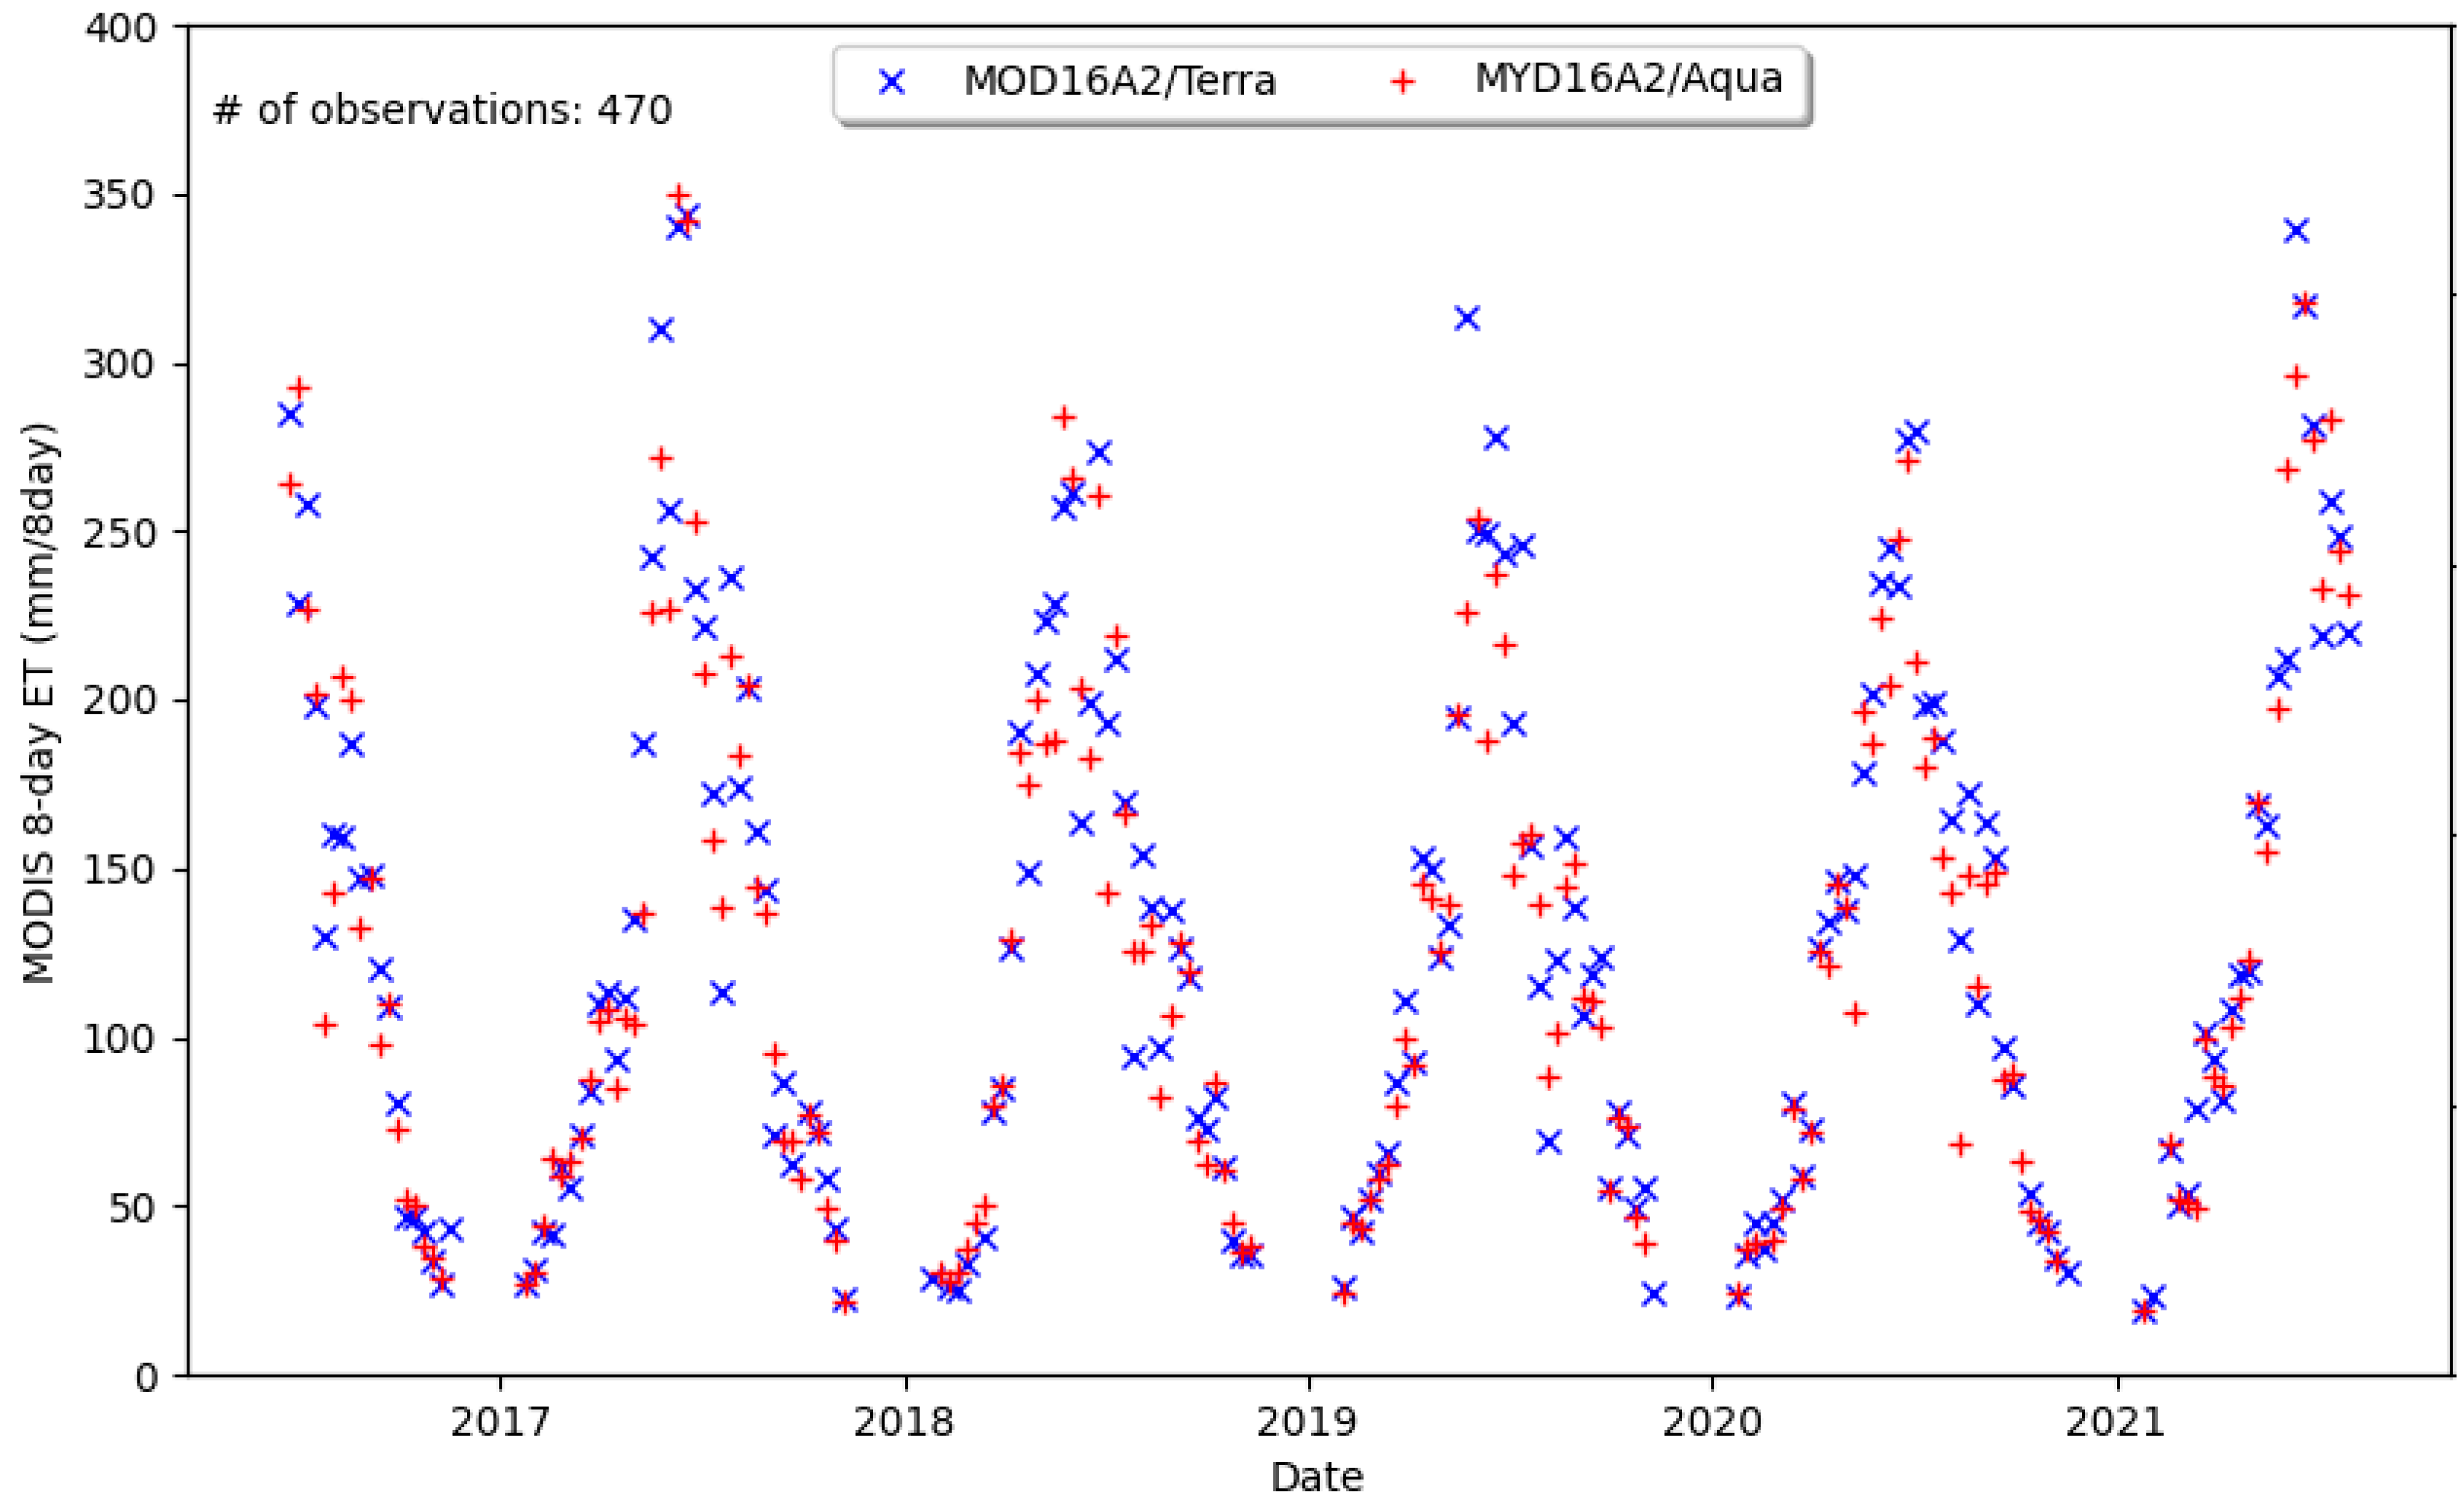
The Terra/Aqua MODIS evapotranspiration is measured for the same areas as the selection of the Sentinel-1 pixels of coniferous forests and presents a similar seasonal pattern as the in situ evapotranspiration (see Figure 7) as well as the Sentinel-1 backscatter (see Figure 3). The highest values of over 300 mm/8 day are reached in June and July while the values drop below 30 mm/8 day in the winter months. The temporal sampling rate is not uniform with clusters in early spring and summer due to the higher availability of cloud-free images. The mean evapotranspiration ranges from 129.46 mm/8 day up to 146.82 mm/8 day, with a standard deviation of 78.95 to 90.18 mm/8 day.
Almost all scenes contain data gaps where cloud cover prevented the optics-based acquisition for that scene. Acquisitions are more frequent in spring and summer compared to autumn or winter over central Germany. This particularity also affects the data sampling process for each AOI, as a different selection of sampling sites contain valid, cloud-free ET values for each scene. While its spatial resolution and scale are considerably/very much greater than the in situ ET estimation, a pixel size of 500 m over a heterogenous landscape is bound to introduce mixed land cover influence within a pixel cell. This can lead to ET estimation inaccuracies, which should be minimized by the careful selection of sampling sites as well as through the spatial aggregation of multiple pixels, which was done in this study (see Section 3.2). While the MODIS product does not estimate evapotranspiration equally accurately for all land cover classes [26], ongoing optimizations try to mitigate these problems [27]. At least these problems of absolute accuracy should not affect this analysis in a major way, as the relative values should be comparatively accurate for the same locations over time, which is the focus of this study. The absolute values of the in situ and remotely sensed evapotranspiration are not directly comparable, still the time of increase and decrease of both time series match very well (Figure 7). The correlation between both datasets is high, with R2-values between 0.67 and 0.82 compared at the dates of the corresponding Sentinel-1 acquisition times (Table 2)

4.3. Sentinel-1 Backscatter vs. Evapotranspiration

The filtered time series (see Section 3.2) are compared in order to evaluate the correlation between Sentinel-1 backscatter and in situ evapotranspiration. The evapotranspiration time series are filtered with the same methods as the presented Sentinel-1 time series to guarantee comparability. All results in this subsection are calculated with the exclusion of frost days [68,69].
For the ascending overpass direction and cross-polarized backscatter (VH), the R2-values of the SMA-filtered time series (window size ws = 10) range from 0.65 to 0.86, compared to lower R2-values from 0.35 to 0.63 for the descending overpass direction. Similar to the previous filtering methods, R2-values for the AOI “Oberweissbach” are about 25% lower compared to the other AOIs in the ascending overpass direction (Table 3). The co-polarized (VV) backscatter shows very similar results for both ascending and descending overpass direction with R2-values ranging from 0.49 to 0.87 in ascending and 0.43 to 0.58 in descending overpass direction.
Analyzing all results of the correlation analysis over coniferous forests (cf. Table 3), a clear pattern becomes visible. The ascending overpass direction shows significantly higher correlation for both polarizations and all AOIs compared to the descending overpass direction. One explanation for this behavior might be the different acquisition times between descending (morning) and ascending (evening) overpass direction. Indeed, daily transpiration mostly occurs between the descending and ascending overpasses and results in a change of water content that may explain the difference in observed correlation. The VH backscatter is primarily influenced by the small and randomly oriented scatterers, i.e., leaves and needles where water loss to the atmosphere occurs. The rate at which this water can be replaced depends on the water status of the trees, but water uptake generally continues after transpiration stops to replace the moisture lost higher up in the canopy with water from the root zone. It must be noted here that the scope of this study is the investigation of seasonal dynamics of ET and backscatter with the source of influence on the backscatter signal not yet fully understood. The seasonal increase of backscatter and ET signals might be explained by the increase in vegetation water content during the vegetation period. The seasonal behavior might be able to explain some of the underlying factors of ET influencing the backscatter. Moreover, while the Sentinel-1 acquisitions are either early in the morning or evening, the in situ evapotranspiration is based on the daily averages. Compared to the Sentinel-1 acquisition times, the other product acquisition times fall, therefore, within different domains of the diurnal cycle of biophysical activity, which might explain a decrease in the correlation for some data combinations compared to others [58,65,68].
A noticeable decrease in correlation for the ascending overpass direction can be observed at the AOI “Oberweissbach”, where the correlation values are systematically lower compared to the other stations. At the same time, the correlation for the descending overpass direction is on a similar level compared to the other AOIs. This might be explained by the relatively steep slope angles of the AOI “Oberweissbach”, making this area more prone to influence by the local incidence angle compared to the other AOIs. Additionally, this station is situated at a higher elevation compared to the three other stations; the response of coniferous trees to changes in energy fluxes could be either delayed or attenuated in such more mountainous areas. Further analysis would be needed to confirm this hypothesis.
Using the extracted seasonal periodicity based on the SSA, a very high correlation between the Sentinel-1 backscatter and the in situ evapotranspiration is evident (Figure 7e compared to Figure 7c). It should be noted that this approach does not directly correlate backscatter and evapotranspiration but rather the periodicity of the respective time series (see Section 3.2). The correlation in ascending overpass direction for cross-polarized backscatter (VH) ranges from R2-values of 0.95 up to 0.99 and from 0.26 up to 0.56 for the descending overpass direction. Similar to the SMA-filtered time series, the differences of the co-polarized (VV) backscatter datasets are negligible with R2-values for the ascending overpass direction ranging from 0.88 to 0.99 and from 0.31 to 0.60 for the descending overpass direction. The influence of the overpass direction on the correlation between backscatter and evapotranspiration is far greater than the influence of polarization throughout all AOIs and with different filtering approaches.
Regarding the influence of the filter approach as well as the individual filter size, it seems filtering is necessary to eliminate the high-frequency temporal variations from both datasets and to better investigate the seasonal component of the time-series. The singular spectrum analysis provides the highest correlation results, as the correlated datasets are not a filtered time series anymore but merely the periodicity component of the original time series [53]. This might be useful to some extent, as the seasonal behavior shows the strongest manifestation in real-life data, but this caveat should be considered for more in-depth analyses, where the absolute values are analyzed as well.

5. Conclusions

In this multi-sensor study, a high correlation in seasonal patterns was found between Copernicus Sentinel-1 backscatter and in situ evapotranspiration. For the first time, a Sentinel-1 time series of five years was compared to in situ evapotranspiration (FAO Penman–Monteith method) time series. Additionally, the results were compared with the Terra/Aqua MODIS evapotranspiration product for a first validation. Therefore, this study is a first analysis of the influence of multiannual seasonal behavior of evapotranspiration for coniferous forests on the C-band SAR signal.
The analysis was conducted for the different Sentinel-1 acquisition characteristics, overpass directions (ascending, descending) and polarizations (VH, VV). We used different filtering approaches to focus on the seasonal dynamics and to take out high-frequency temporal variations. For coniferous forest, a high correlation (R2) was achieved between the Sentinel-1 SAR backscatter and the ET products of up to 0.86 (full signal) and up to 0.99 (filtered signal with only the seasonality component). Additionally, an influence of overpass direction on the degree of the correlation with an increase from an R2 of around 0.5 (descending, morning) to around 0.9 (ascending, evening) was shown, suggesting that the daily change of vegetation water storage due to canopy transpiration is visible, even though not fully decrypted at the moment [70]. Moreover, differences of backscatter variability were shown between dry and wet years, further endorsing this outcome.
These results show the potential of using high-resolution Sentinel-1 SAR backscatter data for complementary evapotranspiration monitoring and for synergistic combination with optical/thermal ET products to improve spatial resolution of evapotranspiration estimates (<100 m) and temporal coverage (daylight and weather independence). The results of this study also help improve forest remote sensing capabilities by expanding the knowledge of factors influencing the SAR signal and its seasonal fluctuations. A similar approach [71], combined with the high-resolution datasets used in this study, could enable the development of an evapotranspiration estimation approach based on active microwave data.
The main constraint of this study in terms of spatial coverage was the scarcity of available meteorological stations for in situ measurements, which limited the selection of AOIs. Including additional sites, such as the large untapped forest area in the center of the study site and including different forests altogether, will foster further analyses and findings. In 2022, an updated version of the CLMS land cover datasets should be made available which could further improve the accuracy of the selected sites for each forest class. Finally, a comparable analysis for deciduous forests should be conducted. This could enable a more balanced analysis of the two main temperate forest types in central Europe and present a clearer assertion of the differences between the two. For a large-scale retrieval of ET utilizing active and passive sensors, a comprehensive look at multiple land cover types is necessary. With an increasing temporal and spatial resolution of new datasets with similar or improved specifications as Sentinel-1, there should be a possibility to expand on this study in the future. Ideally this should include a wider range of sensors and in situ measurements to establish clear external influences on the individual signals of each remote sensing product.

Author Contributions

Conceptualization, M.M.M., C.D. and T.J.; methodology, M.M.M., C.D. and T.J.; software, M.M.M. and F.M.H.; validation, M.M.M., C.D. and F.M.H.; formal analysis, M.M.M., C.D., T.J. and F.M.H.; investigation, M.M.M., C.D. and T.J.; resources, M.M.M., C.D., T.J. and C.P.; data curation, M.M.M., C.D., C.P. and T.J.; writing—original draft preparation, M.M.M., C.D., T.J. and S.S.-D.; writing—review and editing, M.M.M., C.D., T.J., S.S.-D. and C.S.; visualization, M.M.M. and F.M.H.; supervision, C.D., C.S. and S.S.-D.; project administration, M.M.M. and C.D.; funding acquisition, C.D. and C.S. All authors have read and agreed to the published version of the manuscript.

Funding

This research received no external funding.

Conflicts of Interest

The authors declare no conflict of interest.

References

  1. Gower, S.T. Patterns and Mechanisms of the Forest Carbon Cycle. Annu. Rev. Environ. Resour. 2003, 28, 169–204. [Google Scholar] [CrossRef]
  2. Dong, J.; Kaufmann, R.K.; Myneni, R.B.; Tucker, C.J.; Kauppi, P.E.; Liski, J.; Buermann, W.; Alexeyev, V.; Hughes, M.K. Remote sensing estimates of boreal and temperate forest woody biomass: Carbon pools, sources, and sinks. Remote Sens. Environ. 2003, 84, 393–410. [Google Scholar] [CrossRef] [Green Version]
  3. Goodale, C.L.; Apps, M.J.; Birdsey, R.A.; Field, C.B.; Heath, L.S.; Houghton, R.A.; Jenkins, J.C.; Kohlmaier, G.H.; Kurz, W.; Liu, S.; et al. Forest carbon sinks in the northern hemisphere. Ecol. Appl. 2002, 12, 891–899. [Google Scholar] [CrossRef]
  4. Proisy, C.; Mougin, E.; Dufrene, E.; Le Dantec, V. Monitoring seasonal changes of a mixed temperate forest using ERS SAR observations. IEEE Trans. Geosci. Remote Sens. 2000, 38, 540–552. [Google Scholar] [CrossRef]
  5. Friedlingstein, P.; Jones, M.W.; O’Sullivan, M.; Andrew, R.M.; Hauck, J.; Peters, G.P.; Peters, W.; Pongratz, J.; Sitch, S.; Le Quéré, C.; et al. Global Carbon Budget 2019. Earth Syst. Sci. Data 2019, 11, 1783–1838. [Google Scholar] [CrossRef] [Green Version]
  6. ThüringenForst. Der Wald der Zukunft in Thüringen: Herausforderungen und Lösungen am Beispiel des Staatswaldes. Available online: https://www.thueringenforst.de/fileadmin/user_upload/Download/WaldWissen/Wald-der-Zukunft_Handout-Pressegespraech.pdf (accessed on 1 November 2021).
  7. Wenzel, A.; Frischbier, N.; Jürgen, S.; Wittau, F. Bundeswaldinventur 3 im Freistaat Thüringen: Mitteilungen 34/2015, 1st ed.; ThüringenForst: Erfurt, Germany, 2015; ISBN 2196-6087. [Google Scholar]
  8. Huete, A.R. Vegetation Indices, Remote Sensing and Forest Monitoring. Geogr. Compass 2012, 6, 513–532. [Google Scholar] [CrossRef]
  9. Anderegg, W.R.L.; Konings, A.G.; Trugman, A.T.; Yu, K.; Bowling, D.R.; Gabbitas, R.; Karp, D.S.; Pacala, S.; Sperry, J.S.; Sulman, B.N.; et al. Hydraulic diversity of forests regulates ecosystem resilience during drought. Nature 2018, 561, 538–541. [Google Scholar] [CrossRef] [Green Version]
  10. Avetisyan, D.; Borisova, D.; Velizarova, E. Integrated Evaluation of Vegetation Drought Stress through Satellite Remote Sensing. Forests 2021, 12, 974. [Google Scholar] [CrossRef]
  11. Sturm, J.; Santos, M.J.; Schmid, B.; Damm, A. Satellite data reveal differential responses of Swiss forests to unprecedented 2018 drought. Glob. Chang. Biol. 2022, 28, 2956–2978. [Google Scholar] [CrossRef]
  12. Gazol, A.; Camarero, J.J.; Vicente-Serrano, S.M.; Sánchez-Salguero, R.; Gutiérrez, E.; de Luis, M.; Sangüesa-Barreda, G.; Novak, K.; Rozas, V.; Tíscar, P.A.; et al. Forest resilience to drought varies across biomes. Glob. Chang. Biol. 2018, 24, 2143–2158. [Google Scholar] [CrossRef]
  13. Min, Q.; Lin, B. Remote sensing of evapotranspiration and carbon uptake at Harvard Forest. Remote Sens. Environ. 2006, 100, 379–387. [Google Scholar] [CrossRef] [Green Version]
  14. Guzinski, R.; Nieto, H. Evaluating the feasibility of using Sentinel-2 and Sentinel-3 satellites for high-resolution evapotranspiration estimations. Remote Sens. Environ. 2019, 221, 157–172. [Google Scholar] [CrossRef]
  15. Guzinski, R.; Nieto, H.; Sandholt, I.; Karamitilios, G. Modelling High-Resolution Actual Evapotranspiration through Sentinel-2 and Sentinel-3 Data Fusion. Remote Sens. 2020, 12, 1433. [Google Scholar] [CrossRef]
  16. Zhang, K.; Kimball, J.S.; Running, S.W. A review of remote sensing based actual evapotranspiration estimation. WIRES Water 2016, 3, 834–853. [Google Scholar] [CrossRef]
  17. Monteith, J.L. Evaporation and environment. Symp. Soc. Exp. Biol. 1965, 19, 205–234. [Google Scholar]
  18. Liou, Y.-A.; Kar, S. Evapotranspiration Estimation with Remote Sensing and Various Surface Energy Balance Algorithms—A Review. Energies 2014, 7, 2821–2849. [Google Scholar] [CrossRef] [Green Version]
  19. Verstraeten, W.W.; Veroustraete, F.; Feyen, J. Assessment of Evapotranspiration and Soil Moisture Content Across Different Scales of Observation. Sensors 2008, 8, 70–117. [Google Scholar] [CrossRef] [Green Version]
  20. Talsma, C.J.; Good, S.P.; Jimenez, C.; Martens, B.; Fisher, J.B.; Miralles, D.G.; McCabe, M.F.; Purdy, A.J. Partitioning of evapotranspiration in remote sensing-based models. Agric. For. Meteorol. 2018, 260–261, 131–143. [Google Scholar] [CrossRef]
  21. WMO. The Global Observing System for Climate: Implementation Needs: GCOS-200. Available online: https://library.wmo.int/doc_num.php?explnum_id=3417 (accessed on 15 May 2022).
  22. Allen, R.G. Assessing Integrity of Weather Data for Reference Evapotranspiration Estimation. J. Irrig. Drain. Eng. 1996, 122, 97–106. [Google Scholar] [CrossRef]
  23. Monin, A.S.; Obukhov, A.M. Basic laws of turbulent mixing in the surface layer of the atmosphere. Geophys. Inst. Acad. Sci. 1954, 24, 163–187. [Google Scholar]
  24. Penman, H.L. Natural evaporation from open water, hare soil and grass. Proc. R. Soc. Lond. A Math. Phys. Sci. 1948, 193, 120–145. [Google Scholar] [CrossRef] [PubMed] [Green Version]
  25. Allen, R.G. Crop Evapotranspiration: Guidelines for Computing Crop Water Requirements; Repr; Food and Agriculture Organization of the United States: Rome, Italy, 2002; ISBN 9251042195. [Google Scholar]
  26. Cleugh, H.A.; Leuning, R.; Mu, Q.; Running, S.W. Regional evaporation estimates from flux tower and MODIS satellite data. Remote Sens. Environ. 2007, 106, 285–304. [Google Scholar] [CrossRef]
  27. Running, S.W.; Mu, Q.; Zhao, M.; Morena, A. User’s Guide MODIS Global Terrestrial Evapotranspiration (ET) Product (MOD16A2/A3 and Year-end Gap-Filled MOD16A2GF/A3GF) NASA Earth Observing System MODIS Land Algorithm (For Collection 6). Available online: https://lpdaac.usgs.gov/documents/494/MOD16_User_Guide_V6.pdf (accessed on 14 October 2021).
  28. Amazirh, A.; Merlin, O.; Er-Raki, S.; Gao, Q.; Rivalland, V.; Malbeteau, Y.; Khabba, S.; Escorihuela, M.J. Retrieving surface soil moisture at high spatio-temporal resolution from a synergy between Sentinel-1 radar and Landsat thermal data: A study case over bare soil. Remote Sens. Environ. 2018, 211, 321–337. [Google Scholar] [CrossRef]
  29. Amazirh, A.; Merlin, O.; Er-Raki, S. Including Sentinel-1 radar data to improve the disaggregation of MODIS land surface temperature data. ISPRS J. Photogramm. Remote Sens. 2019, 150, 11–26. [Google Scholar] [CrossRef]
  30. El-Shirbeny, M.A.; Saleh, S.M. Actual evapotranspiration evaluation based on multi-sensed data. JAA 2021, 7, 95–102. [Google Scholar] [CrossRef]
  31. Chintala, S.; Harmya, T.S.; Kambhammettu, B.; Moharana, S.; Duvvuri, S. Modelling high-resolution Evapotranspiration in fragmented croplands from the constellation of Sentinels. Remote Sens. Appl. Soc. Environ. 2022, 26, 100704. [Google Scholar] [CrossRef]
  32. Zappa, L.; Schlaffer, S.; Bauer-Marschallinger, B.; Nendel, C.; Zimmerman, B.; Dorigo, W. Detection and Quantification of Irrigation Water Amounts at 500 m Using Sentinel-1 Surface Soil Moisture. Remote Sens. 2021, 13, 1727. [Google Scholar] [CrossRef]
  33. El-Shirbeny, M.A.; Abutaleb, K. Sentinel-1 Radar Data Assessment to Estimate Crop Water Stress. WJET 2017, 05, 47–55. [Google Scholar] [CrossRef] [Green Version]
  34. Nasrallah, A.; Baghdadi, N.; El Hajj, M.; Darwish, T.; Belhouchette, H.; Faour, G.; Darwich, S.; Mhawej, M. Sentinel-1 Data for Winter Wheat Phenology Monitoring and Mapping. Remote Sens. 2019, 11, 2228. [Google Scholar] [CrossRef] [Green Version]
  35. Dubois, C.; Mueller, M.M.; Pathe, C.; Jagdhuber, T.; Cremer, F.; Thiel, C.; Schmullius, C. Characterization of land cover seasonality in sentinel-1 time series data. ISPRS Ann. Photogramm. Remote Sens. Spatial Inf. Sci. 2020, V-3-2020, 97–104. [Google Scholar] [CrossRef]
  36. EEA CLMS. Corine Land Cover 2018. Available online: https://land.copernicus.eu/pan-european/corine-land-cover/clc2018 (accessed on 10 October 2021).
  37. EEA CLMS. Tree Cover Density 2018. Available online: https://land.copernicus.eu/pan-european/high-resolution-layers/forests/tree-cover-density/status-maps/tree-cover-density-2018 (accessed on 11 October 2021).
  38. TLBG. Download Höhendaten (DGM/DOM/LAZ). Available online: https://www.geoportal-th.de/de-de/Downloadbereiche/Download-Offene-Geodaten-Th%C3%BCringen/Download-H%C3%B6hendaten (accessed on 12 October 2021).
  39. DWD. Niederschlag: Vieljährige Mittelwerte 1961–1990. Available online: https://www.dwd.de/DE/leistungen/klimadatendeutschland/mittelwerte/nieder_6190_akt_html (accessed on 28 October 2021).
  40. TLUBN. Klimabericht Dezember 2020 und Jahr 2020. Available online: https://tlubn.thueringen.de/fileadmin/00_tlubn/Klima/Dokumente/Klimabericht/Klimabericht_Monat_Dezember_Jahr_2020.pdf (accessed on 26 October 2021).
  41. EEA CLMS. Forest Type 2018. Available online: https://land.copernicus.eu/pan-european/high-resolution-layers/forests/forest-type-1/status-maps/forest-type-2018 (accessed on 12 October 2021).
  42. EEA CLMS. Copernicus Land Monitoring Service. Available online: https://land.copernicus.eu/ (accessed on 30 October 2021).
  43. Schwerdt, M.; Schmidt, K.; Tous Ramon, N.; Klenk, P.; Yague-Martinez, N.; Prats-Iraola, P.; Zink, M.; Geudtner, D. Independent System Calibration of Sentinel-1B. Remote Sens. 2017, 9, 511. [Google Scholar] [CrossRef] [Green Version]
  44. Truckenbrodt, J.; Cremer, F.; Baris, I.; Eberle, J. pyroSAR—A Framework for Large-Scale SAR Satellite Data Processing. In Proceedings of the 2019 Living Planet Symposium, Milan, Italy, 13–17 May 2019. [Google Scholar]
  45. Mueller, M.M.; Dubois, C.; Jagdhuber, T.; Pathe, C.; Schmullius, C. Investigation of sentinel-1 time series for sensitivity to fern vegetation in an european temperate forest. Int. Arch. Photogramm. Remote Sens. Spatial Inf. Sci. 2021, XLIII-B3-2021, 127–134. [Google Scholar] [CrossRef]
  46. Running, S.W.; Mu, Q.; Zhao, M. MOD16A2 MODIS/Terra Net Evapotranspiration 8-Day L4 Global 500m SIN Grid V006; NASA LP DAAC: Sioux Falls, SD, USA, 2017. [Google Scholar]
  47. Crosson, W.L.; Al-Hamdan, M.Z.; Hemmings, S.N.; Wade, G.M. A daily merged MODIS Aqua–Terra land surface temperature data set for the conterminous United States. Remote Sens. Environ. 2012, 119, 315–324. [Google Scholar] [CrossRef]
  48. TLLLR. Agrarmeteorologie Thüringen—Stationskarte. Available online: https://www.wetter-th.de/Agrarmeteorologie-TH/Wetterdaten/Stationskarte (accessed on 20 October 2021).
  49. Friesen, J.; Steele-Dunne, S.C.; van de Giesen, N. Diurnal Differences in Global ERS Scatterometer Backscatter Observations of the Land Surface. IEEE Trans. Geosci. Remote Sens. 2012, 50, 2595–2602. [Google Scholar] [CrossRef]
  50. Steele-Dunne, S.C.; Friesen, J.; van de Giesen, N. Using Diurnal Variation in Backscatter to Detect Vegetation Water Stress. IEEE Trans. Geosci. Remote Sens. 2012, 50, 2618–2629. [Google Scholar] [CrossRef]
  51. Vaiphasa, C. Consideration of smoothing techniques for hyperspectral remote sensing. ISPRS J. Photogramm. Remote Sens. 2006, 60, 91–99. [Google Scholar] [CrossRef]
  52. D’Arcy, J. Introducing SSA for Time Series Decomposition. Available online: https://www.kaggle.com/jdarcy/introducing-ssa-for-time-series-decomposition (accessed on 15 August 2021).
  53. Golyandina, N.; Nekrutkin, V.V.; Žigljavskij, A.A. Analysis of Time Series Structure: SSA and Related Techniques; Chapman & Hall/CRC: Boca Raton, FL, USA, 2001; ISBN 1584881941. [Google Scholar]
  54. Trenberth, K.E. What are the Seasons? Bull. Amer. Meteor. Soc. 1983, 64, 1276–1282. [Google Scholar] [CrossRef]
  55. Dostálová, A.; Lang, M.; Ivanovs, J.; Waser, L.T.; Wagner, W. European Wide Forest Classification Based on Sentinel-1 Data. Remote Sens. 2021, 13, 337. [Google Scholar] [CrossRef]
  56. Rüetschi, M.; Schaepman, M.; Small, D. Using Multitemporal Sentinel-1 C-band Backscatter to Monitor Phenology and Classify Deciduous and Coniferous Forests in Northern Switzerland. Remote Sens. 2018, 10, 55. [Google Scholar] [CrossRef] [Green Version]
  57. Kurum, M.; Lang, R.H.; O’Neill, P.E.; Joseph, A.T.; Jackson, T.J.; Cosh, M.H. L-Band Radar Estimation of Forest Attenuation for Active/Passive Soil Moisture Inversion. IEEE Trans. Geosci. Remote Sens. 2009, 47, 3026–3040. [Google Scholar] [CrossRef]
  58. Monteith, A.R.; Ulander, L.M.H. Temporal Characteristics of P-Band Tomographic Radar Backscatter of a Boreal Forest. IEEE J. Sel. Top. Appl. Earth Obs. Remote Sens. 2021, 14, 1967–1984. [Google Scholar] [CrossRef]
  59. van Emmerik, T.; Steele-Dunne, S.; Paget, A.; Oliveira, R.S.; Bittencourt, P.R.L.; Barros, F.d.V.; van de Giesen, N. Water stress detection in the Amazon using radar. Geophys. Res. Lett. 2017, 44, 6841–6849. [Google Scholar] [CrossRef]
  60. DWD. Niederschlag: Vieljährige Mittelwerte 1981–2010. Available online: https://www.dwd.de/DE/leistungen/klimadatendeutschland/mittelwerte/nieder_8110_akt_html (accessed on 9 October 2021).
  61. Khabbazan, S.; Steele-Dunne, S.C.; Vermunt, P.; Judge, J.; Vreugdenhil, M.; Gao, G. The influence of surface canopy water on the relationship between L-band backscatter and biophysical variables in agricultural monitoring. Remote Sens. Environ. 2022, 268, 112789. [Google Scholar] [CrossRef]
  62. Vermunt, P.C.; Khabbazan, S.; Steele-Dunne, S.C.; Judge, J.; Monsivais-Huertero, A.; Guerriero, L.; Liu, P.-W. Response of Subdaily L-Band Backscatter to Internal and Surface Canopy Water Dynamics. IEEE Trans. Geosci. Remote Sens. 2021, 59, 7322–7337. [Google Scholar] [CrossRef]
  63. Koyama, C.N.; Watanabe, M.; Hayashi, M.; Ogawa, T.; Shimada, M. Mapping the spatial-temporal variability of tropical forests by ALOS-2 L-band SAR big data analysis. Remote Sens. Environ. 2019, 233, 111372. [Google Scholar] [CrossRef]
  64. Shimada, M.; Itoh, T.; Motooka, T.; Watanabe, M.; Shiraishi, T.; Thapa, R.; Lucas, R. New global forest/non-forest maps from ALOS PALSAR data (2007–2010). Remote Sens. Environ. 2014, 155, 13–31. [Google Scholar] [CrossRef]
  65. Jagdhuber, T.; Fluhrer, A.; Schmidt, A.-S.; Jonard, F.; Chaparro, D.; Meyer, T.; Holtzman, N.; Konings, A.G.; Feldman, A.; Baur, M.; et al. Retrieval of Forest Water Potential from L-Band Vegetation Optical Depth. In Proceedings of the IGARSS 2021—2021 IEEE International Geoscience and Remote Sensing Symposium, Brussels, Belgium, 11–16 July 2021; pp. 5949–5952, ISBN 978-1-6654-0369-6. [Google Scholar]
  66. Thiel, C.; Mueller, M.M.; Berger, C.; Cremer, F.; Dubois, C.; Hese, S.; Baade, J.; Klan, F.; Pathe, C. Monitoring Selective Logging in a Pine-Dominated Forest in Central Germany with Repeated Drone Flights Utilizing a Low Cost RTK Quadcopter. Drones 2020, 4, 11. [Google Scholar] [CrossRef] [Green Version]
  67. Justus, C.G.; Mikhail, A. Height variation of wind speed and wind distributions statistics. Geophys. Res. Lett. 1976, 3, 261–264. [Google Scholar] [CrossRef]
  68. Monteith, A.R.; Ulander, L.M.H. Temporal Survey of P- and L-Band Polarimetric Backscatter in Boreal Forests. IEEE J. Sel. Top. Appl. Earth Obs. Remote Sens. 2018, 11, 3564–3577. [Google Scholar] [CrossRef] [Green Version]
  69. Steele-Dunne, S.C.; McNairn, H.; Monsivais-Huertero, A.; Judge, J.; Liu, P.-W.; Papathanassiou, K. Radar Remote Sensing of Agricultural Canopies: A Review. IEEE J. Sel. Top. Appl. Earth Obs. Remote Sens. 2017, 10, 2249–2273. [Google Scholar] [CrossRef] [Green Version]
  70. Petchiappan, A.; Steele-Dunne, S.C.; Vreugdenhil, M.; Hahn, S.; Wagner, W.; Oliveira, R. The influence of vegetation water dynamics on the ASCAT backscatter–incidence angle relationship in the Amazon. Hydrol. Earth Syst. Sci. 2022, 26, 2997–3019. [Google Scholar] [CrossRef]
  71. Boegh, E.; Poulsen, R.N.; Butts, M.; Abrahamsen, P.; Dellwik, E.; Hansen, S.; Hasager, C.B.; Ibrom, A.; Loerup, J.-K.; Pilegaard, K.; et al. Remote sensing based evapotranspiration and runoff modeling of agricultural, forest and urban flux sites in Denmark: From field to macro-scale. J. Hydrol. 2009, 377, 300–316. [Google Scholar] [CrossRef]
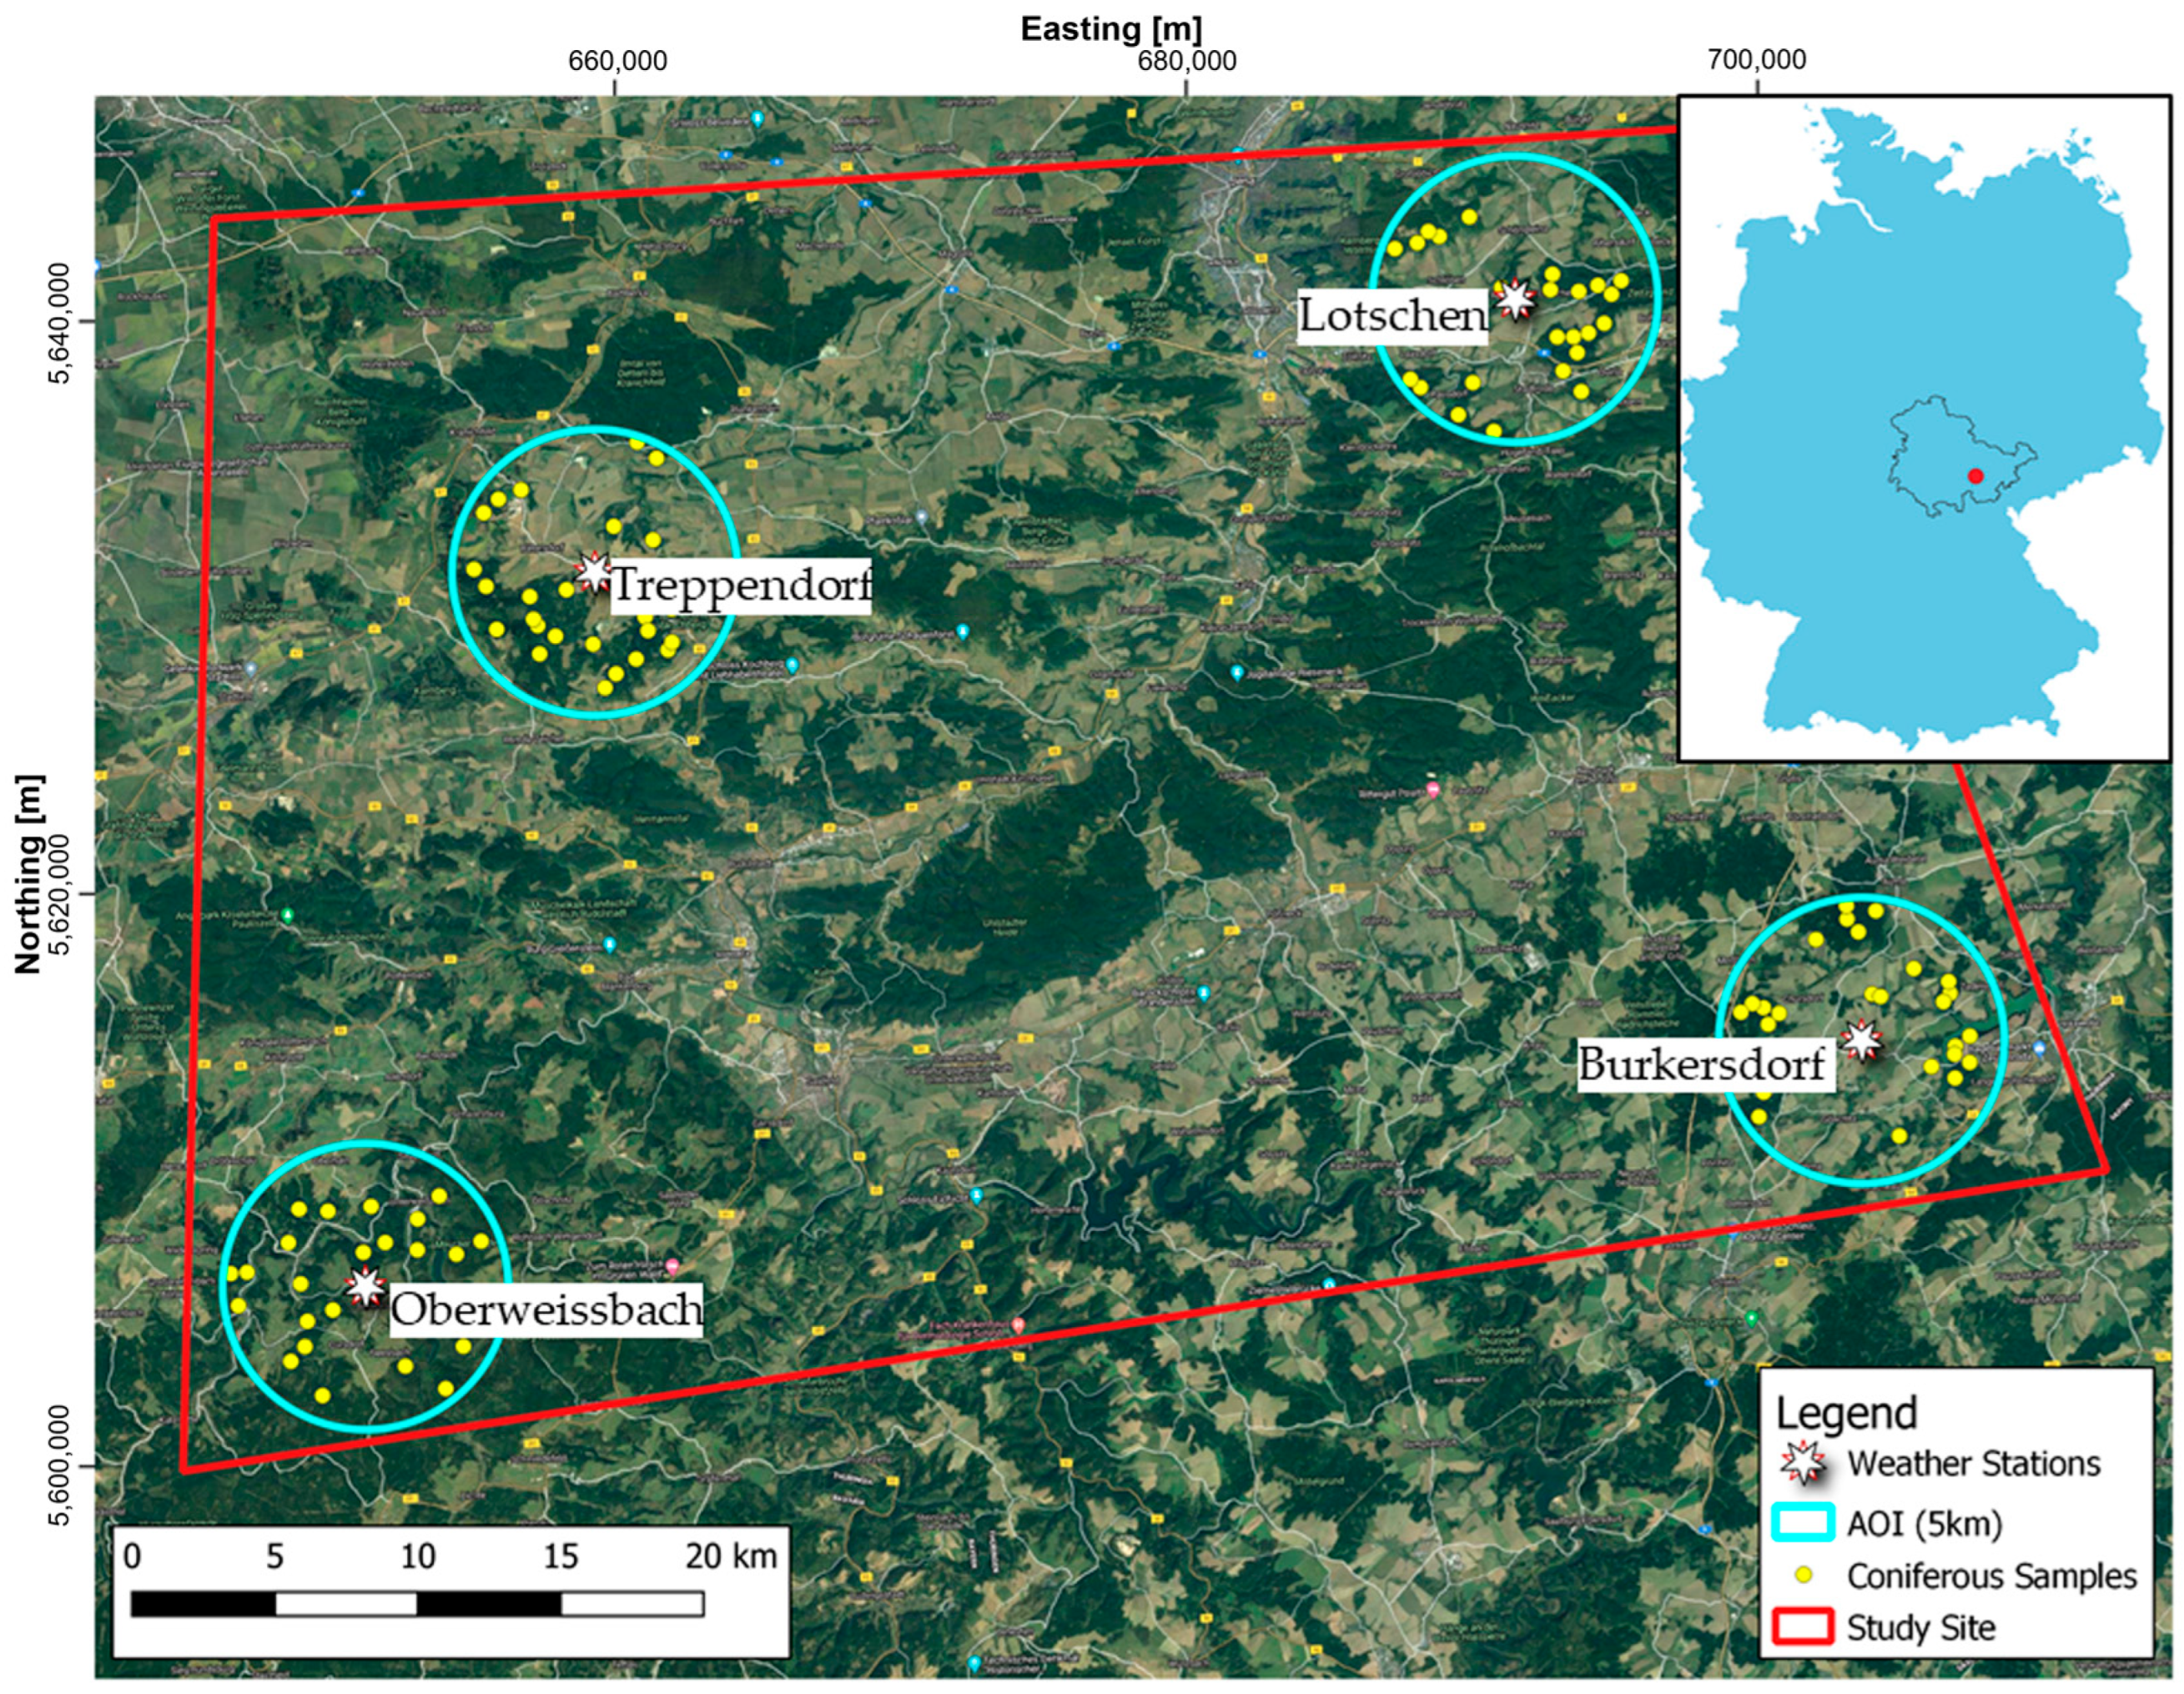
Figure 1. Overview of the study site (red), the areas of interest (AOI, blue circles), the coniferous sampling sites (yellow dots) and the weather stations (white stars) located in southeast Thuringia in central Germany. Satellite imagery provided by GeoBasis DE/BKG through Google Earth (©2021 Google).
Remotesensing 14 06384 g001
Figure 2. Overview of the backscatter behavior of AOI “Burkersdorf” depending on polarization and pass direction for only coniferous forested area with precipitation (grey) and temperature (yellow) (y-axis combined for precipitation and average temperature). The thick lines show the filtered time series using a simple moving average filter with a window size of 10 (corresponds to 2 months in the time series).
Remotesensing 14 06384 g002
Figure 3. Terra/Aqua MODIS evapotranspiration (mm/8 day) time series for the coniferous forested area surrounding the “Burkersdorf” weather station.
Remotesensing 14 06384 g003
Figure 4. Daily Evapotranspiration time series calculated from the meteorological data of one weather station (Burkersdorf) using the FAO Penman–Monteith approach.
Remotesensing 14 06384 g004
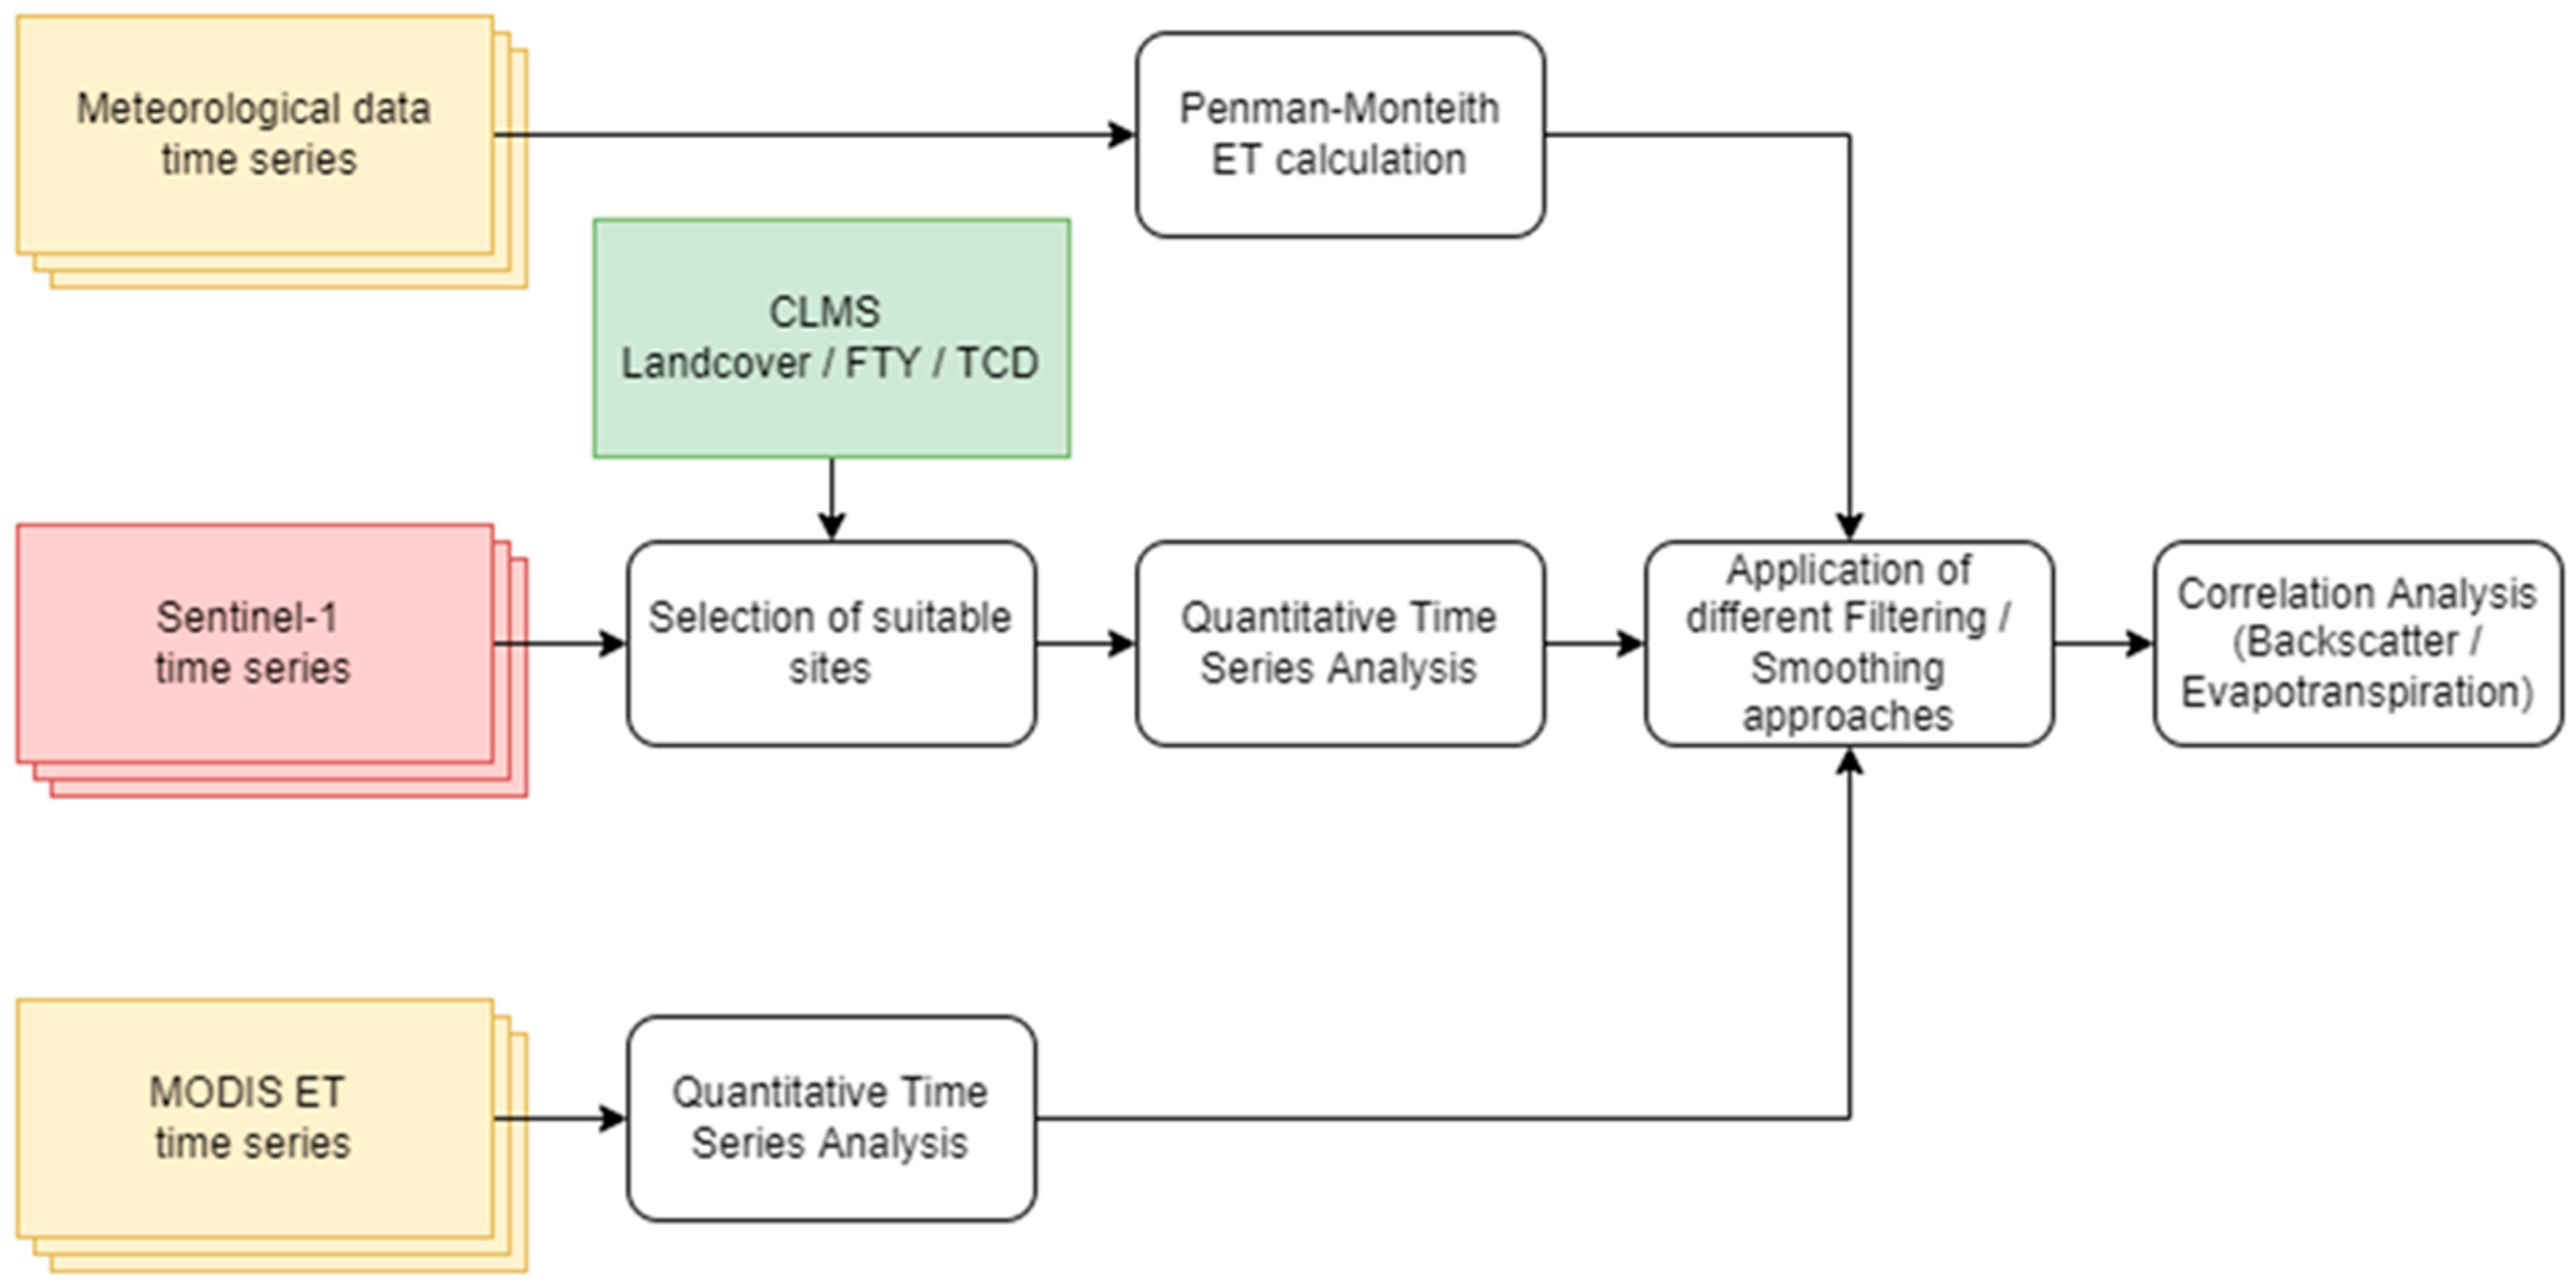
Figure 5. Workflow of the main analyses in this study (CLMS: Corine Land Monitoring Service; FTY: Forest Tree Type; TCD: Tree Cover Density).
Remotesensing 14 06384 g005
Figure 6. Distribution of VH backscatter by time of day and “dry” (2016, 2018, 2019) and “wet” (2017, 2021) years for summer (Jun–Aug) and winter (Nov–Jan). “Dry” and “Wet” are derived from the long-term precipitation since 1961.
Remotesensing 14 06384 g006
Figure 7. A very similar seasonal behavior for the Terra/Aqua MODIS (green) and in situ (black) ET product (A), the correlation between both ET products (B), SMA-filtered Sentinel-1 time series (C) SSA-filtered Sentinel-1 time series (E) can be seen. The correlation scatter plot of SSA- and SMA-filtered (D,F) Sentinel-1 time series and ET products show a positive trend, meaning increasing backscatter values also mean increasing evapotranspiration values. All data were acquired for station “Burkersdorf” and cross-polarized (VH) Sentinel-1 backscatter in ascending pass direction.
Remotesensing 14 06384 g007
Table 1. Acquisition parameters for the Sentinel 1 datasets.
DatasetFlight
Direction
Relative OrbitIncidence AngleNo. of
Acquisitions
Time of Acquisition
(UTC)
Acquisition Period
1Descending16837.7°–41.3°22505:2507/14/2016–07/12/2021
2Ascending4433.2°–37.4°27016:5907/05/2016–06/27/2021
3Ascending11742.2°–45.5°26217:0807/17/2016–07/08/2021
Table 2. Correlation coefficient (R2) of in situ evapotranspiration (weather stations) and remotely sensed evapotranspiration (Terra/Aqua MODIS) for each AOI and both ascending and descending Sentinel-1 acquisition times.
R-Squared
SMA (ws = 10)BurkersdorfLotschenOberweissbachTreppendorf
S1 ascending0.7960.7950.7820.822
S1 descending0.7250.7590.6670.712
Table 3. Correlation coefficient (R²) of in-situ evapotranspiration and cross-polarized (VH) Sentinel 1 backscatter for each AOI and both ascending and descending Sentinel-1 acquisitions. All datasets were filtered with SMA (top) and SSA (bottom) respectively.
R-Squared
SMA (ws = 10)BurkersdorfLotschenOberweissbachTreppendorf
Ascending (117)0.8150.8580.7360.776
Ascending (44)0.8560.8510.6460.706
Descending (168)0.6270.3530.4960.525
SSA (L = n/2)
Ascending (117)0.9690.9740.9460.966
Ascending (44)0.9940.9660.9560.952
Descending (168)0.5640.2550.3110.561
Publisher’s Note: MDPI stays neutral with regard to jurisdictional claims in published maps and institutional affiliations.