Article

Raindrop Size Distribution Characteristics of the Western Pacific Tropical Cyclones Measured in the Palau Islands

1
Department of Atmospheric Sciences, Institute of Atmospheric Physics, National Central University, Zhongli District, Taoyuan City 320317, Taiwan
2
Earthquake-Disaster and Risk Evaluation and Management Center, National Central University, Zhongli District, Taoyuan City 320317, Taiwan
3
Research Center for Hazard Mitigation and Prevention, National Central University, Zhongli District, Taoyuan City 320317, Taiwan
4
Dynamic Coupling of Ocean-Atmosphere-Land Research Program, Japan Agency for Marine-Earth Science and Technology (JAMSTEC), Yokosuka 237-0061, Japan
5
Research Institute for Sustainable Humanosphere, Kyoto University, Kyoto 611-0011, Japan
6
Semi-Arid zonal Atmospheric Research Centre, Department of Physics, Yogi Vemana University, Kadapa 516005, India
*
Author to whom correspondence should be addressed.
Remote Sens. 2022, 14(3), 470; https://doi.org/10.3390/rs14030470
Submission received: 4 December 2021 / Revised: 10 January 2022 / Accepted: 13 January 2022 / Published: 19 January 2022

Abstract

:
Due to the severe threat of tropical cyclones to human life, recent years have witnessed an increase in the investigations on raindrop size distributions of tropical cyclones to improve their quantitative precipitation estimation algorithms and modeling simulations. So far, the raindrop size distributions of tropical cyclones using disdrometer measurements have been conducted at coastal and inland stations, but such studies are still missing for oceanic locations. To the authors’ knowledge, the current study examines—for the first time—the raindrop size distributions of fourteen tropical cyclones observed (during 2003–2007) at an oceanic station, Aimeliik, located in the Palau islands in the Western Pacific. The raindrop size distributions of Western Pacific tropical cyclones measured in the Palau islands showed unlike characteristics between stratiform and convective clusters, with a larger mass-weighted mean diameter and smaller normalized intercept parameter in the convective type. The contribution of the drop diameters to the total number concentration showed a gradual decrease with the increase in drop diameter size. Raindrop size distributions of Western Pacific tropical cyclones measured in the Palau islands differed slightly from Taiwan and Japan. The helpfulness of empirical relations in raindrop size distribution in rainfall estimation algorithms of ground-based (ZR, μ–Λ, Dm–R, and Nw–R) and remote-sensing (σm–Dm, μo–Dm, Dm–Zku, and Dm–Zka) radars are evaluated. Furthermore, the present study also related the rainfall kinetic energy of fourteen tropical cyclones with rainfall rate and mass-weighted mean diameter (KEtime–R, KEmm–R, and KEmm–Dm). The raindrop size distribution empirical relations appraised in this study offer a chance to: (1) enhance the rain retrieval algorithms of ground-based, remote sensing radars; and (2) improve rainfall kinetic energy estimations using disdrometers and GPM DPR in rainfall erosivity studies.

1. Introduction

Raindrop size distribution (RSD) is one of the essential parameters of precipitation, offering investigation into cloud and rain microphysics [1]. RSD information can improve cloud modeling parametrization, rain retrieval algorithms of the global precipitation measurement dual-frequency precipitation radar (GPM DPR), and assess rainfall kinetic energy relations [2,3,4,5,6]. RSDs substantially vary with changes in formation and the evolution of precipitation, and show considerable variations with the seasons, different geographical regions, weather conditions, and precipitation types [1,3,7,8,9,10,11,12]. For instance, the RSD measurements in Taiwan showed a greater concentration of large-sized drops in the summer than in the winter seasons [11]. Using an OTT PARSIVEL disdrometer, [13] showed distinctions in the RSDs measured over three oceanic locations (South Western Pacific (SWP), West Western Pacific (WWP), and North Western Pacific (NWP)) during a marine survey from June to July 2014. The typhoon rainfall RSDs measured in Taiwan and Japan exhibited distinct characteristics to that of the non-typhoon rainfall [3,8].
Tropical cyclones (TCs) with gusty winds and torrential rainfall can produce devastating damages, life loss and disruption to daily activities. Henceforth, the socioeconomic threat of TCs demands the use of both ground-based and remote sensing radars’ quantitative precipitation estimation (QPE) algorithms and cloud modeling simulations [6,7,14,15,16,17,18]. So, globally, there has been an increasing interest in understanding the RSDs of TCs [3,7,8,12,19,20,21,22,23,24,25,26].
A relatively high proportion of extreme rainfall and severe damage to livelihood is triggered by TCs from the Western Pacific (WP), over other oceanic regions, suggesting a critical need to understand the cloud and rain microphysics of this region [27]. Hence, the investigations on the WP TCs’ RSDs are predominantly increasing over other oceanic TCs [3,8,16,24,28,29]. For instance, [16] examined the RSDs of WP TCs in Taiwan, and they inferred that the interaction of the WP TCs convective systems with Taiwan’s topography resulted in intermediate RSDs to that of the maritime and continental clusters. For the typhoon Morakot (2009) measured at the southeastern coast of China, [30] noticed distinctions in RSD between the eyewall and rainbands. RSD studies conducted over South Korea, Japan, and Taiwan demonstrated that the Dm (mass-weighted mean diameter) values of WP TCs were smaller than non-typhoon rainfall [3,8,24]. RSDs of seven typhoons measured over China exhibited a higher concentration of smaller drops than the maritime convective clusters [29]. Furthermore, recent studies demonstrated that the RSDs of different rain regions of WP TCs showed distinct characteristics [31,32]. On the other hand, for a given rain segment of a typhoon Mangkhut, [33] observed no spatial variations in RSDs.
The above-mentioned RSD studies for the WP TCs were conducted chiefly from the inland or the coastal stations, and the investigations on TCs’ RSDs over the oceanic site are still lacking in the literature. Though there were reports on the RSDs of seasonal rainfall measured at oceanic locations [13,34,35,36,37], such studies for TCs, especially for WP TCs, are yet to be documented. Henceforth, in the current paper, we investigated the RSD characteristics of fourteen WP TCs measured at an oceanic station located in the Palau islands in the WP. The chief objectives of the present study are: (1) to document the statistical characteristics of WP TCs rainfall by segregating into different rainfall rates and precipitation (stratiform and convective) types; (2) to find out similarities/dissimilarities between the RSDs reported in the present study and the previously reported WP TCs RSDs over the coastal or inland stations; (3) to document the RSDs empirical relations that are useful to improve the ground-based and remote sensing (GPM DPR) radar rain retrieval algorithms; and (4) to report the rainfall kinetic energy relations that are crucial in rainfall erosivity studies. After this brief introduction, the TC’s track information, and the Joss–Waldvogel disdrometer (JWD) measurements are given in Section 2. Section 3 provides the results and discussion followed by a summary and conclusions in Section 4.

2. Data and Methods

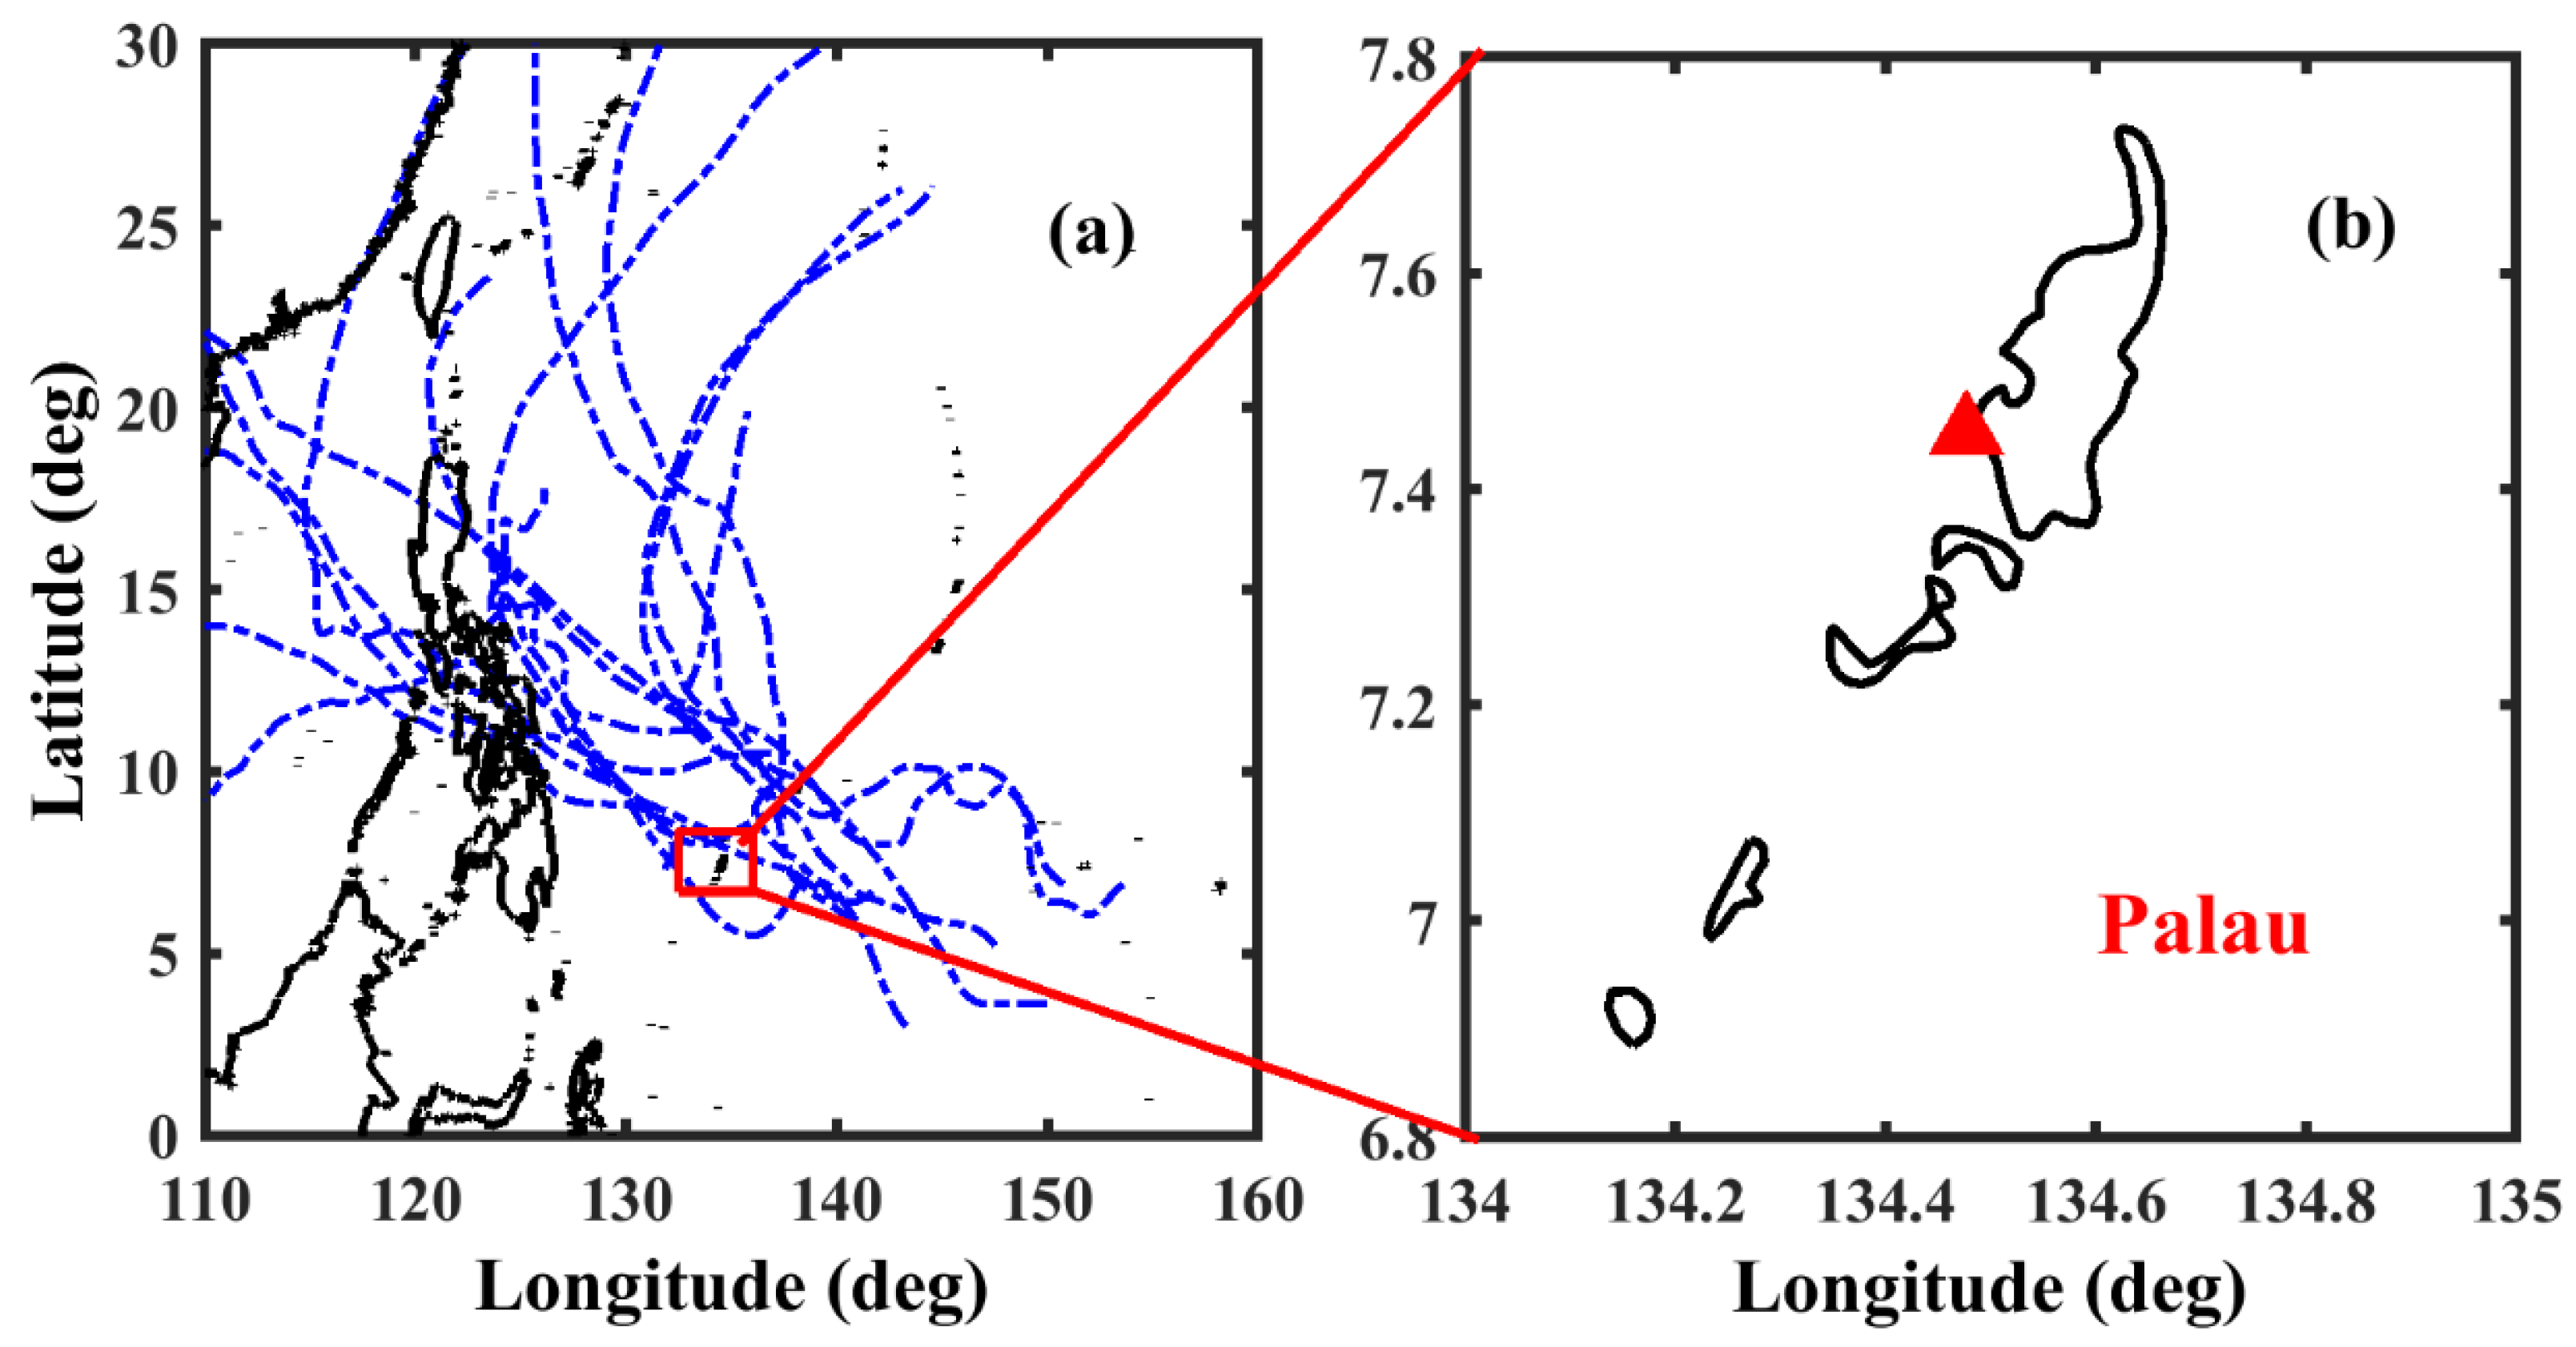
2.1. Observational Site

The Joss–Waldvogel disdrometer (JWD) installed at Aimeliik observational site (7.45222°N E134.47649°E) in the Palau islands measured a total number of fourteen typhoons RSDs during 2003–2007. The track information of these 14 TCs was archived from the joint typhoon warning center (JTWC). In the present study, if there were any TCs around the JWD site within a radial distance of 500 km or less, the corresponding JWD measurements were treated as TC RSDs. Figure 1 shows the tracks of the considered WP TCs and the location of the JWD observational site.

2.2. The Joss–Waldvogel Disdrometer (JWD) Data and Methods

The Joss–Waldvogel disdrometer (JWD) can measure 0.3–5.3 mm diameter raindrops [38]. Once the raindrops hit the JWD, it can infer the size information of the raindrops from the voltage produced by its Styrofoam cone (cross-sectional area 50 cm2), and this information is stored in 20 size intervals. As mentioned in the literature [9], to reduce the sampling errors, the current study also discarded the 1-min RSD samples if the raw drops count was less than ten and the rainfall rate was <0.1 mm h1. Using the number of raindrops from the JWD, the N(D) and other integral rain parameters, such as R (rainfall rate, mm h−1), Z (radar reflectivity, dBZ), Nt (total number concentration, m−3), and LWC (liquid water content, gm−3) are estimated:
N ( D ) ( m 3 m m 1 ) = i = 1 20 n i A × Δ t × V ( D i ) × Δ D i
where, ni, A(m2), Δt (s), Di (mm), ΔDi (mm)), V(Di) (m s−1) are the number of raindrops counted in size bin i, sampling area, sampling time, drop diameter for the size bin i, diameter interval for the drop size bin i, and terminal velocity of the raindrops in the ith channel, respectively. The terminal velocity of raindrops at each channel is estimated using the below equation [39].
V ( D i ) = 9.65 10.3 × exp ( 0.6 × D i )
Z   ( dB Z ) = 10 × l o g 10 ( i = 1 20 N ( D i ) D i 6 Δ D i )
R   ( mm   h 1 ) = 6 π × 10 4 i = 1 20 V ( D i )   N ( D i )   D i 3 Δ D i
L W C   ( g   m 3 ) = π 6   10 3 ρ w   i = 1 20 N ( D i )   D i 3 Δ D i
N t   (   m 3 ) = i = 1 20 N ( D i )   Δ D i
The nth-order moment (Mn) of raindrop size distribution can be expressed as:
M n = D m i n D m a x D i n N ( D i )   Δ D i
The mass-weighted mean diameter, Dm, can be expressed as:
D m   ( mm ) = M 4 M 3
The one-min RSD samples are fitted to gamma function as given below [40]:
N ( D ) = N 0   D μ exp ( Λ D ) .
where D (mm) is the drop diameter, N(D) (m−3 mm−1) is the number of drops per unit volume per unit size interval, N0 (m−3 mm−1) is the number concentration parameter, μ (-) is the shape parameter, and Λ (mm−1) is the slope parameter,
Λ = ( μ + 4 ) M 3 M 4
μ = ( 11 × G 8 ) + G × ( G + 8 ) 2 × ( 1 G )
G = M 4 3 M 6 M 3 2
The normalized intercept parameter, Nw, can be expressed as [10]:
N w   ( m 3 mm 1 ) = 4 4 π ρ w ( 10 3 L W C D m 4 )
The σm (mass spectrum standard deviation, mm) can be estimated using [41,42]:
σ m   ( mm ) = [ i = 1 20   ( D i D m ) 2   N ( D i )   D i 3 Δ D i i = 1 20 N ( D i )   D i 3   d D ] 1 2
The JWD measurements of fourteen WP TCs are also used to estimate the rainfall kinetic energy (KE), which can be expressed as KE flux (KEtime, in J m−2 h−1) and KE content (KEmm, J m−2 mm−1), and the formulations for KEmm and KEtime can be found in [43,44,45].

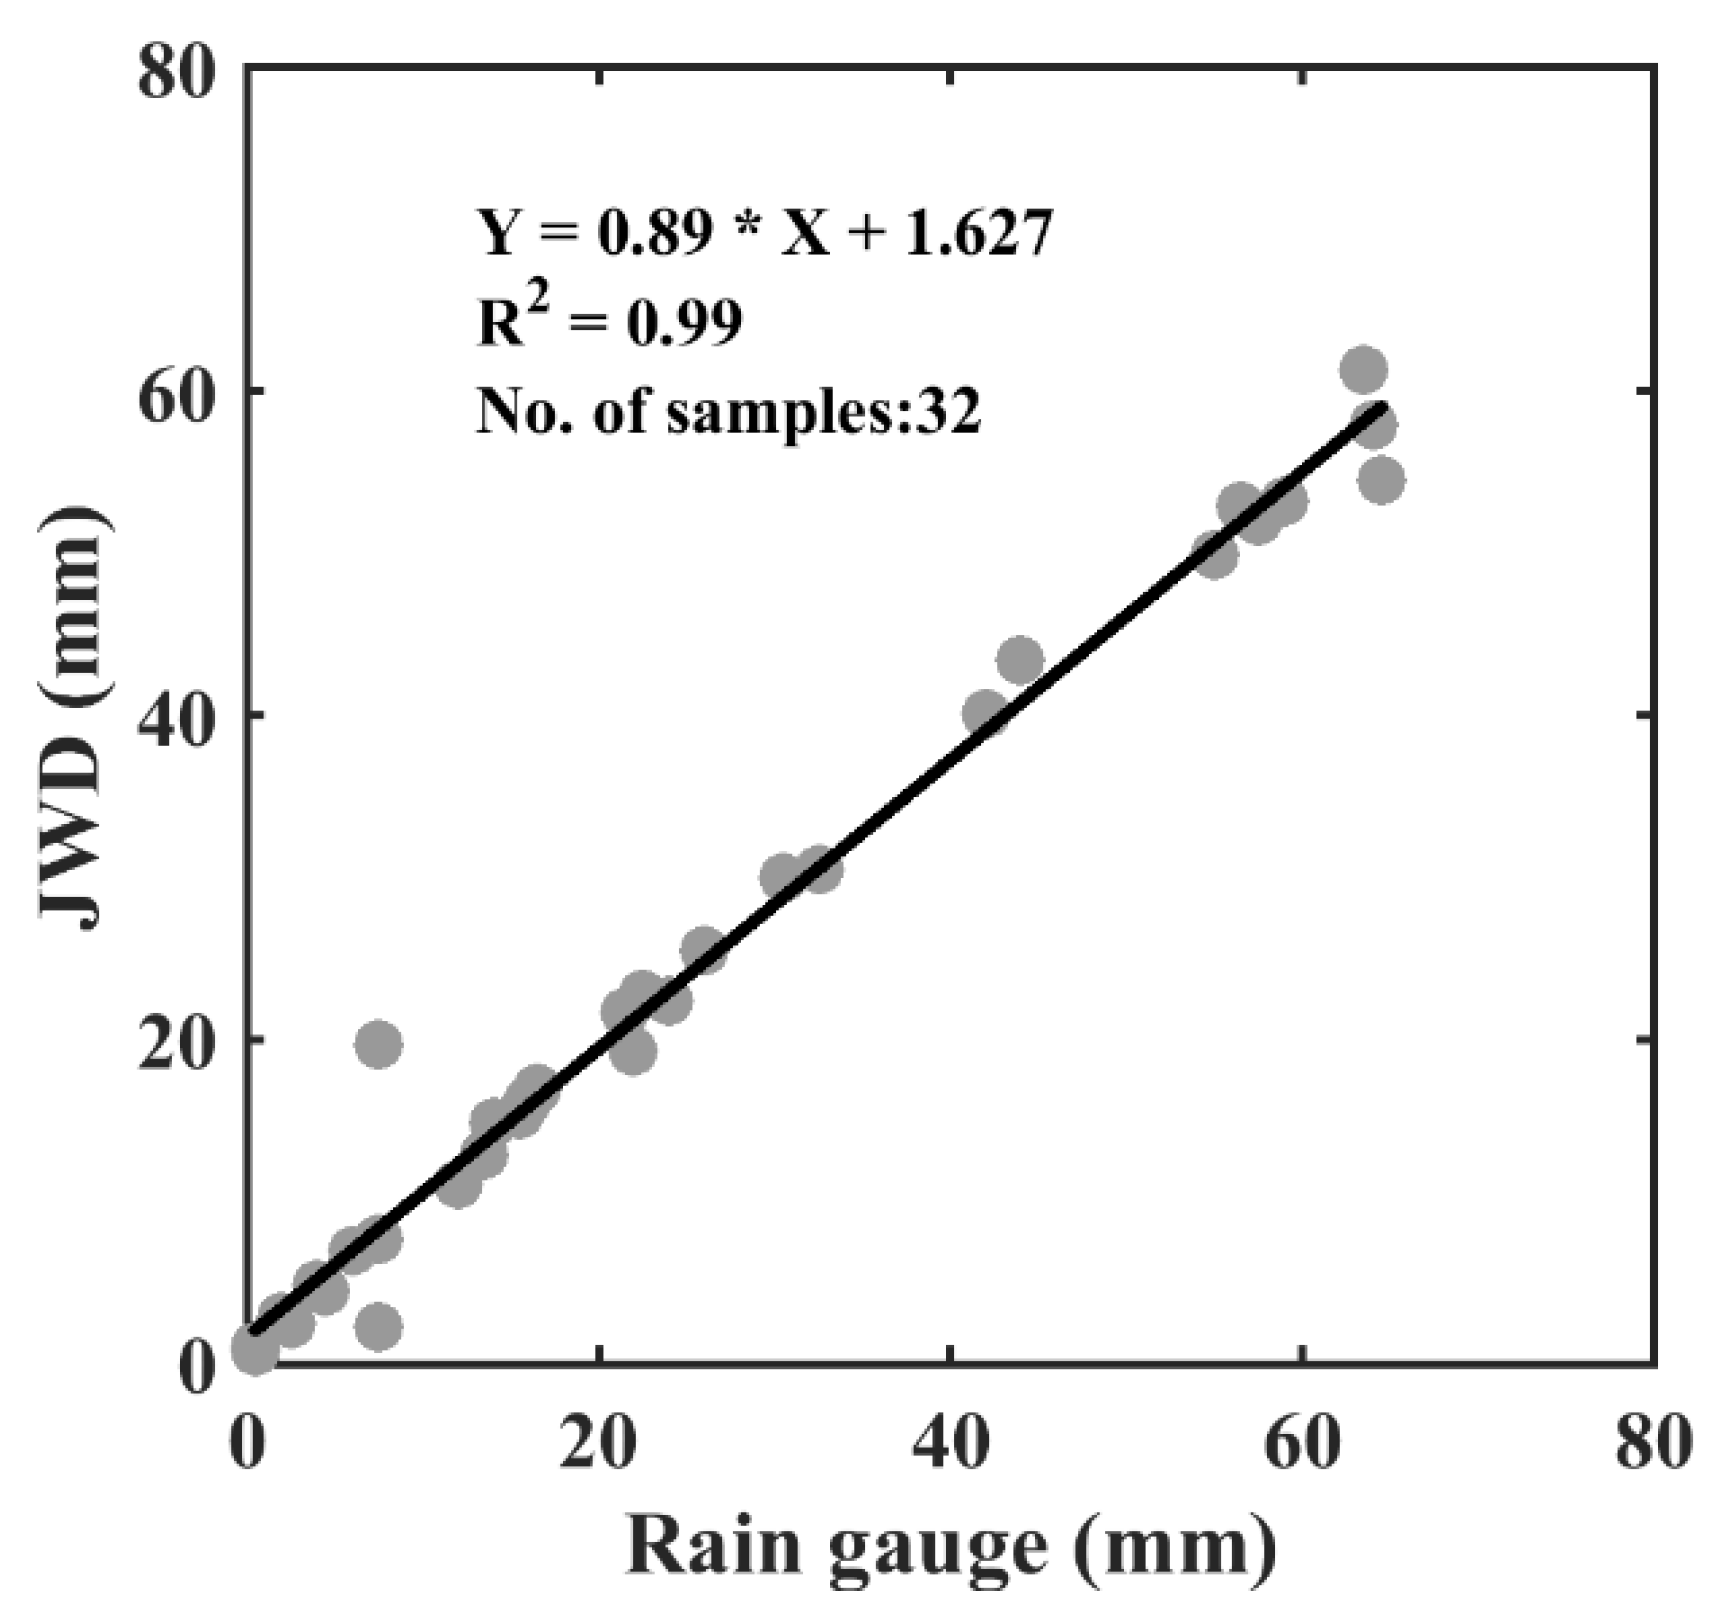
2.3. JWD Data Validation

Before using the RSD information of JWD for further analysis, the daily accumulated rainfall amounts of WP TCs measured with JWD were correlated with the collocated rain gauge, as shown in Figure 2. The comparison clearly shows a good correlation between JWD and the rain gauge measurements, indicating that the JWD measurements are worth enough for further analysis.

3. Results and Discussion

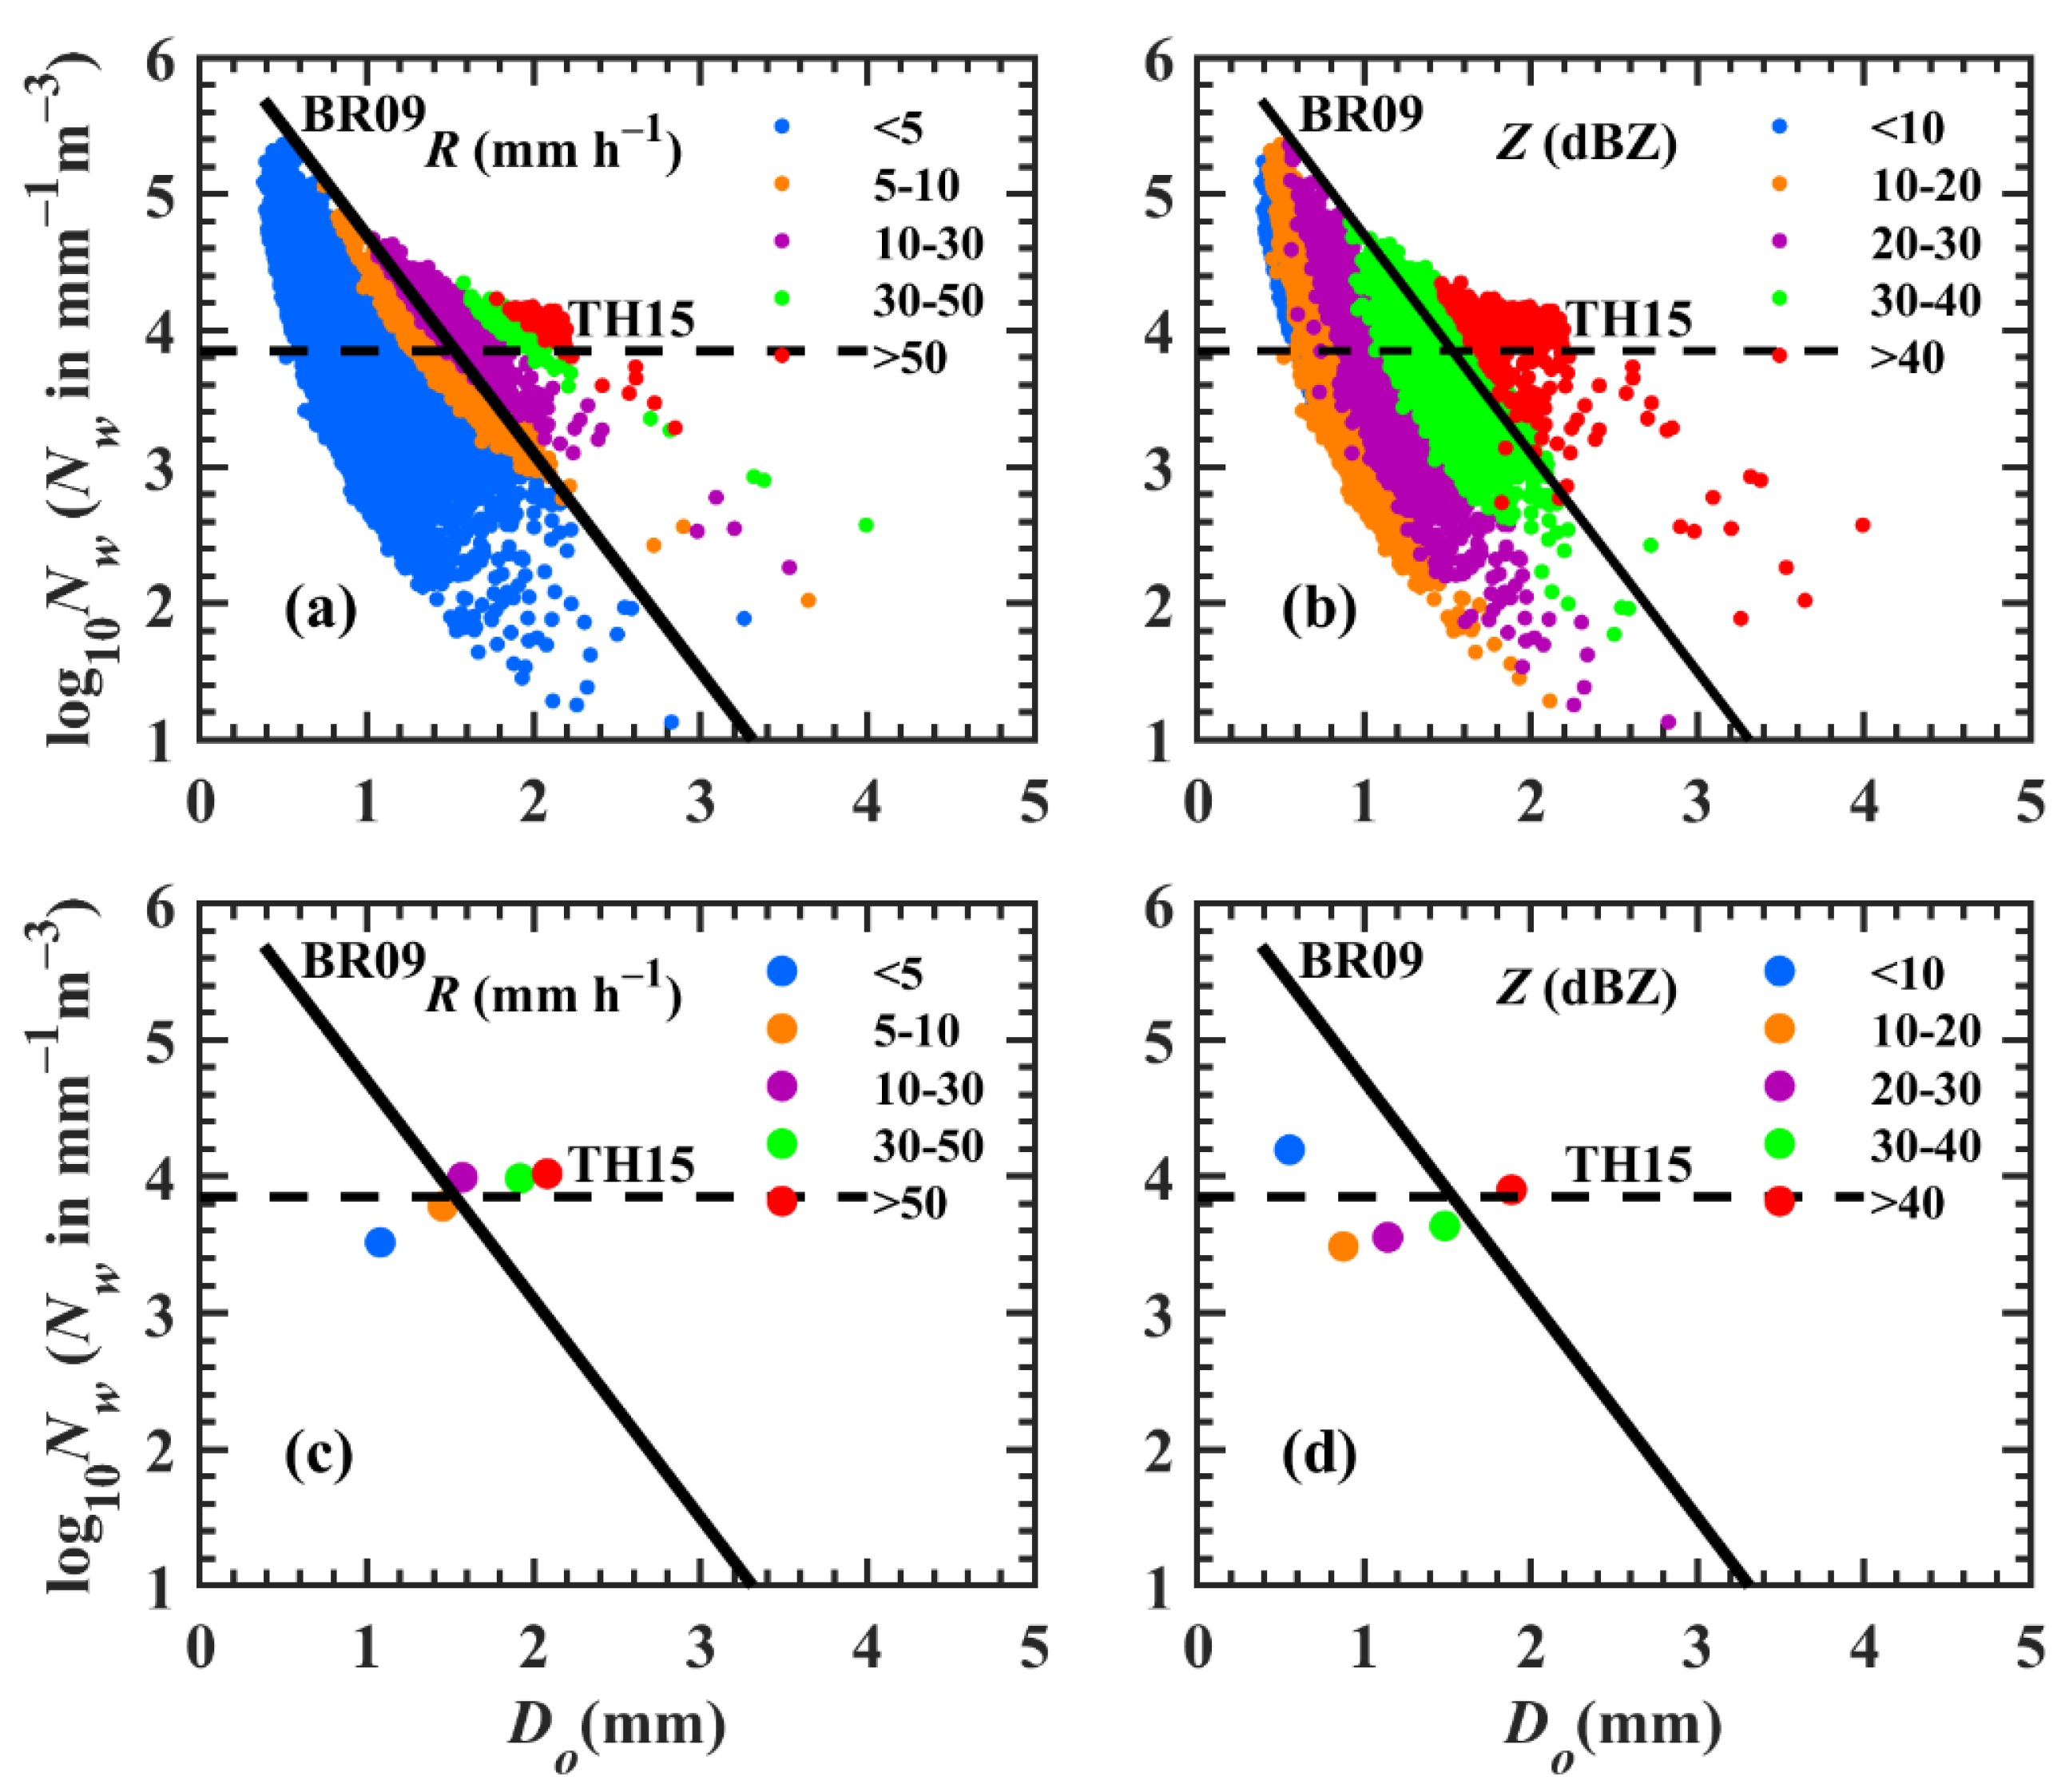
3.1. Distribution of RSD in Different Rainfall Rate and Radar Reflectivity Classes

Figure 3 illustrates the distributions of Do [Do = (3.67+ μ)/Λ] and log10Nw in different rainfall rates (<5, 5–10, 10–30, 30–50, and >50 mm h−1) and radar reflectivity (<10, 10–20, 20–30, 30–40, and >40 dBZ) classes for the WP TCs measured in the Palau islands. The stratiform and convective classification lines of [46,47] are denoted with slant solid and horizontal dotted lines.
The distributions of Do and log10Nw narrowed with the increase in rainfall rates and reflectivity classes. The Do and log10Nw data points for rainfall rates less (higher) than 10 mm h−1 are distributed in the stratiform (convective) regions of [46], as seen in the precipitation classification line (inclined solid line in Figure 3). Likewise, the Do and log10Nw data points corresponding to radar reflectivity values higher (less) than 40 dBZ lie above and below the stratiform and convective precipitation line of [46]. The mean values of Do and log10Nw in different rainfall rates (R, mm h–1) and radar reflectivity (Z, dBZ) classes are depicted in Figure 3c,d. Mean Do values are increased with the increase in R and Z classes. Moreover, for higher rainfall rates classes (R > 10 mm h−1), mean Do, and log10Nw values were distributed in the convective region of [46] (Figure 3). Furthermore, the WP TCs mean log10Nw values were higher than the [47] rainfall classification line for rainfall rates > 10 mm h−1 (Figure 3).

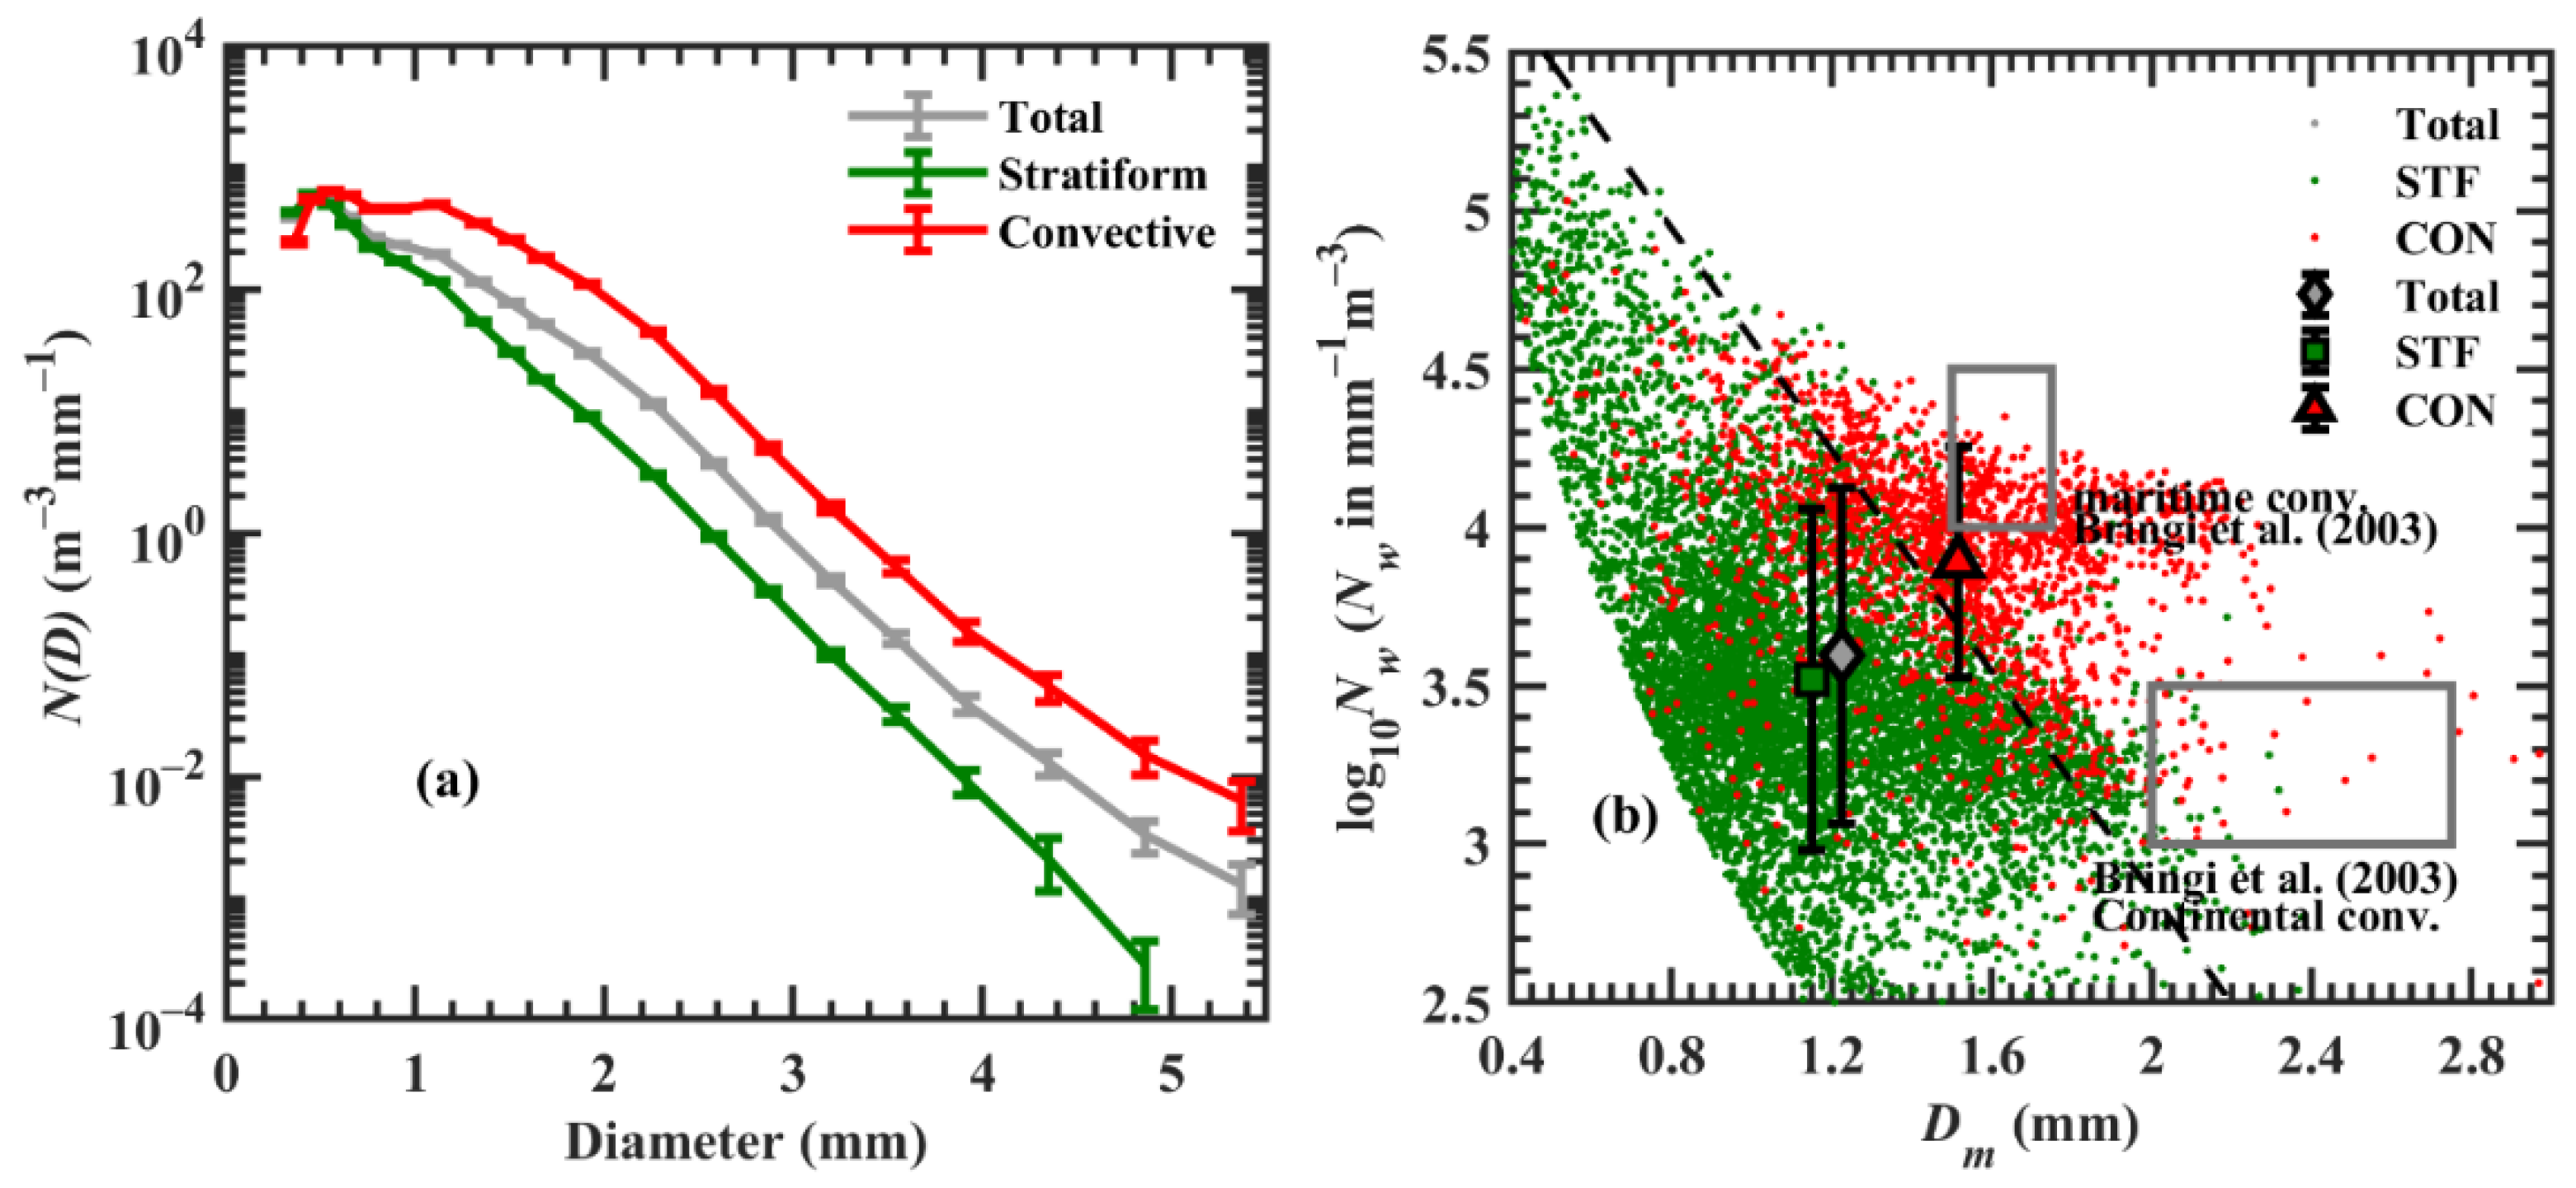
3.2. RSD in Stratiform and Convective Precipitation

The RSDs and their corresponding microphysical properties exhibit profound disparities between stratiform and convective precipitations [9]. Using disdrometer measurements, previous researchers have adopted different methods to segregate the rainfall into two categories (stratiform and convective types) [9,10,14]. The current study separated the WP TCs rainfall measured in the Palau islands into convective and stratiform types using the modified form of [10]. Particularly, if the mean rainfall rate of ten successive 1-min RSD samples was greater than 5 mm h−1 and the standard was greater than 1.5 mm h−1, those samples were considered as convective types, and if this condition was not satisfied, then they were considered as stratiform type. With this classification criteria, around 80% (20%) of RSDs were the stratiform (convective) type, and they contributed to rainfall accumulations of 33% (67%).
The stratiform and convective precipitation mean raindrop size distributions of WP TCs are portrayed in Figure 4a. Except for the first drop size bin, the mean RSDs show a higher concentration in convective than stratiform (Figure 4a). It is apparent from Figure 4a that the stratiform precipitation shows a closely exponential distribution, whereas the convective rainfall exhibited a broader distribution, which could be due to the enhanced collision–breakup processes in the convective compared with the stratiform type [48]. Figure 4b illustrates the scatter plot of Dm and log10Nw values for the stratiform and convective precipitations and the corresponding mean values. From the figure, the WP TCs’ convective and stratiform precipitation mean log10Nw and Dm values align above and below the stratiform–convective segregation line of [10] (inclined black dotted line). The rectangular gray boxes in Figure 4b denote the [10] maritime and continental clusters of RSD measurements from different geographic locations. The comparison of WP TCs’ Dm and log10Nw values shows that the stratiform mean Dm and log10Nw have lower values than the maritime and continental clusters; however, the convective rainfall average Dm is in alignment with maritime convective clusters.
Figure 5 shows the Dm and log10Nw occurrence percentage histograms and their statistical values for the WP TCs. The Dm histogram for total rainfall of WP TCs (Figure 5a) was moderately skewed (skewness, SK = 0.54), whereas the normalized intercept parameter values show a relatively symmetric distribution with a skewness of 0.06. The Dm values show a moderately skewed distribution for both stratiform (SK = 0.54) and convective (SK = 0.56) precipitation (Figure 5b,c). On the other hand, the normalized intercept parameter values exhibited approximately symmetric (SK = 0.35) and highly skewed (SK = −1.02) distribution, in stratiform and convective rainfall, respectively (Figure 5b,c). The Dm and normalized intercept parameters had higher mean values in convective precipitation than the stratiform precipitation.
The WP TCs in the Palau islands showed average Dm values of 1.23 mm, 1.15 mm, 1.52 mm, and average log10Nw values of 3.59, 3.52, and 3.89, for total, stratiform and convective rainfall, respectively. The RSDs of WP TCs measured over Japan (using JWD) indicated that the mean values of mass-weighted mean diameter (Dm = 1.25 mm) and number concentration (log10Nw = 3.74) were larger than the meiyu-baiu front rainfall (Dm = 1.15 mm, log10Nw = 3.59) [8]. On the other hand, summer season rainfall segregated to typhoon and non-typhoon weather conditions in Taiwan showed lower mean Dm (1.25 mm) and higher mean log10Nw (3.63) values in the typhoon than the non-typhoon rainfall (Dm = 1.29 mm, log10Nw = 3.41) [3]. Despite distinctions in the seasonal rainfall RSDs between Palau and Taiwan [35], there was a likeness in the RSDs of WP TCs measured between Palau and the Taiwan islands. Furthermore, the WP TCs measured in Palau also showed nearly identical RSDs to Japan. The WP TCs measurements with a similar type of disdrometer (JWD) interestingly showed nearly identical Dm values among these three islands (mean Dm values in Palau, Taiwan, and Japan are 1.23 mm, 1.25 mm, 1.25, respectively), which signifies that the TCs of WP show no much variation in RSDs with the geographical location.

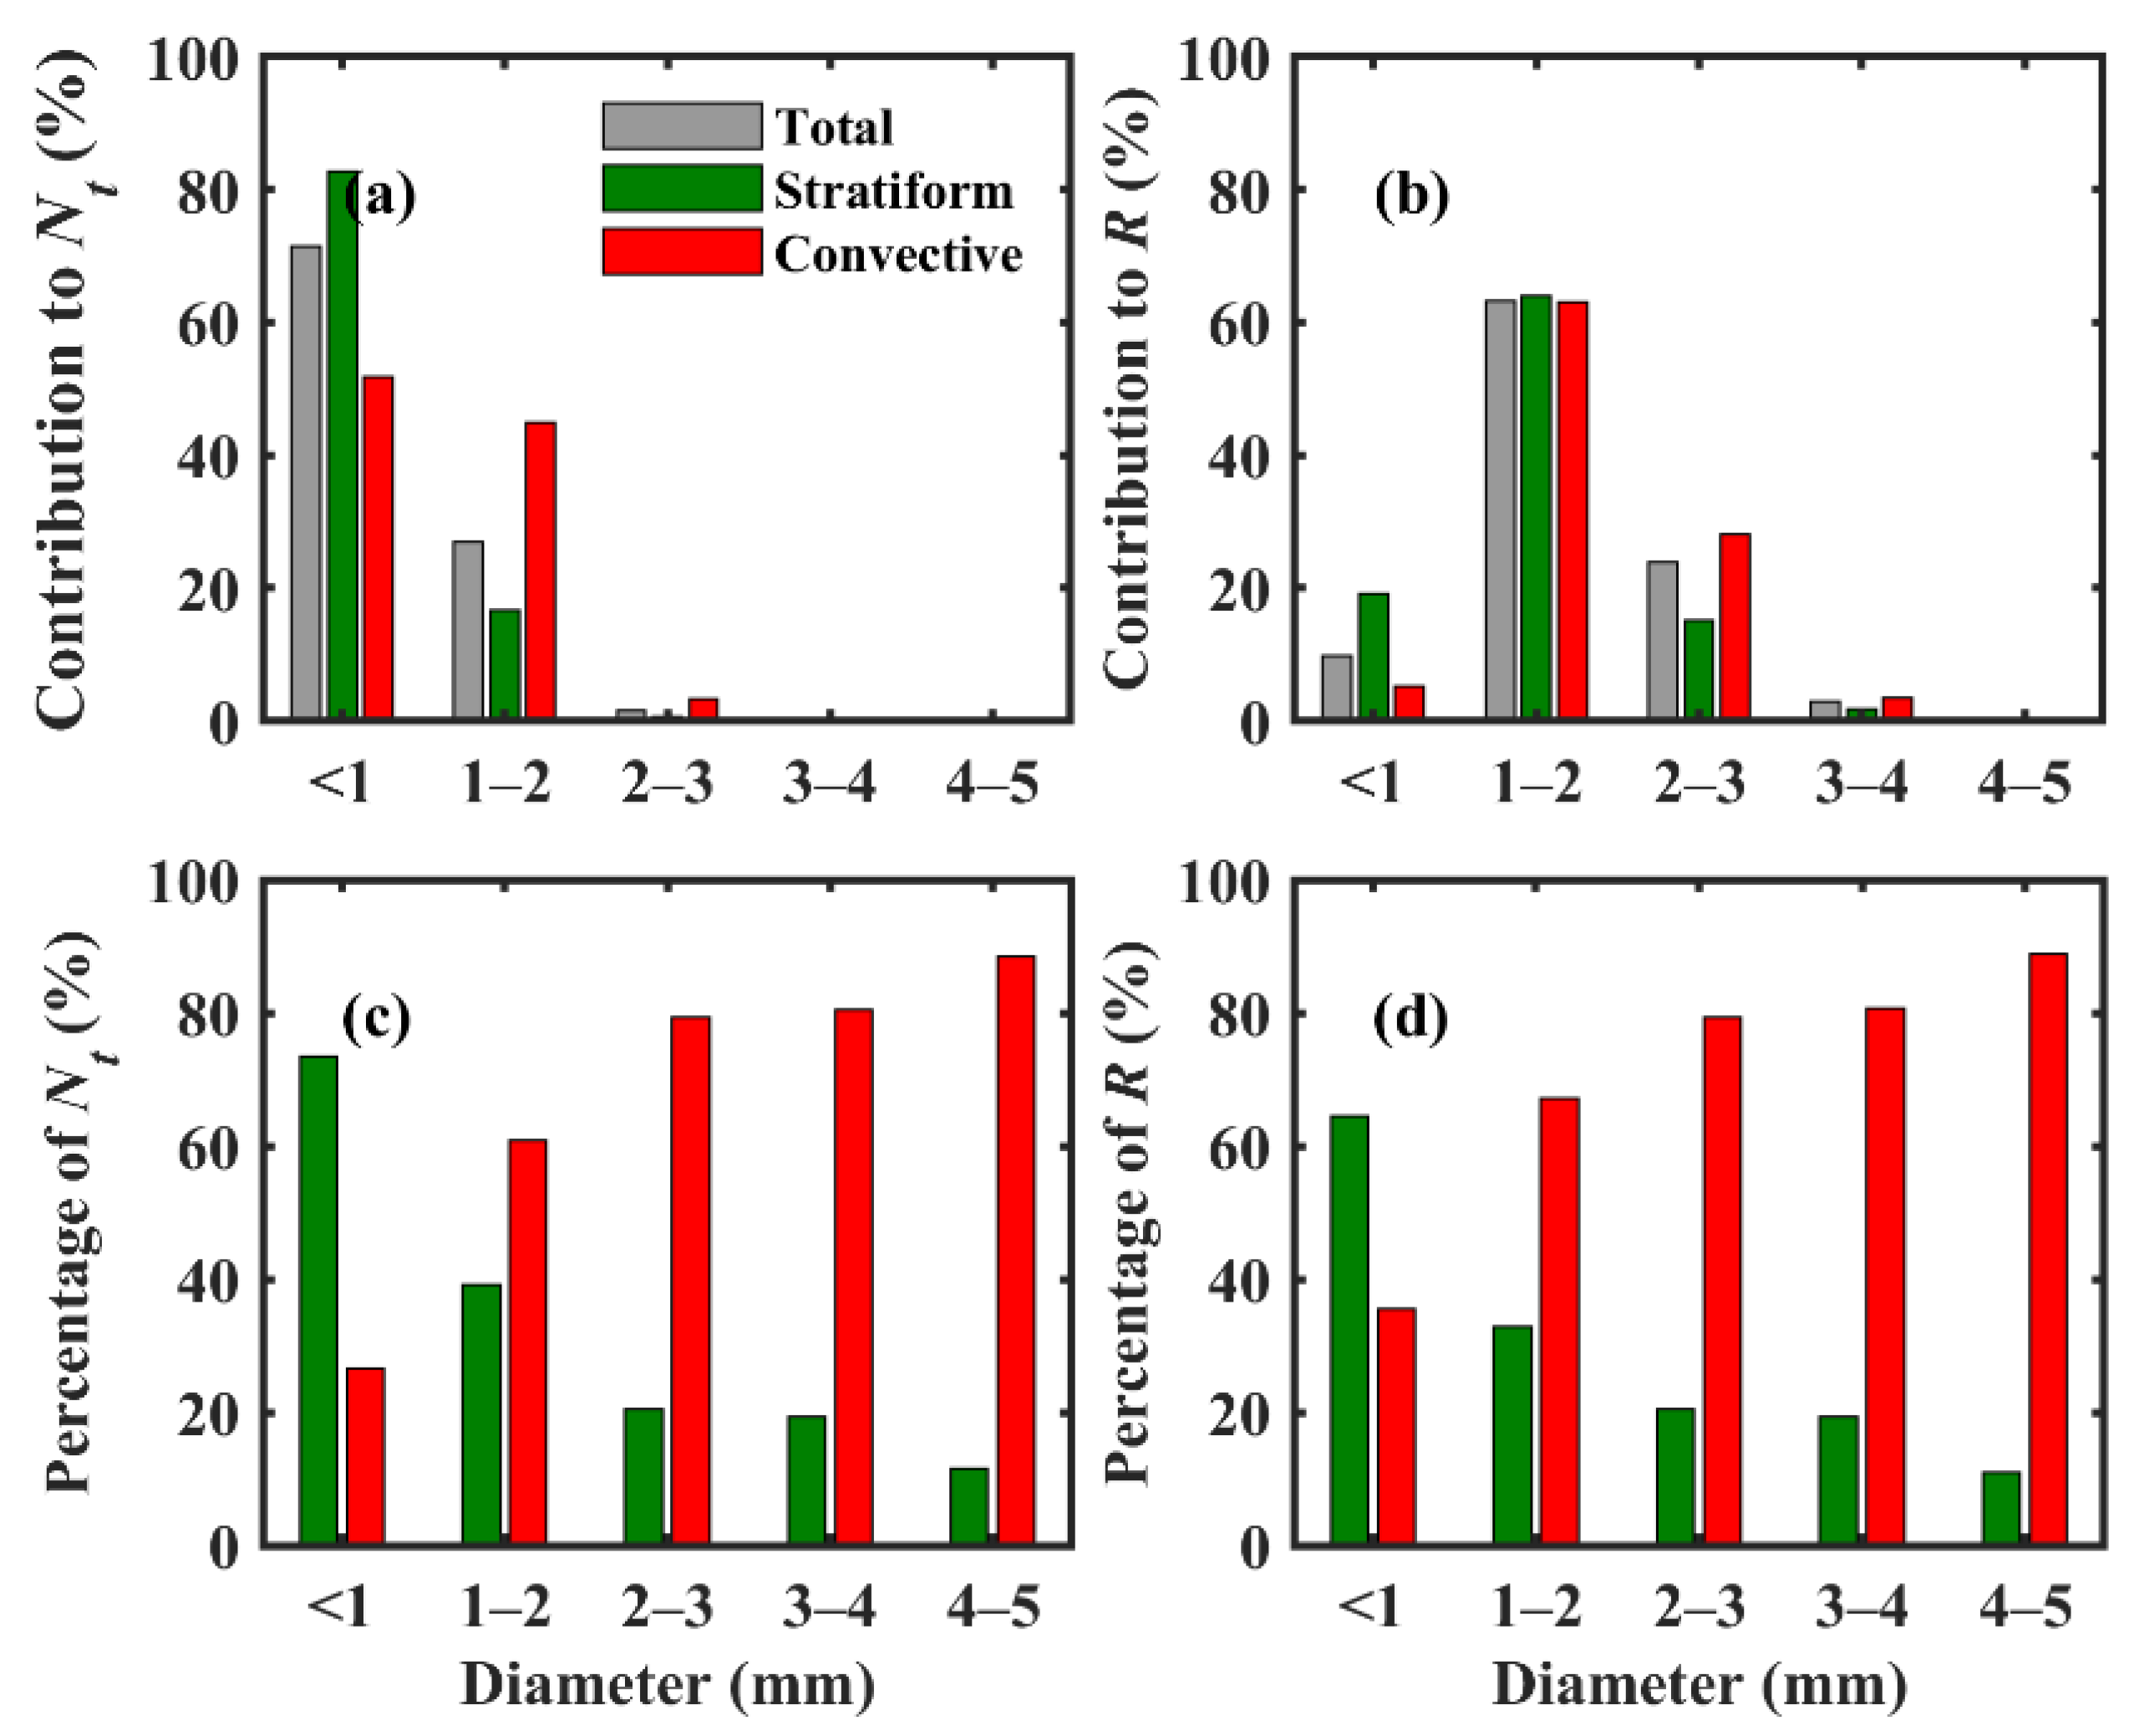
3.3. Raindrops Contribution to Nt and R

Figure 6 elucidates the WP TCs’ raindrops contribution to Nt (total number concentration) and R (rainfall rate). From the figure, we can notice that with the increase in raindrop sizes, the number concentration decreases, and rainfall rates increase and then decrease for total, stratiform and convective rainfall (Figure 6a,b). Similar characteristics were also reported for the WP TCs measured in Japan and Taiwan [3,8].
Small-size drops (<1 mm) largely contributed to Nt for the total, stratiform, and convective rainfall (Figure 6a). The percentage contributions of smaller drops (<1 mm) to the number concentration were predominantly higher in stratiform precipitation than the convective precipitations; conversely, the percentage contribution of raindrops >1 mm diameter were higher in convective than the stratiform rainfall (Figure 6c). Raindrops of diameter 1–2 mm contributed more to the rainfall rate than the raindrops of other diameters (Figure 6b). On the other hand, smaller drops’ (<1 mm) contribution percentage to the rainfall rate was higher in stratiform precipitation than the convective precipitations, and the contribution of raindrops above 1 mm diameter to rainfall rate was predominantly higher in convective than stratiform rainfall (Figure 6d). It is apparent from Figure 6a,b that the raindrops up to 2 mm diameter contribute primarily to the total number concentration and rainfall rate.

3.4. Radar Reflectivity–Rainfall Rate Relations

The empirical relationship between radar reflectivity and rainfall rate (also called ZR relation), which can be expressed in the form of a power law, i.e., Z = ARb, with R in mm h−1, Z in mm6 m−3, can offer the operation radars to estimate the rainfall rate from the observed radar reflectivity. This empirical relationship can be derived by fitting the straight line to logarithmic reflectivity versus logarithmic rainfall rate plot. The radar-derived rainfall information from the Z–R relations has tremendous applications in hydro-meteorological models. These relations showed substantial variations with precipitation types, geographical locations, and intensely rely on RSD features [1,35]. The coefficient (A) and exponent (b) values of Z–R relations (Z = ARb) can infer the microphysics of given precipitation. The bigger the raindrops, the higher the coefficient A will be. If the exponent is > 1, the size-controlled (collision–coalescence) process is the dominant characteristic of the precipitation. If exponent = 1, then the number-controlled (collision, coalescence, and breakup) processes are related to the given rainfall [49,50,51]. Previous studies have demonstrated that implementing the region and precipitation-specific Z–R relations could reduce the rainfall estimation uncertainties [12,52].
The radar reflectivity and rainfall rate scatter plots for total, stratiform and convective precipitation of WP TCs and the corresponding linear regression lines are depicted in Figure 7, which clearly shows that the ZR relations differ substantially between stratiform and convective precipitation with a higher coefficient and exponent values in stratiform than the convective. Using a similar kind of disdrometer (JWD), the ZR relations of WP TCs were documented as Z = 189 R1.38 in Japan [8] and Z = 217.02 R1.35 in Taiwan [3]. If we compare the ZR relationship of the WP TCs evaluated in the present study (Z = 221.51 R1.35) with the WP TCs measured over Taiwan, both the locations showed identical exponent values (b = 1.35), which can hint that the WP TCs exhibited similar microphysical processes at these two islands.

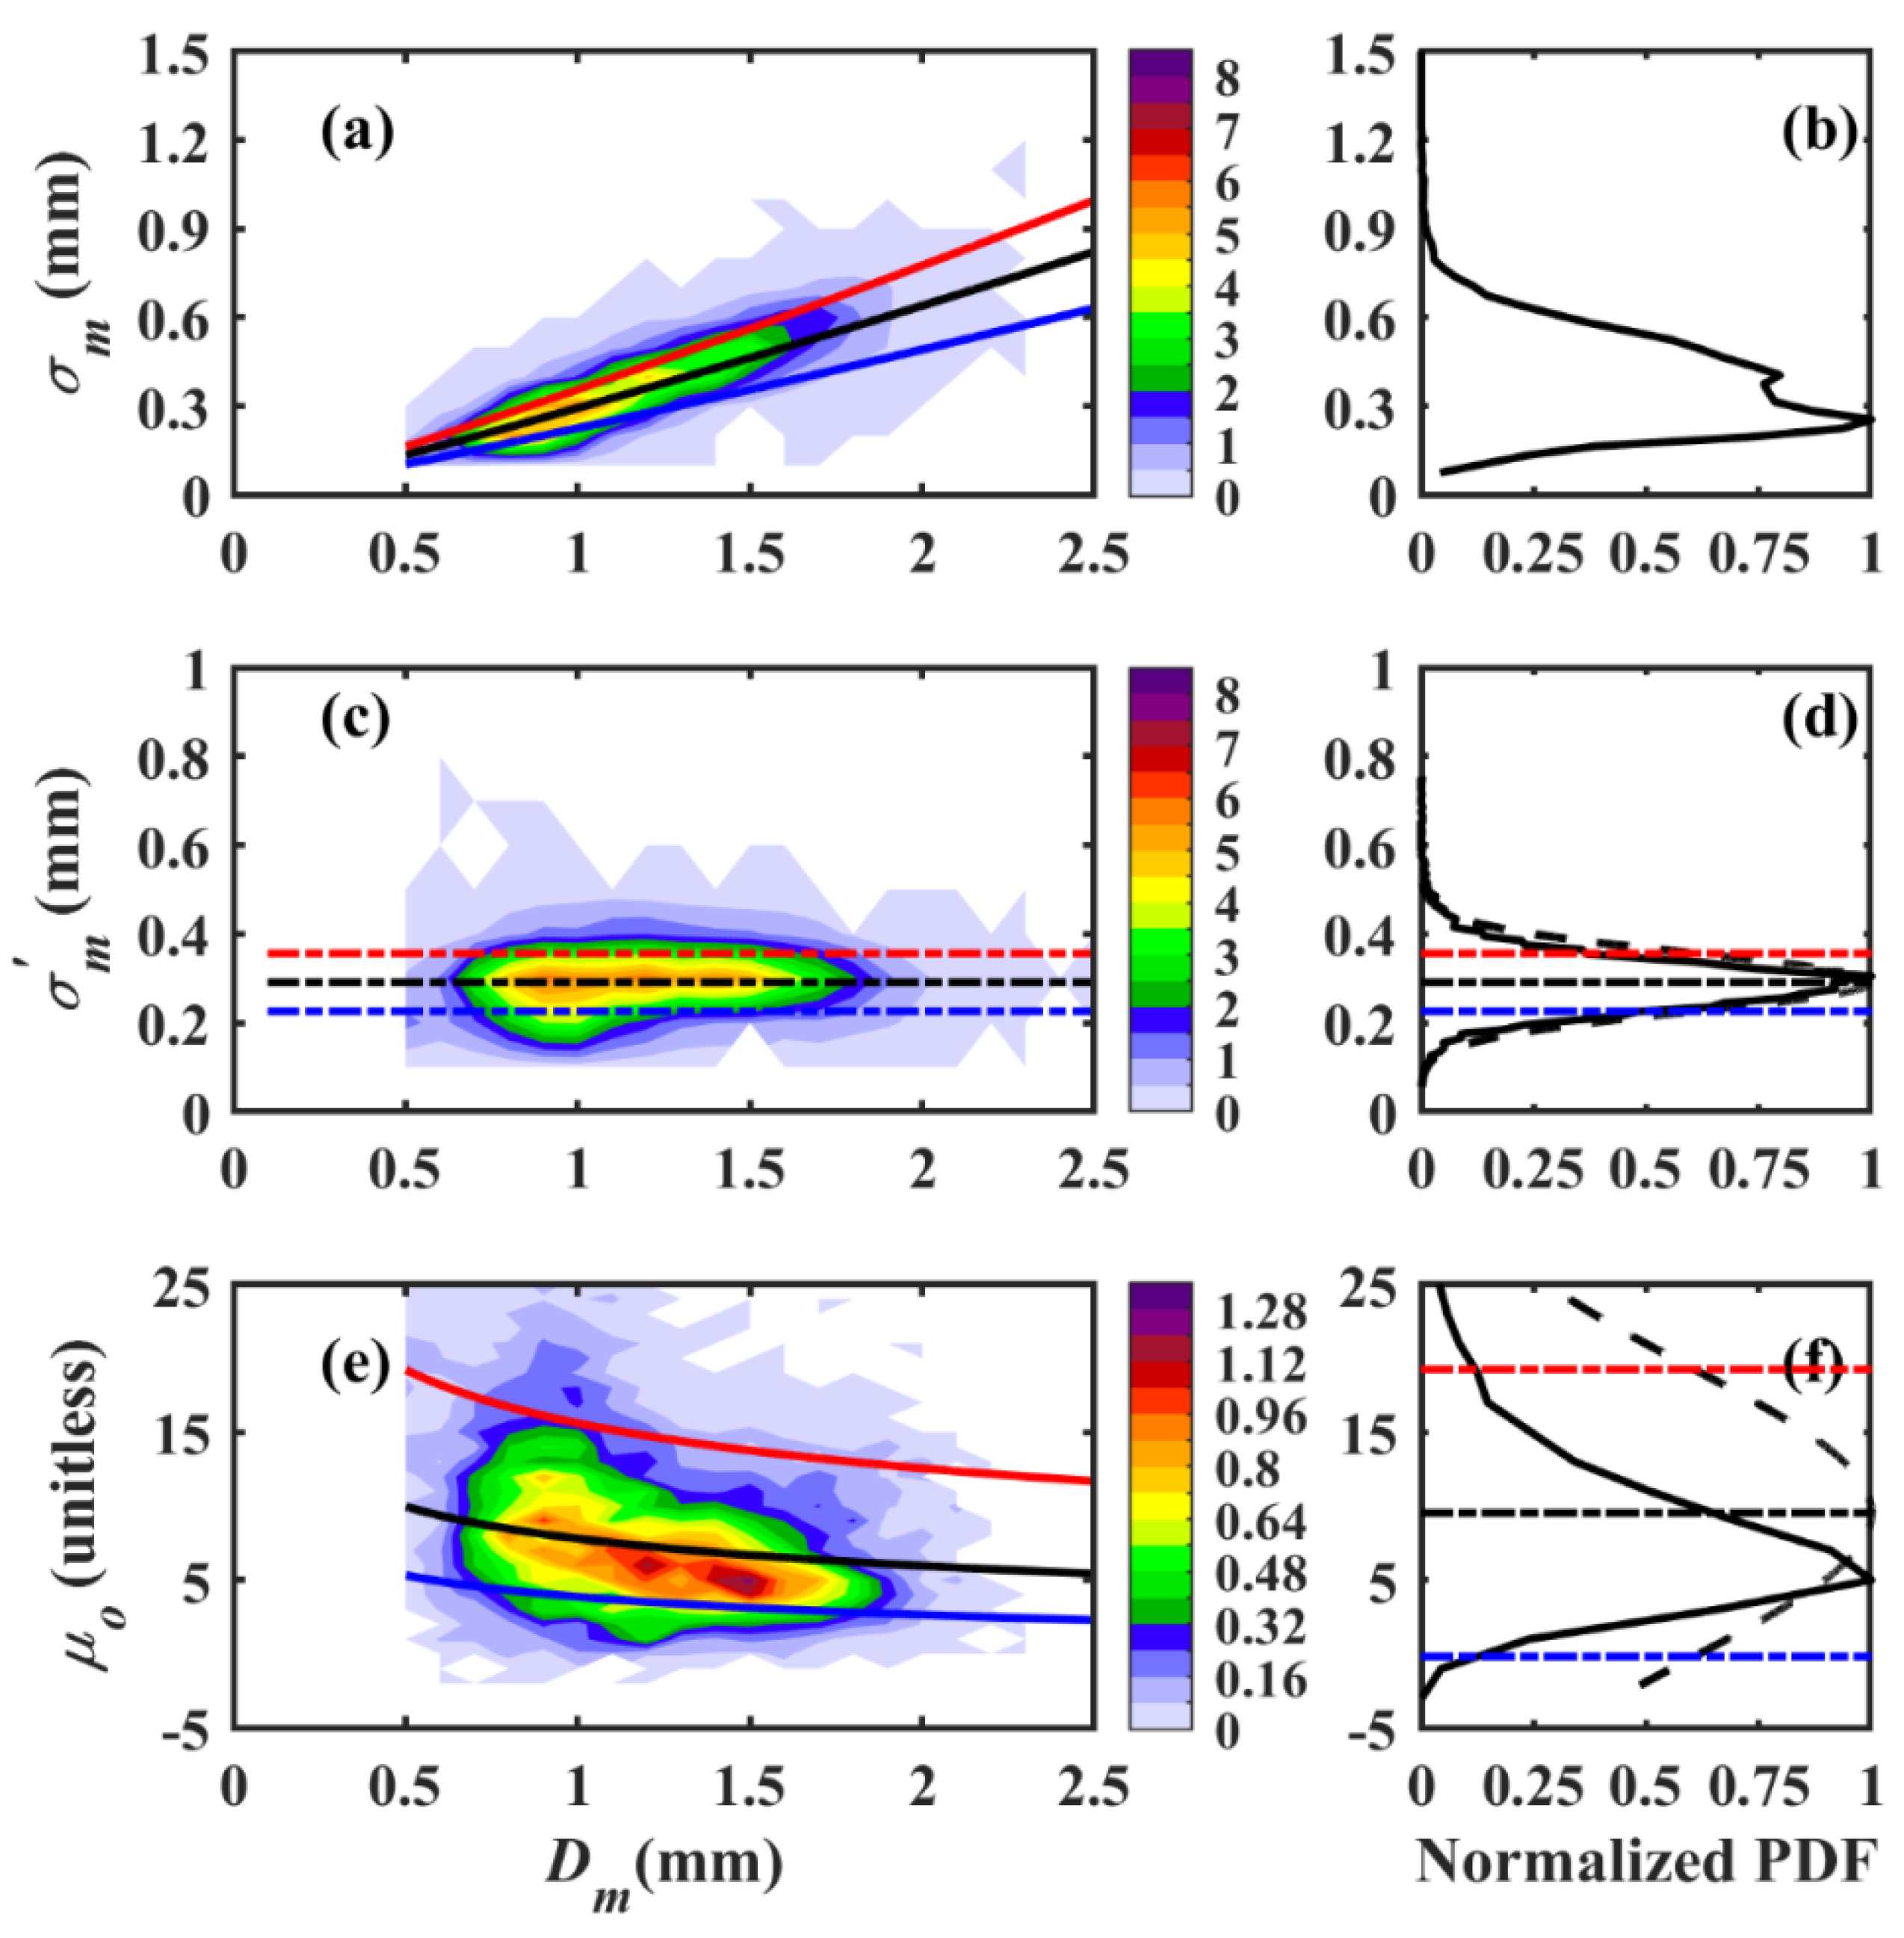
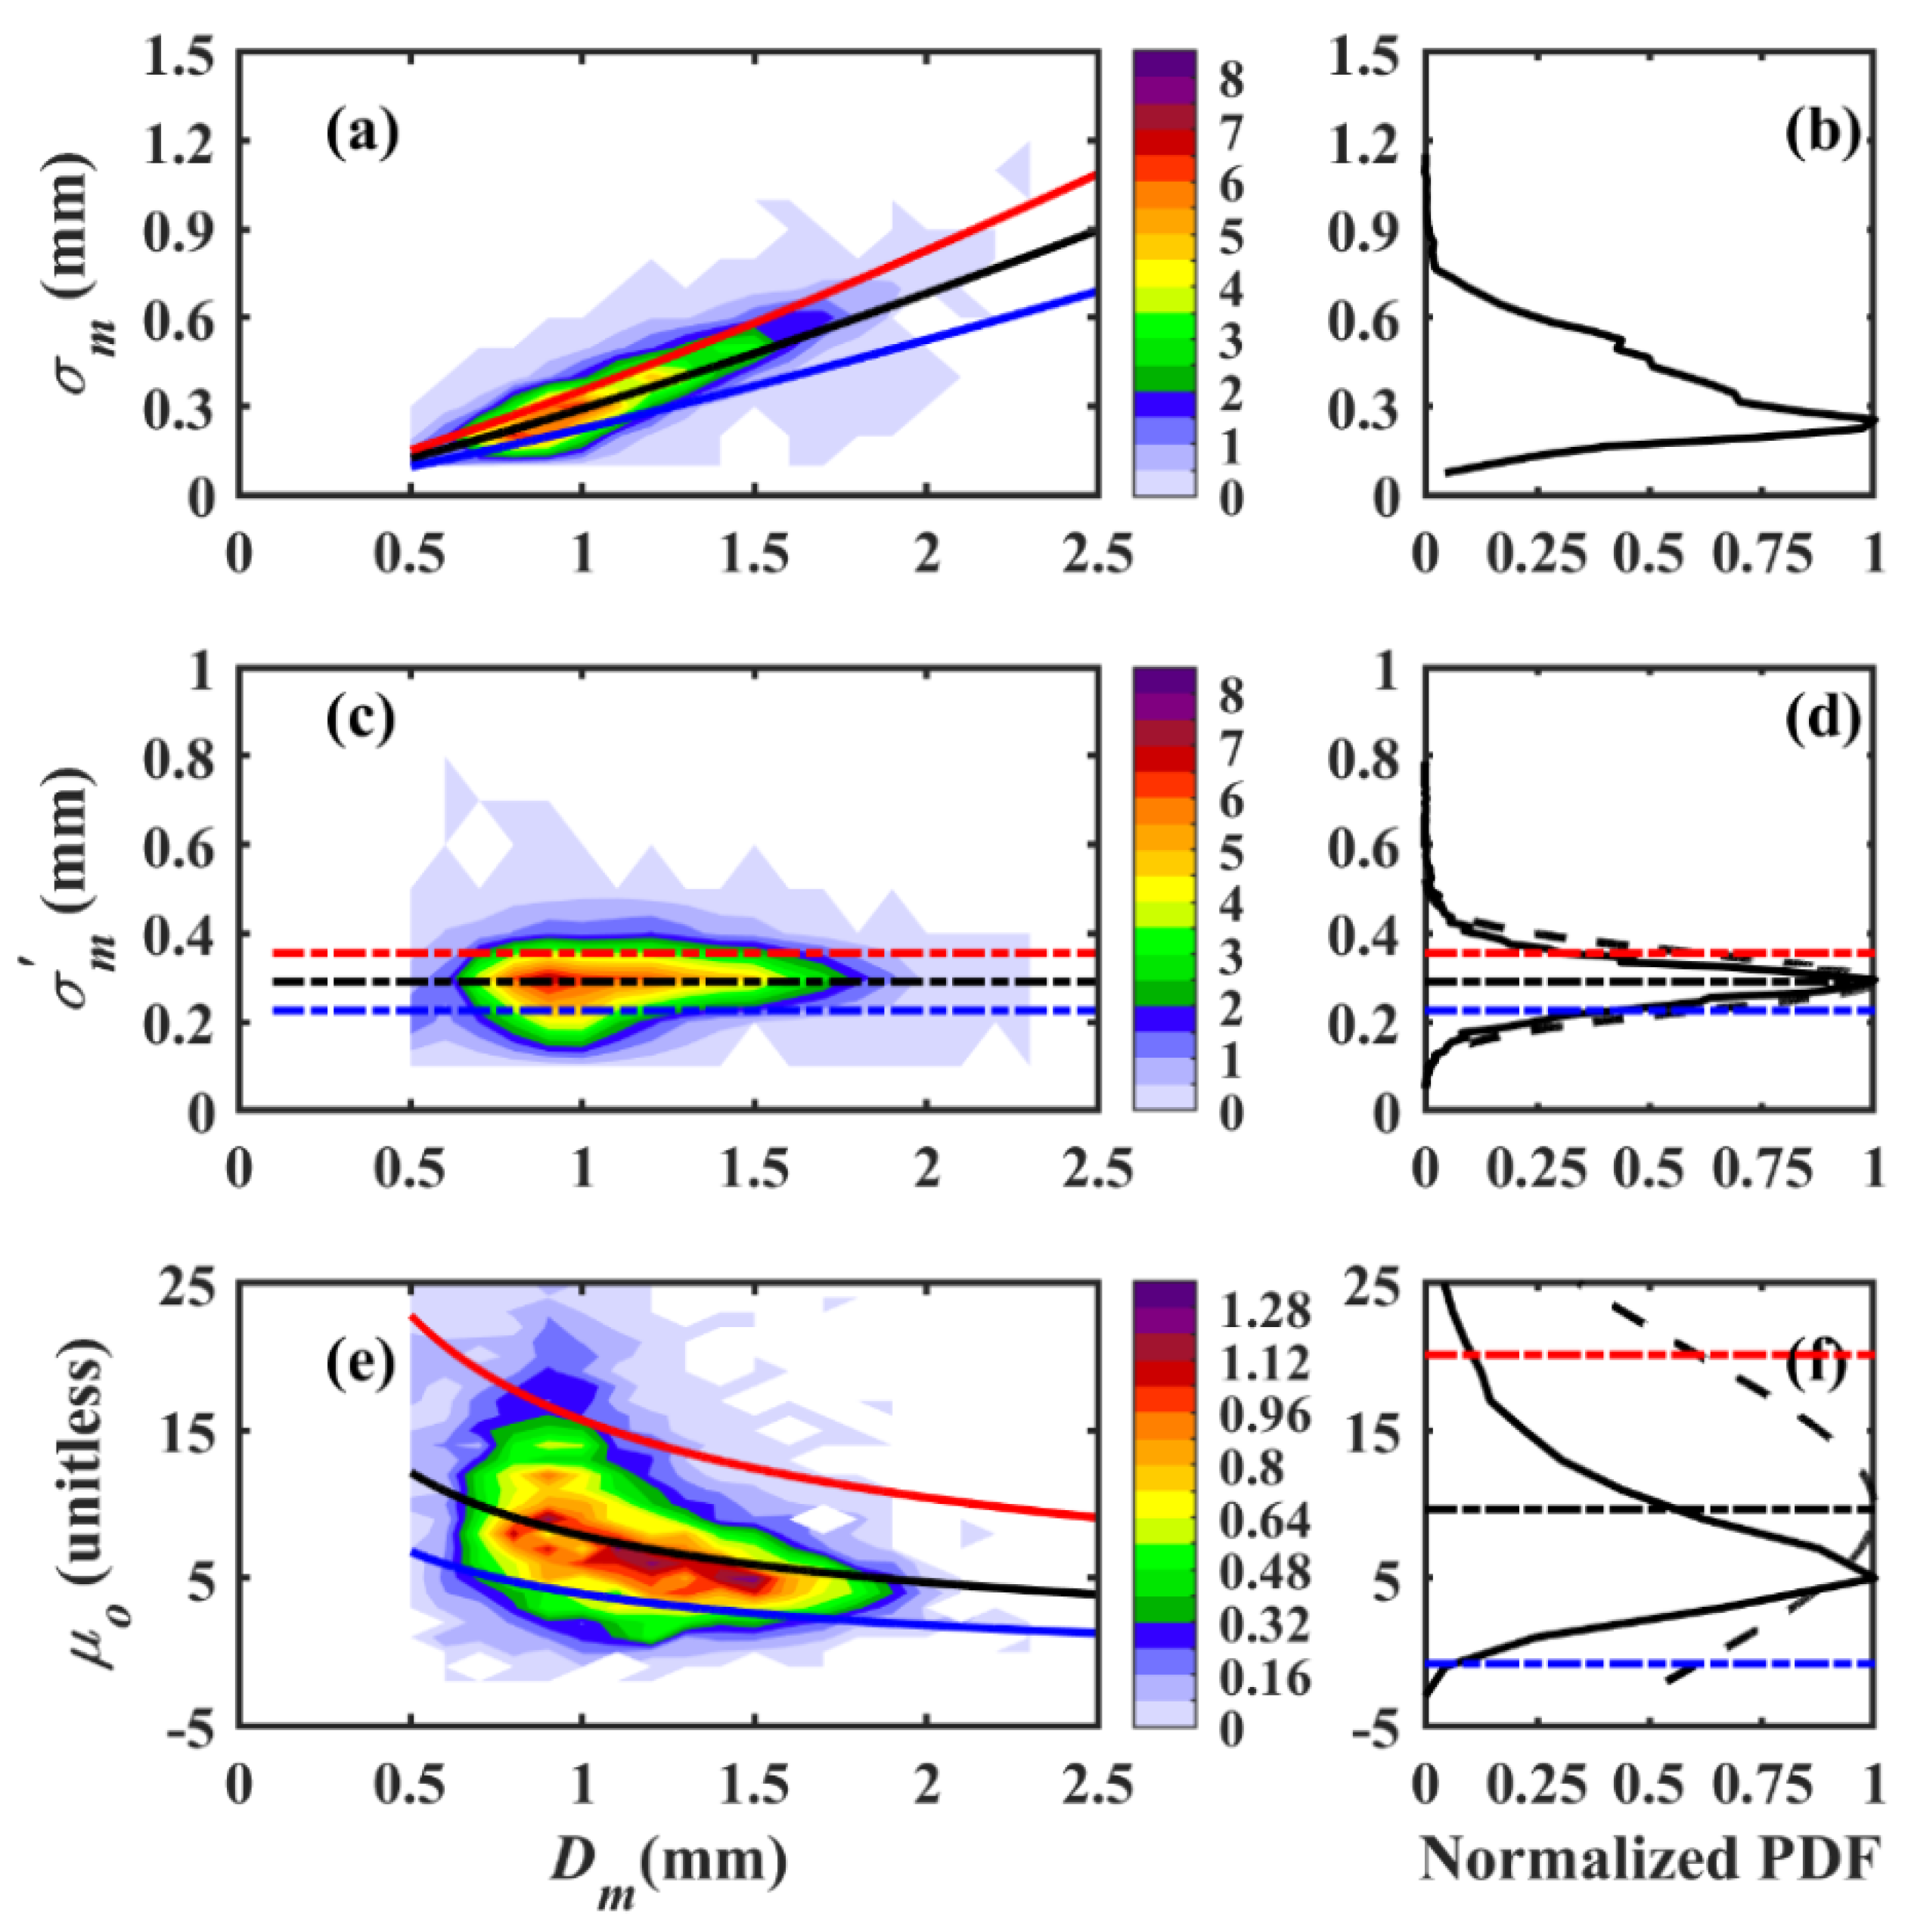
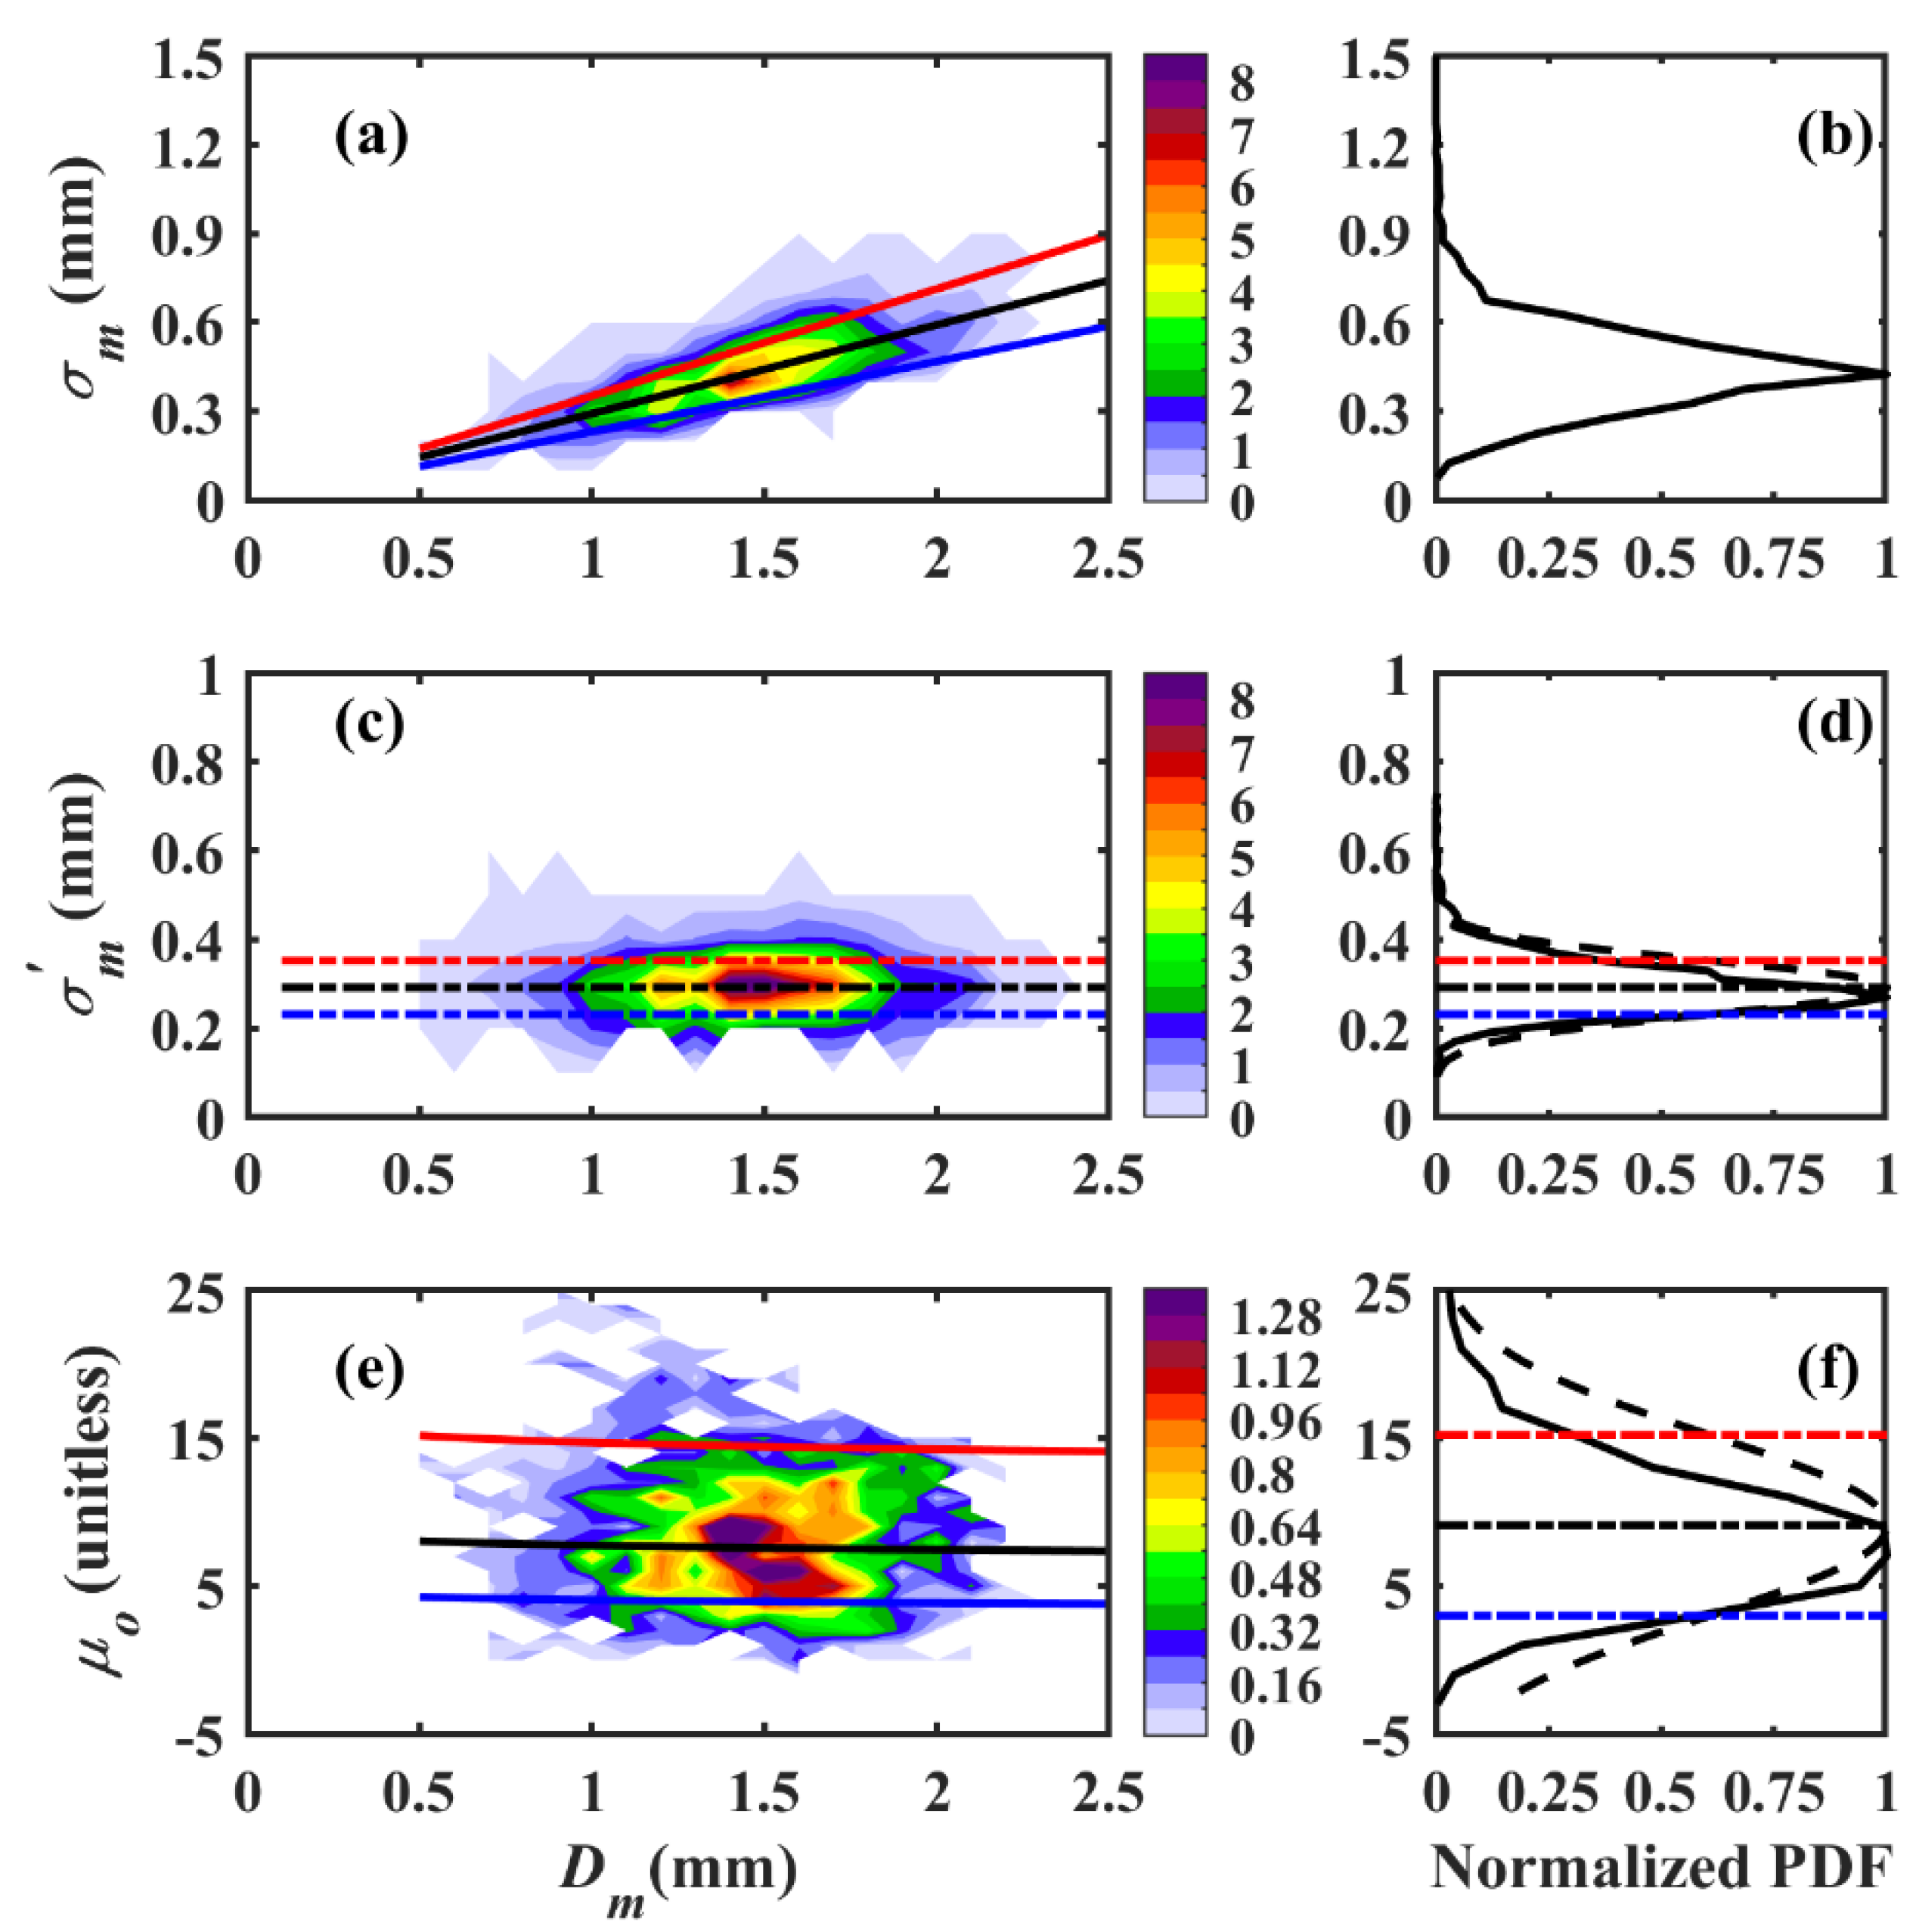
3.5. The Shape–Slope Relationship

The three-parameter Gamma distribution is widely used in bulk microphysics schemes and rain retrieval algorithms of ground-based radars, and it provides better characterization of rain RSDs than two-parameter exponential distribution [40,53,54,55]. Converting three-parameter gamma distribution to two-parameter gamma distribution (also called constrained gamma distribution) using empirical relations between the slope and shape parameters (μΛ relations) can reduce the errors in the polarimetric radar rainfall estimators. Initially, [56] argued that, due to the statistical errors in the RSD moment estimation, the empirical relationship between the slope and shape parameters (μΛ relations) could not represent the microphysics of precipitation. However, the subsequent study demonstrated that the μΛ relationship captured the RSDs’ physical nature, and was least influenced by the errors in the assessment of μ and Λ from the RSD moments [57]. Hence, the μΛ relationship is widely used to understand RSD variability, and estimate the rainfall from remote-sensing and ground-based radars [54,57,58,59,60]. It has been demonstrated that μΛ relations differ by region and rain type, and it is always essential to customize the region- or precipitation-specific μΛ relationship.
The empirical relationships between μ and Λ are derived by adopting the quality control procedure of [60] to the total, stratiform and convective rainfall of WP TCs. As the μΛ relations estimated for the light rain/drizzle can lead to statistical errors, the μ and Λ values corresponding to rainfall rate < 5 mm h−1 were removed in the current study [58]. Moreover, values of μ and Λ, higher than 20 and 20 mm−1, respectively, were also discarded [57]. A polynomial least-square fit to the total, stratiform, and convective precipitations of the WP TCs are represented with solid black lines in Figure 8a–c, and their corresponding equations are also depicted in the respective figure panels. The inclined dashed grey lines in Figure 8a–c are computed for different Dm values (Dm = 1, 1.5, 2, and 3 mm) from the relationship ΛDm = 4 + μ [61]. Along with the present WP TCs’ μΛ relations, previously reported TCs’ μ–Λ relations [16,29,30] are also given in Figure 8. We can notice that the WP TCs measured in Taiwan and the coastal location of China showed nearly identical fit lines to that of the WP TCs in the Palau islands. However, there is an apparent disparity between continental convective/WP TCs rainfall fit lines and those of the WP TCs in the Palau islands.

3.6. Relationship of Rainfall Rates with Dm and Nw

The Dm and log10Nw can be used to inspect the microphysics of given precipitation, and these two parameters exhibit profound variations with weather systems and precipitation types [1,19]. To understand the variability of Dm and log10Nw with rainfall rate, Figure 9 displays the distributions of Dm and log10Nw with rainfall rate for the total, stratiform, and convective precipitations of WP TCs. The Dm and log10Nw values show broader distribution at lower rainfall rates, and its spread is reduced with the increase in rainfall rate. The reduction in the spread of Dm values at higher rainfall rates is related to the equilibrium conditions attained by the raindrops through collision–coalescence and breakup process, and further increases in rainfall rate under the equilibrium condition infer further raindrop concentration increases [10,48,62]. On the other hand, for rainfall rates > 25 mm h−1, the spread in Dm values is relatively more in convective precipitation than in the stratiform type. However, the spread in log10Nw values is more in stratiform precipitation than the convective for lower rainfall rates (<10 mm h−1). For a given rainfall rate, comparison of present TCs relationships (Dm =1.143 R0.145, log10Nw = 3.553 R0.033) with TCs measured in Taiwan (Dm = 1.133 R0.153, log10Nw = 3.572 R0.031) showed a slight difference in Dm/log10Nw values between these two islands [3]. Even though there were reports on the seasonal differences in the RSDs between Taiwan and the Palau islands [35], comparison of TCs’ Dm–R and log10Nw–R relations between these two islands revealed slight variation.

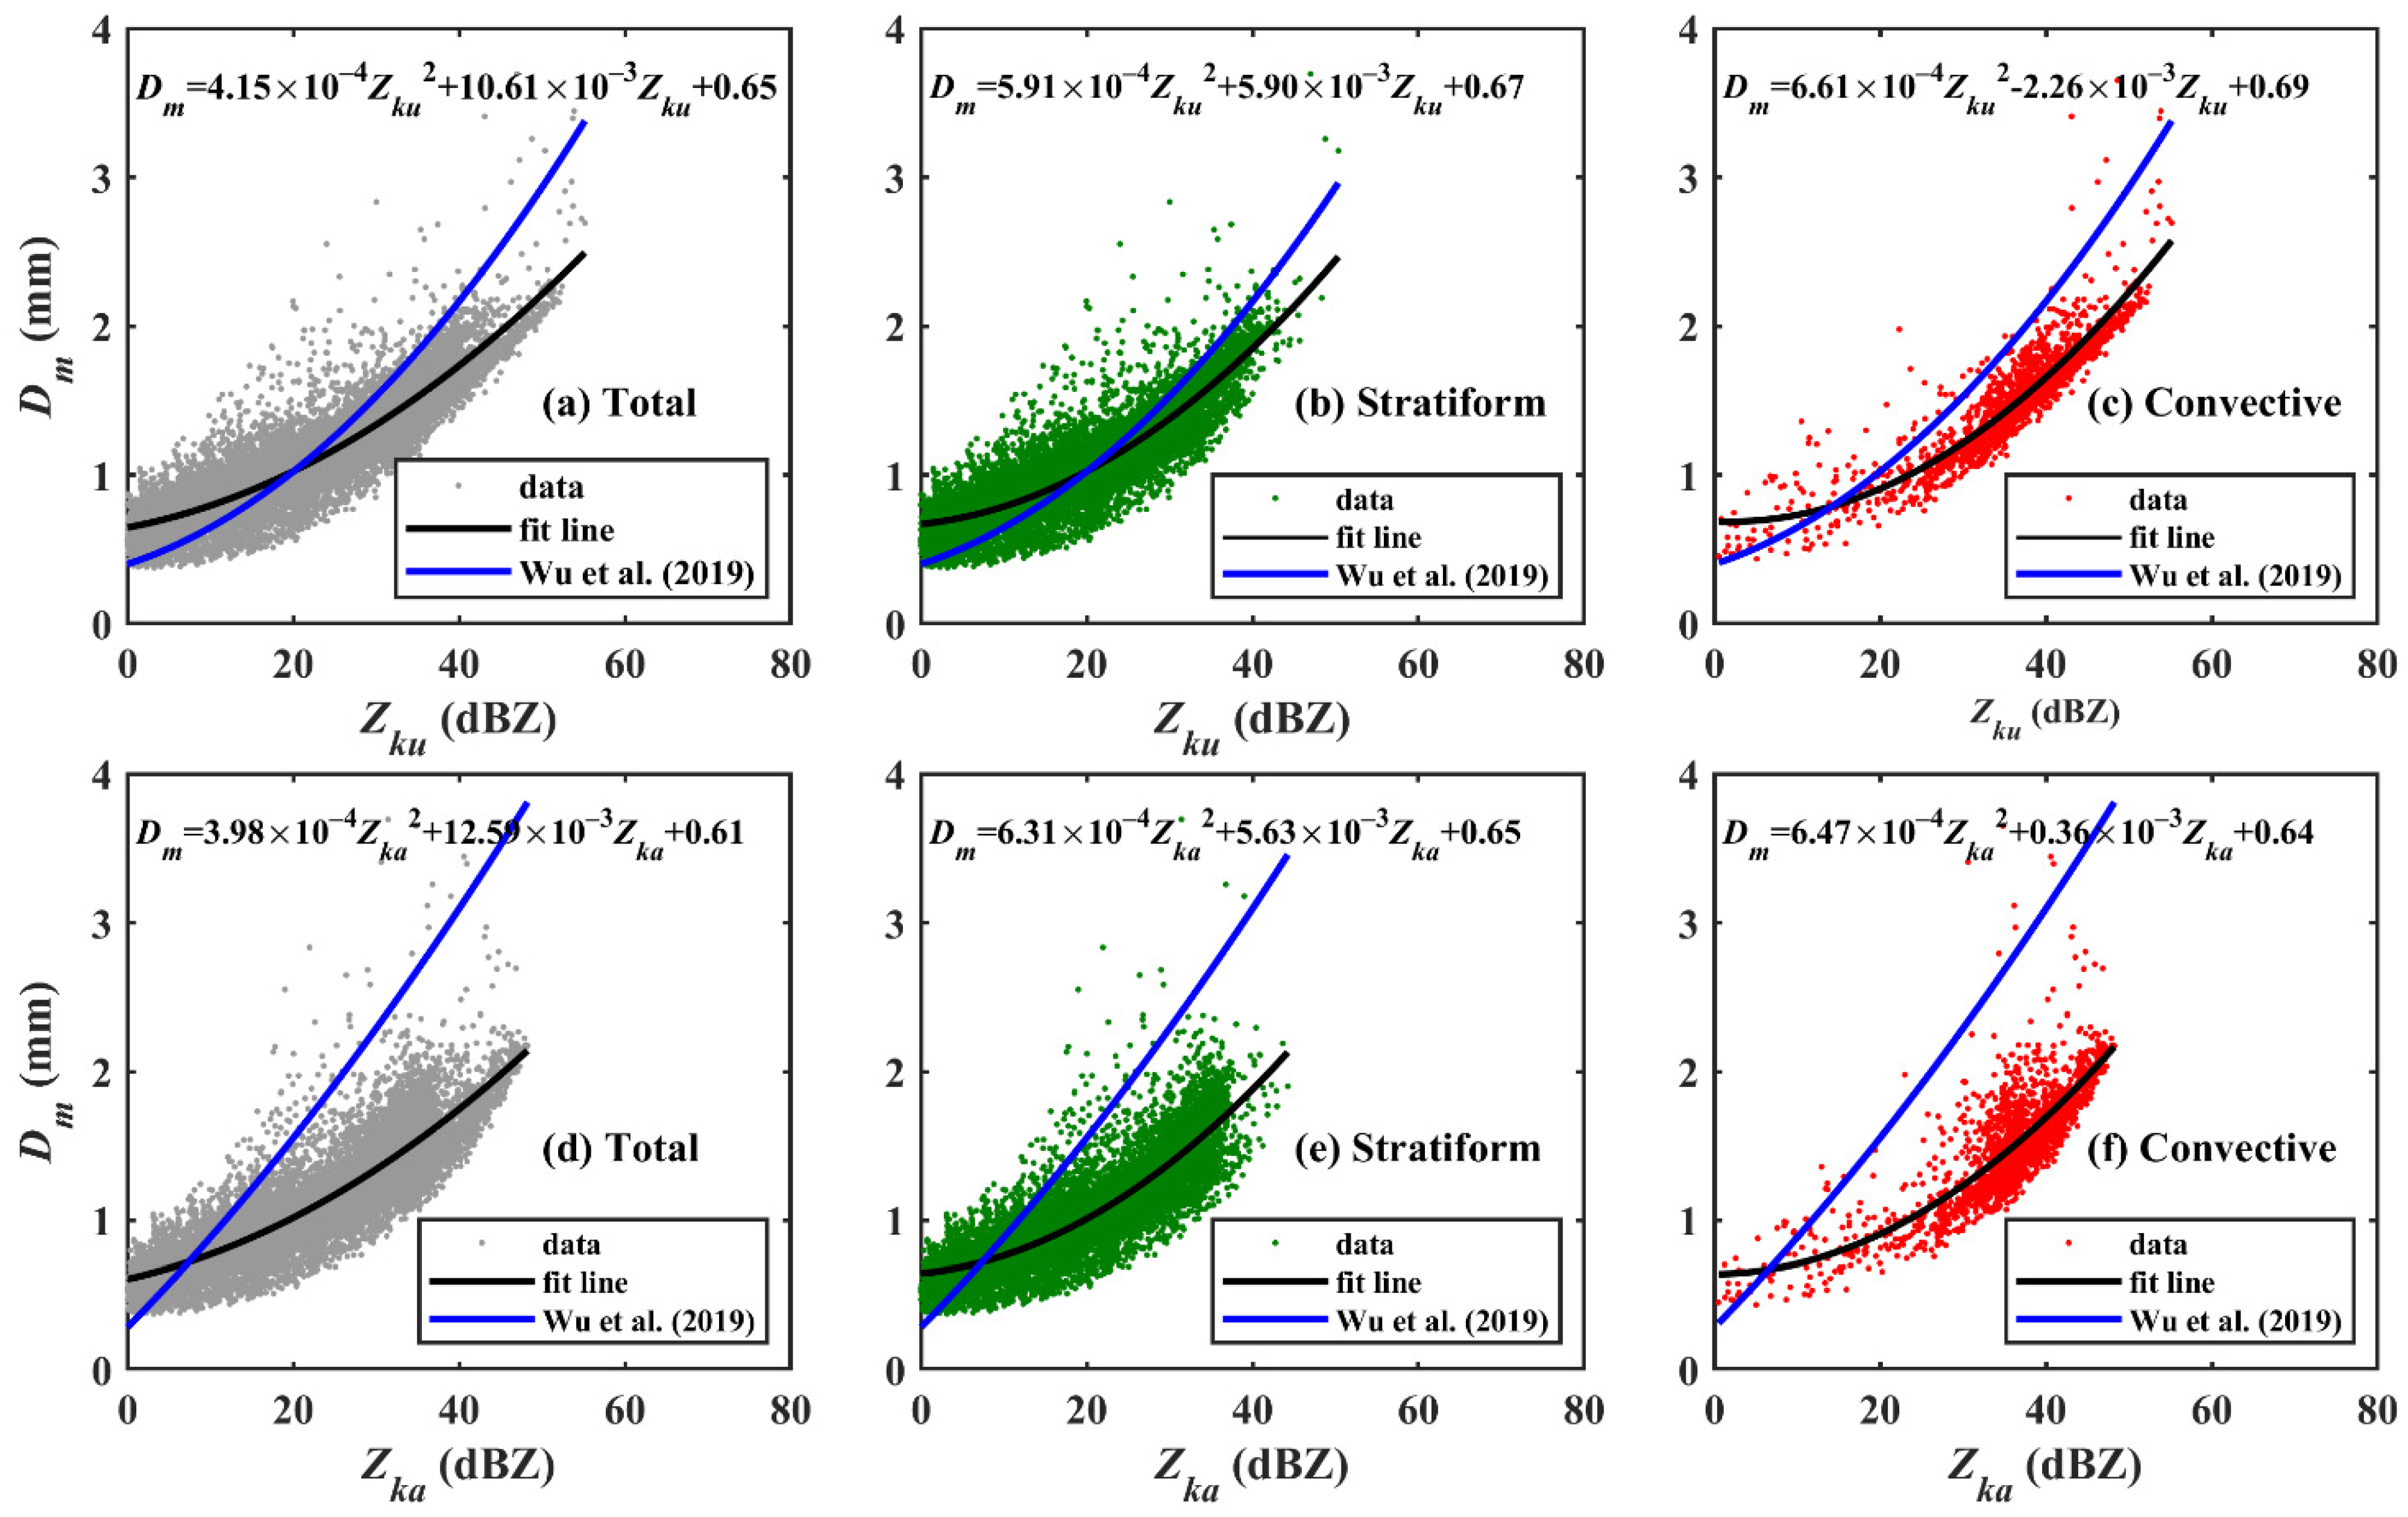
3.7. RSD Implications for Satellite Rainfall Retrievals

The scarcity of statistical individuality among three parameters of the normalized gamma distribution can lead to bias in the GPM satellite rainfall rate retrievals. To reduce this bias, [42] proposed a new framework based on Dm (the mass-weighted mean diameter) and the standard deviation of the mass spectrum (σm). They showed that the rainfall rates estimated from Dmμ constraint relations—using two independent physical attributes (Dm and normalized mass spectrum, σ′m)—produced smaller biases than assuming a constant μ [63]. Moreover, the Dmμ constraint relations derived for ice-phase particles also showed an enhanced improvement in retrieving reflectivity than the currently used algorithms in ice-phase precipitation [64]. The σmDm relations ( D m = a m σ m b m ) differ with microphysical mechanisms, and recent studies have demonstrated that these relations vary from geographical location and rain regimes, and also infer rain RSD features [12,41,60,65,66,67,68]. Figure 10 demonstrates the distribution of Dm and σm (standard deviation of the mass spectrum) for the total, stratiform, and convective precipitations of WP TCs. The scatter points in Figure 10 are the RSD samples eligible for the quality-controlled method of [42]. The 1-min RSDs should have a minimum number of 50 raindrops for a minimum of three different diameter bins, the Z (radar reflectivity) should be >10 dBZ, and the rainfall rate should be >0.1 mm h−1. Moreover, the σm values related to Dm < 0.5 mm are discarded. A total of 8185, 6449, and 1736 1-min RSDs in total, stratiform, and convective precipitations were qualified for the above-mentioned conditions.
The fitting performed for the data points resulted in σmDm relations as given below:
σm = 0.294 Dm1.122 (total)
σm = 0.293 Dm1.223 (stratiform)
σm = 0.292 Dm1.018 (convective)
Comparable to the findings of previous studies, a higher correlation between σm and Dm can be seen for the total, stratiform, and convective precipitations of the WP TCs [42,68]. Using eight years of in-situ shipboard global ocean RSD, ref. [68] evaluated the σmDm relations for seven latitude bands, and computed σmDm relation for the Northern Tropics (0°N to 22.5°N) is σm = 0.313 Dm1.438.
Figure 11, Figure 12 and Figure 13 illustrate the mapping of (Dm, μo) space from (σm, Dm) space for total, stratiform, and convective precipitations of WP TCs, respectively. The occurrence frequency of σm with Dm for total, stratiform, and convective precipitations are depicted, in Figure 11a, Figure 12a and Figure 13a, respectively, and the normalized PDF of the mass spectrum (σm) are given in Figure 11b, Figure 12b and Figure 13b. The normalized mass spectrum, σ′m, a statistically independent attribute from Dm [42,67], is computed for total (σ′m = σm/Dm1.122), stratiform (σ′m = σm/Dm1.223), and convective (σ′m = σm/Dm1.018) precipitations, and are plotted in Figure 11c, Figure 12c and Figure 13c with the two-dimensional frequency of occurrence. The normalized mass spectrum mean ( σ m ¯ ) and standard deviation (std(σ′m)) values were 0.2912 and 0.0653 for the total precipitation of the WP TCs. The mean and standard deviations of the normalized mass spectrum were 0.2902 (0.2918) and 0.0649 (0.0605) for stratiform (convective) precipitation. The solid black line in Figure 11a, Figure 12a and Figure 13a, represents the total, stratiform, and convective σmDm relations (Equations (15)–(17)), respectively, and the solid red and blue lines denote the upper (Equations (21), (23), and (25)) and lower (Equations (22), (24), and (26)) σ′m bounds. The σ′m mean value for total, stratiform, and convective precipitation is represented with a black dash–dotted line, in Figure 11c,d, Figure 12c,d and Figure 13c,d, respectively.
The upper ( σ m ¯ + std(σ′m) = 0.3565, 0.3551, and 0.3523, for total, stratiform, and convective rainfall, respectively) and lower bounds ( σ m ¯ − std(σ′m) = 0.2258, 0.2254, and 0.2313, for total, stratiform, and convective rainfall, respectively) of σ′m are depicted with red and blue dash–dotted lines in Figure 11c,d, Figure 12c,d and Figure 13c,d, for total, stratiform, and convective rainfall, respectively. These bounds cover 73.19%, 73.87%, and 74.25% of σ′m data points, for total, stratiform, and convective rainfall, respectively.
The expected value of σm for total, stratiform, and convective rainfall are:
σ m e x p e c t e d   v a l u e = σ m ¯ D m b m = 0.2912   D m 1.122   ( total ) ;
σ m e x p e c t e d   v a l u e = σ m ¯ D m b m = 0.2902   D m 1.297   ( stratiform ) ;
σ m e x p e c t e d   v a l u e = σ m ¯ D m b m = 0.2918   D m 1.018   ( convective ) .
The upper and lower bounds of σm for total, stratiform and convective rainfall are:
σ m u p p e r _ b o u n d = [ σ m ¯ + std ( σ m ) ]   D m b m = 0.3565   D m 1.122   ( total ) ;
σ m l o w e r _ b o u n d = [ σ m ¯ std ( σ m ) ]   D m b m = 0.2258   D m 1.122   ( total ) ;
σ m u p p e r _ b o u n d = [ σ m ¯ + std ( σ m ) ]   D m b m = 0.3551   D m 1.297   ( stratiform ) ;
σ m l o w e r _ b o u n d = [ σ m ¯ std ( σ m ) ]   D m b m = 0.2254   D m 1.297   ( stratiform ) ;
σ m u p p e r _ b o u n d = [ σ m ¯ + std ( σ m ) ]   D m b m = 0.3523   D m 1.018   ( convective ) ;
σ m l o w e r _ b o u n d = [ σ m ¯ std ( σ m ) ]   D m b m = 0.2313   D m 1.018   ( convective ) .
The σ m   and Dm assessments of WP TCs were transformed into μo estimates using below-mentioned equations, and are depicted in Figure 11e, Figure 12e and Figure 13e. The μo PDF distributions and the normalized Gaussian curve with its mean (black dash–dotted line), mean plus standard deviation (red dash–dotted line), and mean minus standard deviation (blue dash–dotted line) values are illustrated in Figure 11f, Figure 12f and Figure 13f, for total, stratiform and convective rainfall, respectively.
μ o = D m 2 2 b m σ m 2 4 = 11.7928   D m 0.244 4   ( total )
μ o = D m 2 2 b m σ m 2 4 = 11.8742   D m 0.594 4   ( stratiform )
μ o = D m 2 2 b m σ m 2 4 = 11.7444   D m 0.036 4   ( convective )
The expected value of μo with the lower and upper bounds for total, stratiform, and convective rainfall was evaluated with the above equation and is shown in Figure 11e, Figure 12e and Figure 13e with black, blue, and red solid lines, respectively.
In the GPM DPR rain-retrieval algorithms, the radar reflectivity at Ka- and Ku-bands (ZKa and ZKu) and the difference between these two radar reflectivities, known as differential frequency ratio (DFR = 10log10ZKu-10log10ZKa, in dB), are used to retrieve the RSD parameters (Dm and log10Nw). While estimating Dm values from DFR, previous studies noticed two Dm values for a given negative DFR value, called a dual-value problem, which arises due to the predominance of Rayleigh scattering in light rain at Ku- and Ka-band reflectivities [69,70]. Consistent with the previous studies, we also noticed a double solution problem (figure not shown); hence, rather than relating the Dm values to the DFR, empirical relations between Dm and ZKu/ZKa are derived. The T-matrix simulations with 25 °C temperature were applied to the disdrometer data to obtain the radar reflectivity at Ku- and Ka-bands for the WP TCs [71].
Figure 14 depicts the scatter plots of Dm versus ZKa/ZKu for total, stratiform, and convective rainfall of WP TCs. With the increase in reflectivity at Ku/Ka-band frequency, the Dm values increased in WP TC rainfall. The second-degree polynomial fit lines and the corresponding DmZku and DmZka relations are also depicted in the figure. Along with the present study polynomial fit lines, DmZku/Zka relations derived for the Southwestern Pacific summer season rainfall from [13] are also depicted in the figure. For a given radar reflectivity, especially for reflectivity values greater than 20 dBZ, WP TCs measured in the present study showed lower Dm values than the oceanic summer season rainfall.

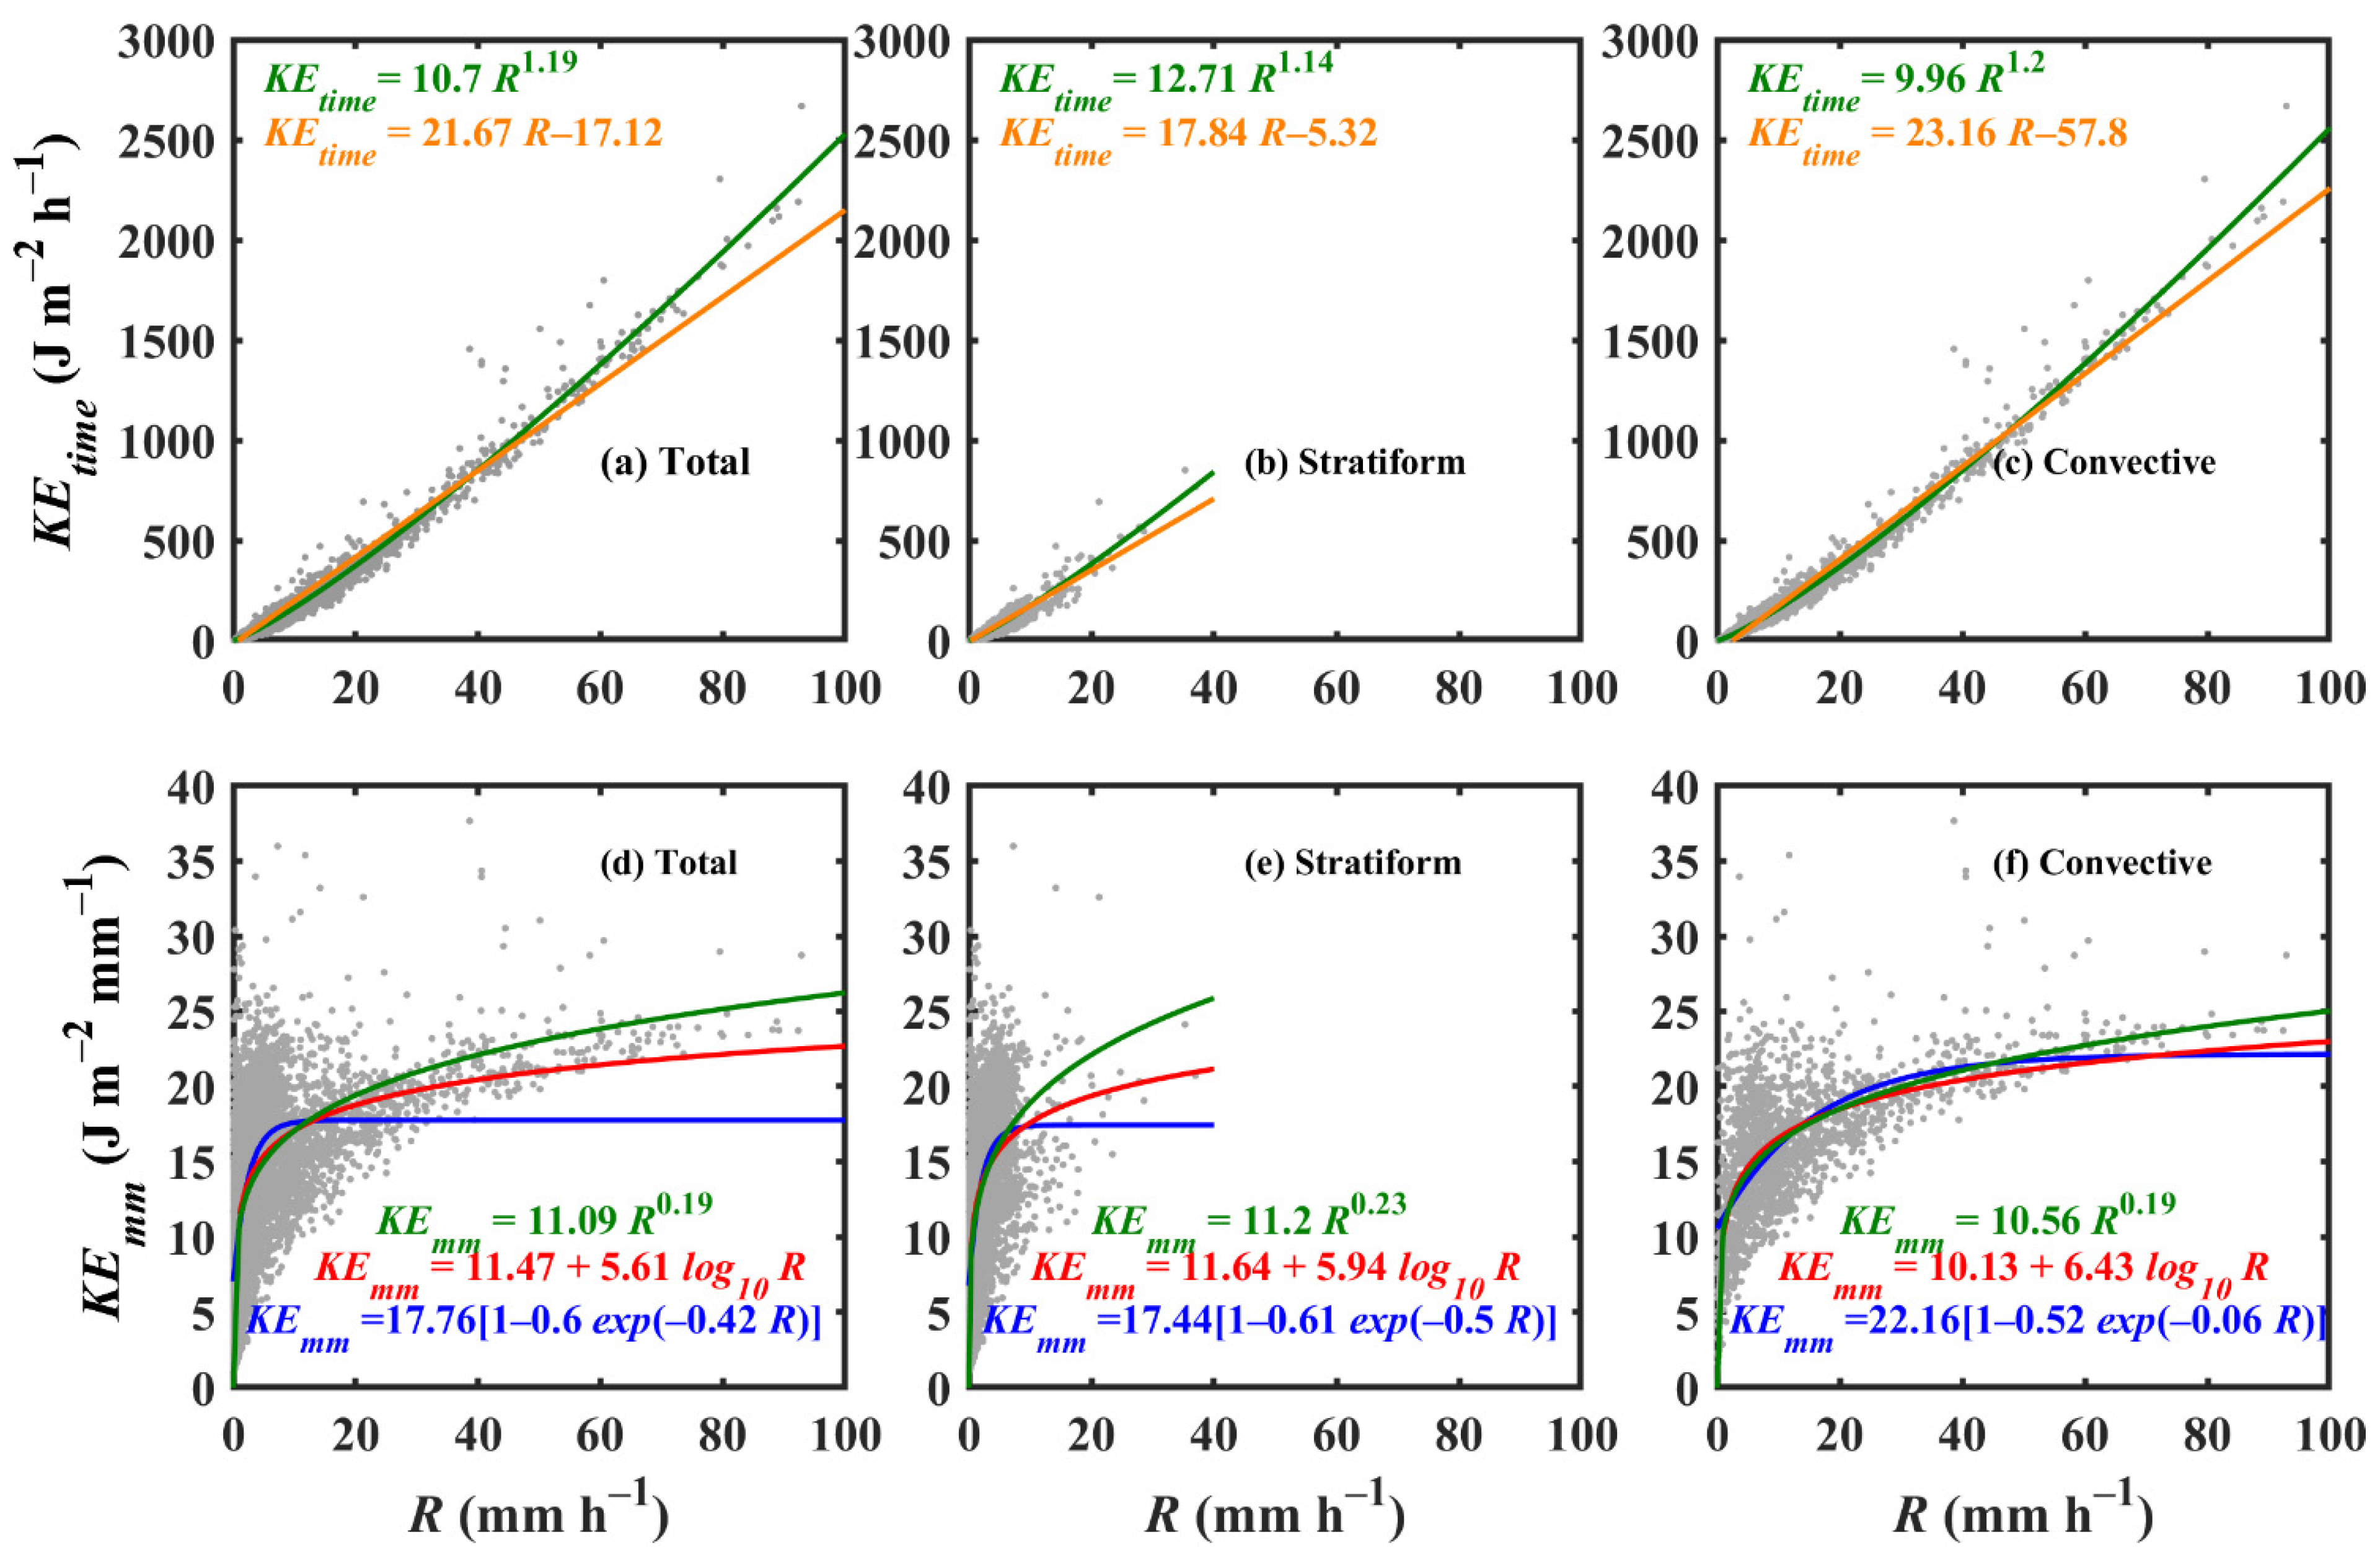
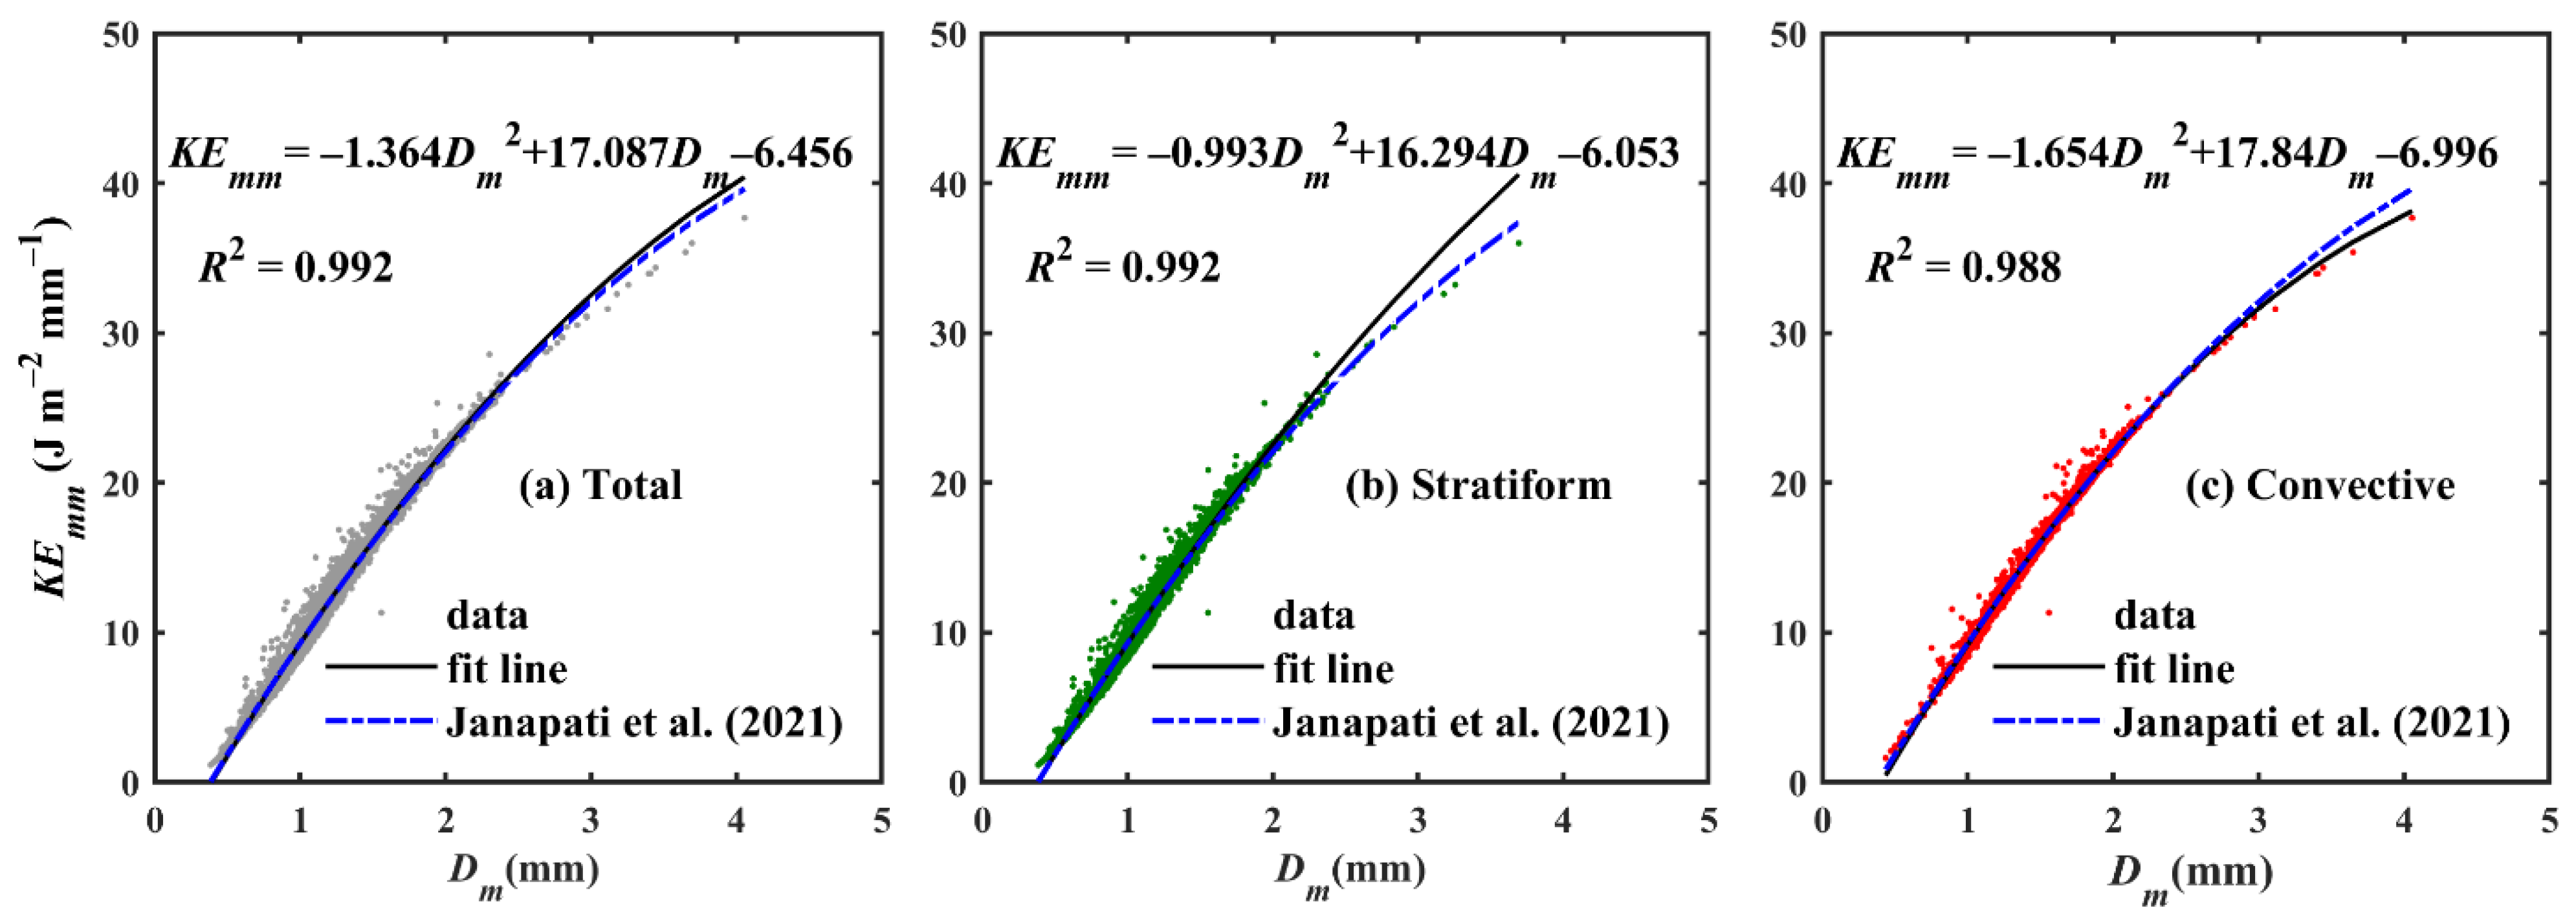
3.8. RSD Implications for Rainfall Kinetic Energy Retrievals

The energy with which the raindrops from the cloud base reach the ground surface is called the kinetic energy (KE) of rain or rainfall KE. The rainfall KE plays a crucial role in estimating the rainfall erosivity factor of the universal soil loss equation, a physical parameter that describes surface erosion caused by rainfall [2,72,73,74]. Due to the expensive experimental setup required for the direct measurement of rainfall KE, indirect measurements such as the utilization of RSD information from the ground-based disdrometers have been adopted globally [2,26,75,76,77,78].
The rainfall KE can be estimated using raindrop size and velocity information. Relating the rainfall KE with the rainfall rate can provide the opportunity to estimate the KE at places with rain gauges and lack of disdrometer measurements. Figure 15 displays the distribution of rainfall KE with the rainfall rate for total, stratiform, and convective rainfall. From the figure, it is apparent that the KEtime increases with the increase in rainfall rate, whereas the KEmm showed a steep increase for the rainfall rate less than 20 mm h1, and above 20 mm h1, a flat increase can be seen. The linear, power, logarithmic, and exponential forms of rainfall KE are provided in Figure 15, and their statistical values are given in Table 1.
The GPM DPR offers the RSD parameters (Dm and log10Nw) of given precipitation globally with the dual-polarization capability. The empirical relationship between the rainfall KE and RSD parameters (Dm and log10Nw) can aid in evaluating the rainfall KE using GPM DPR at the places where disdrometers and rain gauges are scarce. Previous researchers reported a reasonable agreement between the rainfall/RSD parameters of GPM DPR and the ground-based disdrometer. For instance, [66] compared the seasonal RSD of PARSIVEL disdrometer with the GPM DPR data products over eastern China, and they reported better agreement for the winter rainfall. A reasonable agreement was reported for the indirect comparison of GPM DPR Dm and log10Nw values with worldwide disdrometer measurements [79].
Recently, a good agreement between RSD parameters (R and Dm) of ground-based disdrometers in Italy and the GPM DPR was reported by [80]. The studies mentioned above have evidently proven the reliability of GPM DPR rain/RSD parameters for hydro-meteorological applications; hence, we can use the Dm values from GPM DPR to estimate the rainfall KE using the empirical relation between Dm and KE. Figure 16 illustrates the distributions of srainfall KE with the mass-weighted mean diameter values for total, stratiform, and convective precipitation.
The figure shows that the KEmm is highly correlated with the Dm for the WP TCs rainfall with little spread from the respective fit lines. Second-degree polynomial relations computed for KEmm and Dm are depicted in the respective panels, and their statistical values are given in Table 1. Along with the present TCs fit lines, the KEmmDm relation of WP TCs measured in Taiwan by [3] is portrayed in Figure 16. It is evident that the KEmmDm relations of the WP TCs measured in Palau and Taiwan islands showed minor variations, which can be attributed to no variation in the RSDs of WP TCs measured at these two islands, as pointed out in Section 3.2.

4. Summary and Conclusions

In this study, the raindrop size distribution (RSD) statistical characteristics of fourteen tropical cyclones (TCs) were investigated using Joss–Waldvogel disdrometer (JWD) measurements conducted at an oceanic site in the Palau islands in the Western Pacific (WP). The WP TCs Do and log10Nw distribution diagram displayed that the mean Do and log10Nw values were located below (above) the [46] rain classification line for rainfall rates of less than (greater than) 10 mm h−1. The WP TCs RSDs revealed distinct segregation between stratiform and convective types, and the convective RSDs of the considered TCs presented similar features to the maritime convective clusters. The contribution of small-size drops (<1 mm) to number concentration (Nt)/rainfall rate (R) was predominant in the stratiform precipitation than the convective type, and an opposite characteristic is recognized for the raindrops of diameter greater than 1 mm.
For a given type of disdrometer (JWD), average Dm values of WP TCs measured at Palau islands showed minor variations with Japan and Taiwan. Regardless of measurements from different disdrometer types, the WP TCs in Palau inferred nearly identical μΛ relations with the WP TCs measured in Taiwan and coastal China; however, these relations were different from the WP TCs measured over inland. In addition, an identical exponent value of the ZR relations (b = 1.35 in Z = ARb) observed in Taiwan and the Palau islands inferred that the WP TCs of these two islands were related with identical microphysical processes.
The Z–R, μ–Λ, DmR, NwR, σmDm, and μoDm relations of the WP TCs measured in the Palau islands showed an inequality between stratiform and convective precipitation. The present study offered unique RSD characteristics of WP TCs measured at an oceanic site in the Palau islands, and these results can deliver possible implications for rain retrieval algorithms. For instance, evaluated RSD relations (σmDm, μoDm, DmZku, and DmZka) can aid in optimizing the constraints associated with the global precipitation measurement (GPM) dual-precipitation radar (DPR) rain retrieval algorithms. In addition to the implications of the rain retrieval algorithms, the proposed rainfall kinetic relations (KEtimeR, KEmmR, and KEmmDm) can be used to estimate the rainfall kinetic energy of WP TCs using rain gauge and remote sensing (GPM DPR) measurements, and the obtained rainfall KE can offer a better appraisal of rainfall erosivity, an essential parameter used in the soil erosion modeling.

Author Contributions

Conceptualization, B.K.S., J.J. and P.-L.L.; data curation, R.S. and K.K.R.; formal analysis, B.K.S. and J.J.; funding acquisition, P.-L.L.; investigation, B.K.S. and J.J.; methodology, B.K.S. and J.J.; project administration, P.-L.L.; resources, R.S. and P.-L.L.; software, P.-L.L.; supervision, P.-L.L., R.S. and H.H.; validation, B.K.S., J.J. and C.-H.L.; visualization, B.K.S. and J.J.; writing—original draft, B.K.S. and J.J.; writing—review and editing, B.K.S., J.J., P.-L.L., R.S. and H.H. All authors have read and agreed to the published version of the manuscript.

Funding

We greatly acknowledge the Ministry of Science and Technology (MOST), Taiwan, for providing grants to carry out this research work under the grant numbers: MOST 104-2923-M-008-003, MOST 109-2111-M-008-017, MOST 109-2625-M-008-014, MOST 109-2811-M-008-555, MOST 109-2811-M-008-563, MOST 110-2625-M008-006, MOST 110-2111-M-008-021, MOST 110-2811-M-008-566, MOST 110-2811-M-008-580.

Institutional Review Board Statement

Not applicable.

Informed Consent Statement

Not applicable.

Data Availability Statement

The disdrometer data was provided by JAMSTEC, Japan.

Acknowledgments

This research was supported by the Ministry of Science and Technology (grant nos. MOST 104-2923-M-008-003, MOST 109-2111-M-008-017, MOST 109-2625-M-008-014, MOST 110-2625-M008-006, MOST 110-2111-M-008-021). It was partially supported by the Earthquake-Disaster and Risk Evaluation and Management Center, E-DREaM, from the Featured Areas Research Center Program within the Higher Education Sprout Project framework by the Ministry of Education (MOE) in Taiwan. The first author, B.K.S., acknowledges the Ministry of Science and Technology (MOST) for providing the fellowship under the grant numbers: MOST 108-2625-M-008-011, MOST 108-2811-M-008-595, and MOST 109-2811-M-008-563, MOST 110-2811-M-008-580. The second author J.J., carried out this research work under the grant number MOST 109-2811-M-008-555 and MOST 110-2811-M-008-566.

Conflicts of Interest

The authors declare no conflict of interest.

References

  1. Rosenfeld, D.; Ulbrich, C.W. Cloud microphysical properties, processes, and rainfall estimation opportunities. In Radar and Atmospheric Science: A Collection of Essays in Honor of David Atlas. Meteorological Monographs; American Meteorological Society: Boston, MA, USA, 2003; Volume 52, pp. 237–258. [Google Scholar] [CrossRef]
  2. Janapati, J.; Seela, B.K.; Lin, P.-L.; Wang, P.K.; Kumar, U. An assessment of tropical cyclones rainfall erosivity for Taiwan. Sci. Rep. 2019, 9, 15862. [Google Scholar] [CrossRef] [PubMed] [Green Version]
  3. Janapati, J.; Seela, B.K.; Lin, P.-L.; Lee, M.-T.; Joseph, E. Microphysical features of typhoon and non-typhoon rainfall observed in Taiwan, an island in the northwestern Pacific. Hydrol. Earth Syst. Sci. 2021, 25, 4025–4040. [Google Scholar] [CrossRef]
  4. Liao, L.; Meneghini, R. Physical Evaluation of GPM DPR Single- and Dual-Wavelength Algorithms. J. Atmos. Ocean. Technol. 2019, 36, 883–902. [Google Scholar] [CrossRef]
  5. Liao, L.; Meneghini, R.; Iguchi, T.; Tokay, A. Characteristics of DSD Bulk Parameters: Implication for Radar Rain Retrieval. Atmosphere 2020, 11, 670. [Google Scholar] [CrossRef]
  6. McFarquhar, G.; Hsieh, T.-L.; Freer, M.; Mascio, J.; Jewett, B.F. The Characterization of Ice Hydrometeor Gamma Size Distributions as Volumes in N0–λ–μ Phase Space: Implications for Microphysical Process Modeling. J. Atmos. Sci. 2015, 72, 892–909. [Google Scholar] [CrossRef]
  7. Tokay, A.; Bashor, P.G.; Habib, E.; Kasparis, T. Raindrop Size Distribution Measurements in Tropical Cyclones. Mon. Weather Rev. 2008, 136, 1669–1685. [Google Scholar] [CrossRef] [Green Version]
  8. Chen, Y.; Duan, J.; An, J.; Liu, H. Raindrop Size Distribution Characteristics for Tropical Cyclones and Meiyu-Baiu Fronts Impacting Tokyo, Japan. Atmosphere 2019, 10, 391. [Google Scholar] [CrossRef] [Green Version]
  9. Tokay, A.; Short, D.A. Evidence from Tropical Raindrop Spectra of the Origin of Rain from Stratiform versus Convective Clouds. J. Appl. Meteorol. 1996, 35, 355–371. [Google Scholar] [CrossRef] [Green Version]
  10. Bringi, V.N.; Chandrasekar, V.; Hubbert, J.; Gorgucci, E.; Randeu, W.L.; Schoenhuber, M. Raindrop Size Distribution in Different Climatic Regimes from Disdrometer and Dual-Polarized Radar Analysis. J. Atmos. Sci. 2003, 60, 354–365. [Google Scholar] [CrossRef]
  11. Seela, B.K.; Janapati, J.; Lin, P.-L.; Wang, P.K.; Lee, M.-T. Raindrop Size Distribution Characteristics of Summer and Winter Season Rainfall over North Taiwan. J. Geophys. Res. Atmos. 2018, 123, 11602–11624. [Google Scholar] [CrossRef] [Green Version]
  12. Janapati, J.; Seela, B.K.; Lin, P.-L.; Wang, P.K.; Tseng, C.-H.; Reddy, K.K.; Hashiguchi, H.; Feng, L.; Das, S.K.; Unnikrishnan, C.K. Raindrop Size Distribution Characteristics of Indian and Pacific Ocean Tropical Cyclones Observed at India and Taiwan Sites. J. Meteorol. Soc. Jpn. 2020, 98, 299–317. [Google Scholar] [CrossRef] [Green Version]
  13. Wu, Z.; Zhang, Y.; Zhang, L.; Lei, H.; Xie, Y.; Wen, L.; Yang, J. Characteristics of summer season raindrop size distri-bution in three typical regions of western Pacific. J. Geophys. Res. Atmos. 2019, 124, 4054–4073. [Google Scholar] [CrossRef] [Green Version]
  14. Chen, B.; Yang, J.; Pu, J. Statistical Characteristics of Raindrop Size Distribution in the Meiyu Season Observed in Eastern China. J. Meteorol. Soc. Jpn. Ser. II 2013, 91, 215–227. [Google Scholar] [CrossRef] [Green Version]
  15. Wu, D.; Zhang, F.; Chen, X.; Ryzhkov, A.; Zhao, K.; Kumjian, M.R.; Chen, X.; Chan, P.-W. Evaluation of Microphysics Schemes in Tropical Cyclones Using Polarimetric Radar Observations: Convective Precipitation in an Outer Rainband. Mon. Weather Rev. 2021, 149, 1055–1068. [Google Scholar] [CrossRef]
  16. Chang, W.-Y.; Wang, T.-C.C.; Lin, P.-L. Characteristics of the Raindrop Size Distribution and Drop Shape Relation in Typhoon Systems in the Western Pacific from the 2D Video Disdrometer and NCU C-Band Polarimetric Radar. J. Atmos. Ocean. Technol. 2009, 26, 1973–1993. [Google Scholar] [CrossRef]
  17. Xia, Q.; Zhang, W.; Chen, H.; Lee, W.-C.; Han, L.; Ma, Y.; Liu, X. Quantification of Precipitation Using Polarimetric Radar Measurements during Several Typhoon Events in Southern China. Remote Sens. 2020, 12, 2058. [Google Scholar] [CrossRef]
  18. Zhang, Y.; Liu, L.; Bi, S.; Wu, Z.; Shen, P.; Ao, Z.; Chen, C.; Zhang, Y. Analysis of Dual-Polarimetric Radar Variables and Quantitative Precipitation Estimators for Landfall Typhoons and Squall Lines Based on Disdrometer Data in Southern China. Atmosphere 2019, 10, 30. [Google Scholar] [CrossRef] [Green Version]
  19. Kumar, S.; Reddy, K. Rain drop size distribution characteristics of cyclonic and north east monsoon thunderstorm precipitating clouds observed over Kadapa (14.47° N, 78.82° E), Tropical semi-arid region of India. MAUSAM 2022, 64, 35–48. [Google Scholar] [CrossRef]
  20. Kumari, N.; Kumar, S.B.; Jayalakshmi, J.; Reddy, K.K. Raindrop size distribution variations in JAL and NILAM cyclones induced precipitation observed over Kadapa (14.47° N, 78.82° E), a tropical semi-arid region of India. Indian J. Radio Space Phys. 2014, 43, 57–66. [Google Scholar]
  21. Janapati, J.; Seela, B.K.; Reddy, M.V.; Reddy, K.K.; Lin, P.-L.; Rao, T.N.; Liu, C.-Y. A study on raindrop size distribution variability in before and after landfall precipitations of tropical cyclones observed over southern India. J. Atmos. Solar-Terr. Phys. 2017, 159, 23–40. [Google Scholar] [CrossRef]
  22. Lee, M.-T.; Lin, P.-L.; Chang, W.-Y.; Seela, B.K.; Janapati, J. Microphysical characteristics and types of precipitation for different seasons over North Taiwan. J. Meteorol. Soc. Jpn. Ser. II 2019, 97, 841–865. [Google Scholar] [CrossRef] [Green Version]
  23. Hopper, J.L.J.; Schumacher, C.; Humes, K.; Funk, A. Drop-Size Distribution Variations Associated with Different Storm Types in Southeast Texas. Atmosphere 2019, 11, 8. [Google Scholar] [CrossRef] [Green Version]
  24. Suh, S.-H.; You, C.-H.; Lee, D.-I. Climatological characteristics of raindrop size distributions in Busan, Republic of Korea. Hydrol. Earth Syst. Sci. 2016, 20, 193–207. [Google Scholar] [CrossRef] [Green Version]
  25. Chakravarty, K.; Arun, N.; Yadav, P.; Bhangale, R.; Murugavel, P.; Kanawade, V.P.; Mohmmad, J.; Hosalikar, K.; Pandithurai, G. Characteristics of precipitation microphysics during Tropical Cyclone Nisarga (2020) as observed over the orographic region of Western Ghats in the Indian sub-continent. Atmos. Res. 2021, 264, 105861. [Google Scholar] [CrossRef]
  26. Seela, B.K.; Janapati, J.; Unnikrishnan, C.K.; Lin, P.-L.; Le Loh, J.; Chang, W.-Y.; Kumar, U.; Reddy, K.K.; Lee, D.-I.; Reddy, M.V. Raindrop Size Distributions of North Indian Ocean Tropical Cyclones Observed at the Coastal and Inland Stations in South India. Remote Sens. 2021, 13, 3178. [Google Scholar] [CrossRef]
  27. Khouakhi, A.; Villarini, G.; Vecchi, G. Contribution of Tropical Cyclones to Rainfall at the Global Scale. J. Clim. 2017, 30, 359–372. [Google Scholar] [CrossRef]
  28. Feng, L.; Liu, X.; Xiao, H.; Xiao, L.; Xia, F.; Hao, X.; Lu, H.; Zhang, C. Characteristics of Raindrop Size Distribution in Typhoon Nida (2016) before and after Landfall in Southern China from 2D Video Disdrometer Data. Adv. Meteorol. 2021, 2021, 1–14. [Google Scholar] [CrossRef]
  29. Wen, L.; Zhao, K.; Chen, G.; Wang, M.; Zhou, B.; Huang, H.; Hu, D.; Lee, W.-C.; Hu, H. Drop Size Distribution Characteristics of Seven Typhoons in China. J. Geophys. Res. Atmos. 2018, 123, 6529–6548. [Google Scholar] [CrossRef]
  30. Chen, B.-J.; Wang, Y.; Ming, J. Microphysical characteristics of the raindrop size distribution in Typhoon Morakot (2009). J. Trop. Meteorol. 2012, 18, 162–171. [Google Scholar]
  31. Bao, X.; Wu, L.; Tang, B.; Ma, L.; Wu, D.; Tang, J.; Chen, H.; Wu, L. Variable Raindrop Size Distributions in Different Rainbands Associated With Typhoon Fitow (2013). J. Geophys. Res. Atmos. 2019, 124, 12262–12281. [Google Scholar] [CrossRef]
  32. Bao, X.; Wu, L.; Zhang, S.; Yuan, H.; Wang, H. A Comparison of Convective Raindrop Size Distributions in the Eyewall and Spiral Rainbands of Typhoon Lekima (2019). Geophys. Res. Lett. 2020, 47, e2020GL090729. [Google Scholar] [CrossRef]
  33. Feng, L.; Hu, S.; Liu, X.; Xiao, H.; Pan, X.; Xia, F.; Ou, G.; Zhang, C. Precipitation Microphysical Characteristics of Typhoon Mangkhut in Southern China Using 2D Video Disdrometers. Atmosphere 2020, 11, 975. [Google Scholar] [CrossRef]
  34. Krishna, U.M.; Reddy, K.K.; Seela, B.K.; Shirooka, R.; Lin, P.-L.; Pan, C.-J. Raindrop size distribution of easterly and westerly monsoon precipitation observed over Palau islands in the Western Pacific Ocean. Atmos. Res. 2016, 174–175, 41–51. [Google Scholar] [CrossRef]
  35. Seela, B.K.; Janapati, J.; Lin, P.-L.; Reddy, K.K.; Shirooka, R.; Wang, P.K. A Comparison Study of Summer Season Raindrop Size Distribution Between Palau and Taiwan, Two Islands in Western Pacific. J. Geophys. Res. Atmos. 2017, 122, 11787–11805. [Google Scholar] [CrossRef]
  36. Protat, A.; Klepp, C.; Louf, V.; Petersen, W.A.; Alexander, S.P.; Barros, A.; Leinonen, J.; Mace, G.G. The Latitudinal Variability of Oceanic Rainfall Properties and Its Implication for Satellite Retrievals: 1. Drop Size Distribution Properties. J. Geophys. Res. Atmos. 2019, 124, 13291–13311. [Google Scholar] [CrossRef]
  37. Ushiyama, T.; Reddy, K.K.; Kubota, H.; Yasunaga, K.; Shirooka, R. Diurnal to interannual variation in the raindrop size distribution over Palau in the western tropical Pacific. Geophys. Res. Lett. 2009, 36. [Google Scholar] [CrossRef]
  38. Joss, J.; Waldvogel, A. Raindrop Size Distribution and Sampling Size Errors. J. Atmos. Sci. 1969, 26, 566–569. [Google Scholar] [CrossRef] [Green Version]
  39. Gunn, R.; Kinzer, G.D. The Terminal Velocity of Fall for Water Droplets in Stagnant Air. J. Meteorol. 1949, 6, 243–248. [Google Scholar] [CrossRef] [Green Version]
  40. Ulbrich, C.W. Natural Variations in the Analytical Form of the Raindrop Size Distribution. J. Clim. Appl. Meteorol. 1983, 22, 1764–1775. [Google Scholar] [CrossRef] [Green Version]
  41. Thurai, M.; Williams, C.; Bringi, V. Examining the correlations between drop size distribution parameters using data from two side-by-side 2D-video disdrometers. Atmos. Res. 2014, 144, 95–110. [Google Scholar] [CrossRef]
  42. Williams, C.; Bringi, V.N.; Carey, L.D.; Chandrasekar, V.; Gatlin, P.; Haddad, Z.S.; Meneghini, R.; Munchak, S.J.; Nesbitt, S.; Petersen, W.A.; et al. Describing the Shape of Raindrop Size Distributions Using Uncorrelated Raindrop Mass Spectrum Parameters. J. Appl. Meteorol. Clim. 2014, 53, 1282–1296. [Google Scholar] [CrossRef]
  43. Fornis, R.L.; Vermeulen, H.R.; Nieuwenhuis, J.D. Kinetic energy–rainfall intensity relationship for Central Cebu, Philippines for soil erosion studies. J. Hydrol. 2005, 300, 20–32. [Google Scholar] [CrossRef]
  44. Salles, C.; Poesen, J.; Sempere-Torres, D. Kinetic energy of rain and its functional relationship with intensity. J. Hydrol. 2002, 257, 256–270. [Google Scholar] [CrossRef]
  45. Van Dijk, A.I.J.M.; Bruijnzeel, L.A.; Rosewell, C.J. Rainfall intensity–kinetic energy relationships: A critical literature appraisal. J. Hydrol. 2002, 261, 1–23. [Google Scholar] [CrossRef]
  46. Bringi, V.N.; Williams, C.; Thurai, M.; May, P.T. Using Dual-Polarized Radar and Dual-Frequency Profiler for DSD Characterization: A Case Study from Darwin, Australia. J. Atmos. Ocean. Technol. 2009, 26, 2107–2122. [Google Scholar] [CrossRef]
  47. Thompson, E.J.; Rutledge, S.A.; Dolan, B.; Thurai, M. Drop Size Distributions and Radar Observations of Convective and Stratiform Rain over the Equatorial Indian and West Pacific Oceans. J. Atmos. Sci. 2015, 72, 4091–4125. [Google Scholar] [CrossRef]
  48. Hu, Z.; Srivastava, R.C. Evolution of Raindrop Size Distribution by Coalescence, Breakup, and Evaporation: Theory and Observations. J. Atmos. Sci. 1995, 52, 1761–1783. [Google Scholar] [CrossRef] [Green Version]
  49. Steiner, M.; Smith, J.A.; Uijlenhoet, R. A Microphysical Interpretation of Radar Reflectivity–Rain Rate Relation-ships. J. Atmos. Sci. 2004, 61, 1114–1131. [Google Scholar] [CrossRef]
  50. Atlas, D.; Ulbrich, C.W.; Marks, F.D.; Amitai, E.; Williams, C.R. Systematic variation of drop size and radar-rainfall relations. J. Geophys. Res. Space Phys. 1999, 104, 6155–6169. [Google Scholar] [CrossRef]
  51. Atlas, D.; Williams, C.R. The Anatomy of a Continental Tropical Convective Storm. J. Atmos. Sci. 2003, 60, 3–15. [Google Scholar] [CrossRef]
  52. Ulbrich, C.W.; Lee, L.G. Rainfall Characteristics Associated with the Remnants of Tropical Storm Helene in Up-state South Carolina. Weather Forecast. 2002, 17, 1257–1267. [Google Scholar] [CrossRef]
  53. Milbrandt, J.A.; Yau, M.K. A Multimoment Bulk Microphysics Parameterization. Part IV: Sensitivity Experiments. J. Atmos. Sci. 2006, 63, 3137–3159. [Google Scholar] [CrossRef]
  54. Zhang, G.; Sun, J.; Brandes, E.A. Improving Parameterization of Rain Microphysics with Disdrometer and Radar Observations. J. Atmos. Sci. 2006, 63, 1273–1290. [Google Scholar] [CrossRef] [Green Version]
  55. Brandes, E.A.; Zhang, G.; Vivekanandan, J. An Evaluation of a Drop Distribution–Based Polarimetric Radar Rain-fall Estimator. J. Appl. Meteorol. 2003, 42, 652–660. [Google Scholar] [CrossRef]
  56. Chandrasekar, V.; Bringi, V.N. Simulation of Radar Reflectivity and Surface Measurements of Rainfall. J. Atmos. Ocean. Technol. 1987, 4, 464–478. [Google Scholar] [CrossRef] [Green Version]
  57. Zhang, G.; Vivekanandan, J.; Brandes, E.A.; Meneghini, R.; Kozu, T. The Shape–Slope Relation in Observed Gamma Raindrop Size Distributions: Statistical Error or Useful Information? J. Atmos. Ocean. Technol. 2003, 20, 1106–1119. [Google Scholar] [CrossRef] [Green Version]
  58. Zhang, G.; Vivekanandan, J.; Brandes, E. A method for estimating rain rate and drop size distribution from polarimetric radar measurements. IEEE Trans. Geosci. Remote Sens. 2001, 39, 830–841. [Google Scholar] [CrossRef] [Green Version]
  59. Brandes, E.A.; Zhang, G.; Vivekanandan, J. Comparison of Polarimetric Radar Drop Size Distribution Retrieval Algorithms. J. Atmos. Ocean. Technol. 2004, 21, 584–598. [Google Scholar] [CrossRef] [Green Version]
  60. Cao, Q.; Zhang, G.; Brandes, E.; Schuur, T.; Ryzhkov, A.; Ikeda, K. Analysis of Video Disdrometer and Polarimetric Radar Data to Characterize Rain Microphysics in Oklahoma. J. Appl. Meteorol. Clim. 2008, 47, 2238–2255. [Google Scholar] [CrossRef] [Green Version]
  61. Testud, J.; Oury, S.; Black, R.A.; Amayenc, P.; Dou, X. The Concept of “Normalized” Distribution to De-scribe Raindrop Spectra: A Tool for Cloud Physics and Cloud Remote Sensing. J. Appl. Meteorol. 2001, 40, 1118–1140. [Google Scholar] [CrossRef]
  62. Atlas, D.; Ulbrich, C.W. An Observationally Based Conceptual Model of Warm Oceanic Convective Rain in the Tropics. J. Appl. Meteorol. 2000, 39, 2165–2181. [Google Scholar] [CrossRef]
  63. Seto, S.; Iguchi, T.; Oki, T. The Basic Performance of a Precipitation Retrieval Algorithm for the Global Precipitation Measurement Mission’s Single/Dual-Frequency Radar Measurements. IEEE Trans. Geosci. Remote Sens. 2013, 51, 5239–5251. [Google Scholar] [CrossRef] [Green Version]
  64. Borque, P.; Harnos, K.J.; Nesbitt, S.W.; McFarquhar, G.M. Improved Parameterization of Ice Particle Size Distributions Using Uncorrelated Mass Spectrum Parameters: Results from GCPEx. J. Appl. Meteorol. Clim. 2019, 58, 1657–1676. [Google Scholar] [CrossRef]
  65. Thurai, M.; Gatlin, P.; Bringi, V.N.; Petersen, W.; Kennedy, P.; Notaroš, B.; Carey, L. Toward Completing the Raindrop Size Spectrum: Case Studies Involving 2D-Video Disdrometer, Droplet Spectrometer, and Polarimetric Radar Measurements. J. Appl. Meteorol. Clim. 2017, 56, 877–896. [Google Scholar] [CrossRef]
  66. Wu, Z.; Zhang, Y.; Zhang, L.; Hao, X.; Lei, H.; Zheng, H. Validation of GPM Precipitation Products by Comparison with Ground-Based Parsivel Disdrometers over Jianghuai Region. Water 2019, 11, 1260. [Google Scholar] [CrossRef] [Green Version]
  67. Haddad, Z.S.; Durden, S.L.; Im, E. Parameterizing the Raindrop Size Distribution. J. Appl. Meteorol. 1996, 35, 3–13. [Google Scholar] [CrossRef] [Green Version]
  68. Protat, A.; Klepp, C.; Louf, V.; Petersen, W.A.; Alexander, S.P.; Barros, A.; Leinonen, J.; Mace, G.G. The Latitudinal Variability of Oceanic Rainfall Properties and Its Implication for Satellite Retrievals: 2. The Relationships Between Radar Observables and Drop Size Distribution Parameters. J. Geophys. Res. Atmos. 2019, 124, 13312–13324. [Google Scholar] [CrossRef]
  69. Meagher, J.P.; Haddad, Z.S. To What Extent Can Raindrop Size Be Determined by a Multiple-Frequency Radar? J. Appl. Meteorol. Clim. 2006, 45, 529–536. [Google Scholar] [CrossRef] [Green Version]
  70. Liao, L.; Meneghini, R. A study of air/space-borne dual-wavelength radar for estimation of rain profiles. Adv. Atmos. Sci. 2005, 22, 841–851. [Google Scholar] [CrossRef]
  71. Brandes, E.A.; Zhang, G.; Vivekanandan, J. Experiments in Rainfall Estimation with a Polarimetric Radar in a Subtropical Environment. J. Appl. Meteorol. 2002, 41, 674–685. [Google Scholar] [CrossRef] [Green Version]
  72. Angulo-Martinez, M.; Barros, A. Measurement uncertainty in rainfall kinetic energy and intensity relationships for soil erosion studies: An evaluation using PARSIVEL disdrometers in the Southern Appalachian Mountains. Geomorphology 2015, 228, 28–40. [Google Scholar] [CrossRef]
  73. Fernández-Raga, M.; Fraile, R.; Keizer, J.J.; Teijeiro, M.E.V.; Castro, A.; Palencia, C.; Calvo, A.I.; Koenders, J.; Da Costa Marques, R.L. The kinetic energy of rain measured with an optical disdrometer: An application to splash erosion. Atmos. Res. 2010, 96, 225–240. [Google Scholar] [CrossRef]
  74. Wischmeier, W.H.; Smith, D.D. Rainfall energy and its relationship to soil loss. Trans. Am. Geophys. Union 1958, 39, 285–291. [Google Scholar] [CrossRef]
  75. Jayawardena, A.W.; Rezaur, R.B. Measuring drop size distribution and kinetic energy of rainfall using a force transducer. Hydrol. Process. 2000, 14, 37–49. [Google Scholar] [CrossRef]
  76. Kinnell, P. Rainfall energy in eastern Australia-Intensity kinetic energy relationships for Canberra, ACT. Soil Res. 1987, 25, 547–553. [Google Scholar] [CrossRef]
  77. Lim, Y.S.; Kim, J.K.; Kim, J.W.; Park, B.I.; Kim, M.S. Analysis of the relationship between the kinetic energy and intensity of rainfall in Daejeon, Korea. Quat. Int. 2015, 384, 107–117. [Google Scholar] [CrossRef]
  78. Nanko, K.; Moskalski, S.M.; Torres, R. Rainfall erosivity–intensity relationships for normal rainfall events and a tropical cyclone on the US southeast coast. J. Hydrol. 2016, 534, 440–450. [Google Scholar] [CrossRef] [Green Version]
  79. Ryu, J.; Song, H.; Sohn, B.; Liu, C. Global Distribution of Three Types of Drop Size Distribution Representing Heavy Rainfall From GPM/DPR Measurements. Geophys. Res. Lett. 2021, 48, e2020GL090871. [Google Scholar] [CrossRef]
  80. Adirosi, E.; Montopoli, M.; Bracci, A.; Porcù, F.; Capozzi, V.; Annella, C.; Budillon, G.; Bucchignani, E.; Zollo, A.; Cazzuli, O.; et al. Validation of GPM Rainfall and Drop Size Distribution Products through Disdrometers in Italy. Remote Sens. 2021, 13, 2081. [Google Scholar] [CrossRef]
Figure 1. (a) Tracks of Western Pacific (WP) tropical cyclones (TCs) observed in the Palau islands (red square), (b) geographical location of the Palau islands with disdrometer site (red triangle).
Remotesensing 14 00470 g001
Figure 2. Comparison of daily precipitations from two instruments (JWD and rain gauge) for the WP TCs.
Remotesensing 14 00470 g002
Figure 3. The distribution of log10Nw and Do in five (a) rainfall rates and (b) radar reflectivity classes. Mean values of log10Nw and Do in five (c) rainfall rates and (d) radar reflectivity classes.
Remotesensing 14 00470 g003
Figure 4. (a) Mean raindrop spectra of WP TCs’; (b) distributions of WP TCs’ Dm and log10Nw values (STF: stratiform, CON: convective).
Remotesensing 14 00470 g004
Figure 5. The percentage occurrence of Dm and log10Nw for (a) total, (b) stratiform, and (c) convective rainfall of WP TCs. The mean, standard deviation (SD), and skewness (SK) values of Dm and log10Nw are also provided.
Remotesensing 14 00470 g005
Figure 6. Contribution of drops of different sizes to (a) total number concentration Nt (m−3) and (b) rainfall rate R (mm h−1). Each drop size percentage contribution in stratiform and convective rainfall to (c) Nt (m−3) and (d) R (mm h−1).
Remotesensing 14 00470 g006
Figure 7. Radar reflectivity and rainfall rate (ZR) relations for (a) total, (b) stratiform, and (c) convective precipitation of WP TCs.
Remotesensing 14 00470 g007
Figure 8. The scatter plots between shape and slope parameters and their empirical relations for (a) total, (b) stratiform, and (c) convective rainfall of the WP TCs. The μΛ relations denoted with blue (chang et al., 2009), magenta (Chen et al., 2012), and light green (Wen et al., 2018) solid lines correspond to the WP TCs measured in Taiwan, Southeastern China, and South China, respectively.
Remotesensing 14 00470 g008
Figure 9. DmR and NwR relations for (a,b) total, (c,d) stratiform, and (e,f) convective precipitations of WP TCs.
Remotesensing 14 00470 g009
Figure 10. The σmDm relations for (a) total, (b) stratiform, and (c) convective precipitations of WP TCs.
Remotesensing 14 00470 g010
Figure 11. (af) Mapping (Dm, μo) space from (Dm, σm) space for total precipitation of WP TCs.
Remotesensing 14 00470 g011
Figure 12. (af) Mapping (Dm, μo) space from (Dm, σm) space for stratiform precipitation of WP TCs.
Remotesensing 14 00470 g012
Figure 13. (af) Mapping (Dm, μo) space from (Dm, σm) space for convective precipitation of WP TCs.
Remotesensing 14 00470 g013
Figure 14. Scatter plots of mass-weighted mean diameter radar reflectivity at Ku-band (ac) and Ka-band (df) for total, stratiform, and convective rainfall of WP TCs.
Remotesensing 14 00470 g014
Figure 15. KEtimeR and KEmmR relations for total (a,d), stratiform (b,e), and convective (c,f) precipitations of WP TCs.
Remotesensing 14 00470 g015
Figure 16. Rainfall kinetic energy (KEmm) and mass-weighted mean diameter (Dm) relations for (a) total, (b) stratiform, and (c) convective rainfall.
Remotesensing 14 00470 g016
Table 1. Correlation coefficient (R2), root mean square error (RMSE), normalized RMSE values for the rainfall kinetic energy–rainfall rate/mass-weighted mean diameter relations.
Precipitation TypeStatistical ParametersKEtimeRKEmmRKEmmDm
LinearPowerPowerExpLog
TotalR20.980.990.70.70.70.99
RMSE33.5225.133.783.783.7612.04
NRMSE0.360.270.040.040.043.28
StratiformR20.960.960.640.650.640.99
RMSE12.8612.343.813.763.8311.01
NRMSE0.350.330.10.10.13.36
ConvectiveR20.990.990.70.670.690.99
RMSE59.4349.093.353.473.3715.13
NRMSE0.640.530.040.040.044.18
Publisher’s Note: MDPI stays neutral with regard to jurisdictional claims in published maps and institutional affiliations.

