Abstract
In this study, we analyzed the influence of coastal zone engineering on suspended sediment concentration (SSC) in the Yangtze River mouth based on HY-1C and Chinese GaoFen (GF) satellite data. The results show that: (1) SSC in the Yangtze River mouth is mainly in the range of 200–1300 mg/L, which changes due to natural factors as well as coastal zone engineering; (2) The sand blocking engineering effectively protects the channel from siltation, and SSC in the central line of the channel is 100–300 mg/L lower than that near the dikes in the north and south; (3) Qingcaosha Reservoir plays a stabilizing role in the hydrodynamic force, promoting the deposition of suspended matter, so that the water in the reservoir is clear. SSC inside the Qingcaosha Reservoir, located in the center of the estuary, is 100–500 mg/L lower than the high SSC water outside the reservoir; (4) The bridges interact with the current, facilitating the transport of local sediment, resulting in the increase in SSC downstream of these bridges, and obvious vortexes appear with the length up to nearly 2400 m; and (5) Corresponding protection and development suggestions were put forward as follows. A linear array of wind power plants can be built near and parallel to dikes and leading jetties; to increase the depth of the southeast end of the reservoir; and the location of the bridge should be selected in the place of river where siltation is easy. This study aimed to study the SSC distribution under the complex impact of coastal zone engineering with satellite and to provide possible improvement suggestions.
1. Introduction
As the longest river in Asia, the Yangtze River is approximately 6300 km long and its annual runoff and sediment volume rank the fifth and fourth in the world, respectively [1]. The Yangtze River carries 3.84 × 10⁸ tons of sediment to the sea every year (from 1950 to 2011) [2], bringing a huge amount of suspended sediment (SS) to the Yangtze River mouth. SS plays a crucial role in the ecology and topography development of the estuary. Nutrients carried by sediment can benefit fisheries by raising the primary productivity of the sea, but the high concentration of nutrients may cause red tides [3]. In the joint influence of dynamic factors such as tide and wave, SS in the Yangtze River mouth can cause seabed sediment to redeposit and reshape the landscape [4]. Sediment transport is also closely related to many kinds of estuarine engineering [5,6,7,8], including the construction of artificial islands, tunnel construction, and dredging projects—projects which also complicate the dynamics of sediment in estuaries [9]. Considering all these factors, it is of paramount significance to study the distribution and transport of SS in the Yangtze River mouth for environmental protection, construction evaluation, and later engineering instruction.
The Yangtze River mouth is a typical estuary where hydrological elements change under the joint influence of runoff, tide, wind, topography, coastal flow and human construction [10,11]. When river and seawater mix at the estuary, flocculation occurs between the saltwater and freshwater, and the sediment particles aggregate into clumps and sink to the bottom. Under the action of tidal currents and waves, the underlying sediments may resuspend [12]. At the same time, the variation trend of runoff was consistent with that of sediment transport, showing obvious seasonal difference, and the sediment load during flood season accounts for 87.77% of the whole year [13]. Human activities, such as upstream dam construction, also strongly affect the SS dump into the sea [14]. More than 50,000 dams were built in the Yangtze River basin [15], and taking the Three Gorges Dam as an example, scholars have pointed out that after the completion of the dam, the amount of SS in the Yangtze River mouth may be reduced from 8 × 10⁸ t/y to 1.5 × 10⁸ t/y [16]. In addition, studies have shown that sea-level rise [17], water-soluble fertilizers [18], current velocity [19] and other factors can also affect SSC.
Due to the complexity of SS transportation and distribution mentioned above, it is difficult to obtain a promising result only by theoretical calculation. Moreover, the famous “double ship” experiment [20] tells us that in a sea area with complicated changes in hydrological elements, because of the lack of timeliness, the representativeness of ship survey data is not reliable. Compared with the ship survey and station survey, satellite remote sensing data have multiple traits such as large volume, wide range, authenticity and extremely high timeliness [21], and the application of satellite remote sensing can greatly save manpower, time, material, and financial resources; its high economic efficiency is favored by many scholars [22].
Many kinds of satellite data such as those of Moderate-Resolution Imaging Spectroradiometer (MODIS), GOCI (Geostationary Ocean Color Imager), Medium-Resolution Imaging Spectroradiometer (MERIS), the Landsat series satellite, GF series satellite and HY series satellite have been applied to detect SSC. Taking the GF-1 satellite as an example, its data processing process mainly includes preprocessing (radiometric calibration, atmospheric correction, geometric correction, etc.) and the establishment of the inversion model [23], which is an important link in the telemetry of SSC. There is no unified view on the inversion model between spectral reflectance and SSC; at present, commonly used models include the logarithmic model, exponential model, linear model, power regression model, quadratic model, Gordon model and semi-empirical radiative transfer (SERT) model [24,25,26]. Using the GF-1 data and aforementioned models, many scholars have done a lot of research on the SSC in various water areas. The spatial and temporal distribution of SS in Chinese typical bays, such as Bohai Bay and Hangzhou Bay has been studied, as well as the SS injection in the Yellow River Estuary [27,28,29]. Based on GF-1 WFV data, Li et al. assessed its availability in inland water environment monitoring [30], whilst Shang et al. proposed an atmospheric correction method and estimated suspended particulate matter concentration in the Yangtze River mouth [31].
The GF-6 satellite is equipped with a panchromatic and multispectral (PMS) sensor and a wide field-of-view (WFV) sensor. Compared with other domestic satellites, its PMS sensor has 2 meters’ high spatial resolution and a swath width of up to 95 km, allowing GF-6 to have a good application on the observation of small-scale features. HY-1C is a Chinese marine operational satellite, its payloads include Chinese Ocean Color and Temperature Scanner (COCTS), Coastal Zone Imager (CZI), Ultraviolet Image (UVI), Satellite Calibration Spectrum (SCS) and Automatic Identification System (AIS). In order to comprehensively study coastal SSC, traits such as high spatial resolution, wide swath width and high repetition cycle are crucial, but few satellites can meet this requirement; therefore, measures such as image fusion or combined observation is needed.
The superior geographical position of the Yangtze River mouth endows it with great development potential [32]; since the last century, people have built many coastal zone engineering in the Yangtze Estuary, including channel regulation, siltation promotion and reclamation, development and the utilization of fresh water and tidal flat resources, and bridges [33]. The implementation of various coastal zone engineering systems has had a great impact on the transport of SS [34], and the distribution of SS is of great significance to engineering maintenance and tidal flat management [35], so it is very necessary to observe the distribution of SS in the Yangtze River mouth.
As the carrier of material input, SS plays a crucial role in the ecology and topography development of the estuary. Due to the implementation of a comprehensive regulation project, SS distribution in the Yangtze River mouth has changed. In this paper, HY-1C CZI and 2 m high spatial resolution GF-6 PMS data were applied to reveal the influence of various coastal zone engineering systems on SSC distribution in the Yangtze River mouth in detail. We analyzed the influence of typical wading engineering on SSC distribution in the Yangtze River mouth based on satellite data obtained from the Chinese GF and HY-1C, combining the high resolution (2 m) of GF-6 PMS and the wide swath width and high repetition cycle of GF-1 WFV and HY-1C CZI to provide possible suggestions for improvement based on the analysis.
The structure of this article is as follows. Section 2 contains the introduction of the data and methods. Section 3 describes the current and the retrieved SSC distribution in the Yangtze River mouth. Section 4 discusses the nature and human factors that influence SSC distribution. The conclusion was given in Section 5.
2. Materials and Methods
2.1. The Study Area
The Yangtze River’s drainage area covers 1.8 million square kilometers, accounting for approximately one-fifth of China’s total land area, it flows into the East China Sea at Chongming Island, presenting a geomorphic pattern of three branches and four mouths [2]. The water depth at the Yangtze River mouth (Figure 1) is relatively shallow, most areas are less than 10 m and the water depth at the area extending outward to the sea can reach 50 m [36].
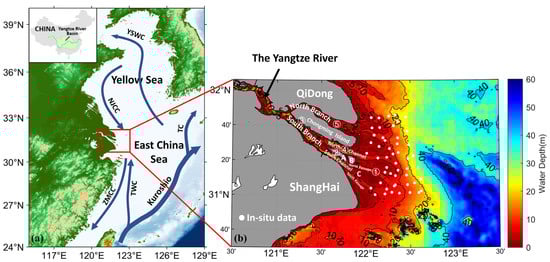
Figure 1.
(a): Location of the Yangtze River mouth–YSWC: Yellow Sea Warm Current; NJCC: North Jiangsu Coastal Current; ZMCC: ZheMin Coastal Current; TWC: Taiwan Warm Current; TC: Tsushima Warm Current; (b): Topography of the Yangtze River mouth and the location of typical coastal zone engineering: ① Deepwater Channel (sand blocking project); ② Qingcaosha Reservoir; ③ Dongfeng Xisha Reservoir; ④ Shanghai Yangtze River Bridge; ⑤ Chongqi Bridge; (A) Changxing Island; (B) Hengsha Island; and (C) Jiuduansha Shoal. The value of the bar is water depth.
The currents influencing the Yangtze River mouth are mainly the North Jiangsu Coastal Current, the Taiwan Warm Current and the Zhe-Min Coastal Current, and the estuary is also affected by the Kuroshio and the upwelling current along the shelf slope [37]. With a dominant semi-diurnal tide, the Yangtze River mouth is a typical tidal estuary of medium and strong tidal type, with abundant upstream runoff and strong tidal runoff mixing [38]; therefore, apart from the influence of tide, the variation of the upstream runoff also strongly affects the SSC [13]. The complex water movement has a great influence on SS transportation, saltwater intrusion, channel management, fish distribution and other aspects [39,40,41].
2.2. Current, Topography and Wind Field Data
The current was simulated with a hydrodynamic model, namely the Finite-Volume Community Ocean Model (FVCOM) [42,43]. It can effectively simulate tide, ocean current and other ocean elements, and is widely used in studies such as water quality, sediment and flow field simulation [44,45]. In contrast to ROMS and other models, the triangular mesh of FVCOM enables it to have good accuracy in the area with a complex shoreline [46]. In this study, the vertical direction adopted σ coordinates and was divided into 20 equally spaced layers. Tidal harmonic constants of eight tidal constituents (K1, O1, P1, Q1, K2, M2, N2 and S2) were obtained from TPXO. The three-dimensional global simulation results of the Hybrid Coordinate Ocean Model (HYCOM) reanalysis field were used for the initial temperature and salinity field and the temperature, salinity and flow field required by the open boundary of the model, whilst the atmospheric forcing field was obtained from the cfSR-V2 reanalysis field.
Topographic data were obtained from the global DEM data published by GEBCO in 2020, which have a resolution of 15 s (http://mds.nmdis.org.cn/, last accessed on 24 July 2021). Wind field data were derived from the ERA-Interim dataset (https://www.ecmwf.int/, last accessed on 15 September 2021), which is one of a number of datasets produced by the ECMWF through a series of projects. The data include wind, temperature, rainfall, snow and sea ice, and studies have shown that these data have better accuracy compared with other meteorological data [47].
2.3. Satellite Data
GF-6 and GF-1 were both launched by Long March 2nd D carrier rocket; the former was launched on 2 June 2018, and the latter was launched on 26 April 2013; both of them are working in the solar synchronous regression orbit and are equipped with a PMS camera and WFV camera. Based on the GF-1 WFV camera, the GF-6 WFV camera added the “red edge” band and ultraviolet band, which can effectively reflect the specific spectral characteristics of crops. The swath width of each camera was also improved, and the PMS sensor carried by the GF-6 has the widest width among the two-meter resolution scale satellites, up to 95 km. Under the corporate operation of GF-6 and the GF-1, the time resolution of data acquisition can be shortened from 4 days to 2 days. GF-6 has high resolution, large coverage, high quality and multiband. For instance, the red edge data of GF-6 can be used to extract fractional vegetation coverage [48] and its wide image can realize tree species classification [49]. Moreover, Li et al. pointed out that GF-6 data could play an important role in the field of fire monitoring and post-disaster assessment [50]. The information of GF-1 WFV and PMS sensor was shown in Table 1.

Table 1.
Introduction of GF-1 WFV and PMS sensor parameters.
The detail information of GF-6 WFV and PMS sensor was shown in Table 2.
Table 2.
Introduction of GF-6 WFV and PMS sensor parameters.
Chinese HY-1C satellite, was launched in 2018. It was equipped five payloads, including Chinese Ocean Color and Temperature Scanner (COCTS), Costal Zone Imagery (CZI), Ultraviolet Imagery (UV), Satellite Calibration Spectrometer (SCS), and Automatic Identification System (AIS). CZI can be applied not only for land observation, but also for effective ocean observation, especially for offshore, islands and coastal observationsly. HY-1C CZI sensor parameters are shown in Table 3.
Table 3.
Introduction of HY-1C CZI sensor parameters.
2.4. In Situ Data
In situ data used for verification were collected from a field data campaign in November 2020; the ship survey was carried out to collect water samples from various locations in the study area. Since the acquisition time of the GF satellite is 11:06 a.m. (local time) on 12 November 2020, 50 water samples collected between 10:45 and 11:25 on 12 November 2020, were selected, and their SSCs, which is defined as the per unit volume of particulate matter, were measured in the laboratory with a process from a previous study [51].
2.5. Data Processing
2.5.1. Data Preprocessing
The preprocessing of GF-6 and GF-1 data mainly includes radiometric calibration, atmospheric correction, orthorectification and image fusion [52]. In order to eliminate the influence caused by the sensor, atmosphere, solar altitude angle, etc., radiometric calibration and atmospheric correction must necessarily be carried out for satellite images. Radiometric calibration converts the original DN value recorded into the radiance value of a ground object [53], which can eliminate the error of the sensor itself and determine the accurate radiation value at the sensor inlet [23]. The radiometric calibration formula for GF data is shown as follows:
where L is the apparent radiance and D is the DN-value received from the satellite sensors. G is the calibration coefficient gain and B is the calibration coefficient bias, as displayed in Table 4.
L = G ∗ DN + B
Table 4.
Radiometric calibration parameters of the GF satellite.
Pan_G, B1_G, B2_G, B3_G and B4_G represents the calibration coefficient gain of each band of the sensor, Pan_B, B1_B, B2_B, B3_B and B4_B represents the calibration coefficient bias of each band of the sensor. Specific band parameters of a sensor can be found in Table 1 and Table 2.
Atmospheric correction converts the radiance value into the actual surface reflectivity and can eliminate the errors caused in the process of atmospheric scattering, absorption and reflection. In order to conduct precise quantitative research on SSC, the fast line-of-sight atmospheric analysis of spectral hypercubes (FLAASH) [54] atmospheric correction method based on the radiation model was adopted.
Image fusion seeks to generate a new composite image by processing data from multiple sources with redundant or complementary characteristics in space or time according to specific operational rules. The synthetic image has new spatial, spectral and temporal features, and has accurate and rich information superior to any single datum. This process can make full and effective use of each effective feature of multi-source data, which is conducive to the subsequent analysis and research of images [55]. We adapted the nearest-neighbor diffusion-based pan sharpening (NNDiffuse pan sharpening) method proposed by the Rochester Institute of Technology [56] to merge panchromatic (high-resolution) and multispectral (low-resolution) images, so each new spectrum of the fused high-resolution image is a combination of the weights of the panchromatic and multispectral images. After the merging process, the new image has the advantages of being multispectrum and high spatial resolution (2 m) at the same time.
2.5.2. Inversion Model of the SSC in the Yangtze Estuary
In this paper, the two-band linear model [57] of the red band and near-infrared band from a previous study, which was proven to be more sensitive to the SSC [58] as verified in a previous study [57], was applied in this paper for SSC inversion based on GF satellite data:
where SSC is the concentration of suspended sediment in mg/L, R_Red and R_NIR represents the value of the red band and near-infrared band obtained after atmosphere correction, respectively.
In addition, HY-1C CZI data were inversed using a model which was suitable for high turbidity water in Hangzhou Bay, with similar water turbidity as in Yangtze Estuary, as shown in a previous study [51]. Therefore, the model is suitable for the Yangtze Estuary:
where SSC is the concentration of suspended sediment in mg/l which represents the remote sensing reflectance of the red band and near-infrared band, respectively.
In order to verify the feasibility of the two-band linear model, the modeled SSC was verified using a 50 in situ SSC value obtained on 12 November 2020, in the study area. Compared with in situ SSC values, the correlation coefficient (R) is 0.9632 (Figure 2), indicating that the two-band linear model can be suitable to retrieve SSC in the Yangtze River mouth using the GF satellite image. The data combination of GF and HY-1C with a resolution of 2 m and 50 m enables the detailed comprehensive monitoring of SSC distribution in Yangtze Estuary.
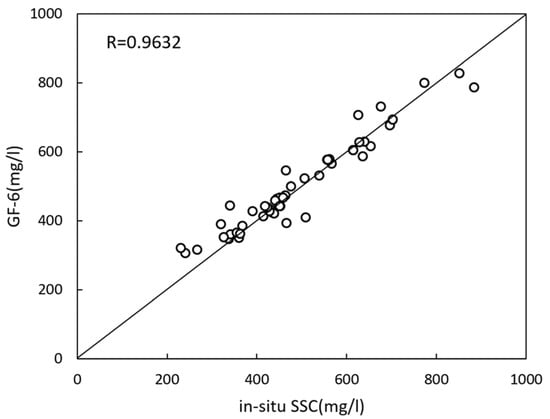
Figure 2.
Verification of the inversion model with in situ data.
3. Results
3.1. Current in the Yangtze River Mouth
The Yangtze River mouth is a mesotidal estuary, with an irregular semidiurnal tide inside the mouth and regular semidiurnal tide outside the mouth [59]. Taking the current on 16 January 2016, as an example, the current direction and velocity change with time obviously (Figure 3). At the beginning of the flooding period, the current flows from the west of Hangzhou Bay to the east of the bay (Figure 3a), whereas at the beginning of ebbing period (Figure 3f), the currents flow in the opposite direction compared with the flooding period. Westward currents (Figure 3b) and eastward currents (Figure 3c) dominate the bay during the middle–late flooding period and middle–late ebbing period, respectively. The current velocity also changes with time with velocity in the range of 0.3–2 m/s (Figure 3).
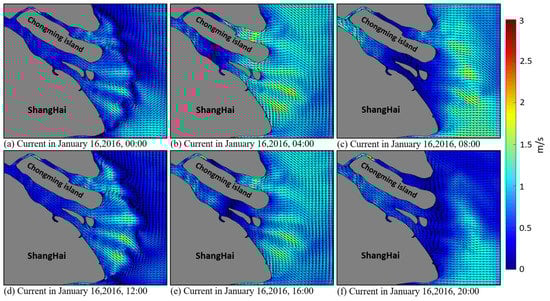
Figure 3.
Simulated tidal current in the Yangtze River mouth on 16 January 2016.
3.2. SSC in the Yangtze River Mouth
In total, forty images from different seasons and different tidal periods were analyzed and ten of them are shown in Figure 3 as examples. The SSC in Yangtze River mouth is generally high with the value in the range of 200–1300 mg/L, belonging to high turbidity water. The high SSC area is mainly distributed in the north branch and tidal flat area where the water is shallower, whereas SSC in the south branch is generally lower than in other areas, up to 700 mg/L. The seasonal difference in SSC is obvious: SSC in the winter is generally higher than in summer (Figure 4). During the initial stage of flooding (Figure 4g,h,j), SSC in the estuary is generally high except in the south branch, where the SSC is 100–400 mg/L lower than in other areas. During the end stage of flooding (Figure 4a,b,e), the SSC in the estuary become similar, at approximately 300–600 mg/L, and gradually decreases from west to east. During the ebb tide, the SSC in both channels is even, and gradually decreases from west to east (Figure 4d,f,i).
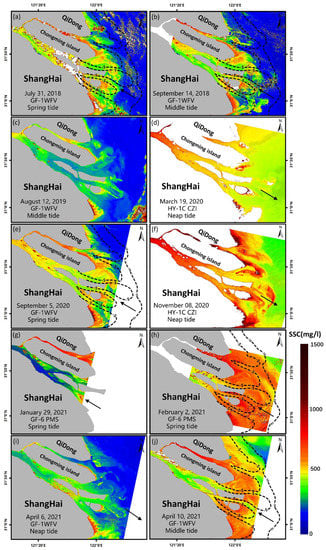
Figure 4.
SSC distribution details in the Yangtze River mouth retrieved from GF-1 WFV, GF-6 PMS and HY-1C CZI images. Black arrows represent the current direction, and the black dotted lines represent the 5 m isobath and 10 m isobath.
Spatially, the SS at the mouth is diffused into the sea in the shape of a fan, and the water gradually became clear in the outer sea as the water depth becomes shallow (Figure 4a). In the south branch, the water is divided at the northeast side of the Changxing Island. Sediment in the northern channel can be transported to the northeast, taking on the shape of a trumpet after leaving the estuary (Figure 4h). Meeting with the water from the north branch, the high SSC water forms into a muddy water tongue shape at the east beach of Chongming Island, and the movement direction of high SSC water is easy to change under the influence of wind and current.
3.3. SSC Distribution near Coastal Zone Engineering
3.3.1. Yangtze River Mouth Deepwater Channel Project
The deep-water channel construction, herein name the sand blocking project, includes 2 leading jetties, 19 dikes and 1 additional sediment protection dam (Figure 5a). This project further develops the golden waterway of the Yangtze River, but it also affects the runoff and tidal current of the Yangtze River mouth, changes the distribution ratio of the flow and sediment in both passages and affects the path of sediment injecting into the sea. It is important to study the details of sediment movement for the follow-up management of the project.
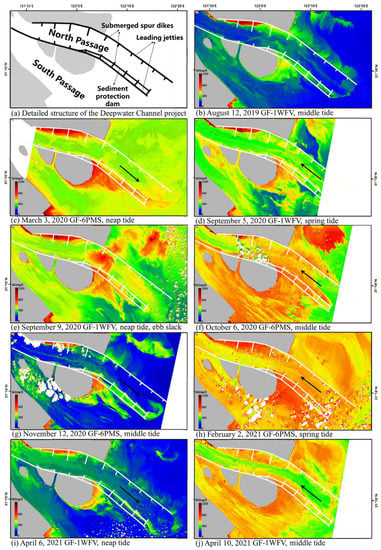
Figure 5.
SSC distribution in the sand blocking project.
Generally, SSC in the north passage is lower than that in the south passage (Figure 5c–j). In the channel, the sand blocking dikes perfectly serve their purpose, which is to decreased sediment load due to the converting flow, leading the SSC in the middle line of the channel (where the water depth is approximately 12.5 m) to be in the range of 100–300 mg/L lower than that in the area around the dikes. The SSC around dikes N1–4 and the sediment protection dam is relatively higher than a nearby area, and up to 1200 mg/L (Figure 5c–j). When the current flows to the southeast, under the action of the current, the SS output from the channel shifts to the northeast in a feather shape (Figure 5c,g). As the current flows to the northwest, the seawater is poured back into the channel, scouring the seabed and inducing the re-suspension of sediment in the channel, and the SSC is generally higher (Figure 5f,h). Based on the analysis above, the sand blocking dikes play an important role in protecting the waterway from siltation.
3.3.2. Qingcaosha Reservoir and Dongfeng Xisha Reservoir
The Qingcaosha Reservoir is located in a special geographical location (Figure 6a–j): the reservoir is far from the influence of land-based pollution, with excellent water quality and abundant water reserves. The construction of the reservoir is also conducive to stabilize the diversion ratio and sand distribution ratio between the north and south channels.
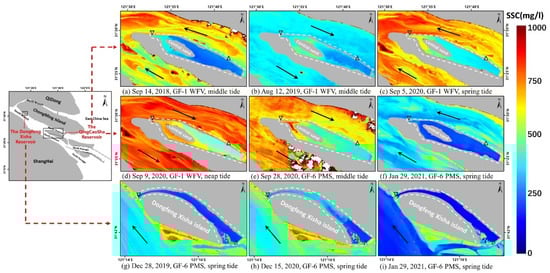
Figure 6.
SSC in the Qingcaosha reservoir retrieved from the GF-1 WFV and GF-6 PMS images. Black inverted triangles: water inlet; black triangles: water outlet.
SSC inside the Qingcaosha reservoir is generally low, ranging from 200 to 700 mg/L and is higher in the northwest near the inlet (black inverted triangles), indicating that most of the high turbidity water passed the inlet (Figure 6d,e). The SSC in the southeast part of the reservoir is lower, indicating that the water is basically stagnant here, with a little bit of sediment resuspension (Figure 6a–c). The SSC outside the reservoir is relatively high with a maximum value of 1000 mg/L, and is 100–500 mg/L higher than that in the water inside the reservoir. The SSC in the north channel and the south channel around the reservoir is generally similar.
Similarly to the Qingcaosha Reservoir, the high SSC area in the Dongfeng Xisha Reservoir appears at the water inlet in northwest (black inverted triangles), and the SSC in the east part of the reservoir is low due to siltation (Figure 6b). Moreover, the SSC in the reservoir becomes even as the water gate closes and the reservoir stops drawing water (Figure 6g,i).
3.3.3. Shanghai Yangtze River Bridge and Chongqi Bridge
The water surrounding Shanghai Yangtze River Bridge can be divided into three regions according to its position (Figure 7a–d). When the current flows to the northwest, the SSC in area 1 is relatively higher than area 2 (Figure 7b–d). Water depth in area 3 is lower than that in other areas (Figure 7i), and the SSC is much higher, with a maximum value of up to 600 mg/L. Meanwhile, the boundary between high the SSC area 3 and low SSC area 2 is obvious, and the shape and position of the boundary are similar (Figure 7b–d). When the current flows to the southeast, the SSC gradually increases from southwest to northeast (Figure 7a). In area 2, near-symmetrical vortex shape SSC distribution is obvious downstream of the bridge, with a length of up to nearly 2.4 km (Figure 7f–h). Generally, the SSC downstream of the bridge is relatively higher than the SSC upstream and this phenomenon is obvious in area 2.
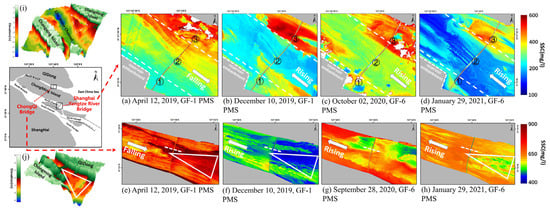
Figure 7.
(a–h) SSC retrieved from the GF-6 PMS and GF-1 PMS images; (i,j) the underwater topography around the Chongqi Bridge and the underwater topography around the Shanghai Yangtze River Bridge.
The SSC in the water surrounding the Chongqi Bridge is relatively high, ranging from 400 to 900 mg/L (Figure 7e–h) due to the river’s extremely low water depth (Figure 7j). It can be observed that there is a triangular area on the east side of the Chongqi Bridge where the water depth is up to 4 m, which is deeper than in nearby areas (Figure 7j). When the current flows to the northwest, the SSC in this area is approximately 100 mg/L lower than that in the surrounding water (Figure 7f,h), When the current flows to the southeast, the SSC is approximately 100 mg/L higher than in the surrounding water (Figure 7e). The influence of the bridge on the flow field is obvious at the pier, inducing SSC to increase downstream in most of the area surrounding the bridge (Figure 7b).
4. Discussion
4.1. The Influence of Nature Factors on SSC Distribution
4.1.1. Tide and Upstream Runoff
The influencing factors of SS transport in the Yangtze River mouth are very complex. Sediment carried by the Yangtze River mainly comes from the upstream and sediment resuspension, and its movement and distribution obviously change over time and space under the influence of topography, outer ocean current system, tide and human activities [60]. On the time scale, the tidal fluctuation and the variation of runoff in the dry season are the decisive factors of sediment movement [61]. When the time span is small (daily), the tide is the dominant factor. Current in the estuary is the energy source for the mixing of saltwater and freshwater, as well as the power source for the resuspension and exchange of sediment [62]. Tidal variation can directly affect the SSC, causing the SSC to be higher during flooding tide than during the ebb tide. Meanwhile, the SSC during the spring tide is higher than that during the neap tide. If the time span is large (in months), the runoff is the dominant factor and the SSC in dry season (winter) is higher than that in flood season (summer) (Figure 4); thus, the SSC during spring tide in flood season is 1.5~8.5 times that of the neap tide [63].
4.1.2. Wind and Offshore Current
The time variation of the monsoon and offshore current also affects the flow field in the estuary [64]. The Yangtze River mouth lives under subtropical monsoon climate conditions, which is mainly controlled by the East Asian monsoon with northerly winds dominating in winter and southerly winds dominating in summer (Figure 8) [65]. The density of the estuarine diluted water is smaller than that of the high-salt seawater and floats on the surface layer; therefore, the movement direction of this layer of high-sediment water can be easily changed under the effect of wind, resulting in a feather-like muddy water tongue [66].
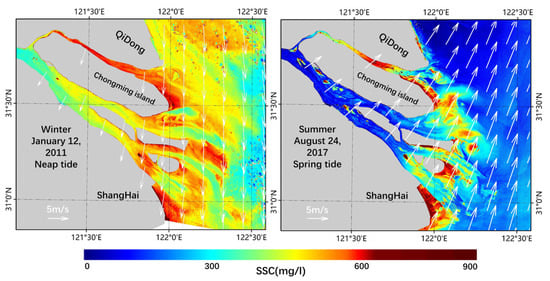
Figure 8.
SSC distribution and the wind field in summer and winter.
The monsoon also plays a strengthening and weakening role in the offshore currents. The flow direction of the Taiwan Warm Current has no obvious seasonal variation: it flows to the northeast or east–northeast along the isobath uniformly throughout the year, but its axis, amplitude and intensity fluctuate seasonally under the influence of monsoon. Zhe-Min Coastal Current’s seasonal change is closely related to the Taiwan Warm Current and the monsoon. In summer, the Taiwan Warm Current is strengthened, and the Zhe-Min Coastal Current flows to the northeast under the action of the southeast monsoon, impeding the eastward flow of sediment from estuaries [67]. Under the joint action of the southwest monsoon, runoff and Taiwan Warm Current, the Changjiang dilute water deflects to the northeast and flows into the west of the South Yellow Sea [68]. In winter, the weakness of the Taiwan Warm Current and the prevailing northwest monsoon make the Changjiang dilute water flow into the Zhe-Min Coastal Current, and move southwardly along the coastal line, carrying a large amount of SS from the estuary which is transported to the south [69,70].
Generally speaking, the basic movement law of SS in an estuary is “supply by runoff, lift by wave and transport by current” [71]. In summer, the Yangtze River is in the flood season and the effect of the ocean is relatively weak, so the sediment resuspension in summer is weaker than it is in winter under the dominant effect of runoff. On the contrary, in winter, the runoff is weakened, the tidal current and waves are relatively enhanced and the resuspension of sediment is very strong under the support of wind and waves [72,73]. Due to the combined action of the above factors, the Yangtze River mouth’s SSC in winter is higher than that in summer [4].
4.1.3. Topography
On the spatial scale, the SSC in the upper estuary is much higher than that in other areas during dry season because it is far away from the ocean and weakly influenced by wind. At the mouth, the topography is also an important factor affecting the distribution of SS. By comparing the topographic map of the Yangtze River mouth with the image obtained by inversion (Figure 4), it can be seen that the area with high SSC is in good agreement with the topography. An area with low water depth (lower than 10 m) is corresponds well with a high SSC area (Figure 4). The 5 m isobath contains the area with the highest SSC, ranging from 400 to 1000 mg/L; the SSC outside the 10-m isobath is generally low, while the area between the 5-m isobath and the 10-m isobath can be regarded as the transition zone between the high SSC river water and the low SSC sea water. The correspondence is more obvious during flood time.
The influence of topography on the distribution of SS mainly occurs through the resuspension of sediment deposited at the bottom of the riverbed caused by the increase in flow velocity [15], and the shallower the water is, the more intense the resuspension is [74]. Comparing the image obtained by the inversion and topographic map of Shanghai Yangtze River Bridge (Figure 7e–h) and Chongqi Bridge (Figure 7a,b), it can be seen that the factor inducing the SSC in the north of the former is much higher than that in the middle and the south is a shallow underwater shoal in the north (Figure 7i). The difference in SSC between the water on the east side of the Chongqi Bridge and the surrounding water is also due to the shallow water depth here (Figure 7j). As the water leaves the mouth and enters the open sea, the SSC gradually decreases with the increase in the water depth [72]. According to previous studies, the water bodies with different SSCs at different locations can be divided into four forms—muddy water tongue, turbidite water, sedimentary plume and dilute water [75].
4.2. The Influence of Nature Factors on SSC Distribution
4.2.1. Dam Construction
Upstream human activities such as soil conservation, road construction, deforestation and various other factors also have a great influence on the sediment distribution of the Yangtze River mouth [76,77], the most obvious one being the influence caused by upstream dams on the amount of sediment discharged into the estuary [78,79,80]. As of 2010, more than 40,000 reservoirs have been built upstream of the Yangtze River [16]. Taking the Three Gorges Dam, the largest dam in the world, as an example, it intercepts 60% of the sediment input upstream and drains the remaining 40% downstream [81]. According to recent studies, from 2003 to 2013, the Three Gorges Dam retains 1.35 × 10⁸ t of sediment per year on average [82]. Additionally, many years of statistical data from Datong Station (Figure 9) show that since the construction of the Three Gorges Dam in 1994, the amount of sediment from the Yangtze River pouring into the estuary has significantly decreased. Predictably, with several large-scale hydraulic projects built in the upper Yangtze River valley, sediment input into the Yangtze River mouth should further decrease [83], which could lead to the decrease in water–sediment concentration in the Yangtze River mouth region, and the carrying capacity will increases relatively, which may result in riverbed scouring and intertidal wetland degradation [84,85].
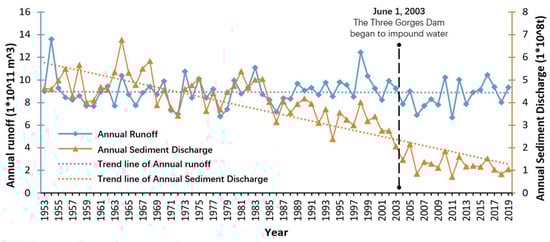
Figure 9.
Annual runoff and annual sediment discharge recorded by Datong Station (the representative hydrological station) from 2000 to 2019. Data are from the Chinese River Sediment Bulletin, Ministry of Water Resources, PRC.
4.2.2. Reservoirs, Sand Blocking Engineering and Bridges
Since the implementation of comprehensive regulation and the development of the Yangtze River mouth, there has been an increase in the implementation of channel regulation, silting promotion, coastal zone engineering and shoreline development projects [86]. The Qingcaosha Reservoir is not only an important water source for Shanghai, but is also a crucial part of the governance of the north and south channel [87]. The completion of the reservoir shortened the width of the north channel by 4450 m (Figure 6a–g), the diversion ratio of the north channel decreased, and therefore, the flow velocity in the north channel also decreased [88], inducing the variation of SSC (Figure 4).
In the north passage, the construction of the sand blocking engineering system profoundly changed the nearby flow field, which is the basis of other parameters such as sediment load and salinity. Firstly, the blocking effect of the groin field increased the flow velocity in the center of the channel, scouring the riverbed, part of the riverbed sediment flow downstream, and the other part flowed into the groin field under the influence of backflow [89]. The slow flow area which formed around the dikes promoted the deposition of sediment [90], and the SSC there is generally in the range of 100–300 mg/L higher than any other area in the channel (Figure 5b–j). Moreover, the diversion effect of the groin field makes the middle and lower reaches of the channel change from rotating flow to reciprocating flow [91], under the action of runoff, the ebb current is stronger than the flood current [92], resulting in a lower SSC when ebbing (Figure 5c,g,i), ranging from 200 to 500 mg/L. The decrease in the water crossing section area in the north passage induced the increase in the tidal resistance and the decrease in the sand separation ratio in the north passage year by year, whilst the sand separation ratio increased in the south passage [93]. This causes more sediment to be transported from the south passage to the sea, and the SSC and current velocity in the north passage is lower than those in the south passage [94].
The blockage on the exchange of water and sand caused by the leading jetties and dikes causes the surrounding tidal flat to deposit in different degrees (Figure 4 and Figure 5). For example, in the Jiuduansha Shoal, located in the south of the sand blocking project, the sedimentation rate accelerates due to the obstruction caused by the south leading jetty to the tidal current and wind waves [95], resulting in a high SSC, ranging from 500 to 1200 mg/L (Figure 4). In general, although the sediment pouring into the Yangtze River mouth is inevitably reduced under the influence of upstream human activities [96], the implementation of coastal zone engineering has led to the gradually expanding tendency of tidal flats around them.
The spacing of piers directly determines the influence of bridge on water flow, as bridges can greatly reduce current velocity when the spacing is less than 150 m [97,98], not to mention the Shanghai Yangtze River Bridge and the Chongqi Bridge, where the shortest spacing can reach 60 m. When water flows through the pier, the flow velocity on both sides of the pier increases due to the narrowing of the water crossing section. When the flow velocity is higher than the moving incipient velocity of the riverbed sediment, the sediment begins to move, resulting in the scouring of the riverbed [99]. At the same time, wake vertical vortices were released from both sides of the pier and moving downstream, forming a low pressure center, which brings the riverbed sediment to the downstream sea surface, increasing the downstream SSC [100]. Therefore, in the lower area of the white dotted line (Figure 7e–h), the piers spread evenly and densely, and downstream SSC tends to be higher than upstream SSC. In the other area of the bridge, the SSC generally increases downstream.
4.3. Suggestions for the Protection and Development of Yangtze River Mouth
The leading jetties and dikes play a block role on tidal current, causing the deposition of surrounding SSC. In order to make better use of the stable hydrodynamic effect of dikes and leading jetties, a linear array of wind turbines can be built near and parallel to dikes and leading jetties. The wind turbine and the dikes can protect each other while making full use of space resources.
Qingcaosha Reservoir is located in the center of the estuary, with a maximum effective storage capacity of 553 million cubic meters and a designed effective storage capacity of 435 million cubic meters. It has a total length of 43 km of levees, enclosing nearly 70 square kilometers of water [100]. It is an important water source for Shanghai, China. SSC in the reservoir is high at the northwest inlet, and the water is clear at the southeast part. Therefore, it is recommended that the outlet be moved to the south-eastern end of the reservoir. At the same time, in order for the reservoir to a better play role in terms of urban water supply, we can increase the depth of the southeast end of the reservoir, which on the one hand is beneficial to stabilize the hydrodynamic force, promoting the deposition of suspended matter, and on the other hand increases the volume of the reservoir.
The piers of a bridge have the function of transferring the seafloor sediments nearby. Therefore, it has been suggested to select the location of the bridge in the river where siltation is easy, which can help clean up the river siltation to a certain extent. This way, the bridge not only plays a role in traffic but also plays the roles of bridge pier dredging and river protection.
5. Conclusions
Combining the GF and HY-1C data, the detailed characteristics of the SSC distribution in the Yangtze River mouth were revealed. The SSC in the Yangtze River mouth is high, ranging from 200 to 1300 mg/L, and the high-value area is concentrated in the isobathic line of 10 m, which gradually increases from west to east. GF-6 PMS with a spatial resolution of 2 m revealed the influence of various coastal zone engineering systems in the Yangtze River mouth on SSC distribution details.
This study revealed that: (a) the sand blocking project effectively protects the channel from siltation, and SSC in the central line of the channel is 100–300 mg/L lower than the dikes on north and south. Moreover, the construction of the channel has greatly changed the water and sediment conditions of the surrounding environment and accelerated the sedimentation of nearby shoals; (b) The Qingcaosha Reservoir has a stabilizing effect on the sedimentation ratio between the north and south channels, and the SSC in the channel is basically similar. The SSC inside the reservoir is much lower than outside, and high SSC water can obviously be observed when the reservoir began to draw water, which is similar to a situation in the Dongfeng Xisha Reservoir; (c) The bridges interact with the current, facilitating the transport of local sediment, resulting in the increase in SSC downstream of these bridges, and an obvious vortex can be observed downstream. Many natural factors such as tidal current, offshore currents, topography, monsoon and fresh water injection have a certain influence on SSC distribution.
This study can be contributive to the study of estuarine and coastal material transport, as well as the management and maintenance of coastal engineering.
Author Contributions
L.C. conducted the research design, data collecting, processing, analysis, and manuscript writing. S.C. conducted the data processing, and manuscript writing. X.Y. conducted the data collecting and research advisement. Y.B. the data collecting, analysis, research advisement and paper editing. J.B. assisted data collecting. All authors have read and agreed to the published version of the manuscript.
Funding
This work is jointly supported by the following research projects: Zhejiang Key Science and Technology Project (2020C02004); National Natural Science Foundation of China Key international (regional) cooperative research project (42020104009); Basic Public Welfare Research Program of Zhejiang Province (LGF21D010004);Research on group ideological and political subject teaching model of ocean remote sensing (132).
Institutional Review Board Statement
Not applicable.
Informed Consent Statement
Not applicable.
Data Availability Statement
Not applicable.
Acknowledgments
GF-1/GF-6/HY-1C satellite data was provided by National Satellite Ocean Application Service, MNR of PRC, obtained from the website: https://osdds.nsoas.org.cn (last accessed on 24 July 2021). The authors would like to thank NSOAS for providing the data free of charge. The authors wish to thank the national satellite ocean application center, China and Sophisticated Ocean Front and Fisheries Investigation (SOPHI) for the data support.
Conflicts of Interest
The authors declare no conflict of interest.
References
- Milliman, J.D.; Meade, R.H. World-Wide Delivery of River Sediment to the Oceans. J. Geol. 1983, 91, 1–21. [Google Scholar] [CrossRef]
- Yang, Y.; Li, Y.; Sun, Z.; Fan, Y. Suspended sediment load in the turbidity maximum zone at the Yangtze River Estuary: The trends and causes. J. Geogr. Sci. 2014, 24, 129–142. [Google Scholar] [CrossRef]
- Liu, D.; Sun, J.; Zou, J.; Zhang, J. Phytoplankton succession during a red tide of Skeletonema costatum in Jiaozhou Bay of China. Mar. Pollut. Bull. 2005, 50, 91–94. [Google Scholar] [CrossRef]
- Zhang, G.; Yang, S.; Yu, Z. Temporal and spatial changes of suspended sediment concentration and resuspension in the Yangtze River Estuary and its adjacent waters. Acta Geogr. Sin. 2004, 59, 260–266. [Google Scholar]
- Xiang, Y.; Fu, Z.; Meng, Y.; Zhang, K.; Cheng, Z. Analysis of wave clipping effects of plain reservoir artificial islands based on MIKE21 SW model. Water Sci. Eng. 2019, 12, 179–187. [Google Scholar] [CrossRef]
- Zhao, D.Z.; Liu, J.; Cheng, H.F.; Wang, Z.Z. Current situation and future prospect of dredged material disposal in the Yangtze estuary deepwater navigation channel. Hydro-Sci. Eng. 2013, 38, 26–32. [Google Scholar]
- Xie, J.; Yan, Y. Promoting Siltation Effects and Impacts of Hengsha East Shoal on the Yangtze River Estuary. J. Hydrodyn. 2011, 23, 649–659. [Google Scholar] [CrossRef]
- Meng-Guo, L.I. The effect of reclamation in areas between islands in a complex tidal estuary on the hydrodynamic sediment environment. J. Hydrodyn. 2010, 22, 338–350. [Google Scholar]
- Hassan, A.M.; Church, M.; Yan, Y.; Slaymaker, O. Spatial and temporal variation of in-reach suspended sediment dynamics along the mainstem of Changjiang (Yangtze River), China. Water Resour. Res. 2010, 46, W11551. [Google Scholar] [CrossRef]
- Yang, H.F.; Yang, S.L.; Xu, K.H. River-sea transitions of sediment dynamics: A case study of the tide-impacted Yangtze River estuary. Estuar. Coast. Shelf Sci. 2017, 196, 207–216. [Google Scholar] [CrossRef]
- Chen, K.; Kuang, C.; Wang, Y.; Wang, T.; Bian, C. Cross-shelf sediment transport in the Yangtze Delta frontal zone: Insights from field observations. J. Mar. Syst. 2021, 219, 103559. [Google Scholar] [CrossRef]
- Wang, L.; Zhou, Y.; Shen, F. Suspended sediment diffusion mechanisms in the Yangtze Estuary influenced by wind fields. Estuar. Coast. Shelf Sci. 2018, 200, 428–436. [Google Scholar] [CrossRef]
- Zhang, E. A Study about Impacts of Human Activities in the Mid-Lower Yangtze on Fluvial Sediment Supply from River Basin and Sediment Discharge from the Yangtze into the Sea. Doctoral Thesis, East China Normal University, Shanghai, China, 2004. [Google Scholar]
- Zhang, J.; Zhang, Z.F.; Liu, S.M.; Wu, Y.; Xiong, H.; Chen, H.T. Human impacts on the large world rivers: Would the Changjiang (Yangtze River) be an illustration? Glob. Biogeochem. Cycles 1999, 13, 1099–1105. [Google Scholar] [CrossRef]
- Li, P.; Yang, S.L.; Milliman, J.D.; Xu, K.H.; Qin, W.H.; Wu, C.S.; Chen, Y.P.; Shi, B.W. Spatial, Temporal, and Human-Induced Variations in Suspended Sediment Concentration in the Surface Waters of the Yangtze Estuary and Adjacent Coastal Areas. Estuaries Coasts 2012, 35, 1316–1327. [Google Scholar] [CrossRef][Green Version]
- Yang, S.L.; Zhang, J.; Zhu, J.; Smith, J.P.; Dai, S.B.; Gao, A.; Li, P. Impact of dams on Yangtze River sediment supply to the sea and delta intertidal wetland response. J. Geophys. Res. 2005, 110, F03006. [Google Scholar] [CrossRef]
- Reed, D.J. The response of coastal marshes to sea-level rise: Survival or submergence? Earth Surf. Processes Landf. 2010, 20, 39–48. [Google Scholar] [CrossRef]
- Correll, D.L.; Jordan, T.E.; Weller, D.E. Precipitation Effects on Sediment and Associated Nutrient Discharges from Rhode River Watersheds. J. Environ. Qual. 1999, 28, 1897–1907. [Google Scholar] [CrossRef]
- Rijn, L. Unified View of Sediment Transport by Currents and Waves. II: Suspended Transport. J. Hydraul. Eng. 2007, 133, 668–689. [Google Scholar] [CrossRef]
- Ho, C.-I.; Ren, Y.-W. Some problems concerning hydrographic investigations in shallow sea. Oceanol. Et Limnol. Sin. 1959, 2, 1–10. [Google Scholar]
- Wang, J.J.; Lu, X.X. Estimation of suspended sediment concentrations using Terra MODIS: An example from the Lower Yangtze River, China. Sci. Total Environ. 2010, 408, 1131–1138. [Google Scholar] [CrossRef]
- Devi, G.K.; Ganasri, B.P.; Dwarakish, G.S. Applications of Remote Sensing in Satellite Oceanography: A Review. Aquat. Procedia 2015, 4, 579–584. [Google Scholar] [CrossRef]
- Lei, S.; Wu, D.; Li, Y.; Wang, Q.; Huang, C.; Liu, G.; Zheng, Z.; Du, C.; Mu, M.; Xu, J.; et al. Remote sensing monitoring of the suspended particle size in Hongze Lake based on GF-1 data. Int. J. Remote Sens. 2019, 40, 3179–3203. [Google Scholar] [CrossRef]
- Tao, C.; Li, P.; Zhang, L.; Shi, L. Estimating suspended sediment concentration in Yangtze River from Landsat-TM image. In Proceedings of the SPIE the International Society for Optical Engineering, Wuhan, China, 31 October–2 November 2005; Volume 6043. [Google Scholar]
- Li, S.; Yun, C. A Study on the Quantitative Model of the Suspended Sediment Concentration from the Meteorological Satellite Imagery. J. Remote Sens. 2001, 5, 154–160. [Google Scholar]
- Fang, S.; Verhoef, W.; Zhou, Y.; Salama, M.S.; Liu, X. Satellite Estimates of Wide-Range Suspended Sediment Concentrations in Changjiang (Yangtze) Estuary Using MERIS Data. Estuaries Coasts 2010, 33, 1420–1429. [Google Scholar]
- Yao, R.; Cai, L.; Liu, J.; Zhou, M. GF-1 Satellite Observations of Suspended Sediment Injection of Yellow River Estuary, China. Remote Sens. 2020, 12, 3126. [Google Scholar] [CrossRef]
- Cai, X. Retrieve of Spatial and Temporal Distribution of Suspended Sediment in Bohai Bay Based on GF-1 Remote Sensing Satellite. J. Atmos. Environ. Opt. 2020, 15, 58–66. [Google Scholar]
- Cheng, Q.; Liu, B.; Ting, L.I.; Zhu, L. Research on remote sensing retrieval of suspended sediment concentration in Hangzhou Bay by GF-1 satellite. Mar. Environ. Sci. 2015, 34, 558–563. [Google Scholar]
- Li, J.; Chen, X.; Tian, L.; Huang, J.; Feng, L. Improved capabilities of the Chinese high-resolution remote sensing satellite GF-1 for monitoring suspended particulate matter (SPM) in inland waters: Radiometric and spatial considerations. ISPRS J. Photogramm. Remote Sens. 2015, 106, 145–156. [Google Scholar] [CrossRef]
- Shang, P.; Shen, F. Atmospheric Correction of Satellite GF-1/WFV Imagery and Quantitative Estimation of Suspended Particulate Matter in the Yangtze Estuary. Sensors 2016, 16, 1997. [Google Scholar] [CrossRef]
- Wang, Z.; Fang, C.; Zhang, X. Spatial expansion and potential of construction land use in the Yangtze River Delta. J. Geogr. Sci. 2015, 25, 851–864. [Google Scholar] [CrossRef]
- Han, Y.; Dou, X. The process and prospect of comprehensive control of Yangtze estuary. Ocean. Eng. 2020, 4, 11–18. [Google Scholar]
- Cheng, H.Q.; Li, M.T.; Zhou, T.Y.; Xue, Y.Z. High-resolution micro-topography movement in the Changjiang Estuary. Ocean. Eng. 2002, 20, 91–95. [Google Scholar]
- Wu, J.; Wang, Y.; Cheng, H. Bedforms and bed material transport pathways in the Changjiang (Yangtze) Estuary—Science Direct. Geomorphology 2009, 104, 175–184. [Google Scholar] [CrossRef]
- Li, B.; Yan, X.X.; He, Z.; Chen, Y.; Zhang, J.H. Impacts of the Three Gorges Dam on the bathymetric evolution of the Yangtze River Estuary. Chin. Sci. Bull. 2015, 60, 1735–1744. [Google Scholar] [CrossRef]
- Zhang, S.W.; Wang, J.T.; Ning, L.I.; Yan, X.J. Dissolved organic carbon and nitrogen in Changjiang Estuary and adjacent sea areas in spring. Mar. Environ. Sci. 2013, 32, 33–37. [Google Scholar]
- Zhang, S. Temporal and Spatial Variation of Tidal Range in the Changjiang Estuary and Its Environmental Significance. Master’s Thesis, East China Normal University, Shanghai, China, 2019. [Google Scholar]
- Yu, H.; Xian, W. The environment effect on fish assemblage structure in waters adjacent to the Changjiang (Yangtze) River estuary (1998–2001). J. Oceanol. Limnol. 2009, 27, 443–456. [Google Scholar] [CrossRef]
- Song, D.; Wang, X.H. Suspended sediment transport in the Deepwater Navigation Channel, Yangtze River Estuary, China, in the dry season 2009: 2. Numerical simulations. J. Geophys. Res. Ocean. 2013, 118, 5568–5590. [Google Scholar] [CrossRef]
- Cao, J.; Li, R.; Zhu, Y. Study on Saltwater Intrusion in the Yangtze River Estuary by 3D Numerical Model. In Proceedings of the 2008 International Workshop on Education Technology and Training & 2008 International Workshop on Geoscience and Remote Sensing, Washington, DC, USA, 21–22 December 2008; pp. 81–84. [Google Scholar]
- Chen, C.; Beardsley, R.C.; Cowles, G. An unstructured-grid finite-volume coastal ocean model (FVCOM) system. Oceanography 2006, 19, 78–89. [Google Scholar] [CrossRef]
- Chen, C.; Liu, H.; Beardsley, R.C. An unstructured, finite-volume, three-dimensional, primitive equation ocean model: Application to coastal ocean and estuaries. J. Atmos. Ocean. Technol. 2003, 20, 159–186. [Google Scholar] [CrossRef]
- Yang, Z.; Shao, W.; Ding, Y.; Shi, J.; Ji, Q. Wave Simulation by the SWAN Model and FVCOM Considering the Sea-Water Level around the Zhoushan Islands. J. Mar. Sci. Eng. 2020, 8, 783. [Google Scholar] [CrossRef]
- Xue, P.; Chen, C.; Ding, P.; Beardsley, R.C.; Lin, H.; Ge, J.; Kong, Y. Saltwater intrusion into the Changjiang River: A model-guided mechanism study. J. Geophys. Res. Ocean. 2009, 114, C02006. [Google Scholar] [CrossRef]
- Chen, C.; Qi, J.; Li, C.; Beardsley, R.C.; Lin, H.; Walker, R.; Gates, K. Complexity of the flooding/drying process in an estuarine tidal-creek salt-marsh system: An application of FVCOM. J. Geophys. Res. Ocean. 2008, 8, 783. [Google Scholar] [CrossRef]
- Josey, S.A.; Kent, E.C.; Taylor, P.K. Wind stress forcing of the ocean in the SOC climatology: Comparisons with the NCEP-NCAR, ECMWF, UWM/COADS, and Hellerman and Rosenstein datasets. J. Phys. Oceanogr. 2002, 32, 1993–2019. [Google Scholar] [CrossRef]
- Deng, Z.; Lu, Z.; Wang, G.; Wang, D.; Zhao, X. Extraction of fractional vegetation cover in arid desert area based on Chinese GF-6 satellite. Open Geosci. 2021, 13, 416–430. [Google Scholar] [CrossRef]
- Zhang, Q.; Li, Z.; Xia, C.; Chen, J.; Peng, D. Tree Species Classification based on the New Bands of GF-6 Remote Sensing Satellite. J. Geo-Inf. Sci. 2019, 21, 1619–1628. [Google Scholar]
- Li, X.; Tan, X.; Liu, Q.; Liu, S. Application of Gaofen-6 wide-field data in forest fire identification: A case study of Hanma Nature Reserve in Greater Hinggan Mountains, Inner Mongolia. Satell. Appl. 2019, 9, 41–44. [Google Scholar]
- Cai, L.; Zhou, M.; Liu, J.; Tang, D.; Zuo, J. HY-1C Observations of the Impacts of Islands on Suspended Sediment Distribution in Zhoushan Coastal Waters, China. Remote Sens. 2020, 12, 1766. [Google Scholar] [CrossRef]
- Zhang, M.; Guo, B. Retrieval of Suspended Sediment Concentration in Zhoushan Coastal Area Satellite Based on GF-1. Ocean. Dev. Manag. 2011, 35, 126–131. [Google Scholar]
- Yang, A.; Zhong, B.; Hu, L.; Wu, S.; Xu, Z.; Wu, H.; Wu, J.; Gong, X.; Wang, H.; Liu, Q. Radiometric Cross-Calibration of the Wide Field View Camera Onboard GaoFen-6 in Multispectral Bands. Remote Sens. 2020, 12, 1037. [Google Scholar] [CrossRef]
- Yuan, J.G.; Niu, Z.; Wang, X.P. Atmospheric Correction of Hyperion Hyperspectral Image Based on FLAASH. Spectrosc. Spectr. Anal. 2009, 29, 1181–1185. [Google Scholar]
- Qu, J.; Wang, C.; Wang, Z. Data Fusion Based Technology for Remote Sensing Image Processing. J. Image Graph. 2002, 7, 985–993. [Google Scholar]
- Sun, W.; Chen, B.; Messinger, D.W. Nearest-neighbor diffusion-based pan-sharpening algorithm for spectral images. Opt. Eng. 2013, 53, 013107. [Google Scholar] [CrossRef]
- Cai, L.; Tang, D.; Levy, G.; Liu, D. Remote sensing of the impacts of construction in coastal waters on suspended particulate matter concentration—The case of the Yangtze River delta, China. Int. J. Remote Sens. 2016, 37, 2132–2147. [Google Scholar] [CrossRef]
- Wang, Y.; Feng, Y.; Zhang, P.; Dong, W.; Ying, Z. Remote sensing parameter model of suspended sediment and its application in the Yangtze River estuary. In Proceedings of the Geoinformatics 2007: Remotely Sensed Data and Information, Nanjing, China, 25–27 May 2007; International Society for Optics and Photonics: Bellingham, WA, USA, 2007; Volume 6752. [Google Scholar]
- Li, L.; Zhu, J.; Wu, H.; Wang, B. A numerical study on water diversion ratio of the Changjiang (Yangtze) estuary in dry season. Chin. J. Oceanol. Limnol. 2010, 28, 700–712. [Google Scholar] [CrossRef]
- Xiang, Z.; Yu, X. Characteristic Analyses of Sediment Yielding, Transportation and sedimentation in Y angtze River. J. Yangtze River Sci. Res. Inst. 1990, 7, 9–19. [Google Scholar]
- Yang, Y.P.; Li, Y.T.; Sun, Z.H.; Fan, Y.Y.; Deng, J.-Y. Relation between sediment carrying capacity and runoff/tidal dynamic in Yangtze Estuary. Shuidonglixue Yanjiu Yu Jinzhan/Chin. J. Hydrodyn. Ser. A 2013, 28, 274–282. [Google Scholar]
- Hong, L.; He, Q.; Wang, Z.; Weltje, G.J.; Zhang, J. Dynamics and spatial variability of near-bottom sediment exchange in the Yangtze Estuary, China. Estuar. Coast. Shelf Sci. 2010, 86, 322–330. [Google Scholar]
- Zuo, S.; Li, J.; Wan, X.; Shen, H.; Fu, G. Characteristics of temporal and spatial variation of suspended sediment concentration in the Changjiang Estuary. J. Sediment Res. 2006, 3, 68–75. [Google Scholar]
- Tamura, T.; Horaguchi, K.; Saito, Y.; Nguyen, V.L.; Tateishi, M.; Ta, T.K.O.; Nanayama, F.; Watanabe, K. Monsoon-influenced variations in morphology and sediment of a mesotidal beach on the Mekong River delta coast. Geomorphology 2010, 116, 11–23. [Google Scholar] [CrossRef]
- Geng, H.; Zhang, H.; Hong, Y.; Hu, G. Calculation and characteristic analyses of wind wave fields in the Yangtze Estuary. Hydro-Sci. Eng. 2020, 5, 48–56. [Google Scholar]
- Wei, S.; Wang, M. Satellite observations of the seasonal sediment plume in central East China Sea. J. Mar. Syst. 2010, 82, 280–285. [Google Scholar]
- Liu, J.P.; Xu, K.H.; Li, A.C.; Milliman, J.D.; Velozzi, D.M.; Xiao, S.B.; Yang, Z.S. Flux and fate of Yangtze River sediment delivered to the East China Sea. Geomorphology 2007, 85, 208–224. [Google Scholar] [CrossRef]
- Shen, H.; He, S.; Pan, D.; Li, J. A study of turbidity maximum in the Changjiang estuary. Acta Geogr. Sin. 1992, 47, 472–479. [Google Scholar]
- Zhou, X. Climate Characteristics of Sea Surface Temperature (SST) Variation in the Changjiang Estuary. Master’s Thesis, Ocean University of China, Qingdao, China, 2005. [Google Scholar]
- Liu, X. Seasonal Variation Research Of Suspended Sediments in the East China Sea Based on Remote Sensing. Master’s Thesis, Ocean University of China, Qingdao, China, 2014. [Google Scholar]
- Liu, Z. Retrieval and Analysis of Surface Suspended Sediment Concentration by Remote Sensing in Yangtze River Estuary. Doctoral Thesis, East China Normal University, Shanghai, China, 2007. [Google Scholar]
- Chen, S.L.; Zhang, G.A.; Yang, S.L.; Shi, J.Z. Temporal variations of fine suspended sediment concentration in the Changjiang River estuary and adjacent coastal waters, China. J. Hydrol. 2006, 331, 137–145. [Google Scholar] [CrossRef]
- Ju, L.Y.; Chang, Q.R.; Yang, X.M.; Liu, J. Remote sensing detection of suspended sediment in the Yangtse River Estuary by MODIS images. J. Northwest Sci-Tech Univ. Agric. For. 2005, 33, 117–121. [Google Scholar]
- Shi, Z. Behaviour of fine suspended sediment at the North passage of the Changjiang Estuary, China. J. Hydrol. 2004, 293, 180–190. [Google Scholar] [CrossRef]
- Yun, C. Recent Evolution of the Yangtze River Estuary; China Ocean Press: Beijing, China, 2004. [Google Scholar]
- Jie, W.; He, X.; Bao, Y. Anthropogenic impacts on suspended sediment load in the Upper Yangtze river. Reg. Environ. Change 2011, 11, 857–868. [Google Scholar]
- Yang, S.L.; Shi, Z.; Zhao, H.Y.; Li, P.; Dai, S.B.; Gao, A. Effects of human activities on the Yangtze River suspended sediment flux into the estuary in the last century. Hydrol. Earth Syst. Sci. 2004, 8, 1210–1216. [Google Scholar] [CrossRef]
- Milliman, J.D. Blessed dams or damned dams? Nature 1997, 386, 325–327. [Google Scholar] [CrossRef]
- Syvitski, J.; Voeroesmarty, C.J.; Kettner, A.J.; Green, P. Impact of Humans on the Flux of Terrestrial Sediment to the Global Coastal Ocean. Science 2005, 308, 376–380. [Google Scholar] [CrossRef]
- Walling, D.E. Human impact on land–ocean sediment transfer by the world’s rivers. Geomorphology 2006, 79, 192–216. [Google Scholar] [CrossRef]
- Shen, F.; Zhou, Y.; Li, J.; He, Q.; Verhoef, W. Remotely sensed variability of the suspended sediment concentration and its response to decreased river discharge in the Yangtze estuary and adjacent coast. Cont. Shelf Res. 2013, 69, 52–61. [Google Scholar] [CrossRef]
- Dai, Z.; Fagherazzi, S.; Mei, X.; Gao, J. Decline in suspended sediment concentration delivered by the Changjiang (Yangtze) River into the East China Sea between 1956 and 2013. Geomorphology 2016, 268, 123–132. [Google Scholar] [CrossRef]
- Chen, J.; Chen, S. Estuarine and coastal challenges in China. Chin. J. Oceanol. Limnol. 2002, 20, 174–181. [Google Scholar]
- Vörösmarty, C.J.; Meybeck, M.; Fekete, B.; Sharma, K.; Green, P.; Syvitski, J.P.M. Anthropogenic sediment retention: Major global impact from registered river impoundments. Glob. Planet. Change 2003, 39, 169–190. [Google Scholar] [CrossRef]
- Li, P.; Yang, S.; Dai, s.B.; Zhang, W. Accretion/erosion of the subaqueous delta at the Yangtze Estuary in recent 10 years. Acta Geogr. Sin. 2007, 62, 707–716. [Google Scholar]
- Huanting, S.; Haigen, X.; Xiangqi, M. Study on the improvement of sea-entering waterway in the Changjiang Estuary. China Ocean. Eng. 1992, 6, 361–368. [Google Scholar]
- Lu, Z.; Lu, Y.; Song, S.; Guan, X.; Huang, G. Study on the Relationship between the Construction of Qingcaosha Reservoir and the Comprehensive Regulation of Changjiang Estuary. Water Wastewater Eng. 2009, 1, 55–58. [Google Scholar]
- Chen, W.; Wei, W. Influence of Qingcaosha Reservoir Project on riverbed erosion and deposition. Adv. Sci. Technol. Water Resour. 2018, 38, 44–50. [Google Scholar]
- Yi, C.; Meng, Z. Predicting the function of spur-dike group restricting rivers based on SVM. Hydro-Sci. Eng. 2019, 3, 25–31. [Google Scholar]
- Xu, H.; Huang, Z.; Bai, Y.; Bai, Y. Effects of Flow Circulations on the Sediment Dynamics in the Deep-water Navigation Channel of the Yangtze River Estuary. J. Coast. Res. 2020, 95, 723a–727a. [Google Scholar] [CrossRef]
- Pan, L.; Ding, P.; Ge, J.; Hu, K. Analysis of influence of Deep Waterway Project on morphological change in North Passage of Changjiang Estuary. J. Sediment Res. 2011, 5, 9. [Google Scholar]
- Liu, J. Study on Morphological Evolution and Siltation in Deep Waterway Due to Channel Reconstruction in the North Passage, Yangtze Estuary. Doctoral Thesis, East China Normal University, Shanghai, China, 2008. [Google Scholar]
- Xu, H.; Huang, Z.; Bai, Y.; Su, L.; Hong, Y.; Lu, T.; Wang, X. Numerical analysis of sediment deposition in Yangtze river estuary: Insight from conceptual estuary models. Appl. Ocean. Res. 2020, 104, 102372. [Google Scholar] [CrossRef]
- Yang, W. Research of Factors Leading to Variation of Ebb-Tide Sediment Diversion Ratios in the South and North Passage in the Changjiang Estuary. Master’s Thesis, East China Normal University, Shanghai, China, 2017. [Google Scholar]
- Kuang, C.; Chen, W.; Gu, J.; He, L. Comprehensive analysis on the sediment siltation in the upper reach of the deepwater navigation channel in the Yangtze Estuary. J. Hydrodyn. 2014, 26, 299–308. [Google Scholar] [CrossRef]
- Yang, Y.; Zhang, M.; Li, Y.; Zhang, W. The variations of suspended sediment concentration in Yangtze River Estuary. J. Hydrodyn. 2015, 27, 845–856. [Google Scholar] [CrossRef]
- Pasiok, R.; Stilger-Szydło, E. Sediment particles and turbulent flow simulation around bridge piers. Arch. Civ. Mech. Eng. 2010, 10, 67–79. [Google Scholar] [CrossRef]
- Liu, H. Hydrodynamic problems associated with construction of sea-crossing bridges. J. Hydrodyn. Ser. B 2006, 18 (Suppl. 3), 13–18. [Google Scholar] [CrossRef]
- Olsen, N.R.B.; Kjellesvig, H.M. Three-dimensional numerical flow modeling for estimation of maximum local scour depth. J. Hydraul. Res. 1998, 36, 579–590. [Google Scholar] [CrossRef]
- Zhou, C.; Gao, N.-Y.; Zhao, S.; Chu, W. Evaluation of water quality in Qingcaosha reservoir of Shanghai. Tongji Daxue Xuebao/J. Tongji Univ. 2012, 40, 894–899. [Google Scholar]


Publisher’s Note: MDPI stays neutral with regard to jurisdictional claims in published maps and institutional affiliations. |
© 2022 by the authors. Licensee MDPI, Basel, Switzerland. This article is an open access article distributed under the terms and conditions of the Creative Commons Attribution (CC BY) license (https://creativecommons.org/licenses/by/4.0/).