1. Introduction
In recent years, with the development of earth observation technology, object detection of remote sensing images has gradually become a research hotspot. Remote sensing images can be divided into aerial images and satellite images, and the acquisition of images is usually done by shooting, scanning or microwave radar. Optical remote sensing images are remote sensing images captured by cameras in the visible wavelength range (0.38–0.76 microns), which are extremely rich in shape, texture and color information and constitute the most prevalent types of remote sensing images.
Optical remote sensing image target detection uses specially designed algorithms to find and mark targets of interest (hills, lakes, grounds, buildings, vehicles, aircraft, ships etc.) in images and is an important tool for accomplishing tasks, such as land use, urban planning, traffic diversion, military monitoring and maritime rescue, and is of paramount importance in the field of remote sensing image processing [
1,
2,
3].
Early optical remote sensing image target detection algorithms used the manual design of features. Despite the widely varying designs of algorithms, at a macro level the ideas are broadly the same: First, to determine the candidate region; Secondly, to detect the features that are designed manually according to the characteristics of the target; Thirdly, a classifier is normally used to classify the category of the target to be detected [
4,
5,
6,
7,
8,
9]. Stankov improved the hit-or-miss transform (HMT) and proposed Percentage Occupancy HMT (POHMT) for detecting building locations and invoking vegetation masks to eliminate irrelevant factors [
4].
Leninisha et al. proposed a geometric active deformation model based on width and color for extracting a road network from remotely sensed images with minimum human interference. However, the model is inadequate for the detection of complex urban roads [
5]. Focusing on the shadows cast by buildings, Ok proposed a shadow post-processing method that uses a probabilistic landscape approach to model the directional spatial relationship between buildings and their shadows, which, in turn, automatically detects building targets in ultra-high resolution multispectral images [
6].
Du et al. effectively used a robust anomaly degree measure to improve separability between anomalous pixels and other background pixels. They first distinguished the target from the background using popular features and then used metric learning methods to obtain a robust anomaly degree measure [
7]. However, these algorithms have many drawbacks.
For instance, determining candidate regions generally requires setting sliding windows on the image, and most of the generated candidate regions are not the final desired regions, resulting in a large number of redundant calculations and high time complexity. Manually designed features are mainly based on the visual information of the target, and the features are easy to understand but poorly expressed, while the robustness and adaptability of the features are low, making them difficult to adopt in various scenarios.
In addition, unlike common optical images taken on the ground, optical remote sensing images are generally taken from high altitudes, and the quality of the images is easily affected by the environment, climate and light. At the same time, due to the long shooting distance, the scale of the target in the optical remote sensing image varies greatly, and the contour and texture information are not as good as in common optical images, as shown in
Figure 1. With the continuous innovation of remote sensing technology, remote sensing images have a higher resolution and larger scale, and the information contained in the images is richer. In this case, earlier detection algorithms will be more complicated in design, and the detection effect cannot meet the actual demand.
In 2006, Hinton proposed a solution to the problem of gradient disappearance during the training of deep neural networks, and since then, deep neural networks have gradually gained recognition. Deep neural networks can extract deeper abstract features, that are not intuitively understood but have more powerful semantic representations and discriminative properties. Once proposed, deep neural networks dramatically improved the detection accuracy of multi-category targets in images and have received wide attention.
After more than a decade of development, deep neural networks have gradually matured, and many high-level network design solutions have emerged, becoming the mainstream algorithm for solving object detection problems [
10,
11,
12,
13,
14,
15,
16,
17,
18,
19,
20]. Among these methods, Faster-RCNN [
10] provides a new idea to accomplish the task of multi-category target detection for images on an efficient and high accuracy basis. Like other deep neural networks, Faster-RCNN uses convolutional and pooling layers for the down-sampling and computation of feature maps, but instead of Selective Search (SS), Faster-RCNN introduces the ‘Anchor’ approach for generating proposals and proposes a novel Region Proposal Network (RPN).
The RPN reduces the generation speed of proposal to 10 ms, and thus can focus the training time on feature extraction and classification, which reduces the training cost and improves the detection accuracy. However, the Faster-RCNN contains two networks, making it difficult to meet the requirement of real-time detection. YOLO [
11] was proposed to solve the problem of real-time detection with the ability to divide the extracted high-stage feature map into
cells directly, and perform bounding box regression for each cell. YOLO is more efficient than Faster-RCNN, which contains only one network.
SSD [
12] combines the “Anchor” of Faster-RCNN and the “Cell” of YOLO, using convolutional layers to extract multi-stage features, generating proposals of different sizes and proportions on each convolutional layer for training using the Prior Box algorithm and finally eliminating the redundant boxes using the Non-Maximum Suppression (NMS) algorithm. Compared with Faster-RCNN and YOLO, SSD edges ahead in terms of detection accuracy and detection efficiency.
In contrast to the manual feature design approach, deep neural networks directly integrate identifying candidate regions, learning effective features and feature classifiers to achieve end-to-end detection. Deep learning learns features with stronger semantic characterization ability, driven by large amounts of image data, with greatly improved performance, while avoiding the redundant computation of a large number of windows during the forward propagation of the neural network and improving the detection speed.
The above methods have achieved remarkable results in the task of detecting multi-category targets in images, but they are oriented to common optical images, and the effect of detection in optical remote sensing images is not ideal. As can be seen from
Figure 1, optical remote sensing images do not contain as rich of feature information as common optical images, while the scale variation range is large, and there are too many small scale targets. Therefore, how to design special algorithms adapted to the target detection in optical remote sensing images is an urgent problem for experts in this field.
After several years of unremitting efforts, experts around the world have designed a large number of improved algorithms to effectively improve the performance of object detection in the field of optical remote sensing images [
21,
22,
23,
24,
25,
26,
27,
28,
29,
30,
31,
32]. Cheng et al. added a rotation-invariant layer to the convolutional neural network and proposed a novel rotation-invariant convolutional neural network (RICNN) model. The model achieves rotation invariance by optimizing a new objective function for training, by imposing regularization constraints, and by specifying that the feature representations of the training samples before and after rotation must be mapped to each other [
21].
Han et al. found that the proposal generation network and feature classification network of the Faster-RCNN are two separate parts, which are not efficient in training and detection. They compared the acquisition method and annotation method of optical remote sensing images and common optical images and proposed that the annotation of optical remote sensing images is costly. Therefore, to address these problems, Han improved the Faster-RCNN and proposed an efficient and robust integrated geospatial target detection framework named R-P-Faster-RCNN.
R-P-Faster-RCNN shares features in the proposal generation phase and target detection phase and achieves the integration of both, thus improving the network training and detection efficiency. The model uses common optical images for pre-training and optical remote sensing images for fine-tuning during training, thus, solving the problem of expensive optical remote sensing image annotation [
22]. Ren et al. argued that the building blocks of standard convolutional neural networks have a fixed geometric structure and are, therefore, limited in geometric transformations.
To eliminate this effect, Ren integrated a deformable convolutional module in the Faster-RCNN. This module is capable of unsupervised learning of the augmented spatial sampling locations in the module. In addition, they generated a single high-level feature map with fine resolution on which predictions can be made using top-down and skip connections. Ren et al. named this Def. Faster-RCNN, and the network shows more significant results on the SORSI and HRRS datasets [
23].
Xu et al. proposed a deformable region-based fully convolutional network (Def. R-FCN) to remove the obvious limitation of convolutional neural networks for modeling geometric changes of remote-sensing targets. For training, Xu et al. first pre-trained using natural images and subsequently fine-tuned using ultra-high resolution remotely sensed images. To compensate for the increased number of lines, such as false region suggestions, an aspect-ratio-constrained non maximum suppression (arcNMS) was designed [
24].
Li et al. proposed a rotation-insensitive and context-augmented object detection network (RICADet) to solve the problem of rotation change sensitivity and blurred appearance in remote sensing images. The network contains an improved region suggestion network and a local context feature fusion network to solve the above two types of problems, respectively, and a comprehensive evaluation on a publicly available ten object detection datasets demonstrates the effectiveness of the network [
25].
Guo et al. proposed a multi-scale convolutional neural network (Multi-Scale CNN) to accomplish geospatial object detection in high-resolution satellite images. The network consists of a multi-scale object suggestion network and a multi-scale target detection network, where high-quality proposals are proposed by the multi-scale object suggestion network, and the proposals are trained using the multi-scale target detection network to generate a good target detector [
26].
The above networks are indeed effective for optical remote sensing images; however, there is still much room for improvement in detection accuracy. In particular, they are not ideal for the detection of blurred small-scale targets in optical remote sensing images. In order to further improve the detection accuracy of optical remote sensing image targets, this paper proposes a Multi-stage Feature Enhancement Pyramid Network (Multi-stage FEPN).
This network can generate multi-stage feature maps and effectively fuse adjacent high-stage feature maps with low-stage feature maps to enrich the feature information contained in the feature maps. At the same time, the Multi-stage FEPN introduces a feature enhancement module to highlight useful features and improve the target classification accuracy and localization precision.
We detail the structure and the highlighted design parts of Multi-stage FEPN as well as the datasets and evaluation metrics chosen for this paper in
Section 2. In
Section 3, we use a unified dataset to compare the above introduced Faster-RCNN [
10], YOLO [
11], SSD [
12], RICNN [
21], R-P-Faster-RCNN [
22], Def. Faster-RCNN [
23], Def. R-FCN [
24], RICADet [
25], Multi-Scale CNN [
26] and the Multi-stage FEPN proposed in this paper to demonstrate that Multi-stage FEPN works better than other networks in optical remote sensing image target detection tasks.
2. Materials and Methods
2.1. Network Architecture
We propose a novel deep convolutional neural network with reference to the design idea of FPN [
33]. In the feature map generation stage, as in the FPN, we use a combination of bottom-to-top branch, up-to-down branch and lateral connection branch to complete the process. The bottom-to-top branch uses the ResNet-101 network to extract multi-stage feature maps group {C1, C2, C3, C4, C5}.
In the up-to-down branch, we first max-pool C5 to obtain P6, then use the Content-Aware Feature Up-Sampling (CAFUS) algorithm to up-sample P6 to the scale of C5, use convolution on C5 to change the number of channels, and finally fuse P6 and C5 to obtain P5. Similarly, we obtain P4, P3 and P2 and combine them with P5 to obtain the feature pyramid {P2, P3, P4, P5}. In order to further enhance the representation ability of the feature maps, we introduce a Feature Enhancement Module (FEM) to modify the features and finally obtain more optimized feature maps group {F2, F3, F4, F5}.
After obtaining the feature map sets, we generate proposals using RPN and fix the proposals into unique scales using RoI Align. We use two fully connected layer branches to compute the category scores and location regression parameters of the modified proposals to finally complete the classification and localization of the targets. To reduce the complexity of training, an adaptive mapping of the generated proposals onto feature maps is performed to calculate the training losses and adjust the network parameters according to the scales of the labeled boxes. The structure of the network proposed in this paper is shown in
Figure 2.
2.2. Content-Aware Feature Up-Sampling
In the process of feature pyramid generation, the fusion of feature maps of adjacent stages is a problem that needs to be focused on. The feature maps at different stages have different scales, and each feature map expresses different feature information. Therefore, it is extremely important to design an effective feature map up-sampling and fusion algorithm. Traditional feature pyramid networks mainly use interpolation [
34] for up-sampling higher-stage feature maps, including nearest neighbor interpolation, bilinear interpolation and bicubic interpolation.
Interpolation is a purely mathematical algorithm that only calculates the new pixels after up-sampling based on the pixel positions and does not fully utilize the semantic information of the image. At the same time, the perceptual field of the interpolation method is usually small and the computed image can be distorted, while increasing the perceptual field can lead to a significant increase in computational cost. Therefore, the use of interpolation to upsample higher-stage feature maps can only solve the problem of different scales, and the noise introduced in the process will weaken the representation ability of the feature maps to a certain extent.
In addition to the interpolation method, current image up-sampling algorithms include deconvolution [
35] and dynamic filters [
36]. The deconvolution method can improve the above problems to some extent by learning the kernel parameters through convolutional networks without considering the pixel positions. However, this method does not consider local semantics and uses the same convolutional kernel for each local region, which still cannot effectively restore local feature information, and the computational effort grows exponentially when the convolutional kernel design is too large. The dynamic filtering method designs a convolutional kernel for each position of the image, which is conceivably too large a number of parameters for practical applications.
Content-Aware ReAssembly of Features (CARAFE) [
37] is a learnable image up-sampling algorithm based on the input content, which divides the feature map up-sampling into two parts, i.e., up-sampling kernel prediction and feature reassembly. Experiments show that CARAFE has a large perceptual field, and the model is light enough to retain the feature information of the input better. CARAFE will also enhance the feature semantics to an extent. In this paper, we design a new image up-sampling algorithm, named Content-Aware Feature Up-Sampling, as shown in
Figure 3.
Unlike CARAFE, the feature modification kernel of CAFUS is predicted from the input image but does not act directly on the input. Instead, it is applied to the input image after interpolation. CAFUS can make up for the shortcomings of the interpolation method by introducing learnable parameters to fine-tune the interpolated image and maximize the retention of the semantic information of the higher-stage feature map. At the same time, CAFUS has a simple structure and does not introduce overly many learning parameters, thus, ensuring the training efficiency.
2.3. Feature Enhance Module
Although CAFUS is able to preserve the detail information inside the image during the up-sampling of higher-stage feature maps and enhance the representation ability of the feature maps, the fusion of adjacent-stages feature maps only uses the convolutional “summing” method to fuse multi-channels information. In order to solve this problem, this paper proposes a feature weighting algorithm to further enhance the feature information, i.e., the Feature Enhance Module. The algorithm principle of the FEM is shown in
Figure 4. The FEM assigns weights to the feature maps from two directions, thus, enhancing the useful features.
In the spatial direction, the fused feature map contains both target features and background information. The feature map is to be modified along the two-dimensional spatial direction to enhance the target features. The specific weight parameters are calculated as shown in Equations (1) and (2). In Equation (2),
represents the multiplication of elements in the corresponding position.
In the channel direction, as each level of the feature map group contains 256 channels, not every channel of the two-dimensional feature map can contain the target feature information well. Therefore, feature map channel weights are introduced to assign a coefficient to each channel so that the feature maps containing the target features in the feature map sets can be used to greater effect. The feature map channel weight parameters are calculated as shown in Equations (3)–(5). In Equation (4),
represents a sigmoid function, and
represents a ReLU activation function.
Finally, the features modified in both directions are fused together, as shown in Equation (6), and the fused feature map will contain stronger feature information.
2.4. Loss Function
The training of deep convolutional neural networks is a process of iterative optimization of network model parameters. Typically, the network first computes the category score loss as well as the position loss for each proposed box in the forward direction, and updates the network model parameters in the reverse direction based on the obtained losses, i.e., back-propagation of losses. Therefore, in the training process of deep neural networks, using a reasonable loss function can achieve better convergence of the network parameters and better detection accuracy of the network. In this paper, different loss functions for the proposal generation part and the feature classification parts are applied to calculate the loss values of each part, as shown in Equations (7)–(11).
For the category loss, the cross-entropy function is used to calculate the loss. Cross-entropy is simple in design and can automatically adjust the learning speed of the network parameters according to the loss size when back-propagating to avoid overfitting, which can effectively calculate the loss for multi-category classification tasks. For location loss, we use the smooth-L1 function for calculation. Smooth-L1 sets a constant 1 as the back-propagation gradient for points with large loss values, while, for points with small loss values, the backpropagation gradient decreases as the loss value decreases, and thus smooth-L1 is insensitive to outliers.
where
represents the number of images in one mini-batch at training,
represents the number of anchors generated in each image, and
represents the balance factor.
is the category score vector of the proposal box,
represents the label of the proposal box,
represents the position parameter of the proposal box, and
refers to the position parameter of the ground truth box.
where
denotes the category score predicted by the network,
represents the score of the ground truth,
represents the coordinate of the ground truth, and
represents the coordinate of the predicted box.
2.5. Dataset Selection and Data Augmentation
As deep neural networks become the dominant algorithm for remote sensing image processing, the demand for remote sensing images is increasing, and therefore many teams have open-sourced remote sensing image datasets for use by other scholars. Among them, some typical remote sensing image datasets include DOTA (a large-scale Dataset for Object deTection in Aerial images) [
38], UCAS-AOD (UCAS-High Resolution Aerial Object Detection Dataset) [
39], NWPU VHR-10 (NWPU very-high resolution optical remote sensing images with 10 categories) [
1,
21,
40], RSOD-Dataset (Remote sensing object detection) [
41,
42], the INRIA Aerial Image Labeling Dataset [
43] and the TGRS-HRRSD-Dataset [
44].
DOTA was co-produced by State Key Laboratory of Information Engineering in Surveying, Mapping and Remote Sensing and School of Electronic Information and Communications, HUST and consists of 2806 remotely sensed images with targets containing a total of 188,282 instances in 15 categories. UCAS-AOD was compiled and labeled by the Pattern Recognition and Intelligent Systems Development Laboratory of the University of Chinese Academy of Sciences. It consists of 910 remote sensing images with only two categories of targets, aircraft and vehicles, with negative background samples totaling 8066 instances.
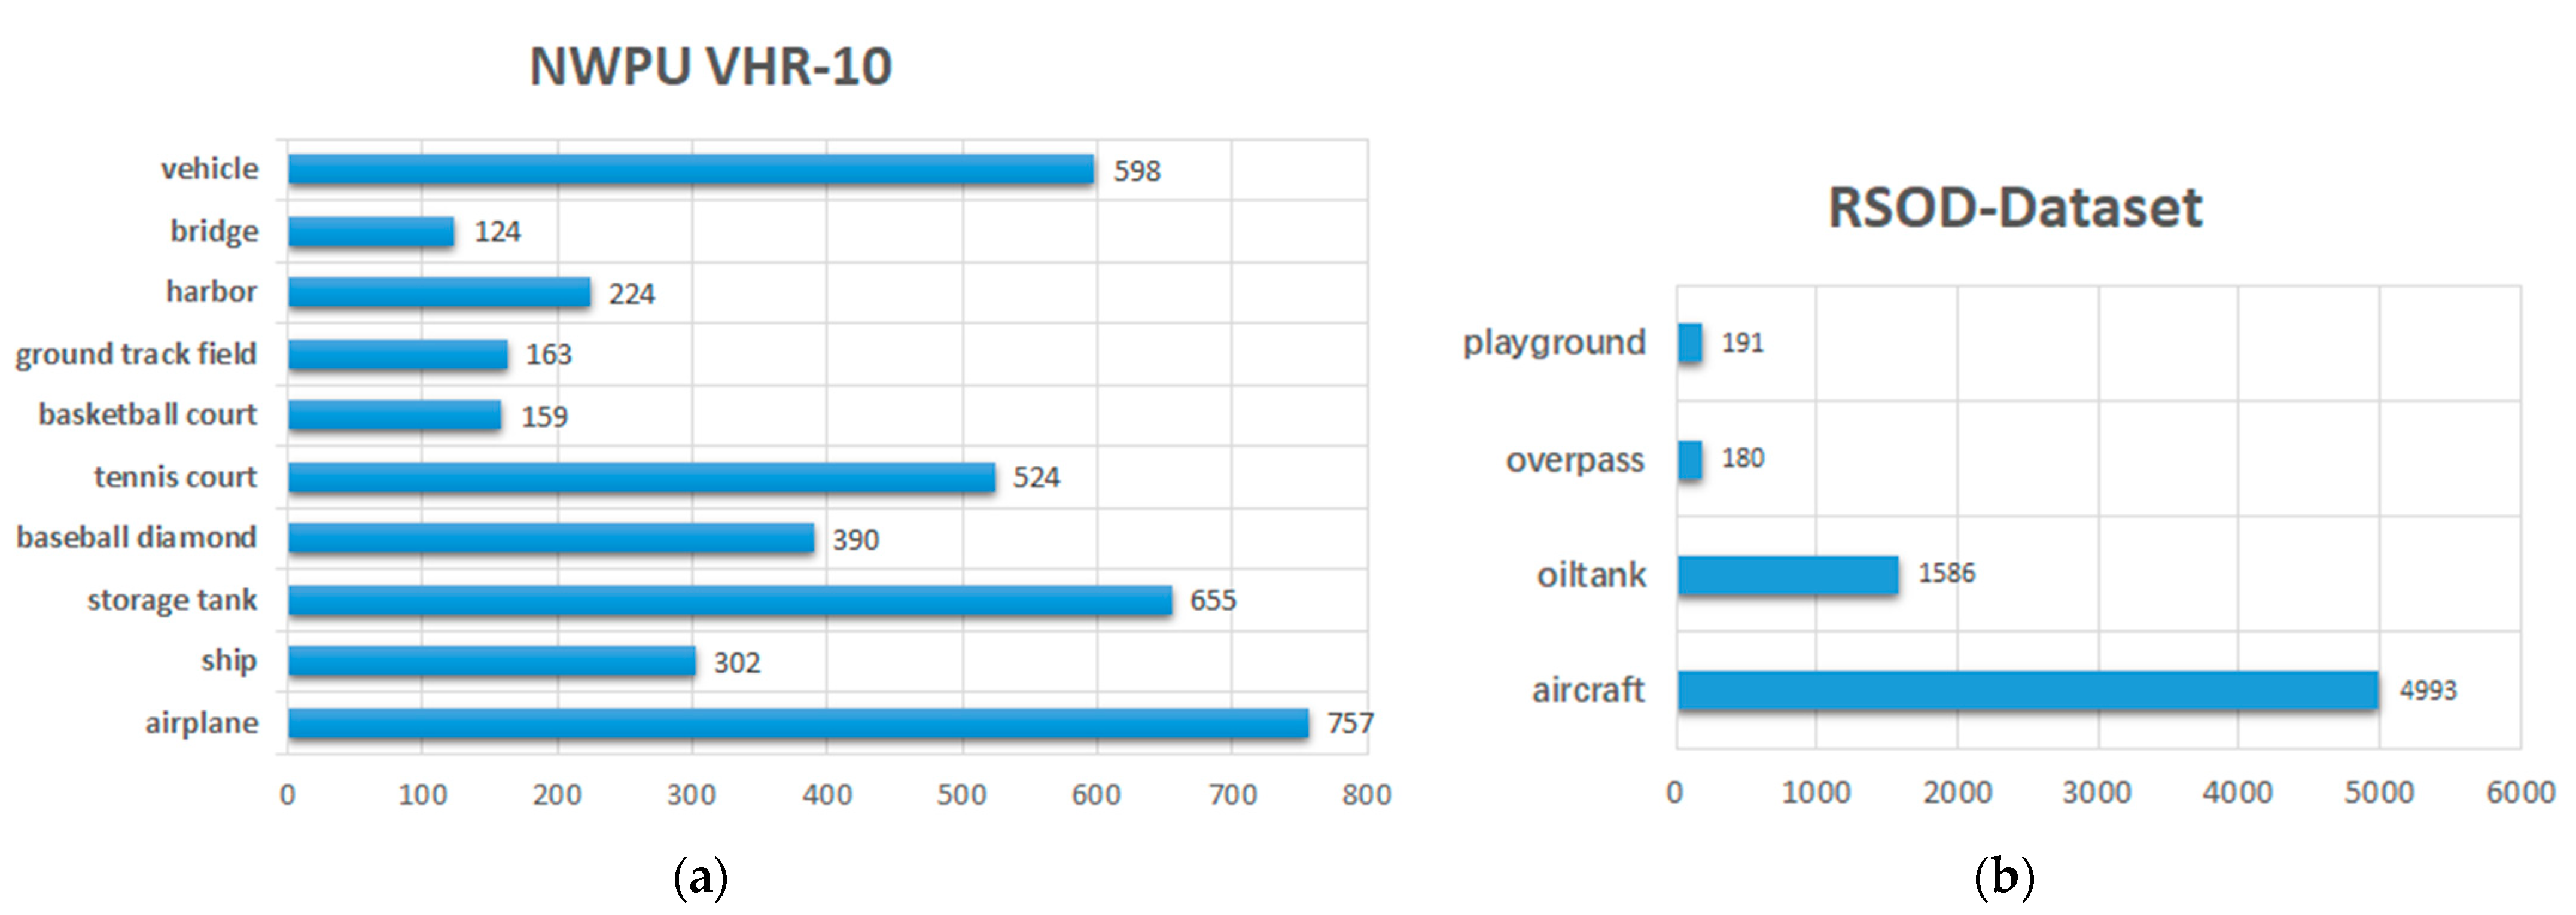
NWPU VHR-10 contains 800 high-resolution satellite images cropped from the Google Earth and Vaihingen datasets and then manually annotated by NWPU experts. Among them, 650 images carry labeled targets, with a total of 10 categories and 3896 instances. RSOD-Dataset was labeled by a team from Wuhan University, and the dataset contains 976 images divided into four categories with a total of 6950 instances (4993 instances belong to the category of “aircraft”, accounting for 71.8%).
The INRIA Aerial Image Labeling Dataset is a dataset for urban building detection, collected and labeled by the French National Institute for Information and Automation. It has only two categories, building and not building, and is semantically segmented at the pixel level. The TGRS-HRRSD-Dataset was collected and labeled by the Xi’an Institute of Optical Precision Machinery, Chinese Academy of Sciences. It contains 13 categories of objects, more than 21,000 images and more than 40,000 instances.
Considering the training cost and data diversity, we decided to select NWPU VHR-10 and RSOD-Dataset as the datasets used for the experiments in this paper. The number of instances of each category in the two datasets is shown in
Figure 5, and examples of two datasets corresponding to each category are shown in
Figure 6. Compared with RSOD-Dataset, NWPU VHR-10 contains more categories and a relatively even number of instances; therefore, we used NWPU VHR-10 as the main dataset for the comparison of experimental results.
Among the 650 images in the original dataset, we randomly selected 50 images as test images and used the remaining 600 images as training dataset images. In addition, we performed data augmentation on the training set images, including horizontal flip, vertical flip, diagonal flip, random luminance and random contrast, to expand the training set to 3600 images. As for the RSOD-Dataset, 900 images were used as training dataset images, and 36 images were used as test images.
2.6. Evaluation Metrics
In image target detection tasks, the most intuitive metric to evaluate the effectiveness of a detection network is the detection accuracy, i.e., whether all targets are detected correctly. The accuracy of an image target detection network can be represented by top-1 and top-5, where top-1 represents the probability that the highest confidence category of each target prediction is correct and top-5 denotes the probability that the top five confidence categories of each target prediction contain the correct category. Early deep neural network target detection frameworks used top-1 detection accuracy and top-5 detection accuracy for combined evaluation due to low detection accuracy, and, with the gradual optimization of the network, currently only top-1 is used to represent the accuracy of the detection network.
However, the samples we tested are of finite size, and there are limitations as the accuracy is obtained by detecting a small sample of test images. Therefore, we need to evaluate a detection network model comprehensively from different perspectives. The detection results of an image target detection network can be classified into four cases, namely TP (True Positive), FP (False Positive), TN (True Negative) and FN (False Negative).
TP indicates when positive samples are predicted to be positive, FP shows when positive samples are predicted to be negative, TN represents when negative samples are predicted to be negative and FN indicates when negative samples are predicted to be positive. When a target detection network model completes the detection task, the number of samples corresponding to these four cases can be counted, and the Precision and Recall of the model can be calculated based on the counted data as shown in Equations (12) and (13).
Precision indicates the accuracy of the model’s prediction results, with higher values indicating better results. Recall indicates the proportion of correct predictions to the labeled targets, with higher values indicating that the model is more capable of recalling positive samples during training. Ideally, we would like the model to have higher Precision and Recall; however, in reality, the relationship is usually negative. Using Recall as the horizontal coordinate and Precision as the vertical coordinate, the Precision–Recall curve (P-R curve) is obtained by picking different thresholds to count the values of Recall and Precision and plotting the curves.
Following the principle that the larger the two metrics are, the better, we can believe that the larger the area surrounded by the curve and the coordinate axis, the higher the accuracy of the model, and this area is the Average Precision (AP) corresponding to each category. In the multi-category target detection task, we calculate the average of the APs corresponding to all categories to obtain Mean Average Precision (mAP), and the larger this value is, the higher the combined accuracy of the model can be.
4. Discussion
Optical remote sensing images are susceptible to the effects of environment, climate and illumination on the quality of imaging compared to common optical images. Due to the longer distance taken, certain targets are presented in optical remote sensing images at a smaller scale, i.e., small targets. Such small targets consist of fewer pixels and feature information, such as contours and textures, which is one of the pressing issues in the field of target detection in optical remote sensing images. At the same time, there are many kinds of targets to be detected in optical remote sensing images, and there are large scale variations among different kinds of targets, and thus the designed framework needs to consider multi-scale targets and small targets comprehensively to improve the overall detection accuracy.
In recent years, many studies have been proposed to improve the accuracy of small and multi-scale targets in optical remote sensing images [
45,
46,
47,
48,
49]. Collectively, a common approach to solve the small target detection problem is to use multi-stage feature maps for recognition, which is because multi-stage feature maps can enrich the features of small-scale targets, and models can rely on more feature difference information for target classification.
The methods to solve the multi-scale target detection problem usually introduce multi-scale information in the network, including multi-stage classifiers, multi-stage features quadratic fusion and loss function weighting. Although these methods can deal with the specificities of targets in optical remote sensing images, they can reduce the detection efficiency or the detection accuracy will not be sufficiently high because of insufficient feature usage.
The Multi-stage FEPN proposed in this paper adopts the idea of multi-stage feature maps fusion so that, for small targets, the feature information of low-level feature maps can be used to achieve classification, while for multiple targets with large scale variations, the appropriate stage of feature maps can be reasonably selected to generate corresponding proposals and perform classification. This method performs better in the optical remote sensing image target detection task.
In the experiments of this paper, we demonstrated that the feature map up-sampling algorithm CAFUS used in Multi-stage FEPN can improve the fusion effect of adjacent-stage feature maps, while the feature map enhancement algorithm FEM can also highlight the features effectively through the ablation experimental results in
Figure 9 and
Table 2. Therefore, the accuracy is high in detecting blurred small-scale targets, as shown in
Figure 11. Then, three target detection frameworks (Faster-RCNN, YOLO and SSD) applicable to common optical images and six target detection frameworks (RICNN, R-P-Faster-RCNN, Def. Faster-RCNN, Def. R-FCN, RICADet and Multi-Scale CNN) applicable to remote sensing images were compared in parallel, and the experimental results are recorded in
Figure 10 and
Table 3 and
Table 4.
The experimental results show that Multi-stage FEPN was better than the other frameworks in most categories of target detection accuracy, especially for small-scale targets, such as airplanes, ships, storage tanks and vehicles, which have higher detection accuracy improvement. Finally, similar experiments were conducted on RSOD-Dataset. The experimental results show that the detection ability of Multi-stage FEPN decreases on datasets with extreme sample imbalance, which becomes one of the key elements of our future research, i.e., addressing the impact of the sample imbalance problem on deep convolutional neural networks.
In this paper, we only address a small part of the remote sensing image target detection field, i.e., solving the detection problem of blurred small-scale targets and multi-scale targets in optical remote sensing images. The task of remote sensing image target detection has many essential problems that need to be focused on and broken through. For example, optical remote sensing images are sensitive to weather; therefore, it is obvious that how to attenuate or eliminate the influence of weather on the image quality when the weather is cloudy or foggy is a key factor to improve the detection accuracy.
When there are clouds obscuring the targets or the data is satellite remote sensing images, considering the variability of cloud shape and the extremely small scale of the target in the satellite remote sensing image [
50,
51,
52], the instance segmentation algorithm should be introduced. A large number of studies have confirmed that instance segmentation algorithms has better detection effects compared with target classification for target scale diversity and very small scale targets [
53,
54,
55,
56].
In summary, in our future work, we will focus on the followings: First, we will introduce the concept of deep separable convolution and the training mechanism of federated learning to reduce the number of parameters of the network, and achieve the lightweight of the model while ensuring the detection accuracy. Secondly, we will introduce the image defogging algorithm to enhance the quality of optical remote sensing images and improve the feature representation of the targets. Third, we will introduce the concept of instance segmentation and design corresponding algorithms to further improve the target detection accuracy of remote sensing images.


