
Integrating DMSP-OLS and NPP-VIIRS Nighttime Light Data to Evaluate Poverty in Southwestern China


 ,
,
Abstract
:1. Introduction
2. Study Area and Data
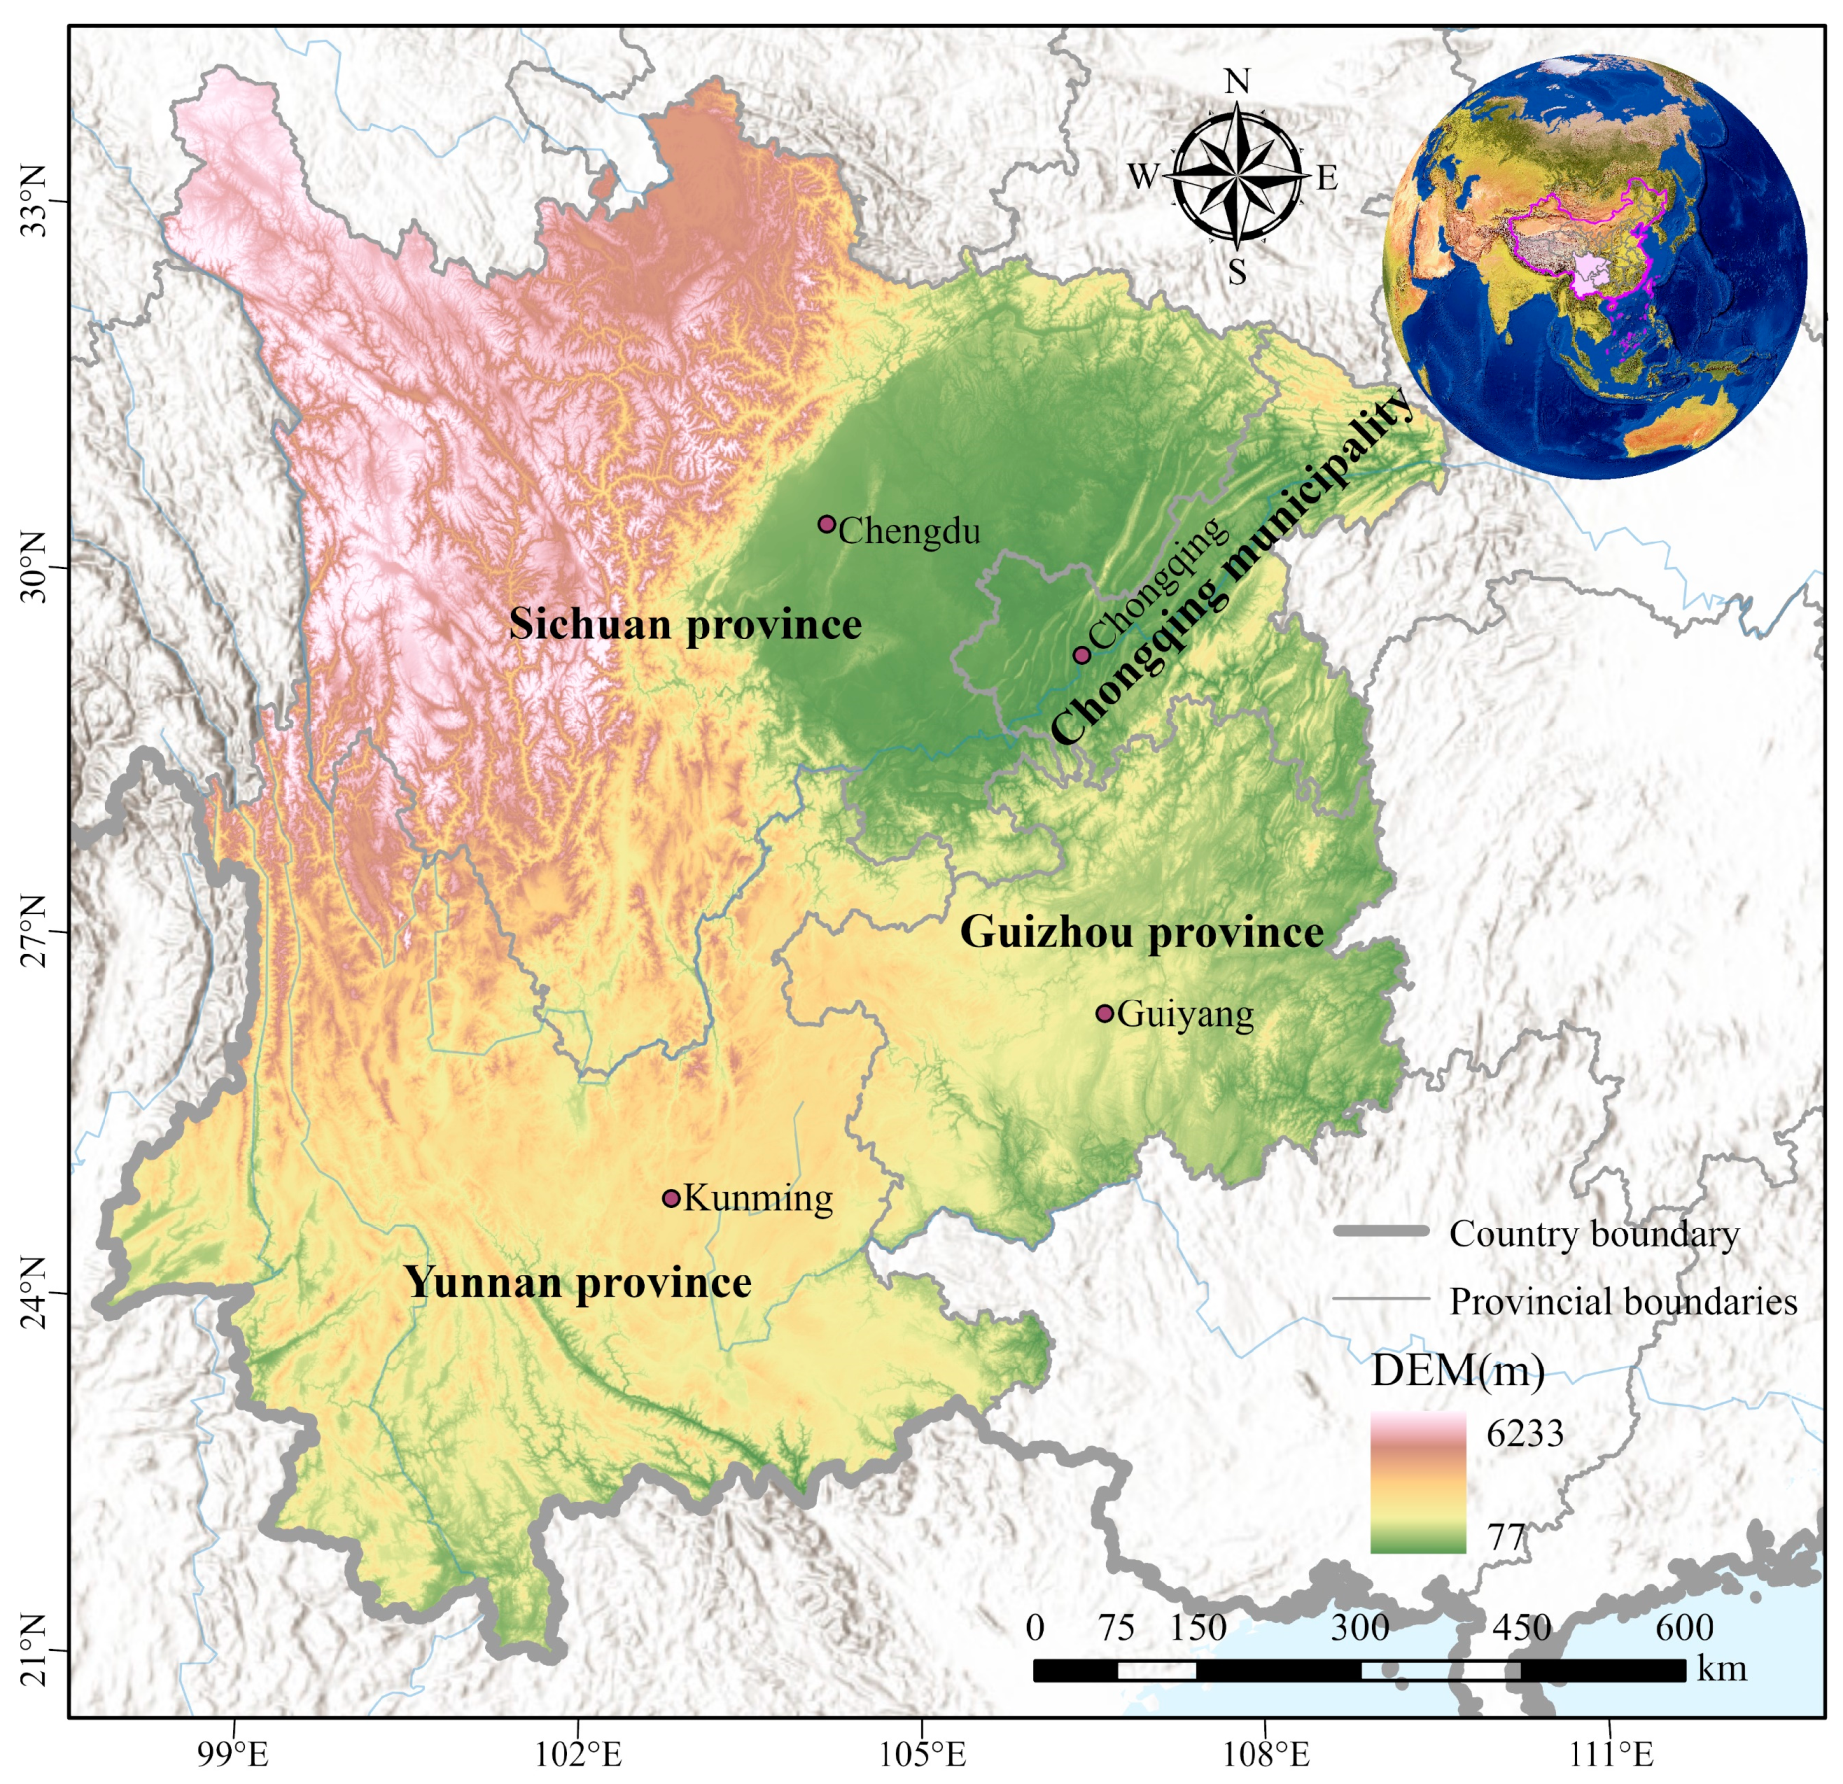
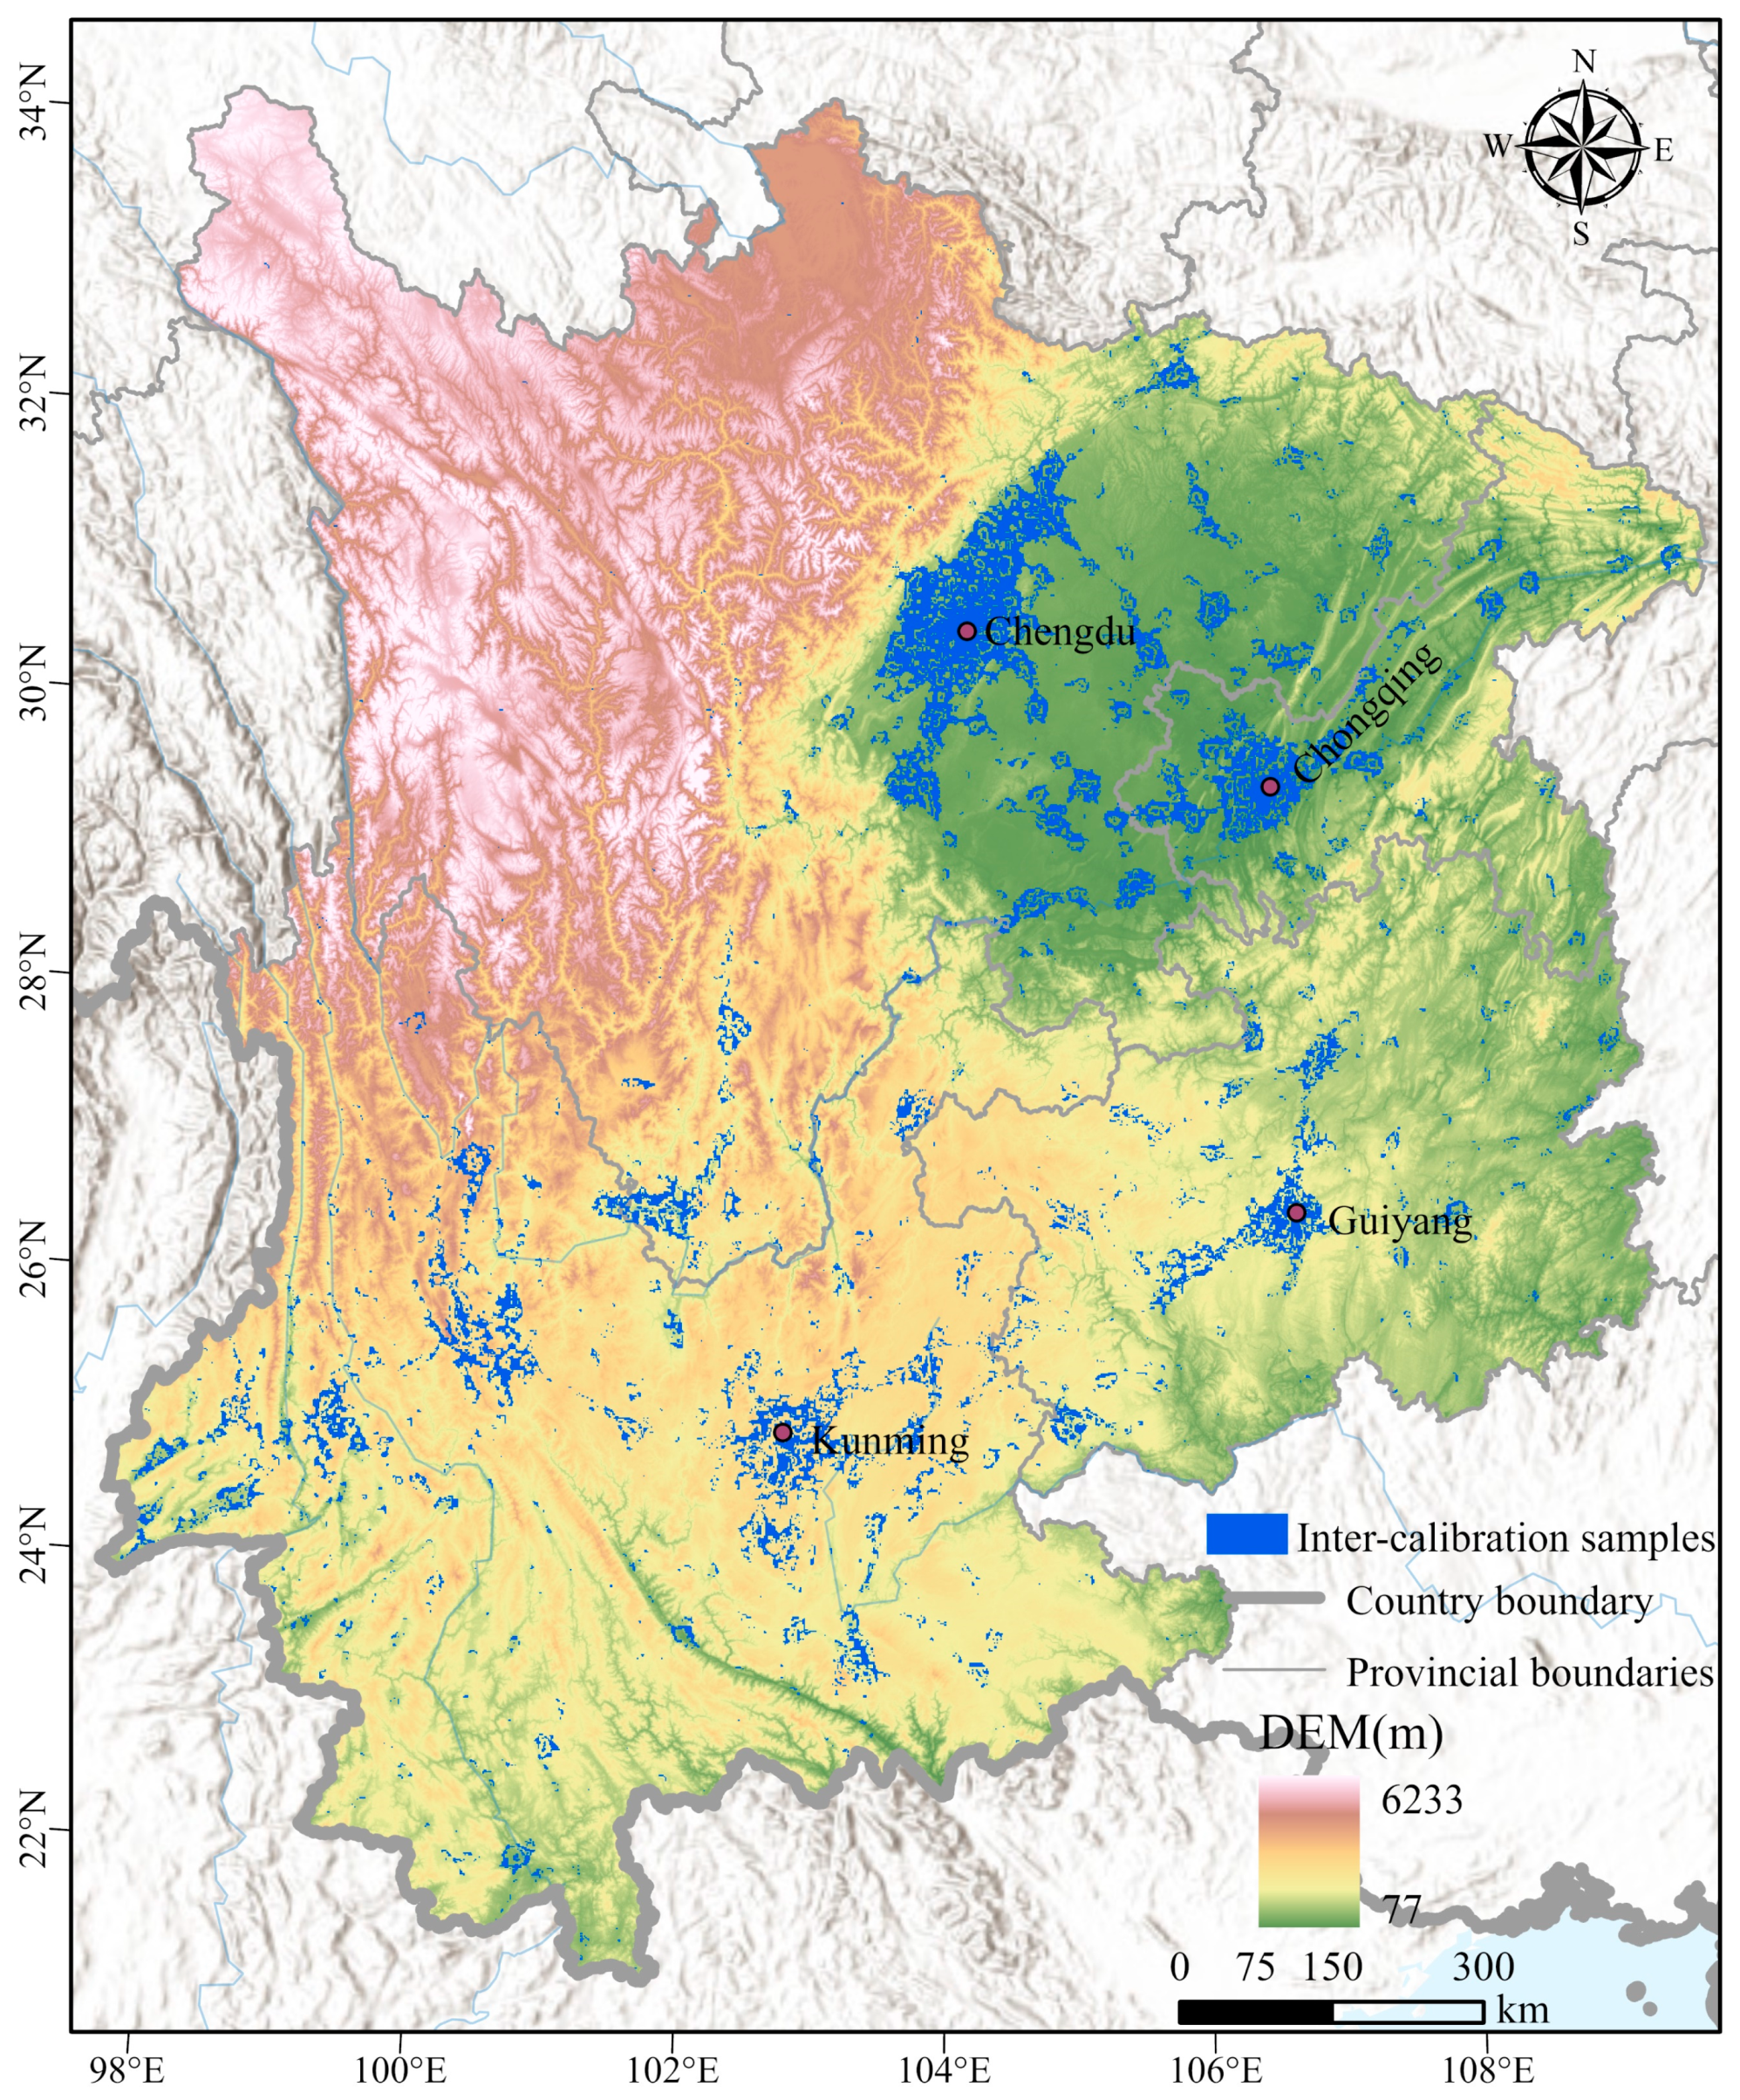
2.1. Study Area
2.2. Data and Pre-Processing
2.2.1. Data Sources
2.2.2. Data Pre-Processing
3. Methodology
3.1. Integration of DMSP-OLS and NPP-VIIRS NTL Data
3.2. Construction of ACPI
3.3. Evaluating Poverty Based on NTL Data
3.4. Accuracy Assessment
4. Results and Discussion
4.1. Results of NTL Integration
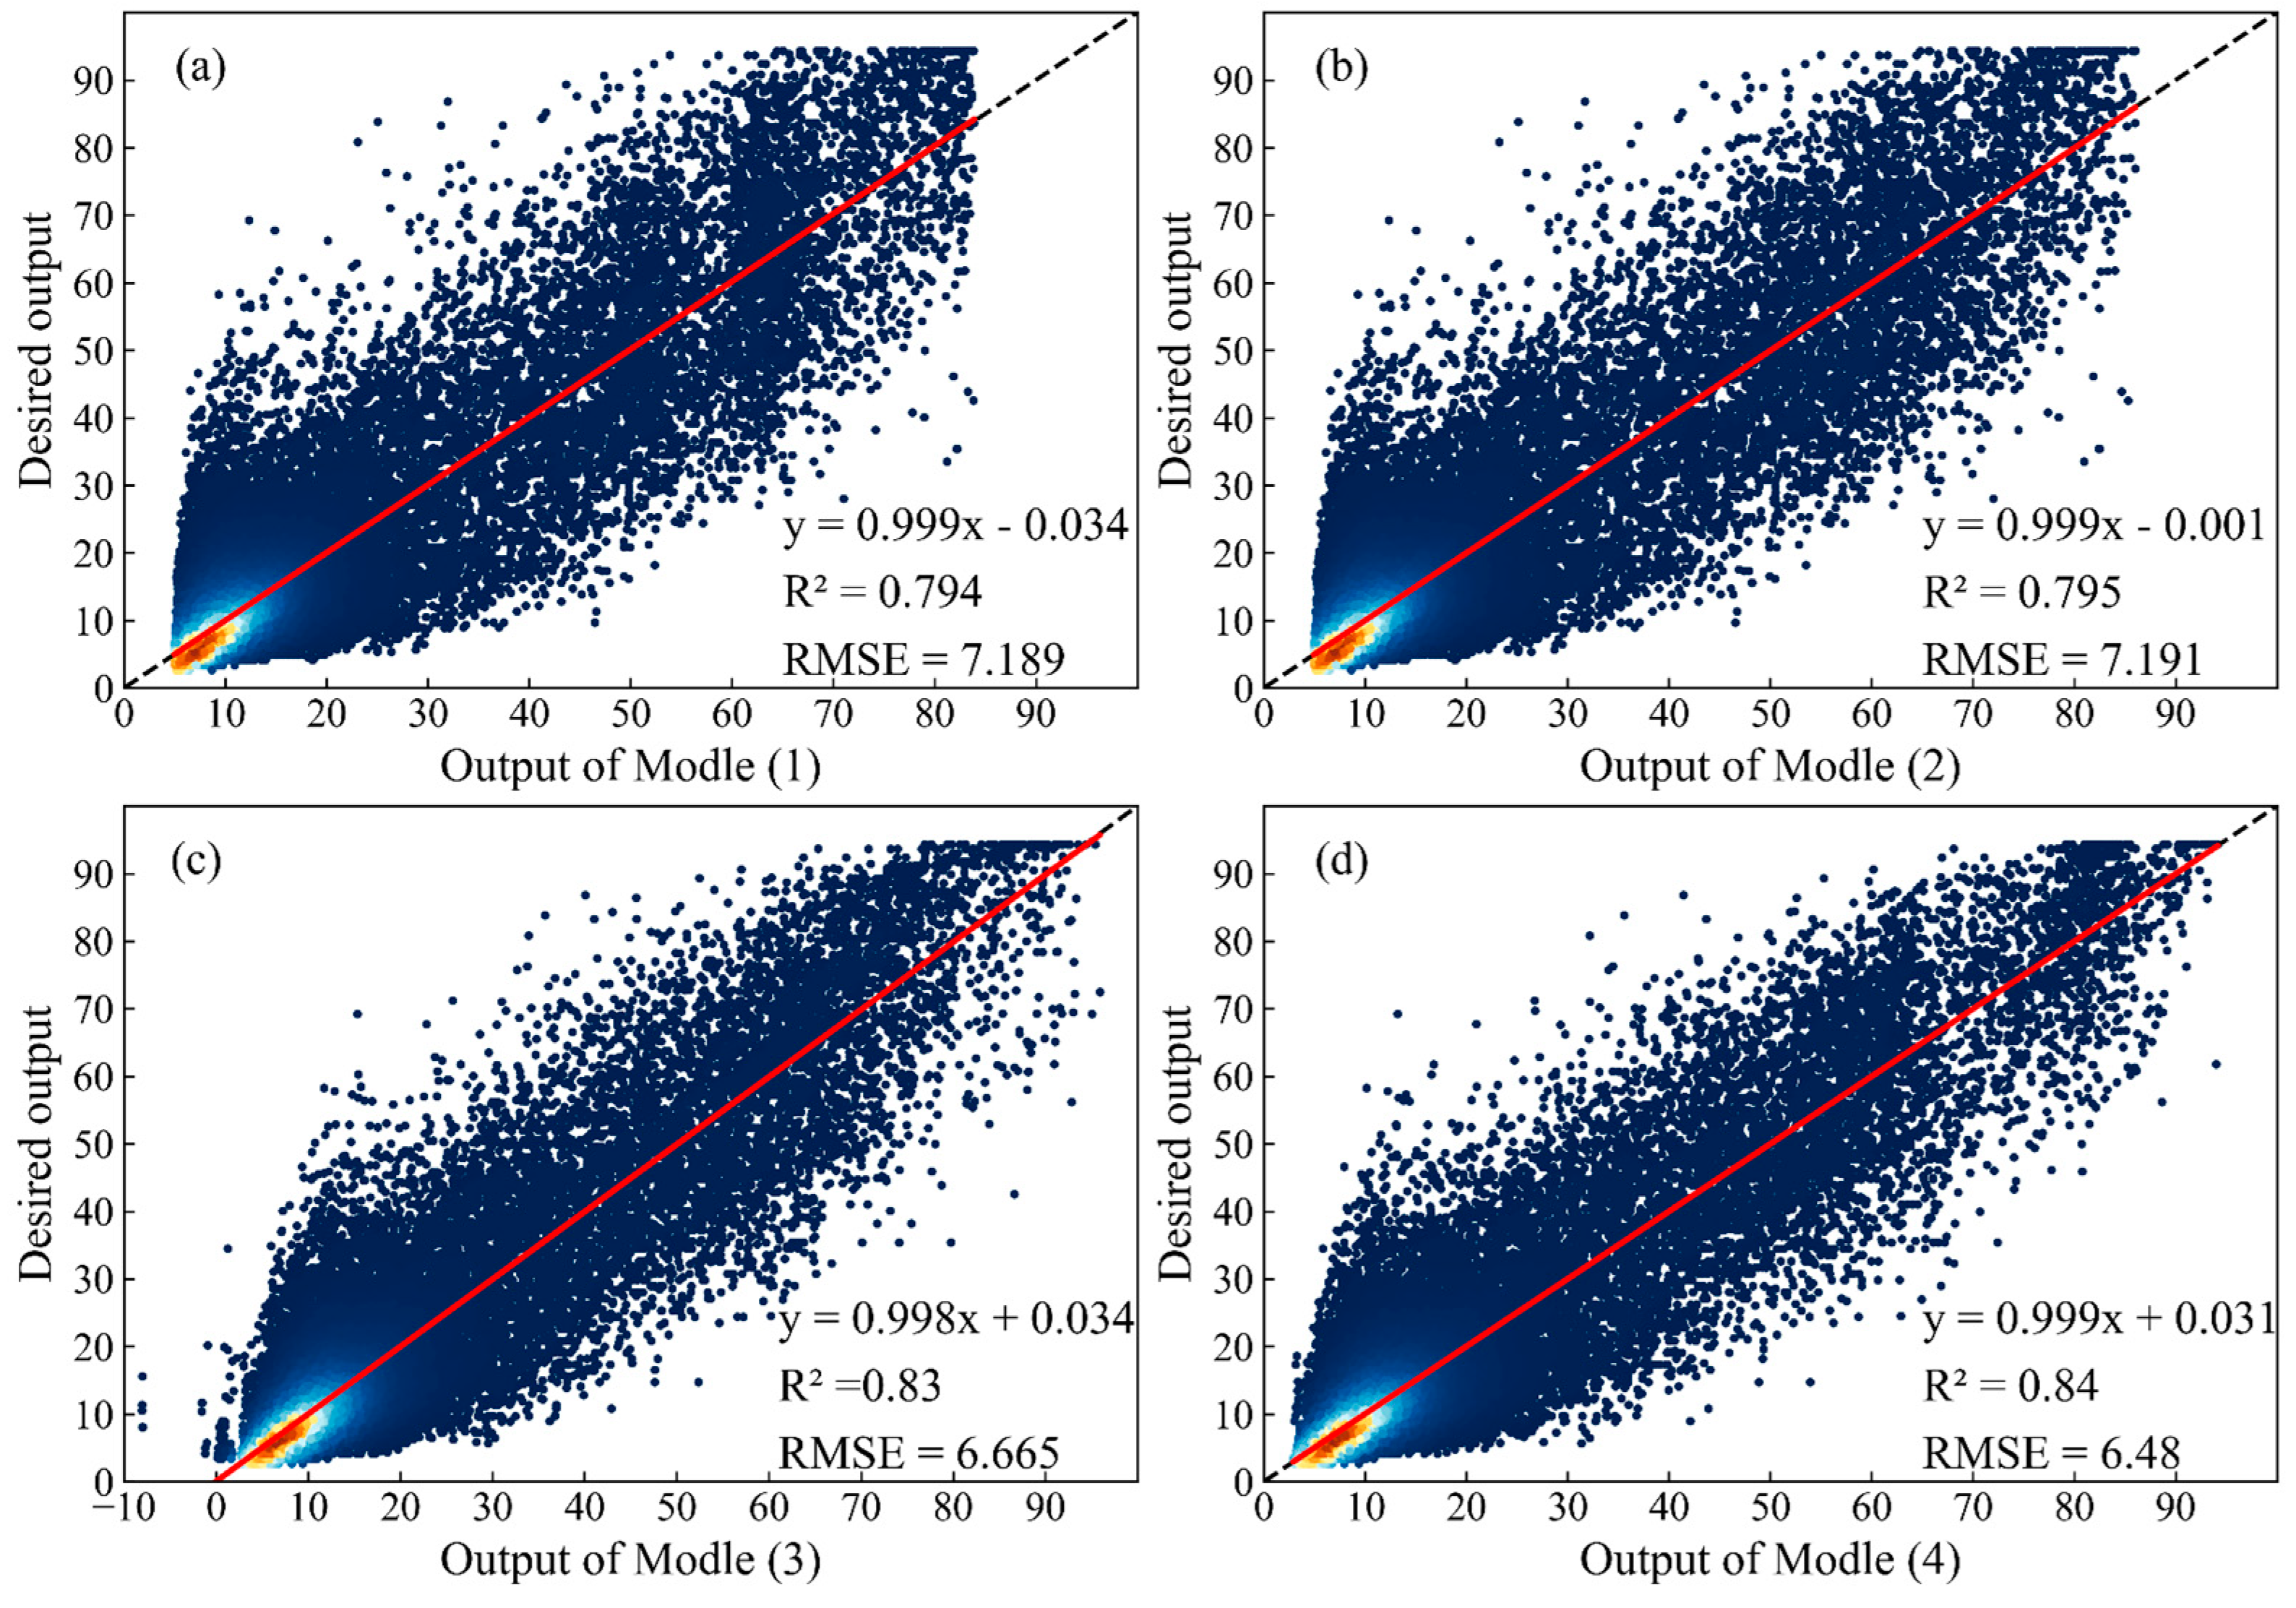
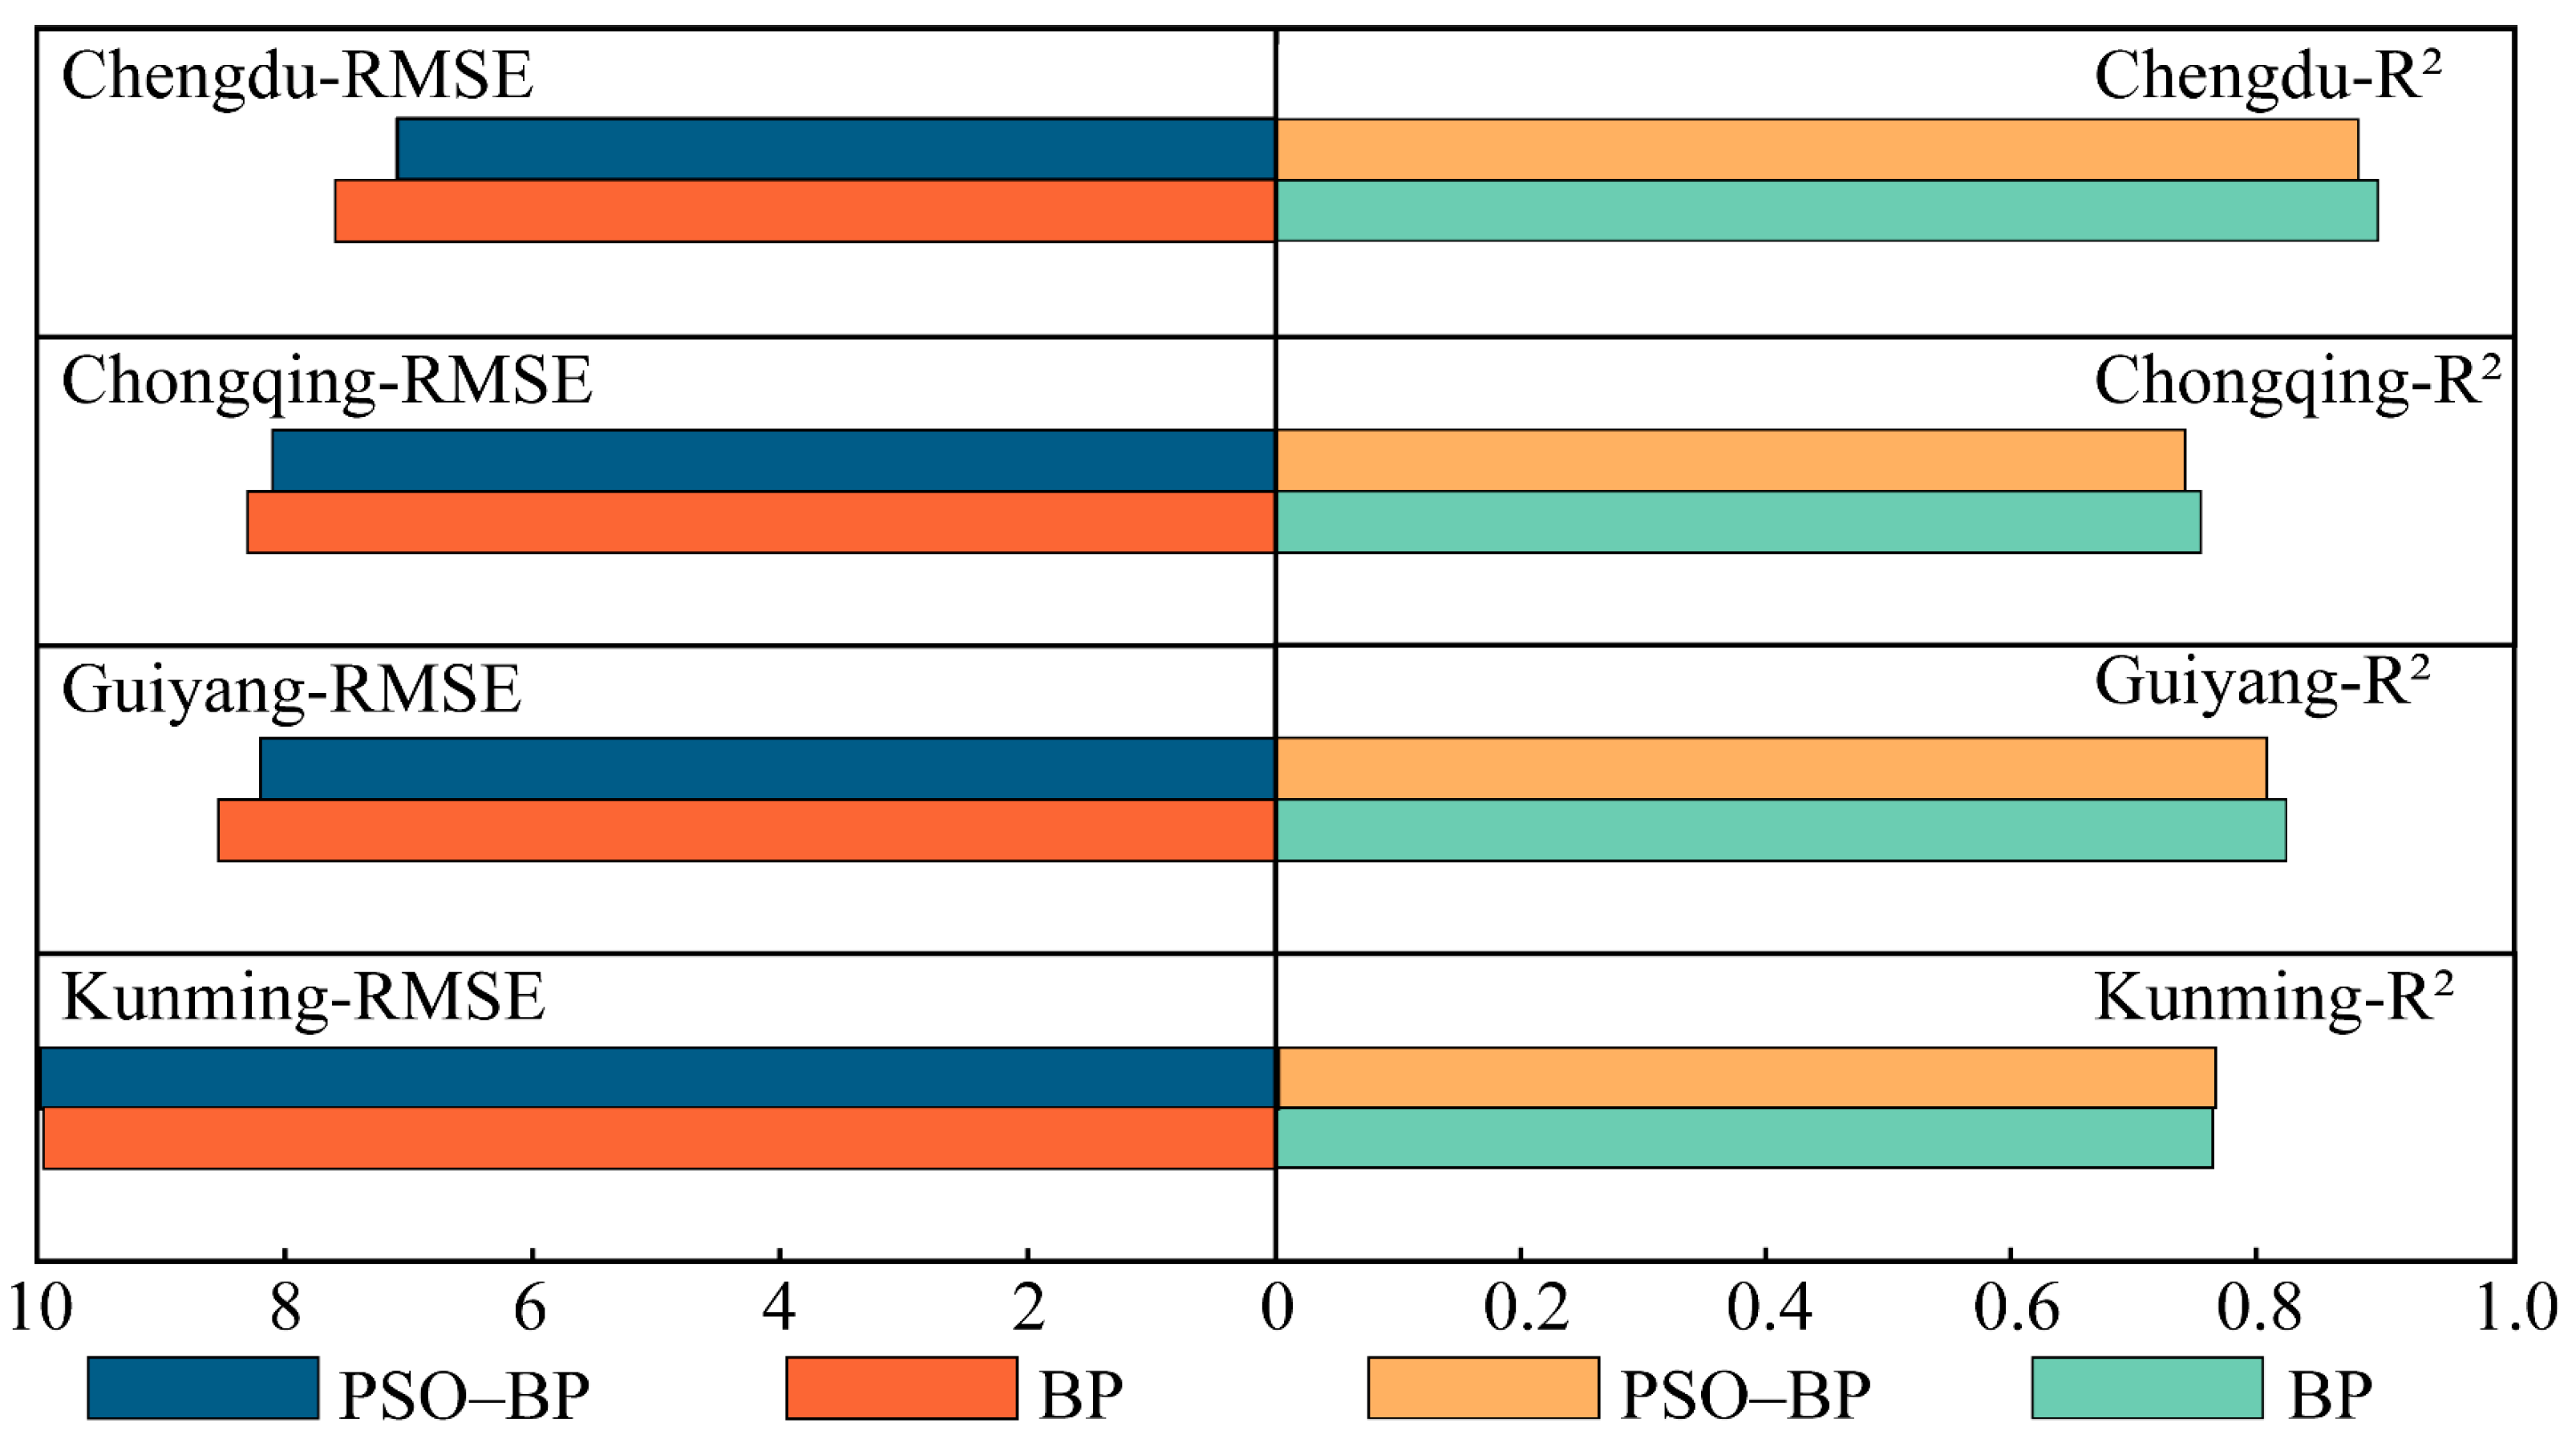
4.1.1. Integration Model
4.1.2. Results of the Integrated NTL Data
4.2. Results of Poverty Evaluation
4.2.1. ACPI of the Sample Counties
4.2.2. Poverty Evaluation Model Based on NTL Data
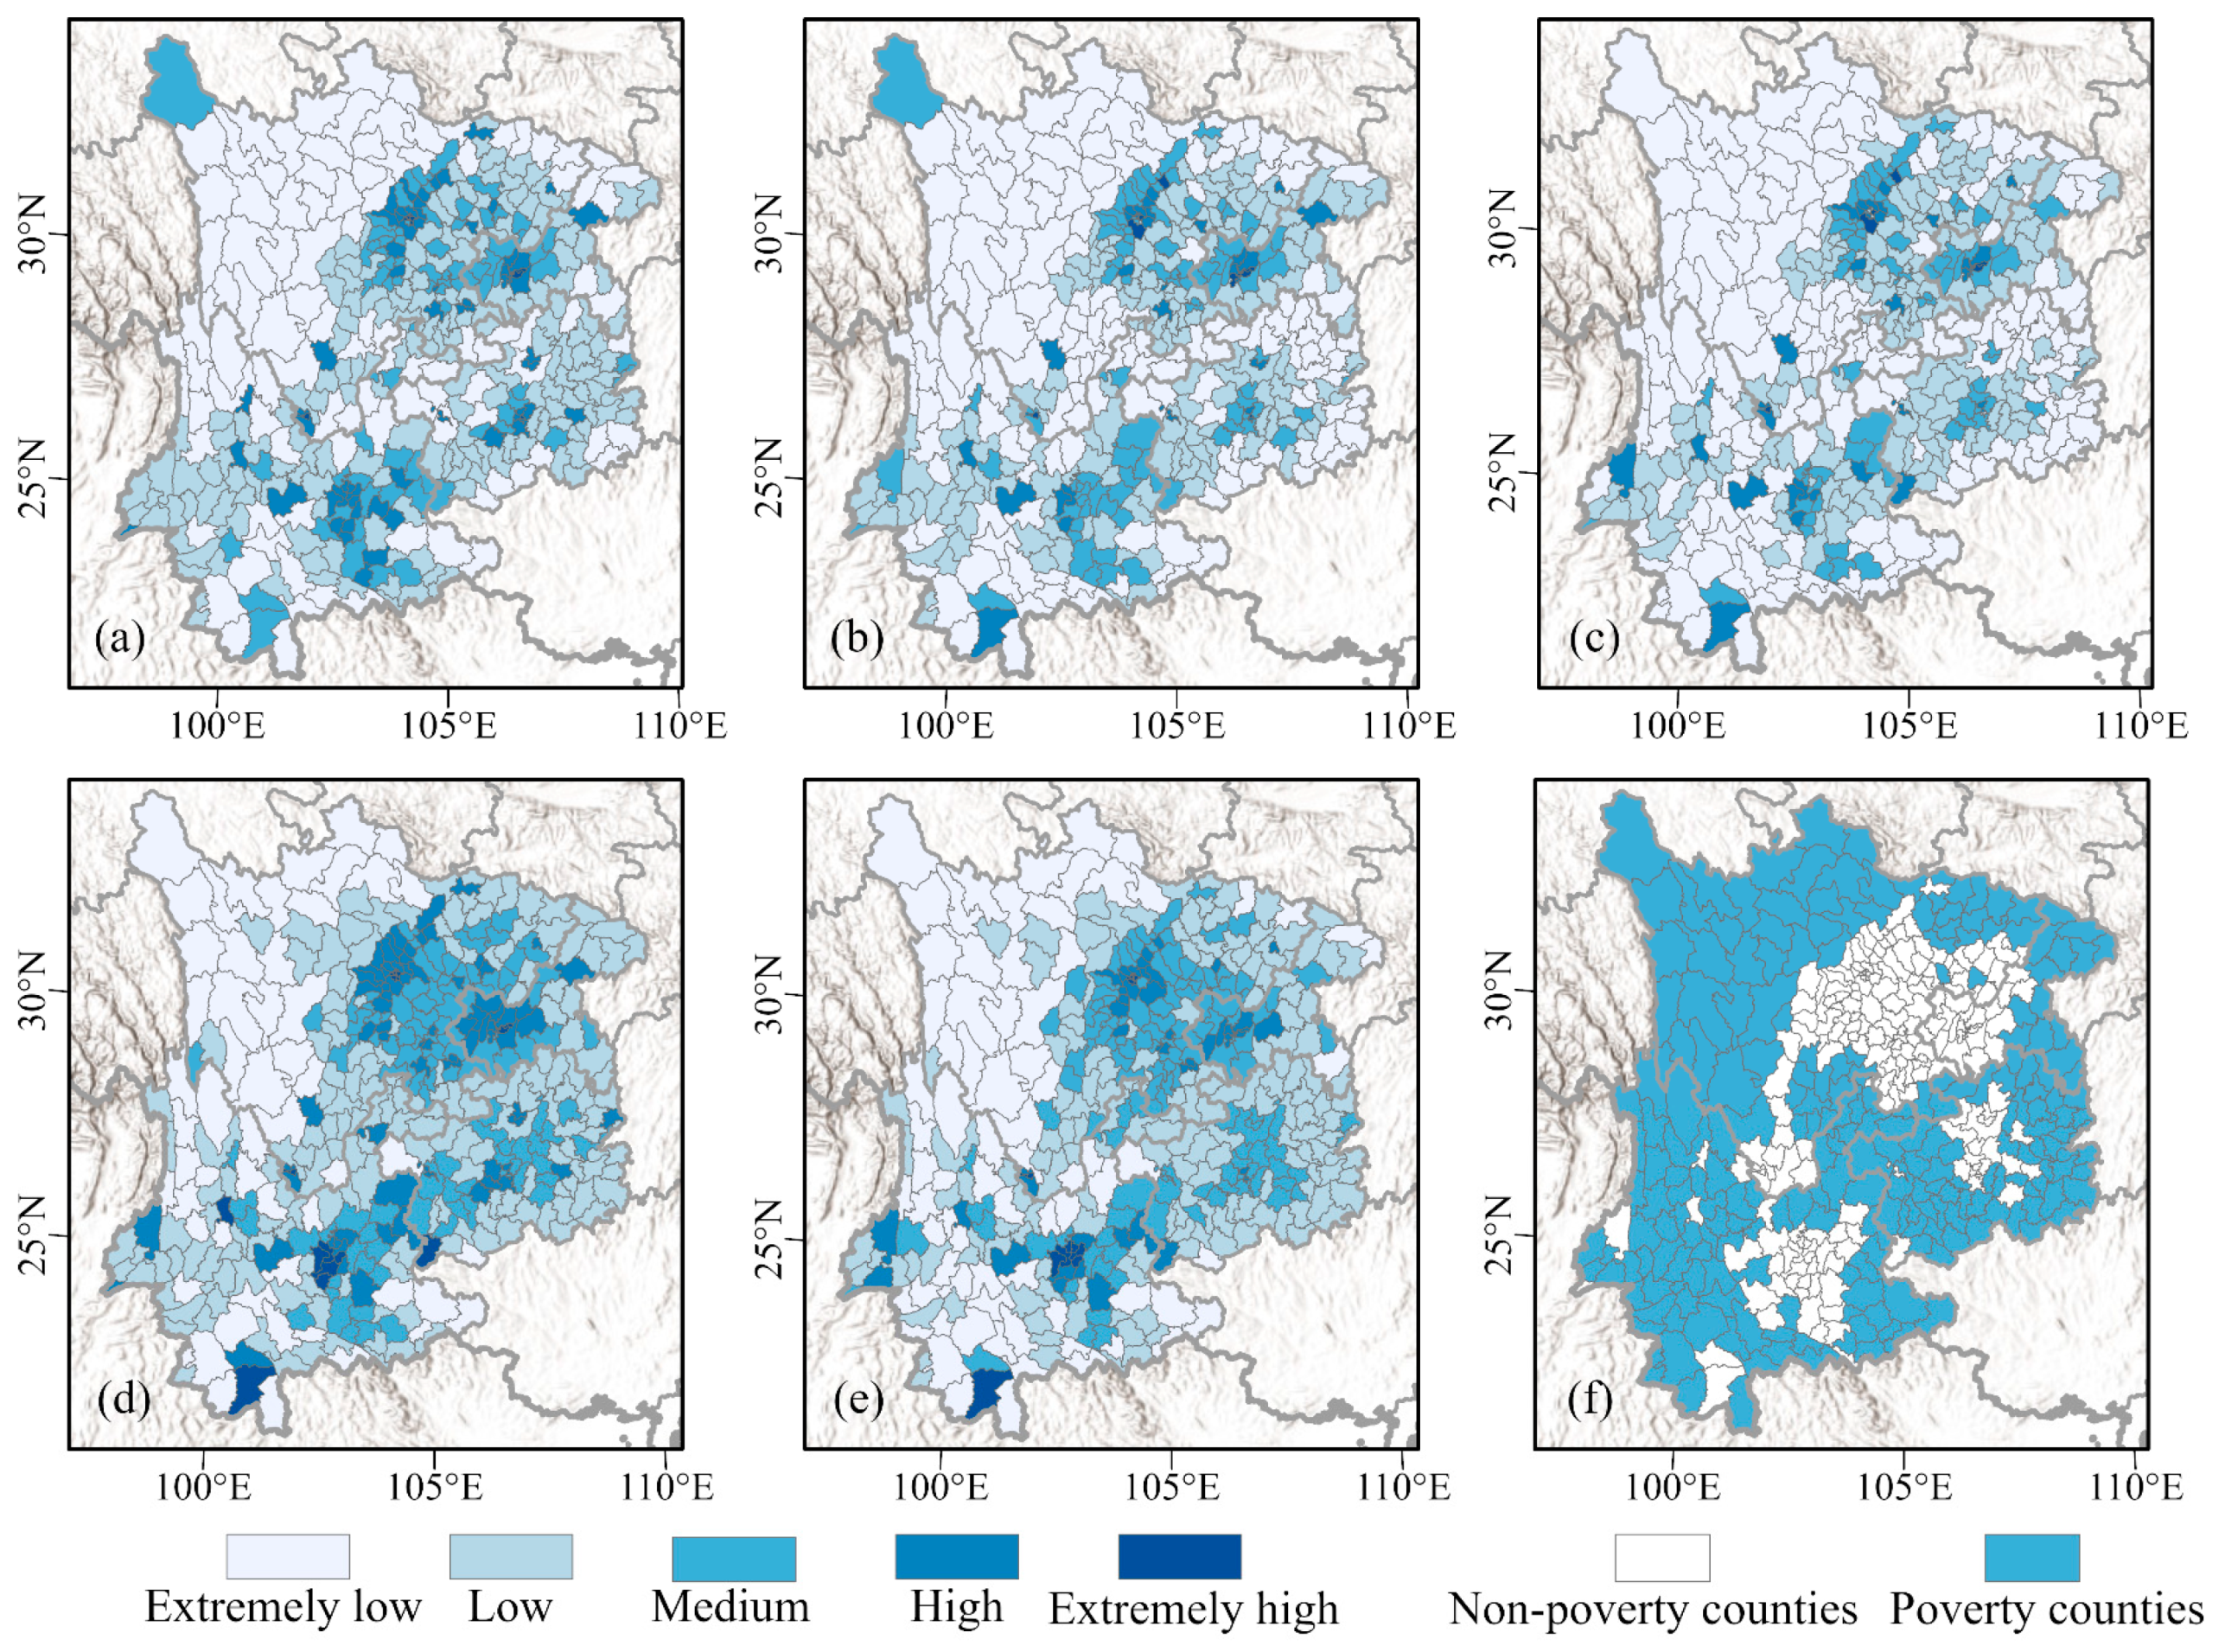
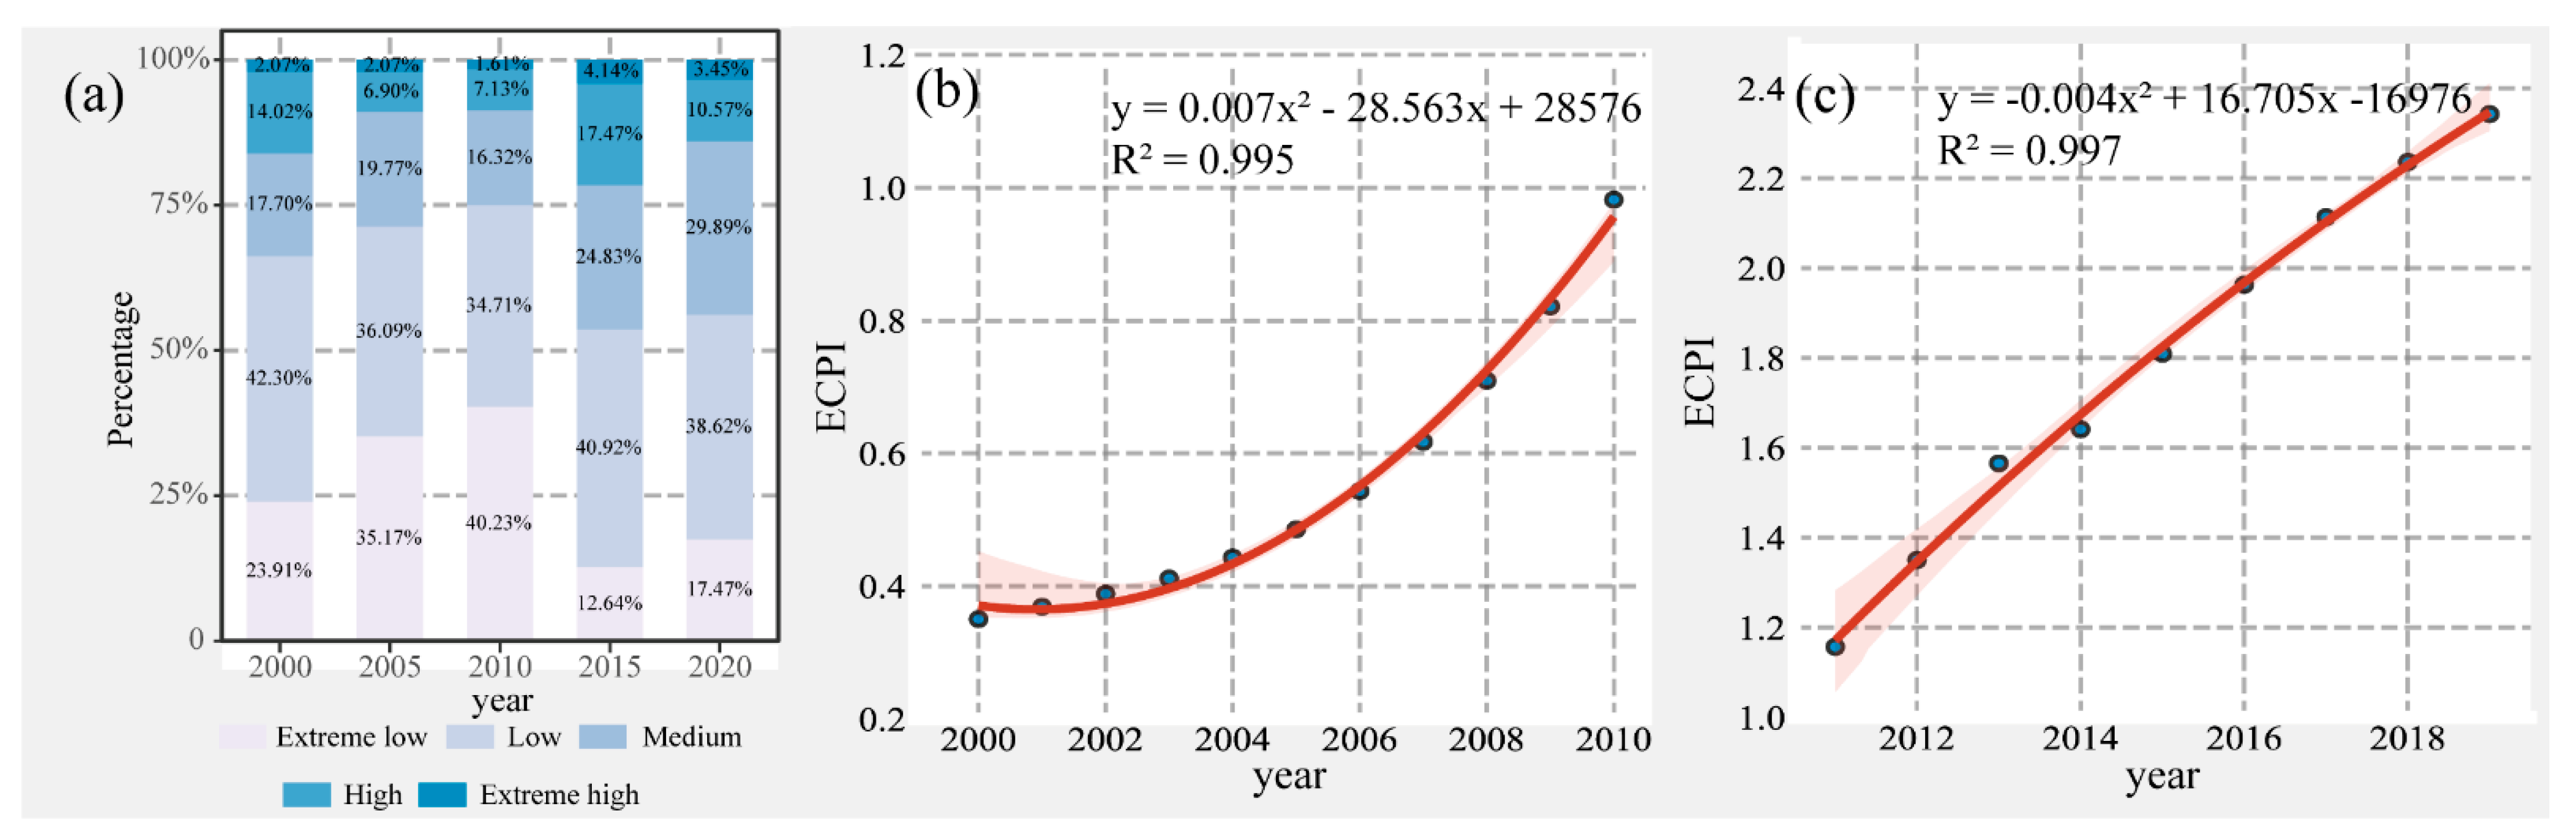
4.3. Spatiotemporal Dynamics of Poverty
4.4. Uncertainties in the Results
5. Conclusions
Supplementary Materials
Author Contributions
Funding
Data Availability Statement
Conflicts of Interest
References
- Steele, J.E.; Sundsøy, P.R.; Pezzulo, C.; Alegana, V.A.; Bird, T.J.; Blumenstock, J.; Bjelland, J.; Engø-Monsen, K.; Montjoye, Y.-A.d.; Iqbal, A.M.; et al. Mapping poverty using mobile phone and satellite data. J. R. Soc. Interface 2017, 14, 20160690. [Google Scholar] [CrossRef] [PubMed]
- Niu, T.; Chen, Y.; Yuan, Y. Measuring urban poverty using multi-source data and a random forest algorithm: A case study in Guangzhou. Sustain. Cities Soc. 2020, 54, 102014. [Google Scholar] [CrossRef]
- Shi, K.; Chang, Z.; Chen, Z.; Wu, J.; Yu, B. Identifying and evaluating poverty using multisource remote sensing and point of interest (POI) data: A case study of Chongqing, China. J. Clean. Prod. 2020, 255, 120245. [Google Scholar] [CrossRef]
- Haushofer, J.; Fehr, E. On the psychology of poverty. Sci. Total Environ. 2014, 344, 862–867. [Google Scholar] [CrossRef] [PubMed]
- Ren, Q.; Huang, Q.; He, C.; Tu, M.; Liang, X. The poverty dynamics in rural China during 2000–2014: A multi-scale analysis based on the poverty gap index. J. Geogr. Sci. 2018, 28, 1427–1443. [Google Scholar] [CrossRef] [Green Version]
- Kubiszewski, I.; Costanza, R.; Franco, C.; Lawn, P.; Talberth, J.; Jackson, T.; Aylmer, C. Beyond GDP: Measuring and achieving global genuine progress. Ecol. Econ. 2013, 93, 57–68. [Google Scholar] [CrossRef] [Green Version]
- Bossert, W.; Chakravarty, S.R.; D’Ambrosio, C. Multidimensional Poverty and Material Deprivation with Discrete Data. Rev. Income Wealth 2013, 59, 29–43. [Google Scholar] [CrossRef] [Green Version]
- Yu, B.; Shi, K.; Hu, Y.; Huang, C.; Chen, Z.; Wu, J. Poverty Evaluation Using NPP-VIIRS Nighttime Light Composite Data at the County Level in China. IEEE J. Sel. Top. Appl. Earth Obs. Remote Sens. 2017, 8, 1217–1229. [Google Scholar] [CrossRef]
- Wang, Y.; Wang, B. Multidimensional poverty measure and analysis: A case study from Hechi City, China. SpringerPlus 2016, 5, 642. [Google Scholar] [CrossRef] [Green Version]
- Zhao, X.; Yu, B.; Liu, Y.; Chen, Z.; Li, Q.; Wang, C.; Wu, J. Estimation of Poverty Using Random Forest Regression with Multi-Source Data: A Case Study in Bangladesh. Remote Sens. 2019, 11, 375. [Google Scholar] [CrossRef] [Green Version]
- Burke, M.; Driscoll, A.; Lobell, D.B.; Ermon, S. Using satellite imagery to understand and promote sustainable development. Science 2021, 371, eabe8628. [Google Scholar] [CrossRef] [PubMed]
- Zhao, M.; Zhou, Y.; Li, X.; Cao, W.; He, C.; Yu, B.; Li, X.; Elvidge, C.D.; Cheng, W.; Zhou, C. Applications of Satellite Remote Sensing of Nighttime Light Observations: Advances, Challenges, and Perspectives. Remote Sens. 2019, 11, 1971. [Google Scholar] [CrossRef] [Green Version]
- Bennett, M.M.; Smith, L.C. Advances in using multitemporal night-time lights satellite imagery to detect, estimate, and monitor socioeconomic dynamics. Remote Sens. Environ. 2017, 192, 176–197. [Google Scholar] [CrossRef]
- Chen, Z.; Yu, B.; Zhou, Y.; Liu, H.; Yang, C.; Shi, K.; Wu, J. Mapping Global Urban Areas from 2000 to 2012 Using Time-Series Nighttime Light Data and MODIS Products. IEEE J. Sel. Top. Appl. Earth Obs. Remote Sens. 2019, 12, 1143–1153. [Google Scholar] [CrossRef]
- Wang, L.; Wang, S.; Zhou, Y.; Liu, W.; Hou, Y.; Zhu, J.; Wang, F. Mapping population density in China between 1990 and 2010 using remote sensing. Remote Sens. Environ. 2018, 210, 269–281. [Google Scholar] [CrossRef]
- Zhao, M.; Cheng, W.; Zhou, C.; Li, M.; Wang, N.; Liu, Q. GDP Spatialization and Economic Differences in South China Based on NPP-VIIRS Nighttime Light Imagery. Remote Sens. 2017, 9, 673. [Google Scholar] [CrossRef] [Green Version]
- Xie, Y.; Weng, Q. Detecting urban-scale dynamics of electricity consumption at Chinese cities using time-series DMSP-OLS (Defense Meteorological Satellite Program-Operational Linescan System) nighttime light imageries. Energy 2016, 100, 177–189. [Google Scholar] [CrossRef]
- Elvidge, C.D.; Sutton, P.C.; Ghosh, T.; Tuttle, B.T.; Baugh, K.E.; Bhaduri, B.; Bright, E. A global poverty map derived from satellite data. Comput. Geosci. 2009, 35, 1652–1660. [Google Scholar] [CrossRef]
- Li, G.; Cai, Z.; Liu, X.; Liu, J.; Su, S. A comparison of machine learning approaches for identifying high-poverty counties: Robust features of DMSP/OLS night-time light imagery. Int. J. Remote Sens. 2019, 40, 5716–5736. [Google Scholar] [CrossRef]
- Zhao, M.; Zhou, Y.; Li, X.; Cheng, W.; Zhou, C.; Ma, T.; Li, M.; Huang, K. Mapping urban dynamics (1992–2018) in Southeast Asia using consistent nighttime light data from DMSP and VIIRS. Remote Sens. Environ. 2020, 248, 111980. [Google Scholar] [CrossRef]
- Zhu, X.; Ma, M.; Yang, H.; Ge, W. Modeling the Spatiotemporal Dynamics of Gross Domestic Product in China Using Extended Temporal Coverage Nighttime Light Data. Remote Sens. 2017, 9, 626. [Google Scholar] [CrossRef] [Green Version]
- Zhao, J.; Ji, G.; Yue, Y.; Lai, Z.; Chen, Y.; Yang, D.; Yang, X.; Wang, Z. Spatio-temporal dynamics of urban residential CO2 emissions and their driving forces in China using the integrated two nighttime light datasets. Appl. Energy 2019, 235, 612–624. [Google Scholar] [CrossRef]
- Shao, X.; Cao, C.; Zhang, B.; Qiu, S.; Elvidge, C.; Von Hendy, M. Radiometric calibration of DMSP-OLS sensor using VIIRS day/night band. In Proceedings of the Earth Observing Missions and Sensors: Development, Implementation, and Characterization III, Beijing, China, 3–15 October 2014; p. 92640A. [Google Scholar]
- Li, X.; Li, D.; Xu, H.; Wu, C. Intercalibration between DMSP/OLS and VIIRS night-time light images to evaluate city light dynamics of Syria’s major human settlement during Syrian Civil War. Int. J. Remote Sens. 2017, 38, 5934–5951. [Google Scholar] [CrossRef]
- Lu, D.; Wang, Y.; Yang, Q.; Su, K.; Zhang, H.; Li, Y. Modeling Spatiotemporal Population Changes by Integrating DMSP-OLS and NPP-VIIRS Nighttime Light Data in Chongqing, China. Remote Sens. 2021, 13, 284. [Google Scholar] [CrossRef]
- Li, X.; Zhou, Y.; Zhao, M.; Zhao, X. A harmonized global nighttime light dataset 1992–2018. Sci. Data 2020, 7, 168. [Google Scholar] [CrossRef]
- Gori, M.; Tesi, A. On the problem of local minima in backpropagation. IEEE Trans. Pattern Anal. Mach. Intell. 1992, 14, 76–86. [Google Scholar] [CrossRef] [Green Version]
- Zhang, J.-R.; Zhang, J.; Lok, T.-M.; Lyu, M.R. A hybrid particle swarm optimization-back-propagation algorithm for feedforward neural network training. Appl. Math. Comput. 2007, 185, 1026–1037. [Google Scholar] [CrossRef]
- Zhao, M.; Zhou, Y.; Li, X.; Zhou, C.; Cheng, W.; Li, M.; Huang, K. Building a Series of Consistent Night-Time Light Data (1992–2018) in Southeast Asia by Integrating DMSP-OLS and NPP-VIIRS. IEEE Trans. Geosci. Remote Sens. 2020, 58, 1843–1856. [Google Scholar] [CrossRef]
- Lv, Q.; Liu, H.; Wang, J.; Liu, H.; Shang, Y. Multiscale analysis on spatiotemporal dynamics of energy consumption CO2 emissions in China: Utilizing the integrated of DMSP-OLS and NPP-VIIRS nighttime light datasets. Sci. Total Environ. 2020, 703, 134394. [Google Scholar] [CrossRef]
- Sun, Y.; Zheng, S.; Wu, Y.; Schlink, U.; Singh, R.P. Spatiotemporal Variations of City-Level Carbon Emissions in China during 2000–2017 Using Nighttime Light Data. Remote Sens. 2020, 12, 2916. [Google Scholar] [CrossRef]
- Chen, J.; Gao, M.; Cheng, S.; Hou, W.; Song, M.; Liu, X.; Liu, Y.; Shan, Y. County-level CO2 emissions and sequestration in China during 1997–2017. Sci. Data 2020, 7, 391. [Google Scholar] [CrossRef] [PubMed]
- Chen, M.; Cai, H.; Yang, X.; Jin, C. A novel classification regression method for gridded electric power consumption estimation in China. Sci. Rep. 2020, 10, 18558. [Google Scholar] [CrossRef] [PubMed]
- Ma, J.; Guo, J.; Ahmad, S.; Li, Z.; Hong, J. Constructing a New Inter-Calibration Method for DMSP-OLS and NPP-VIIRS Nighttime Light. Remote Sens. 2020, 12, 937. [Google Scholar] [CrossRef] [Green Version]
- Jeswani, R.; Kulshrestha, A.; Gupta, P.K.; Srivastav, S. Evaluation of the consistency of DMSP-OLS and SNPP-VIIRS Night-time Light Datasets. J. Geomat. 2019, 13, 98–105. [Google Scholar]
- Mohamad, E.T.; Armaghani, D.J.; Momeni, E.; Yazdavar, A.H.; Ebrahimi, M. Rock strength estimation: A PSO-based BP approach. Neural Comput. Appl. 2018, 30, 1635–1646. [Google Scholar] [CrossRef]
- Shi, Y.; Eberhart, R.C. Parameter selection in particle swarm optimization. In Proceedings of the Evolutionary Programming VII, San Diego, CA, USA, 25–27 March 1998; pp. 591–600. [Google Scholar]
- Li, C.; Yang, W.; Tang, Q.; Tang, X.; Lei, J.; Wu, M.; Qiu, S. Detection of Multidimensional Poverty Using Luojia 1-01 Nighttime Light Imagery. J. Indian Soc. Remote Sens. 2020, 48, 963–977. [Google Scholar] [CrossRef]
- DFID. DFID Sustainable Livelihoods Guidance Sheets. 1999. Available online: www.ennonline.net/dfidsustainableliving (accessed on 5 May 2021).
- Yin, J.; Qiu, Y.; Zhang, B. Identification of Poverty Areas by Remote Sensing and Machine Learning: A Case Study in Guizhou, Southwest China. ISPRS Int. J. Geo-Inf. 2021, 10, 11. [Google Scholar] [CrossRef]
- Wang, W.; Cheng, H.; Zhang, L. Poverty assessment using DMSP/OLS night-time light satellite imagery at a provincial scale in China. Adv. Space Res. 2012, 49, 1253–1264. [Google Scholar] [CrossRef]
- Fang, D.; Ma, W. Study on the Measurement of China’s Intter-Provincial High-Quality Development and Its Spatial-Temporal Characteristics. Reg. Econ. Rev. 2019, 2, 61–70. [Google Scholar]
- Zhao, N.; Liu, Y.; Cao, G.; Samson, E.L.; Zhang, J. Forecasting China’s GDP at the pixel level using nighttime lights time series and population images. GIScience Remote Sens. 2017, 54, 407–425. [Google Scholar] [CrossRef]
- Pan, J.; Hu, Y. Spatial Identification of Multi-dimensional Poverty in Rural China: A Perspective of Nighttime-Light Remote Sensing Data. J. Indian Soc. Remote Sens. 2018, 46, 1093–1111. [Google Scholar] [CrossRef]


| Data | Data Description | Year | Source |
|---|---|---|---|
| DMSP-OLS | Version 4 DMSP-OLS annual stable NTL data | 2000–2013 | https://eogdata.mines.edu/products/dmsp/, accessed on 20 April 2021 |
| NPP-VIIRS | Vision 1 NPP-VIIRS monthly vcm NTL data | 2012–2019 | https://eogdata.mines.edu/products/vnl/, accessed on 22 April 2021 |
| Boundaries | Shapefiles of county-level regions in Sichuan, Chongqing, Yunnan and Guizhou | 2015 | Resources and Environmental Science and Data Center (https://www.resdc.cn/), accessed on 23 April 2021 |
| statistical data | Socioeconomic statistical data of county-level regions in Sichuan, Chongqing, Yunnan and Guizhou | 2000–2019 | Statistical Yearbooks of Sichuan, Chongqing, Yunnan, Guizhou and other corresponding counties, accessed on 5 April 2021 |
| DEM | SRTMDEM 90 m raster | - | Geospatial Data Cloud (http://www.gscloud.cn/), accessed on 23 April 2021 |
| Model | Input Parameters | Output Parameters | Training Algorithm |
|---|---|---|---|
| 1 | Log_V, X, Y, Area | DMSP-OLS | PSO-BP |
| 2 | Log_V | DMSP-OLS | PSO-BP |
| 3 | Log_V, X, Y, Area | DMSP-OLS | BP |
| 4 | Log_V | DMSP-OLS | BP |
| ID | Index | Attribute | Weight |
|---|---|---|---|
| 1 | Per capita GDP | + | 0.1308 |
| 2 | Per capita net income of rural population | + | 0.0818 |
| 3 | Per capita fiscal revenue | + | 0.1532 |
| 4 | Per capita health care institutions | + | 0.0941 |
| 5 | Beds in health per 1000 | + | 0.0868 |
| 6 | Per capita total investment in fixed assets | + | 0.1319 |
| 7 | Per capita total retail sales of consumer goods | + | 0.1779 |
| 8 | Proportion of primary school students | + | 0.0515 |
| 9 | Proportion of secondary school students | + | 0.0337 |
| 10 | Proportion of slope area above 15° | − | 0.0360 |
| 11 | Average altitude | − | 0.0216 |
| Abbreviation | Detail Description |
|---|---|
| F1 | Average of all pixels of the NTL imagery within the county’s boundary |
| F2 | Average light index of all pixels within the county’s boundary |
| F3 | Variance of all pixels within the county’s boundary |
| F4 | Standard deviation of all pixels within the county’s boundary |
| F5 | Sum of squares of deviation of all pixels within the county’s boundary |
| F6 | Total value of all pixels within the county’s boundary |
| F7 | Number of pixels within the county’s boundary |
| F8 | Number of pixels greater than zero within the county’s boundary |
| F9 | Largest value of all pixels within the county’s boundary |
| F10 | Smallest value of all pixels within the county’s boundary |
| F11 | Range between the largest and smallest value of all pixels within the county’s boundary |
| F12 | Local autocorrelation Moran’s I of the counties |
| Abbreviation | Correlation Coefficient | Abbreviation | Correlation Coefficient |
|---|---|---|---|
| F1 | 0.550 ** | F7 | −0.373 ** |
| F2 | 0.594 ** | F8 | 0.340 ** |
| F3 | 0.307 ** | F9 | 0.534 ** |
| F4 | 0.409 ** | F10 | 0.371 ** |
| F5 | 0.372 ** | F11 | 0.267 ** |
| F6 | 0.604 ** | F12 | 0.129 ** |
| Model Type | Expression | R2 | Significance |
|---|---|---|---|
| Linear | Y = 19.569 ∗ x + 1.407 | 0.824 | <0.01 |
| Quadratic polynomial | Y = 15.199 ∗ x2 + 1.384∗x + 0.005 | 0.827 | <0.01 |
| Log function | Y = 14.934 ∗ ln(x) + 27.275 | 0.607 | <0.01 |
| Power function | Y = x0.742 + 18.561 | 0.7 | <0.01 |
| Exponential | Y = 0.845x + 5.615 | 0.718 | <0.01 |
Publisher’s Note: MDPI stays neutral with regard to jurisdictional claims in published maps and institutional affiliations. |
© 2022 by the authors. Licensee MDPI, Basel, Switzerland. This article is an open access article distributed under the terms and conditions of the Creative Commons Attribution (CC BY) license (https://creativecommons.org/licenses/by/4.0/).
Share and Cite
Yong, Z.; Li, K.; Xiong, J.; Cheng, W.; Wang, Z.; Sun, H.; Ye, C. Integrating DMSP-OLS and NPP-VIIRS Nighttime Light Data to Evaluate Poverty in Southwestern China. Remote Sens. 2022, 14, 600. https://doi.org/10.3390/rs14030600
Yong Z, Li K, Xiong J, Cheng W, Wang Z, Sun H, Ye C. Integrating DMSP-OLS and NPP-VIIRS Nighttime Light Data to Evaluate Poverty in Southwestern China. Remote Sensing. 2022; 14(3):600. https://doi.org/10.3390/rs14030600
Chicago/Turabian StyleYong, Zhiwei, Kun Li, Junnan Xiong, Weiming Cheng, Zegen Wang, Huaizhang Sun, and Chongchong Ye. 2022. "Integrating DMSP-OLS and NPP-VIIRS Nighttime Light Data to Evaluate Poverty in Southwestern China" Remote Sensing 14, no. 3: 600. https://doi.org/10.3390/rs14030600
APA StyleYong, Z., Li, K., Xiong, J., Cheng, W., Wang, Z., Sun, H., & Ye, C. (2022). Integrating DMSP-OLS and NPP-VIIRS Nighttime Light Data to Evaluate Poverty in Southwestern China. Remote Sensing, 14(3), 600. https://doi.org/10.3390/rs14030600