Article

Integration of Aerobiological Information for Construction Engineering Based on LiDAR and BIM

by
Eva Quevedo-Martínez
,
Juan Pedro Cortés-Pérez
,
Juan Francisco Coloma
*,
José Francisco Fernández-Alvarado
,
Marta García
and
Santiago Fernández-Rodríguez
Department of Construction, School of Technology, University of Extremadura, Avda. de la Universidad s/n, 10003 Cáceres, Spain
*
Author to whom correspondence should be addressed.
Remote Sens. 2022, 14(3), 618; https://doi.org/10.3390/rs14030618
Submission received: 7 December 2021 / Revised: 24 January 2022 / Accepted: 25 January 2022 / Published: 27 January 2022

Abstract

:
In green urban areas, the allergenic factor is important when selecting trees to improve the quality of life of the population. An application of laser imaging detection and ranging (LiDAR) in building information modelling (BIM) is the capture of geo-referenced geometric information of the environment. This study presents the process of digitalisation of a green infrastructure inventory based on the geolocation and bioparameters of the cypress species. The aerobiological index (IUGZA) was estimated by developing green infrastructure BIM models at different detail levels and with a new BIM dimension (6D) for the urban environment. The novelty of the study is the modelling of urban information for evaluating the potential environmental impact related to the allergenicity of the urban green infrastructure using LiDAR through BIM. The measurements of cypress trees based on bioparameters and distances were applied to the IUGZA. This innovation for describing the current 3D environments and designing new scenarios in 6D may prevent future problems in urban areas during construction projects.

Graphical Abstract

1. Introduction

Urban forests as ecosystem services [1] are being recently studied considering the potential impact [2]. One of them is the allergenic affection related with ornamental trees in urban planning [3], being important for designing healthier green infrastructure [4]. It is necessary, therefore, to consider the variants in urban forest allergy potential among cities and land uses [5] as the effect of urban green areas is related to potential exposure at ground level [6]. Aerobiological index measures the potential incidence of urban vegetation related to allergenicity as Index of Urban Green Zones Allergenicity (IUGZA) [7].
Air quality is a major concern in the urban environment because of the changes in pollutant emissions driven by complex and intense human activities. Thus, considering human health, it is important to provide a system that allows air quality assessment in an accurate, consistent, and comparable way and helps researchers and governments to improve the well-being of people and achieve a sustainable development [8]. It is increasingly necessary to consider the sustainability of the construction of urban infrastructures in the design phase [9]. The building information modelling (BIM) methodology is being applied in the design and construction of infrastructures, and this includes the air quality conditions related to ornamental trees [10]. One of the dimensions of BIM is 6D, in which information is added to the 3D model to evaluate sustainability throughout the life of the infrastructure [11].
Laser imaging detection and ranging (LiDAR) provides laser scanning point clouds [12] and has been increasingly used in urban remote sensing since its first application for producing digital surface models (DSMs) in cities [13]. Several applications have been developed to parameterise the 3D building morphology in complex landscapes [14] and to model the perception of ecosystem services [15] using the LiDAR technology. It has also been used for green applications related to remote sensing of vegetation to discriminate some tree species under foliated conditions [16]. Recently, it has been used for mapping forest aboveground biomass [17] including large areas in urban land use [18], and the changes in urban and forest tree canopies [19]. Furthermore, LiDAR has been applied to map tree species along road corridors and urban streets [20] to predict tree species richness in urban forests [21], and to quantify the 3D structure of vegetation [22] and other biophysical parameters, such as tree height [23]. In this field of research, it is very interesting to apply LiDAR with the normalised difference vegetation index (NDVI) for studying diverse forestry topics [24]. LiDAR has also been used to monitor atmospheric pollution [25] and to evaluate the impacts of wildfire on air quality [26]. It has also been applied to the study of atmospheric pollen from urban green infrastructure [27], given that cough and other allergic symptoms are related to tree pollen [28], considering the diurnal pattern of its vertical distribution [29] and its optical properties [30]. Further, it has been used to identify atmospheric aerosols [31] and bioaerosols [32,33].
The BIM methodology is being applied in the design and construction of infrastructures, considering different dimensions depending on the information incorporated [10]. BIM dimensions are differentiated into seven levels: 3D [34], 4D [35], 5D [36], 6D [37], and 7D [38]. These studies offer different ways to link data to the information model by managing the data dimensions, thus offering a better understanding of the project and different research concepts [39], and it is possible to work with this data quantification and reproduction through the software and BIM workflow analysis [40]. BIM has also been used for planning and executing construction inspections with unmanned aerial vehicles [41] for integrating BIM into lifecycle project management [42] and for sustainability practices in construction projects [42]. Some of the advantages are the quick temporal scale of real-time collaborative reconstruction [43], spatial scale in virtual tours, and informational modelling for the conservation of cultural heritage sites [44].
Sustainability assessment encompasses environmental, economic and social aspects in all areas of the economy [45], and there are different methods for impact assessment, the most commonly used in BIM methodology being life cycle analysis (LCA) [42]. Recently, the use of BIM for sustainability has been cited [34]. In this sense, the integration of social sustainability in BIM was reported [46].
One of the first works using BIM for sustainability and urban purposes studied the environmental performance and physical spatial urban planning applied for construction engineering in a new com development [47]. Furthermore, when applied by public infrastructure owners in urban planning and consultation, social benefits can be obtained using BIM in the development of new and healthy green spaces such as parks, avenues, and streets [48] to consider the environmental effects on the population [49]. For instance, in green urban areas, the allergenic factor is significantly important when trees are selected to improve the quality of life of those affected [50,51]. Therefore, in 6D, information is added to the 3D model to assess sustainability over the lifetime of the infrastructure. To carry out the assessment of air quality, and in particular its allergic potential, within the BIM technology, it is necessary to determine what information of the urban green infrastructure should be modelled and what information is required, which will vary depending on the phase of the project [52].
Recently, LiDAR information has been used in BIM for the reconstruction of building information models in high-density urban areas, as BIM technology enables the generation and management of built environments in smart cities based on their physical and functional data [53]. One of the main performances of BIM is to model 3D environments from point clouds for project coordination [54]. In smart cities, 3D urban virtual model generation methodologies [55] can be used for the mitigation of noise impact [56], maintenance work orders [57] and 3D traffic noise mapping [58]. In addition, geometric models have been integrated with site images and GIS-based data on Google Earth [59].
The interaction between LiDAR and BIM allows a better workflow for data exchange [60]. LiDAR is becoming an effective and widely available method for obtaining spatial information [61] and is a precise technique when managed with Autodesk ReCap [62] and Autodesk Civil 3D for urban modelling [63]. Autodesk InfraWorks has been recently used to create an integrated BIM–GIS [64] and to integrate BIM and 3D GIS for documentation and restoration of historical monuments [65].
3D models of urban areas have applications in urban planning visualisation, such as in risk maps. Environmental impact assessments related to the urban green infrastructure and aerobiological content (pollen grains) reveal the strong correlation between the tree canopy and the health effects associated with the proximity to different types of vegetation and the specific exposure [66]. The accurate measurement of ornamental trees of urban green infrastructure (height, crown width, or trunk thickness) is important for these fields, and LiDAR is a suitable tool to improve its accuracy. This tool could improve the estimation of aerobiological indices such as the urban green zone allergenicity index (IUGZA) [7] or the aerobiological index of risk for ornamental trees (AIROT) [67]. Further, the measurement of the distance between the source element of vegetation and a reference point, as the potential exposure of humans, could improve the study of the local environmental dispersion of air quality (based on biological spectra, such as pollen grains) derived from the urban green infrastructure [68].
An update of the value of potential allergenic (VPA) of 150 Mediterranean urban forests species has been published being a useful tool for management and planning of green areas, and also a risk mitigation measure for people affected by pollen allergen [69]. The IUGZA provides valuable information in 2D as a management tool for evaluating certain aspects that may need to be modified in order to minimise their allergenic impact, including the presence of single species stands, hedges, and tree screens, and the prevalence of male trees.
Recently, urban environmental studies have been produced in 3D considering spatiotemporal morphological databases for urban green infrastructure [70], wind loading on scaled down fractal tree models [71], landscape patterns and land surface temperatures [72], and urban street canyons [73]. Laser-scanned 3D models can help take advantage of subtle topographic differences to support water management, capture significant site features, and provide an accurate site inventory that could reduce the cost of displaced terrain and replanted trees. A design development based on features documented in the point cloud model increases the control to shape environments that contribute to the process of accumulation occurring in the landscape [74].
Knowing the importance of aerobiological models for human health and the improvement in the accuracy of the data obtained when a 3D representation is made, the aim of this research is to propose a methodology that allows the analysis of the sustainability associated with allergic risk in urban projects. This is achieved by integrating the BIM methodology objects of the urban green infrastructure with different levels of information, which are applied according to the design phase. By adding aerobiological information to these objects, the IUGZA can be evaluated in a 3D urban environment at the urbanisation scale. In the development of 3D models and BIM objects, LiDAR is used to obtain georeferenced information of the environment, making it possible to generate the BIM model of a real urban green infrastructure. In this case, the potential risk of environmental impact has been accurately assessed using the IUGZA in the study area located at the Engineering Agricultural School (EAS) of the University of Extremadura in Badajoz (SW Spain).

2. Materials and Methods

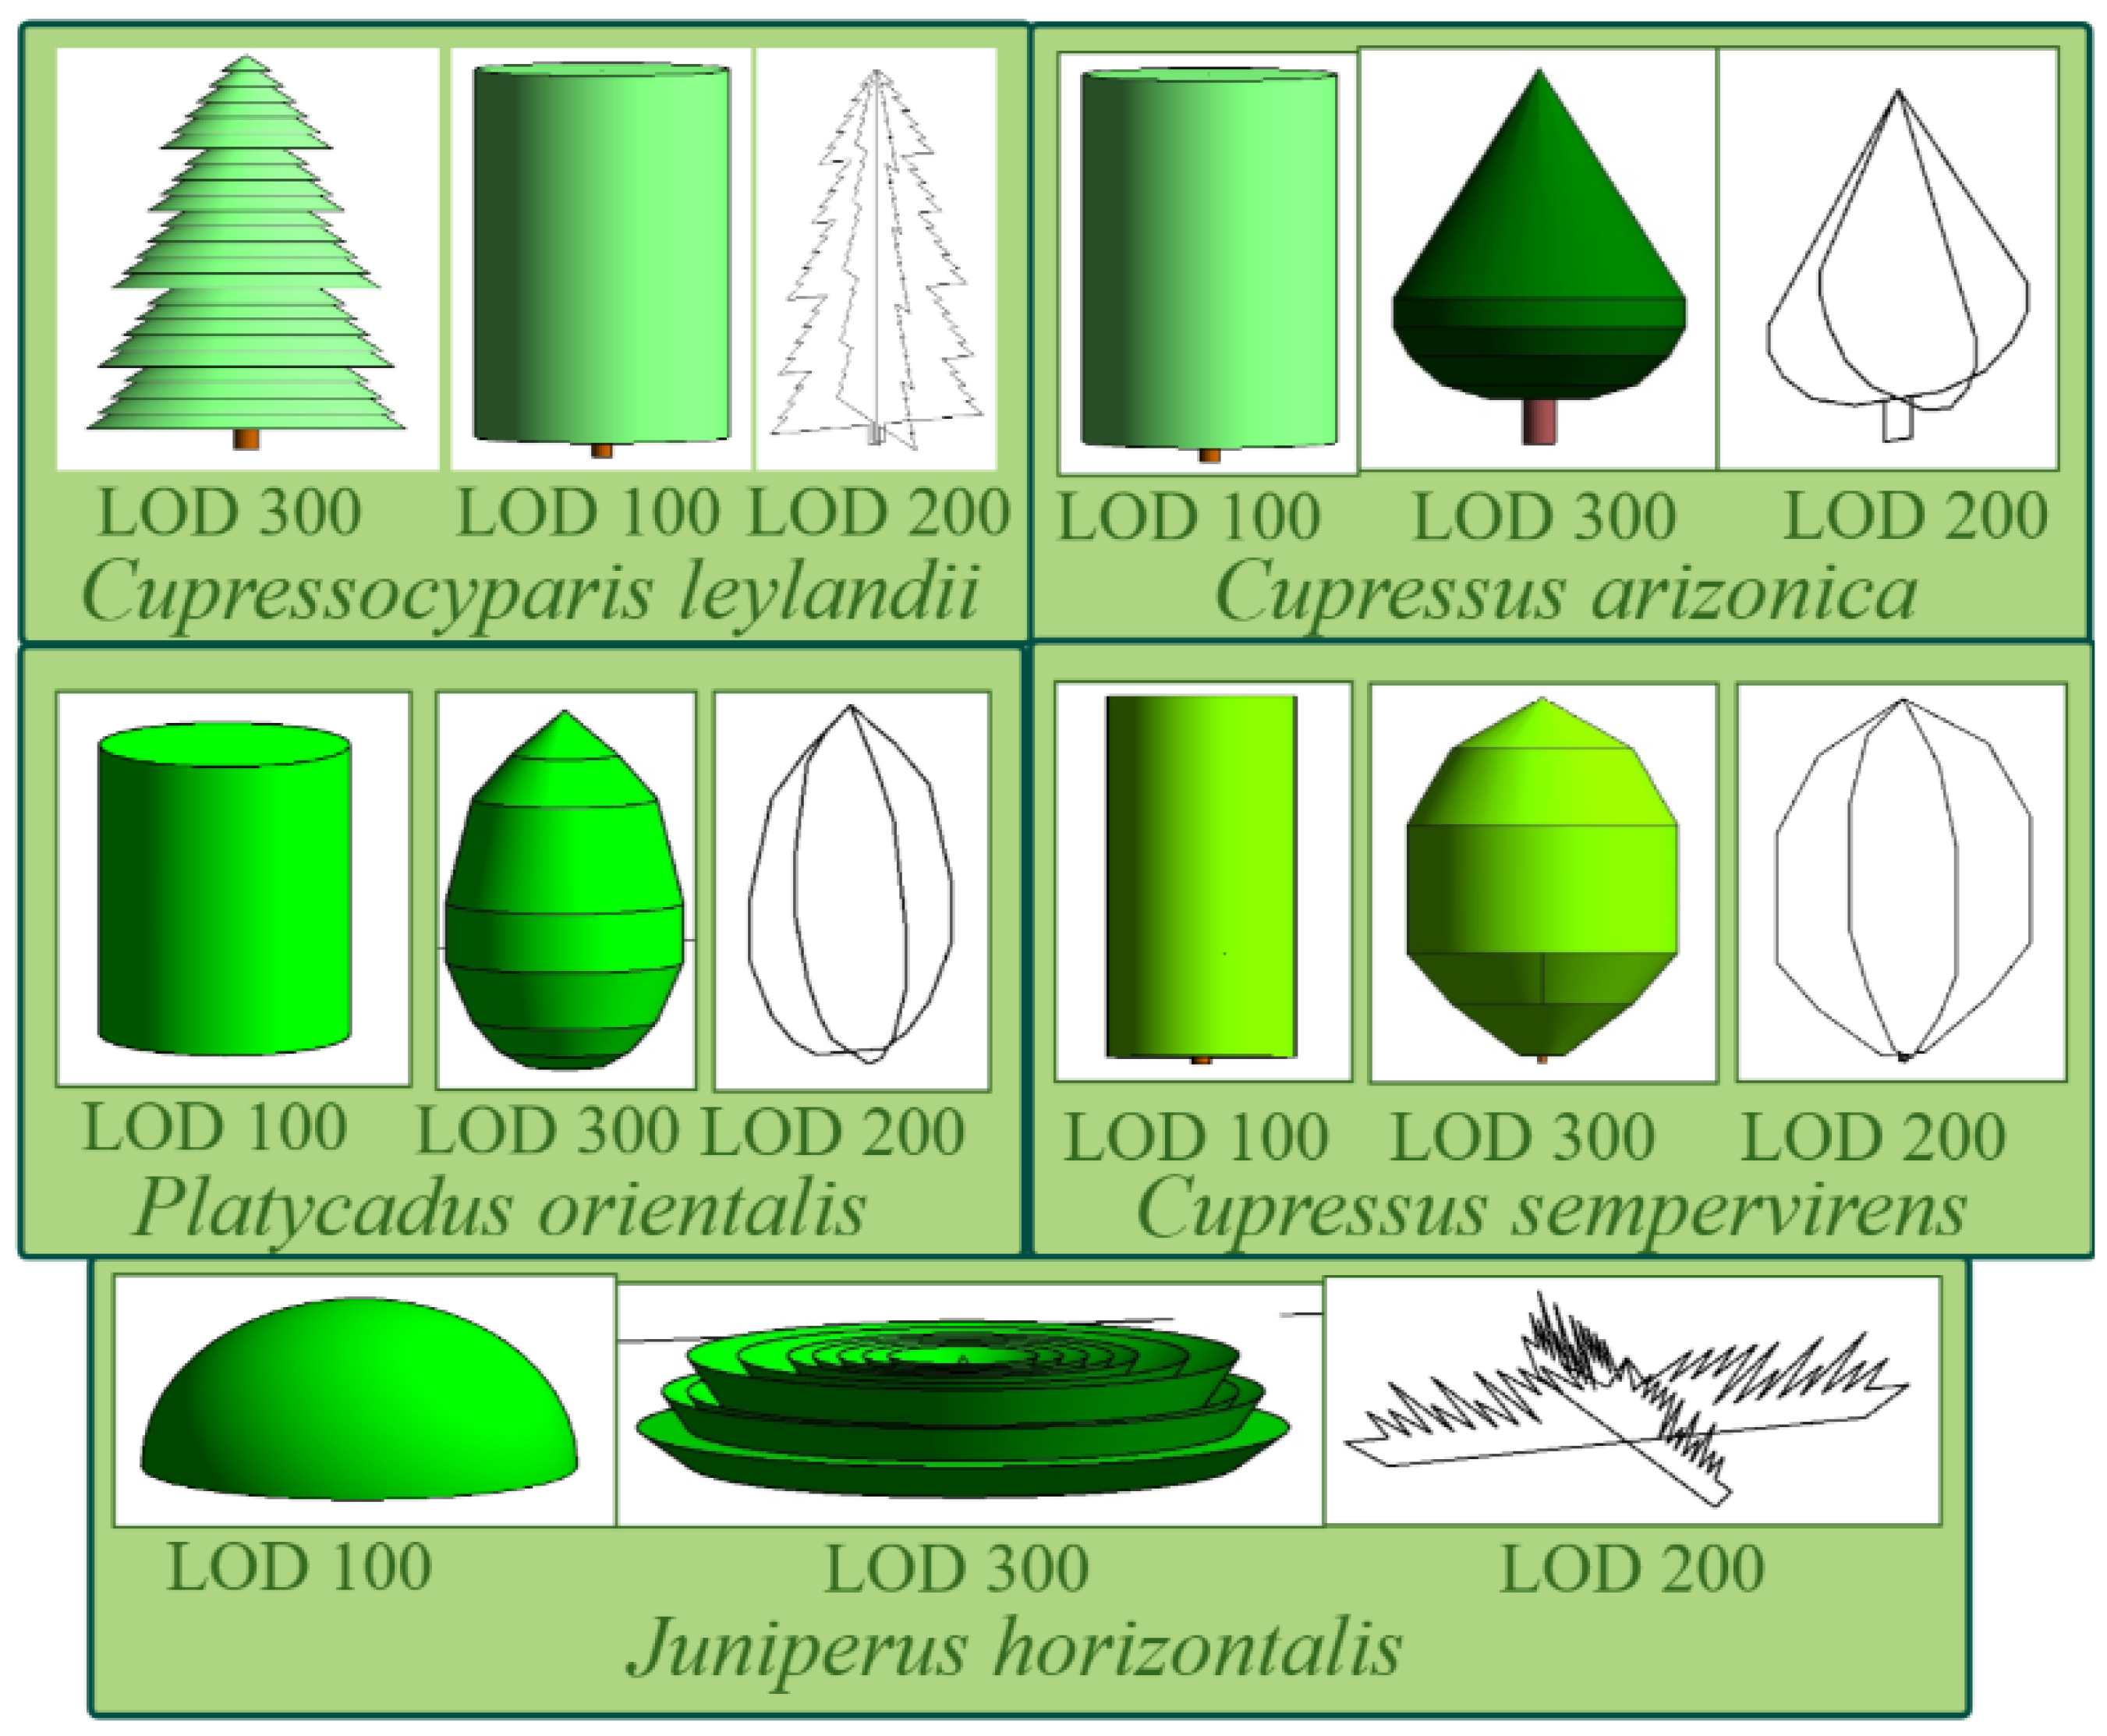
2.1. Sampling Site and Urban Green Infrastructure

The study was conducted at the EAS of the University of Extremadura in Badajoz (38°53′45″N, 6°58′07″W). The data used included individuals of urban green infrastructure with allergenic interest, geo-localized with coordinates, based on cypress trees (191) of Cupressus sempervirens (68), Cupressus arizonica (21), Cupressocyparis leylandii (92), Platycadus orientalis (5), and Juniperus horizontalis (5). Previously, using Google Maps, the area of Cupressaceae trees in the EAS was identified to plan the route for mobile mapping, as in a previous study [75]. This area has a radius of approximately 250 m (a Hirst volumetric sampler was taken as an example of a potential pedestrian, and from this midpoint the area was divided into sections of 30°).

2.2. Obtaining Data from the Environment Using LiDAR

LiDAR data were scanned on 31 May 2018 with a mobile mapping vehicle and, using Google Maps for orientation, the trees were geo-localised with coordinates within a distance of 250 m around the aerobiological sampling point of air quality. The LiDAR technology is used for construction projects, considering the buildings, trees, and other environmental elements, with remarkable accuracy (generally less than 15 mm) and high resolution [76]. LiDAR sampling was performed with the IP-S3 HD1 device on a car and a laptop (Figure 1a. LiDAR data were processed, scanned, and registered using the TOPCON Mobile Master Office software. This software provides an interface for combining, viewing, projecting, and working with sensor data from the IP-S3 HD1. This system consists of a dual-frequency global navigation satellite system (GNSS) [77] receiver that establishes a geospatial position and an inertial measurement unit (IMU) [78]. There is a connection to the external wheel encoder obtaining odometry information [79], with a panoramic camera of 30 megapixels and 360° rotation [80] recording additional imagery for enhanced clarity and a high-definition laser scanner (with a reach of 100 m and an angle of 40°). They captured high-resolution images with high-density 3D point clouds. During the process, data were executed using the Mobile Master Office software and then projected into 3D global coordinates with accurate time stamps. Finally, a geo-referenced panorama was produced. These components worked in parallel to obtain a highly precise 3D position for the vehicle, which can lose the signal by interruptions such as buildings, bridges, or tree lines [81].
The captured data was then imported to an external hard drive, in an LAS format, which was put in order according to the workflow of the IP-S3 HD1 system (Figure 1). The LAS dataset stores references to one or more LAS files on the disk, as well as to additional interface features. This file is an industry-standard binary format for storing airborne LIDAR data. The first step consisted of point cloud and panoramic image processing with the official Mobile Master Office software to export gross data (Figure 1b). These files were sorted into categories according to the way they were processed. Second, data were imported in the Magnet Collage v1 53 TOPCON software to create “.las” and “.ipsx” format points of the clouds. These point clouds must be previously managed in ReCap [60,74] to eliminate unnecessary zones, adjust the point density according to the intended use or, if the file is very large, divide the cloud into zones to improve the performance of the programme (Figure 1c). This was done for cleaning noise points and to obtain a lighter cloud of points before it was used in 3D modelling using Revit [82] to model buildings and trees (Figure 1), considering the high-density of the 3D point cloud and geo-referenced data on urban green infrastructure in urban planning environments.

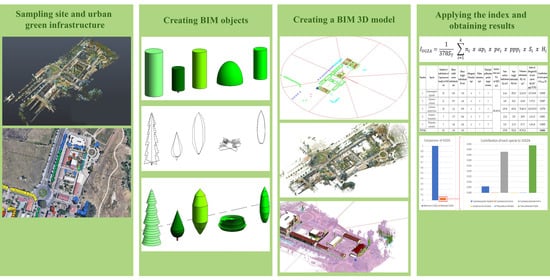
2.3. BIM Objects of Urban Green Infrastructure for Allergenicity Index

The model considers BIM objects (elements) based on the level of detail or level of information (LOD/LOI) [83] with the parameters of urban green infrastructure individuals required to analyse the IUGZA [7] (Equation (1)).
I UGZA = 1 378 S T   i = 1 k n i ×   ap i ×   pe i ×   ppp i ×   S i ×   H i
where k = number of species, ni = number of individuals belonging to the i-species, api = 0, 1, 2, 3, or exceptionally 4 for the main local allergens (allergenic potential of the i-species), pei = 1, 2, 3 (pollen emissions of the i-species in pollen grains/m3 of air), pppi = 1, 2, 3 (duration of the main pollination period of the i-species in weeks), Hi = tree height of the i-species in m, Si = surface area covered by the i-species in m2, and ST = total surface area of the park in m2. IUGZA [7] with the last update of the value of potential allergenic (VPA) in Mediterranean urban forests species [84] were used to estimate the allergenic potential.
The BIM objects were created with the bioparameters of the BIM tree families according to the type, taxon, height, width, crown tree volume, hedges, shrubs, and distance to the Hirst volumetric sampler. The construction of the model of the five different species of cypresses; namely, Cupressus sempervirens, Cupressus arizonica, Cupressocyparis leylandii, Platycadus orientalis, and Juniperus horizontalis, considered the necessary parameters and the distance to the potential pedestrian. The development of a project involves different phases that require different levels of information [85]. Therefore, the tree families were modelled in Revit with different LODs, which were represented as coarse (LOD 100), medium (LOD 200), and fine (LOD 300) (Figure 2). These files included the height and width of the urban green infrastructure individuals with the function “shared parameter” [86], which is shared by the different Revit tree families (Figure 3). The Revit tree family in LOD 100 designed in the view “front elevation” was used to obtain the geometric information of the tree crown, shrubs, and hedges, and to calculate the volume [7], based on the estimation of vegetation volume of a basic geometric figure as its morphotype (Figure 2). The surface area occupied by each species was calculated by the maximum horizontal crown projection area of the geometric figure that represents the specimen, obtaining the information from the LOD 100 objects in the model. Objects with LOD 200 and 300 were modelled in the views “front elevation”, “reference level”, and “back elevation” of Revit, thus obtaining different views in the 3D model to create the family Revit file. Finally, the obtained bioparameter measures were applied to the IUGZA according to the proposed methodology [7].

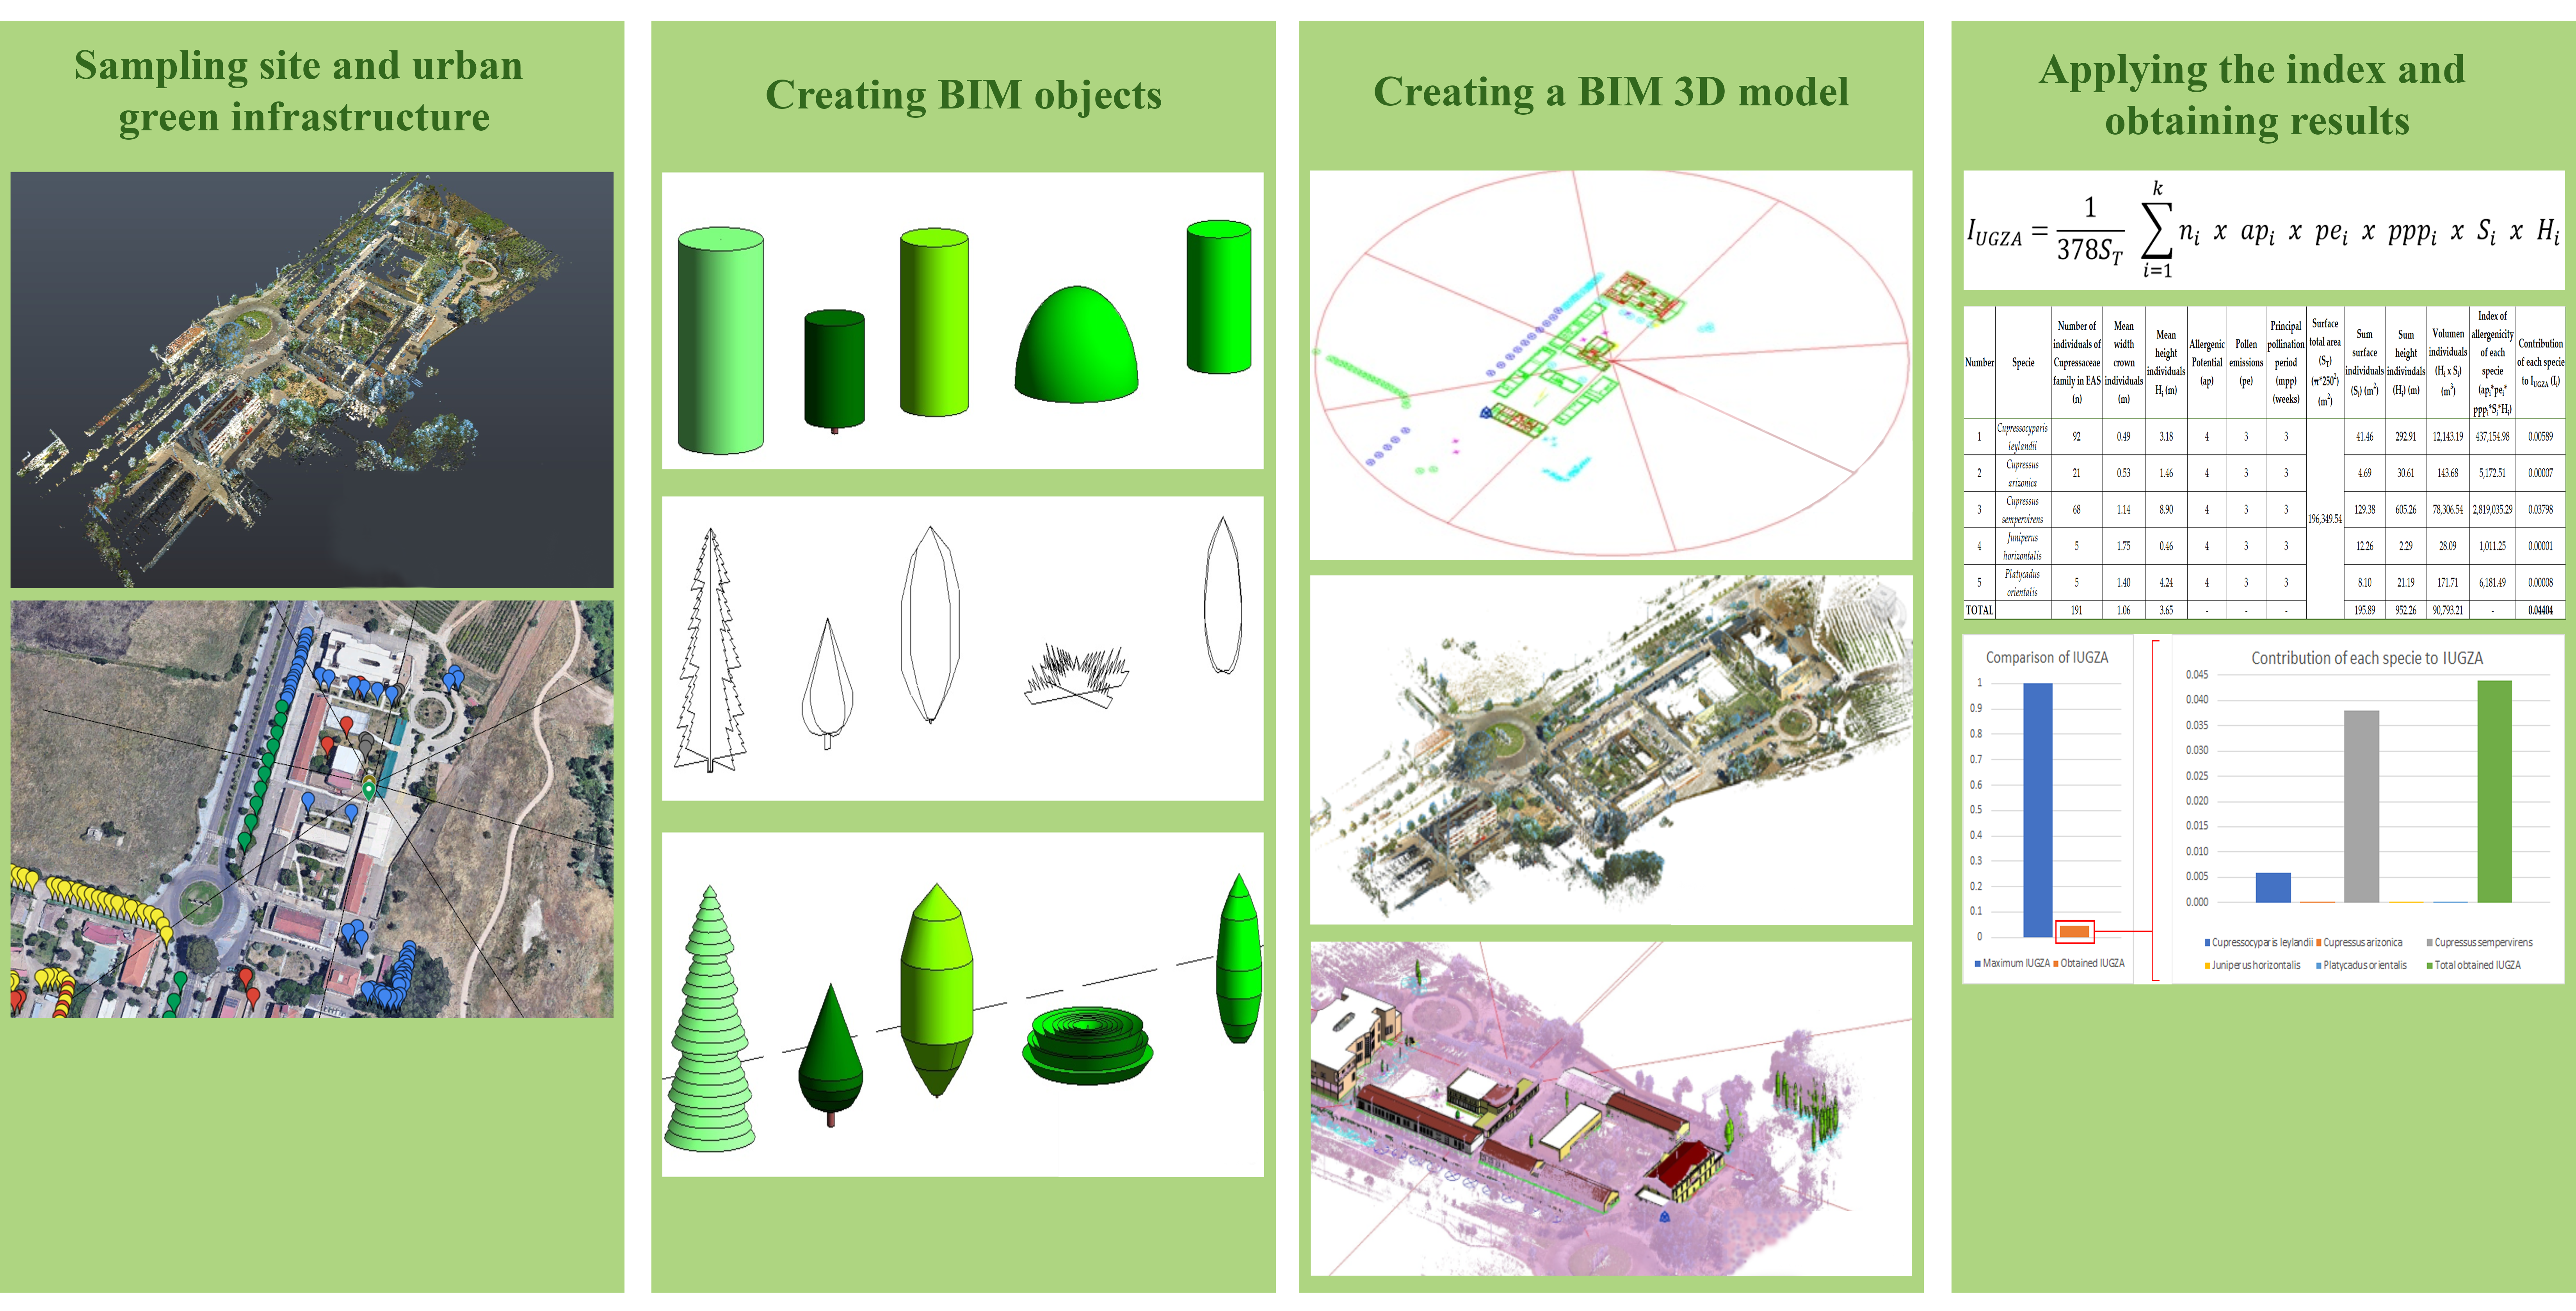
2.4. Creation of 3D and 6D BIM Model with Aerobiological Information

In the first phase, the BIM was used in this study to develop the previous information from the area of the EAS in a 3D representation [43], which was loaded into Revit for generating the 3D model. Differentiating Cupressaceae specimens in the study area from the LiDAR point cloud loaded in Revit must be done manually with this handicap. However, we can use the green urban infrastructure as georeferenced with GPS, according to the previous studies [87,88]. Then, the urban green infrastructure (tree points) was georeferenced with a mobile GPS device in a fieldwork. For this purpose, we imported the list of georeferenced tree points on Google Maps in .kml format [3] to be then exported to AutoCAD Civil 3D in UTM coordinates [89] (Figure 4) in a .dwg file. The keyhole markup language (KML) is an XML-based format for storing geographic data and related content and is an official standard of the Open Geospatial Consortium (OGC). Meanwhile, .dwg (from drawing) is a proprietary binary file format used for storing 2D and 3D design data and metadata. This file, based on the georeferenced points of Google Maps, was used to create a 3D model with Revit [90] in .rvt and .rft formats. The .rvt project file contains all the information needed to work on an architectural project, for example, sections, elevations, and floor plans. The Revit software uses .rft 3D data files in the creation of templates of data structures organised in a way that is very useful for design projects. In the third step, the building plan from the EAS was verified and adapted to the UTM coordinates.
The second phase consisted of building the 3D model with Revit. The work was divided into two steps: the development of tree BIM objects and the modelling of buildings in 3D with the plan in UTM coordinates and LiDAR point clouds. The trees were modelled with colour and represented in 3D as a Revit element family [91], including different LODs (coarse, medium, and fine) (Figure 3). The aim was to create a Revit database related to the 3D model defined in Revit with the data to be applied to the IUGZA [7]. The IUGZA values were normalised from 0 (minimum allergenic potential) to 1 (maximum allergenic potential) to be more easily estimated and compared.
The parameters for calculating the IUGZA were included in the 3D BIM model for each specimen of urban green infrastructure in the study area. Using Revit schedules, the 3D representation of the objects (the studied specimens) was related to their own parametric information. An IUGZA for each species in the studied area was calculated by exporting a Revit schedule to Excel; then, it was normalised between 0 and 1, and the IUGZA for the studied area was calculated. The steps are shown in the workflow of BIM (Figure 4).

2.5. InfraWorks Data Processing

Revit objects were imported to InfraWorks to create a 6D simulation [92] by introducing a sustainability dimension into the BIM model, showing the potential allergenic impact area. The Infraworks software is commonly used to simulate building processes. In this study case, InfraWorks was used to simulate the evolution over time of the allergenic potential by importing the .rvt files previously created in Revit. A dynamic 3D representation of the study zone was created to visualize the engineering integration of the building with green infrastructure (Figure 5).

3. Results

3.1. Measures of Trees and Application in Aerobiological Index

Table 1 presents the measures of bioparameters in the BIM model generated for the green infrastructure individuals Cupressocyparis leylandii, Cupressus arizonica, Cupressus sempervirens, Juniperus horizontalis, and Platycadus orientalis in the EAS within 250 m around the point of reference. Cupressocyparis leylandii was the most abundant species in the area (92 individuals), while Juniperus horizontalis (5) and Platycadus orientalis (5) were less representative. On average, Cupressus sempervirens was the tallest species (8.90 m), and Juniperus horizontalis the widest (1.75 m). The total canopy surface of the individuals was 195.89 m2, and the total surface area was 196,349.54 m2, and thus there was a 0.10% ratio of surface occupation by urban green infrastructure. The studied canopy volume was 90,793.21 m3. The allergenic potential of most of the species was 4, representing a high allergenic species, but a further value 4 was given to five studied species, representing a potentially higher allergenic impact on residents and pedestrians. The pollen emission parameter was 3 for all the studied specimens, according to their pollination strategy, representing wind-pollinated species. The main pollination period parameter was 3 for the specimens, with the maximum possible value according to the number of weeks of the pollination period.
The largest contribution of a species to the IUGZA is that of Cupressus sempervirens, with a value of 0.03798 (Figure 6), although it is not the most abundant species according to the number of specimens in the study (68). This is due to the larger surface area occupied by the species and the larger volume of individuals. The total contribution of the Cupressaceae species to the IUGZA was 0.04404. The obtained allergenic value does not exceed the limit value of 0.5, which is indicative of the high allergenicity areas mentioned [7] and the 0.3 value is considered sufficient for allergy-sensitive populations [93].
The potential of pollen emission of the studied species was close to the maximum possible values. It could be understood as a study area with very high allergenicity; however, the IUGZA has a value close to 0 (0.04404), which is due to the low ratio of occupied surface area by urban green infrastructure (0.10% of the studied area).

3.2. Proposal of Construction Model

The proposed construction model is based on the process of the EAS building in Revit with the point clouds and the creation of BIM objects with a higher level of development from the geometry obtained by LiDAR (Figure 2). The results of the five BIM object families for trees belonging to urban green infrastructure with the three LODs (100, 200, and 300) are shown with different visualisations. In this way, it is observed that an accurate level of geometric definition of each species increases the development level of the BIM object, which must be associated with the level of development and the information with which the green infrastructure is being modelled. This allows the optimisation of the graphic and data information according to the phase in which the works are carried out: planning, project, construction, or exploitation.

3.3. 6D Urban Environment

Figure 6 shows a simulation of the Revit project (buildings and urban green infrastructure) to recognise the study area. In this case, the representation of the Revit tree families was possible by using the system coordinates of the tree from LiDAR. This is highlighted with the InfraWorks simulation, where the study area conditions are shown, and it is possible to recognise the tree species included in this research.

4. Discussion

This study is a further step in the academic application in urban planning of an engineering tool such as BIM that integrates the urban green infrastructure (cypress trees). We managed to determine the location of the original trees in coordinates within a specified area and calculate with automatic tools the tree crown parameters of height and width to estimate the allergenic potential based on the IUGZA proposed by Cariñanos et al. [7]. We also analysed the relationship between the distance of the trees to the Hirst volumetric sampler, as an example of a potential person (pedestrian). This has been possible by the digitalisation of the urban green infrastructure through LiDAR, which allows the subsequent integration of the information associated with it into a BIM model. Using these BIM objects and building CAD information, it was possible to create a detailed 3D model of the EAS in Badajoz (Extremadura). This model shows that BIM can provide a workflow for managing LiDAR information in the analysis and classification of different tree species [94].
The BIM workflow was developed using LiDAR data, without an elevated processing cost, by employing a novel laser capture system scanner on a vehicle, in contrast to other studies [95]. This was possible with a reduced processing requirement because LiDAR data were directly obtained at high speed without needing to be deciphered or interpreted. The data processed in BIM offers greater detail when compared to a 2D image registration [96] in the GIS environment of a georeferenced mask [97].
A 3D model of a forest by BIM using the design software Flow from Autodesk was developed by Baker et al. [26], and it served as a reference for our research. Based on this methodology, it was possible to design a digital environment with urban environmental information related to the environmental impact [93], specifically that related to the allergenicity index IUGZA. Recently, the relationship between pollen grain concentration and green infrastructure using the BIM methodology (to establish the “air quality in the cities”) was developed [68], thus advancing the digitalisation of green infrastructure information. That study only modelled the building and the interaction of the pollen with it. In this investigation, further progress was made knowing that it is possible to integrate not only the building but also the green infrastructure into a BIM model. This has been achieved in the present study, which will allow the analysis of the interaction between green infrastructure and buildings, as well as the application of a sustainability parameter, the aerobiological index (IUGZA).
Remote sensing is increasingly being applied to the management and design of urban spaces [98]. LiDAR data is being applied in environmental urban studies as a tool to measure distances and dimensions, such as height and canopy of trees. The source of such data is either public, such as the National Geographic Institute aerial sampling data used [87,88] or, as in our case, through the use of portable devices. This sampling has the advantage of more accurate sample data (e.g., dimensions of urban green infrastructure), which is one of the main challenges of the present study.
Measures of the tree canopy and trunk with a LiDAR point cloud for applying precise data to the BIM objects of the green infrastructure (Figure 4) were developed following previous studies and overcoming problems described in the literature. The image resolution of the LiDAR point cloud allows the recognition of landscape elements with clear visibility [99]. The tree/shrub crown height and width were calculated with bioparameters for their introduction into the BIM model and the subsequent relationship with the rest of the allergenic parameters. This proved the level accuracy (less than 15 mm) that can be obtained with measures of the earth terrain models derived from LiDAR point clouds [100]. This represents a distinction with regard to similar studies applying IUGZA because of the advantage in the accuracy (less than 15 mm) of some obtained parameters using the LiDAR technology. For example, the surface area of individual parameters or the volume of individual parameters are very close to reality because the measures to calculate them are based on capture with LiDAR and not on observations and estimates [93]. It should be noted that the mobile mapping route did not have the right speed, and some parts were difficult to recognise in the point cloud because the impulses did not have sufficient time to impact the elements. The same problem was previously reported [101], and the error analysis was based on a reference point or on a common point [11] with limitations in LiDAR laser scanning [101]. Table 1 presents the results obtained from the BIM model, highlighting a high LOD and the accurate measures for applying the allergenic potential using the IUGZA [102]. This can be applied in new urban scenarios of urban planning to reduce or avoid the potential affection of allergy patients as a result of the presence of tree species with allergenic effects, such as cypress trees. In relation to the previous study [102], our study allowed us to achieve more exact measurements within the ranges proposed [102] for horizontal crown projections (trees/shrubs); that is, small diameter <4 m, medium diameter 4–6 m, and large diameter >6 m, and for heights considering a simplified scale: 2, 6, 10, 14, and, exceptionally, 18 m.
Ref. [102] proposed IUGZA for estimating the environmental assessment of allergenic sustainability based on an inventory for urban parks in Granada (South Spain) with 788 specimens of trees, shrubs, and herbs, belonging to 77 taxa and 32 botanical families species in 71,500 m2 area, and reported a value of Allergenicity Index (0.14) in a range of values (0.00–1.00) to establish the rank of potential allergenicity of an urban park. In our case, we have studied the ornamental vegetation focus on Cupressaceae family with urban planning interest of an Universitary centre of Badajoz (Southwest Spain) with 191 trees in 195.89 m2 of 196,349.54 m2 studied area and reporting a lower IGUZA value (0.044). A study devoted to several Spanish urban parks [93] indicated values, surface and trees around the studied city, as for other urban parks in Badajoz (0.08 in 10.800 m2 of 116 trees), Cáceres (0.20 in 40.036 m2 of 367 trees), Plasencia (0.07 in 56.6 m2 of 22 trees), Sevilla (0.30 in 316,800 m2 of 3697 trees), Salamanca (0.87 in 23,512 m2 of 321 trees), and Córdoba (0.13 in 30.542 m2 of 356 trees), among other cities placed in the South of Spain.
We propose the utilisation of BIM in sustainability data management, which can be useful in environmental impact assessments, because it presents a complete model that integrates buildings, urbanisation, and urban green infrastructure. As a collaborative tool, it can be accessed and examined by other interested parties and different professionals who can enter data in the same model, thus facilitating the public information as a legal requirement in the development of projects [103]. Furthermore, it is possible to study the relationship between the energy demand of buildings in cities with trees to obtain a concrete solution for this demand [99]. The results obtained in this research could be helpful in terms of sustainability for urban planners, policy makers, and city inhabitants. By applying the methodology of this work, the potential exposure to urban green infrastructure in cities or urban sections can be determined. In addition, the results of this research could be applied in the design phase of new urban areas to simulate scenarios of exposition to the urban green infrastructure and make decisions based on them.
The project evolved from a conceptual phase to the complete development of construction [103]. To assess the allergenicity evaluation at each stage, the BIM objects of the trees were created with different LODs, with the most appropriate geometric definition and information (LOD) according to the phase. With this performance, our study offers a new visualisation of a previous study [102]. The obtained bioparameters with Revit tree families open the opportunity to work with a higher level of precision using different LODs in BIM. They can be shown by the different BIM dimensions [34], 4D [35], 5D [36], 6D [37], 7D [38] or phases [100]. Further, the choice of a BIM workflow with different software depends on the capacity of the countries where the studies are conducted [40].
Therefore, BIM is a tool for managing construction information until obtaining a workflow, enabling teams to manage a project through a model based on a cooperative approach, which integrates data [42], processes, and results to solve a problem or study case. In our case, it was used in smart cities for the benefit and quality of life of the population. Another way to apply these projects in construction is by BIM 6D [101], which is included as a part of a construction project. Urbanisation projects carried out using BIM models that integrate these developed BIM objects and their associated information will be able to carry out an allergenic evaluation and integrate this aspect of sustainability into 6D. The representation of the studied area in a 3D model and the creation of an animation path with atmospheric effects is an advantage of our research, which is scalable to larger projects in extension and to other urban environments. It allows the visualisation and understanding of the conditions of the studied area and tree species in the model, helping citizens and urban planners to understand the potential exposure to urban green infrastructure.
New tools may be tested in this research line to obtain an environmental vision approximate to reality, such as programming in BIM the aerobiological concentration data and adding meteorological parameters. The ISTRAM program [102] could be used as BIM software to model the pedestrian infrastructure (sidewalks) and to find pedestrian itineraries that minimise pollen exposure to allergy sufferers following the proposal of healthy itineraries [88].
A future research line may be the combination of the developed method with computational fluid dynamics (CFD) simulations, allowing the introduction of meteorological parameters and their influence on the study model. With the BIM model and wind study, the characteristics of trees can be determined and their distribution can be analysed using CFD simulation software. This may represent a progress in the study of dispersion of pollen particles by means of wind simulations, allowing the determination of higher concentrations of pollen particles as a result of deposition on different urban surfaces [103]. The next performance could be the combination of green infrastructure and aerobiological and meteorological information to assess the environmental impact using BIM.

5. Conclusions

The novelty of this study is that it proposes the criteria and methodology to model the current urban environment from LiDAR point clouds into a BIM-based application of an aerobiological index as a parameter of environmental sustainability. The result is helpful for the development of the 6D of the BIM methodology applied to urban planning because it can reflect the environmental information to understand the potential allergenic factor risk and its impact on the urban population. From the BIM model with the 6D information of urban green infrastructure, in this case cypress trees, the bioparameters and potential risk distance for allergic people can be calculated more accurately than when using traditional measures or estimations, and an aerobiological index such as IUGZA can be applied.
The workflow described in our research opens interesting avenues for future research, aiming at routes of less potential allergenic exposure. This innovation is important as a tool for urban planning in the construction of actual 3D environments or for designing new scenarios to work in 6D as a tool to prevent future problems in urban areas during construction projects.

Author Contributions

Conceptualization, S.F.-R. and J.P.C.-P.; methodology, S.F.-R.; software, E.Q.-M.; validation, E.Q.-M., J.P.C.-P. and J.F.F.-A.; formal analysis, S.F.-R.; investigation, E.Q.-M.; resources, S.F.-R.; data curation, E.Q.-M.; writing—original draft preparation, J.F.C.; writing—review and editing, J.F.C.; visualization, J.F.F.-A.; supervision, J.F.C.; project administration, M.G.; funding acquisition, S.F.-R. All authors have read and agreed to the published version of the manuscript.

Funding

This research was funded by the research project IB16029 and the research group aid GR18113 and GR18032 financed by the Regional Government, Junta de Extremadura (Spain), and the European Regional Development Fund.

Acknowledgments

Authors want to thank companies Topcon and Ayeria for the provided support.

Conflicts of Interest

The authors declare no conflict of interest.

References

  1. Ćwik, A.; Wójcik, T.; Ziaja, M.; Wójcik, M.; Kluska, K.; Kasprzyk, I. Ecosystem services and disservices of vegetation in recreational urban blue-green spaces—Some recommendations for greenery shaping. Forests 2021, 12, 1077. [Google Scholar] [CrossRef]
  2. Livesley, S.J.; McPherson, G.M.; Calfapietra, C. The urban forest and ecosystem services: Impacts on urban water, heat, and pollution cycles at the tree, street, and city scale. J. Environ. Qual. 2016, 45, 119–124. [Google Scholar] [CrossRef] [PubMed]
  3. Maya-Manzano, J.M.; Fernández-Rodríguez, S.; Monroy-Colín, A.; Silva-Palacios, I.; Tormo-Molina, R.; Gonzalo-Garijo, Á. Allergenic pollen of ornamental plane trees in a Mediterranean environment and urban planning as a prevention tool. Urban For. Urban Green. 2017, 27, 352–362. [Google Scholar] [CrossRef]
  4. Anisimova, S. Inventory of allergenic pollen Urban dendroflora as a basis for designing healthier green infrastructure. For. Ideas 2020, 26, 452–470. [Google Scholar]
  5. Nowak, D.J.; Ogren, T.L. Variations in urban forest allergy potential among cities and land uses. Urban For. Urban Green. 2021, 63, 127224. [Google Scholar] [CrossRef]
  6. Ciani, F.; Dell’Olmo, L.; Foggi, B.; Mariotti Lippi, M. The effect of urban green areas on pollen concentrations at ground level: A study in the city of Florence (Italy). Urban For. Urban Green. 2021, 60, 127045. [Google Scholar] [CrossRef]
  7. Cariñanos, P.; Casares-Porcel, M.; Quesada-Rubio, J.-M. Estimating the allergenic potential of urban green spaces: A case-study in Granada, Spain. Landsc. Urban Plan. 2014, 123, 134–144. [Google Scholar] [CrossRef]
  8. Tan, X.; Han, L.; Zhang, X.; Zhou, W.; Li, W.; Qian, Y. A review of current air quality indexes and improvements under the multi-contaminant air pollution exposure. J. Environ. Manag. 2021, 279, 111681. [Google Scholar] [CrossRef]
  9. Yu, S.; Yu, B.; Song, W.; Wu, B.; Zhou, J.; Huang, Y.; Wu, J.; Zhao, F.; Mao, W. View-based greenery: A three-dimensional assessment of city buildings’ green visibility using Floor Green View Index. Landsc. Urban Plan. 2016, 152, 13–26. [Google Scholar] [CrossRef]
  10. Sharafat, A.; Khan, M.S.; Latif, K.; Seo, J. BIM-Based Tunnel Information Modeling Framework for Visualization, Management, and Simulation of Drill-and-Blast Tunneling Projects. J. Comput. Civ. Eng. 2021, 35, 04020068. [Google Scholar] [CrossRef]
  11. Kaewunruen, S.; Lian, Q. Digital twin aided sustainability-based lifecycle management for railway turnout systems. J. Clean. Prod. 2019, 228, 1537–1551. [Google Scholar] [CrossRef]
  12. Cheng, L.; Chen, S.; Liu, X.; Xu, H.; Wu, Y.; Li, M.; Chen, Y. Registration of Laser Scanning Point Clouds: A Review. Sensors 2018, 18, 1641. [Google Scholar] [CrossRef] [PubMed] [Green Version]
  13. Priestnall, G.; Jaafar, J.; Duncan, A. Extracting urban features from LiDAR digital surface models. Comput. Environ. Urban Syst. 2000, 24, 65–78. [Google Scholar] [CrossRef]
  14. Bonczak, B.; Kontokosta, C.E. Large-scale parameterization of 3D building morphology in complex urban landscapes using aerial LiDAR and city administrative data. Comput. Environ. Urban Syst. 2019, 73, 126–142. [Google Scholar] [CrossRef]
  15. Lafortezza, R.; Giannico, V. Combining high-resolution images and LiDAR data to model ecosystem services perception in compact urban systems. Ecol. Indic. 2019, 96, 87–98. [Google Scholar] [CrossRef]
  16. Dandois, J.P.; Ellis, E.C. High spatial resolution three-dimensional mapping of vegetation spectral dynamics using computer vision. Remote Sens. Environ. 2013, 136, 259–276. [Google Scholar] [CrossRef] [Green Version]
  17. Tanhuanpää, T.; Kankare, V.; Setälä, H.; Yli-Pelkonen, V.; Vastaranta, M.; Niemi, M.T.; Raisio, J.; Holopainen, M. Assessing above-ground biomass of open-grown urban trees: A comparison between existing models and a volume-based approach. Urban For. Urban Green. 2017, 21, 239–246. [Google Scholar] [CrossRef] [Green Version]
  18. Chen, J.; Du, P.; Wu, C.; Xia, J.; Chanussot, J. Mapping Urban Land Cover of a Large Area Using Multiple Sensors Multiple Features. Remote Sens. 2018, 10, 872. [Google Scholar] [CrossRef] [Green Version]
  19. Recanatesi, F.; Giuliani, C.; Ripa, M.N. Monitoring Mediterranean Oak Decline in a Peri-Urban Protected Area Using the NDVI and Sentinel-2 Images: The Case Study of Castelporziano State Natural Reserve. Sustainability 2018, 10, 3308. [Google Scholar] [CrossRef] [Green Version]
  20. Seiferling, I.; Naik, N.; Ratti, C.; Proulx, R. Green streets—Quantifying and mapping urban trees with street-level imagery and computer vision. Landsc. Urban Plan. 2017, 165, 93–101. [Google Scholar] [CrossRef]
  21. Coleman, R.W.; Stavros, N.; Yadav, V.; Parazoo, N. A Simplified Framework for High-Resolution Urban Vegetation Classification with Optical Imagery in the Los Angeles Megacity. Remote Sens. 2020, 12, 2399. [Google Scholar] [CrossRef]
  22. Caynes, R.J.C.; Mitchell, M.G.E.; Wu, D.S.; Johansen, K.; Rhodes, J.R. Using high-resolution LiDAR data to quantify the three-dimensional structure of vegetation in urban green space. Urban Ecosyst. 2016, 19, 1749–1765. [Google Scholar] [CrossRef]
  23. Plowright, A.A.; Coops, N.C.; Chance, C.M.; Sheppard, S.R.J.; Aven, N.W. Multi-scale analysis of relationship between imperviousness and urban tree height using airborne remote sensing. Remote Sens. Environ. 2017, 194, 391–400. [Google Scholar] [CrossRef]
  24. Klingberg, J.; Konarska, J.; Lindberg, F.; Johansson, L.; Thorsson, S. Mapping leaf area of urban greenery using aerial LiDAR and ground-based measurements in Gothenburg, Sweden. Urban For. Urban Green. 2017, 26, 31–40. [Google Scholar] [CrossRef]
  25. Kong, Z.; Liu, Z.; Zhang, L.; Guan, P.; Li, L.; Mei, L. Atmospheric Pollution Monitoring in Urban Area by Employing a 450-nm Lidar System. Sensors 2018, 18, 1880. [Google Scholar] [CrossRef] [Green Version]
  26. Baker, K.R.; Woody, M.C.; Valin, L.; Szykman, J.; Yates, E.L.; Iraci, L.T.; Choi, H.D.; Soja, A.J.; Koplitz, S.N.; Zhou, L.; et al. Photochemical model evaluation of 2013 California wild fire air quality impacts using surface, aircraft, and satellite data. Sci. Total Environ. 2018, 637–638, 1137–1149. [Google Scholar] [CrossRef]
  27. Sicard, M.; Izquierdo, R.; Alarcón, M.; Belmonte, J.; Comerón, A.; Baldasano, J.M. Near-surface and columnar measurements with a micro pulse lidar of atmospheric pollen in Barcelona, Spain. Atmos. Chem. Phys. 2016, 16, 6805–6821. [Google Scholar] [CrossRef] [Green Version]
  28. Lovasi, G.S.; O’Neil-Dunne, J.P.; Lu, J.W.; Sheehan, D.; Perzanowski, M.S.; Macfaden, S.W.; King, K.L.; Matte, T.; Miller, R.L.; Hoepner, L.A.; et al. Urban tree canopy and asthma, wheeze, rhinitis, and allergic sensitization to tree pollen in a New York City birth cohort. Environ. Health Perspect. 2013, 121, 494–500. [Google Scholar] [CrossRef]
  29. Noh, Y.M.; Lee, H.; Mueller, D.; Lee, K.; Shin, D.; Shin, S.; Choi, T.J.; Choi, Y.J.; Kim, K.R. Investigation of the diurnal pattern of the vertical distribution of pollen in the lower troposphere using LIDAR. Atmos. Chem. Phys. 2013, 13, 7619–7629. [Google Scholar] [CrossRef] [Green Version]
  30. Noh, Y.M.; Müller, D.; Lee, H.; Choi, T.J. Influence of biogenic pollen on optical properties of atmospheric aerosols observed by lidar over Gwangju, South Korea. Atmos. Environ. 2013, 69, 139–147. [Google Scholar] [CrossRef]
  31. Sassen, K. Identifying Atmospheric Aerosols with Polarization Lidar. In Advanced Environmental Monitoring; Kim, Y.J., Platt, U., Eds.; Springer: Dordrecht, The Netherlands, 2008; pp. 136–142. [Google Scholar]
  32. Cao, X.; Roy, G.; Bernier, R. Lidar polarization discrimination of bioaerosols. Opt. Eng. 2010, 49, 116201. [Google Scholar]
  33. Glennon, J.; Nichols, T.; Gatt, P.; Baynard, T.; Marquardt, J.; Vanderbeek, R. System performance and modeling of a bioaerosol detection lidar sensor utilizing polarization diversity. In Proceedings of the SPIE 7323, Laser Radar Technology and Applications XIV, 73230T, Orlando, FL, USA, 9 May 2009; Volume 7323. [Google Scholar]
  34. Charef, R.; Alaka, H.; Emmitt, S. Beyond the third dimension of BIM: A systematic review of literature and assessment of professional views. J. Build. Eng. 2018, 19, 242–257. [Google Scholar] [CrossRef]
  35. Sloot, R.N.F.; Heutink, A.; Voordijk, J.T. Assessing usefulness of 4D BIM tools in risk mitigation strategies. Autom. Constr. 2019, 106, 102881. [Google Scholar] [CrossRef]
  36. Xu, J. Research on Application of BIM 5D Technology in Central Grand Project. Procedia Eng. 2017, 174, 600–610. [Google Scholar] [CrossRef]
  37. Nicał, A.K.; Wodyński, W. Enhancing Facility Management through BIM 6D. Procedia Eng. 2016, 164, 299–306. [Google Scholar] [CrossRef]
  38. Andreani, M.; Bertagni, S.; Biagini, C.; Mallo, F. 7D BIM for sustainability assessment in design processes: A case study of design of alternatives in severe climate and heavy use conditions. Archit. Eng. 2019, 4, 3–12. [Google Scholar] [CrossRef] [Green Version]
  39. Boje, C.; Guerriero, A.; Kubicki, S.; Rezgui, Y. Towards a semantic Construction Digital Twin: Directions for future research. Autom. Constr. 2020, 114, 103179. [Google Scholar] [CrossRef]
  40. Bellido-Montesinos, P.; Lozano-Galant, F.; Castilla, F.J.; Lozano-Galant, J.A. Experiences learned from an international BIM contest: Software use and information workflow analysis to be published in: Journal of Building Engineering. J. Build. Eng. 2019, 21, 149–157. [Google Scholar] [CrossRef]
  41. Freimuth, H.; König, M. Planning and executing construction inspections with unmanned aerial vehicles. Autom. Constr. 2018, 96, 540–553. [Google Scholar] [CrossRef]
  42. Ma, X.; Xiong, F.; Olawumi, T.O.; Dong, N.; Chan, A.P.C. Conceptual Framework and Roadmap Approach for Integrating BIM into Lifecycle Project Management. J. Manag. Eng. 2018, 34, 05018011. [Google Scholar] [CrossRef] [Green Version]
  43. Franz, S.; Irmler, R.; Rüppel, U. Real-time collaborative reconstruction of digital building models with mobile devices. Adv. Eng. Inform. 2018, 38, 569–580. [Google Scholar] [CrossRef]
  44. Napolitano, R.K.; Scherer, G.; Glisic, B. Virtual tours and informational modeling for conservation of cultural heritage sites. J. Cult. Herit. 2018, 29, 123–129. [Google Scholar] [CrossRef]
  45. Brundtland, G.H. Global Change and Our Common Future. Environ. Sci. Policy Sustain. Dev. 1989, 31, 16–43. [Google Scholar] [CrossRef]
  46. Chong, H.-Y.; Lee, C.-Y.; Wang, X. A mixed review of the adoption of Building Information Modelling (BIM) for sustainability. J. Clean. Prod. 2017, 142, 4114–4126. [Google Scholar] [CrossRef] [Green Version]
  47. Lee, B.; Lee, G.; Kim, I.; Park, S.; Shin, S.; Yeo, Y. Integrated Assessment System of Sustainable Communities using BIM Technology. Int. J. Sustain. Build. Technol. Urban Dev. 2010, 1, 64–73. [Google Scholar] [CrossRef]
  48. Mekala, G.D.; Jones, R.N.; MacDonald, D.H. Valuing the benefits of creek rehabilitation: Building a business case for public investments in urban green infrastructure. Environ. Manag. 2015, 55, 1354–1365. [Google Scholar] [CrossRef]
  49. Cohen, M.; Baudoin, R.; Palibrk, M.; Persyn, N.; Rhein, C. Urban biodiversity and social inequalities in built-up cities: New evidences, next questions. The example of Paris, France. Landsc. Urban Plan. 2012, 106, 277–287. [Google Scholar] [CrossRef]
  50. Cariñanos, P.; Casares-Porcel, M. Urban green zones and related pollen allergy: A review. Some guidelines for designing spaces with low allergy impact. Landsc. Urban Plan. 2011, 101, 205–214. [Google Scholar] [CrossRef]
  51. Marrero, M.; Wojtasiewicz, M.; Martínez-Rocamora, A.; Solís-Guzmán, J.; Alba-Rodríguez, M.D. BIM-LCA Integration for the Environmental Impact Assessment of the Urbanization Process. Sustainability 2020, 12, 4196. [Google Scholar] [CrossRef]
  52. Badenko, V.; Samsonova, V.; Volgin, D.; Lipatova, A.; Lytkin, S. Airborne LIDAR Data Processing for Smart City Modelling. Lect. Notes Civ. Eng. 2020, 70, 245–252. [Google Scholar] [CrossRef]
  53. Heaton, J.; Parlikad, A.K. A conceptual framework for the alignment of infrastructure assets to citizen requirements within a Smart Cities framework. Cities 2019, 90, 32–41. [Google Scholar] [CrossRef]
  54. Kubicki, S.; Guerriero, A.; Schwartz, L.; Daher, E.; Idris, B. Assessment of synchronous interactive devices for BIM project coordination: Prospective ergonomics approach. Autom. Constr. 2019, 101, 160–178. [Google Scholar] [CrossRef]
  55. Álvarez, M.; Raposo, J.F.; Miranda, M.; Bello, A.B. Metodología de Generación de Modelos Virtuales Urbanos 3D para ciudades inteligentes. Inf. De La Construcción 2018, 70, e237. [Google Scholar] [CrossRef] [Green Version]
  56. Tan, Y.; Fang, Y.; Zhou, T.; Gan, V.J.L.; Cheng, J.C.P. BIM-supported 4D acoustics simulation approach to mitigating noise impact on maintenance workers on offshore oil and gas platforms. Autom. Constr. 2019, 100, 1–10. [Google Scholar] [CrossRef]
  57. Chen, W.; Chen, K.; Cheng, J.C.P.; Wang, Q.; Gan, V.J.L. BIM-based framework for automatic scheduling of facility maintenance work orders. Autom. Constr. 2018, 91, 15–30. [Google Scholar] [CrossRef]
  58. Deng, Y.; Cheng, J.C.P.; Anumba, C. A framework for 3D traffic noise mapping using data from BIM and GIS integration. Struct. Infrastruct. Eng. 2016, 12, 1267–1280. [Google Scholar] [CrossRef]
  59. Li, D.; Lu, M. Integrating geometric models, site images and GIS based on Google Earth and Keyhole Markup Language. Autom. Constr. 2018, 89, 317–331. [Google Scholar] [CrossRef]
  60. Bueno, M.; Bosché, F.; González-Jorge, H.; Martínez-Sánchez, J.; Arias, P. 4-Plane congruent sets for automatic registration of as-is 3D point clouds with 3D BIM models. Autom. Constr. 2018, 89, 120–134. [Google Scholar] [CrossRef]
  61. Popovic, D.; Govedarica, M.; Jovanovic, D.; Radulovic, A.; Simeunovic, V. 3D Visualization of Urban Area Using Lidar Technology and CityGML. In Proceedings of the IOP Conference Series: Earth and Environmental Science, Prague, Czech Republic, 11–15 September 2017; Volume 95, p. 042006. [Google Scholar] [CrossRef]
  62. Warchoł, A. Analysis of possibilities to registration TLS point clouds without targets on the example of the Castle Bridge in Rzeszów. In Proceedings of the International Multidisciplinary Scientific GeoConference Surveying Geology and Mining Ecology Management, SGEM, Albena, Bulgaria, 18–24 June 2015; pp. 737–742. [Google Scholar]
  63. Kawata, Y.; Koizumi, K.; Hashimoto, M.; Sakaya, H. 3D modeling of Kanazawa city center from airborne LiDAR data. In Proceedings of the 34th Asian Conference on Remote Sensing, Bali, Indonesia, 20–24 October 2013; pp. 1372–1379. [Google Scholar]
  64. Barazzetti, L. Integrated BIM-GIS model generation at the city scale using geospatial data. Int. Soc. Opt. Photonics 2018, 10773, 1077308. [Google Scholar]
  65. Baik, A.; Yaagoubi, R.; Boehm, J. Integration of jeddah historical bim and 3D GIS for documentation and restoration of historical monument. In Proceedings of the International Archives of the Photogrammetry, Remote Sensing and Spatial Information Sciences—ISPRS Archives, Taipei, Taiwan, 31 August–4 September 2015; pp. 29–34. [Google Scholar]
  66. Gernes, R.; Brokamp, C.; Rice, G.E.; Wright, J.M.; Kondo, M.C.; Michael, Y.L.; Donovan, G.H.; Gatziolis, D.; Bernstein, D.; LeMasters, G.K.; et al. Using high-resolution residential greenspace measures in an urban environment to assess risks of allergy outcomes in children. Sci. Total Environ. 2019, 668, 760–767. [Google Scholar] [CrossRef]
  67. Pecero-Casimiro, R.; Fernández-Rodríguez, S.; Tormo-Molina, R.; Monroy-Colín, A.; Silva-Palacios, I.; Cortés-Pérez, J.P.; Gonzalo-Garijo, Á.; Maya-Manzano, J.M. Urban aerobiological risk mapping of ornamental trees using a new index based on LiDAR and Kriging: A case study of plane trees. Sci. Total Environ. 2019, 693, 133576. [Google Scholar] [CrossRef]
  68. Fernández-Rodríguez, S.; Cortés-Pérez, J.P.; Muriel, P.P.; Tormo-Molina, R.; Maya-Manzano, J.M. Environmental impact assessment of Pinaceae airborne pollen and green infrastructure using BIM. Autom. Constr. 2018, 96, 494–507. [Google Scholar] [CrossRef]
  69. Zhang, Z.; Stevenson, K.T.; Martin, K.L. Exploring geographical, curricular, and demographic factors of nature use by children in urban schoolyards in Raleigh, NC, USA. Urban For. Urban Green. 2021, 65, 127323. [Google Scholar] [CrossRef]
  70. Zhu, S.; Du, S.; Li, Y.; Wei, S.; Jin, X.; Zhou, X.; Shi, X. A 3D spatiotemporal morphological database for urban green infrastructure and its applications. Urban For. Urban Green. 2021, 58, 126935. [Google Scholar] [CrossRef]
  71. Chan, W.-L.; Eng, Y.; Ge, Z.; Lim, C.W.; Gobeawan, L.; Poh, H.J.; Wise, D.J.; Burcham, D.C.; Lee, D.; Cui, Y.; et al. Wind Loading on Scaled Down Fractal Tree Models of Major Urban Tree Species in Singapore. Forests 2020, 11, 803. [Google Scholar] [CrossRef]
  72. Yu, S.; Chen, Z.; Yu, B.; Wang, L.; Wu, B.; Wu, J.; Zhao, F. Exploring the relationship between 2D/3D landscape pattern and land surface temperature based on explainable eXtreme Gradient Boosting tree: A case study of Shanghai, China. Sci. Total Environ. 2020, 725, 138229. [Google Scholar] [CrossRef]
  73. Miao, C.; Yu, S.; Hu, Y.; Zhang, H.; He, X.; Chen, W. Review of methods used to estimate the sky view factor in urban street canyons. Build. Environ. 2020, 168, 106497. [Google Scholar] [CrossRef]
  74. Urech, P.R.W. Editing cumulated landscapes: Point cloud modeling as a method of analysis in landscape design. Urban Plan. 2020, 5, 296–306. [Google Scholar] [CrossRef]
  75. Monroy-Colín, A.; Silva-Palacios, I.; Tormo-Molina, R.; Maya-Manzano, J.M.; Rodríguez, S.F.; Gonzalo-Garijo, Á. Environmental analysis of airborne pollen occurrence, pollen source distribution and phenology of Fraxinus angustifolia. Aerobiologia 2018, 34, 269–283. [Google Scholar] [CrossRef]
  76. Yan, Y.; Gao, F.; Deng, S.; Su, N. A Hierarchical Building Segmentation in Digital Surface Models for 3D Reconstruction. Sensors 2017, 17, 222. [Google Scholar] [CrossRef] [Green Version]
  77. Fu, W.; Huang, G.; Zhang, Q.; Gu, S.; Ge, M.; Schuh, H. Multi-GNSS real-time clock estimation using sequential least square adjustment with online quality control. J. Geod. 2018, 93, 963–976. [Google Scholar] [CrossRef]
  78. Gao, Z.; Li, Y.; Zhuang, Y.; Yang, H.; Pan, Y.; Zhang, H. Robust Kalman Filter Aided GEO/IGSO/GPS Raw-PPP/INS Tight Integration. Sensors 2019, 19, 417. [Google Scholar] [CrossRef] [Green Version]
  79. Belter, D.; Nowicki, M.; Skrzypczyński, P. Modeling spatial uncertainty of point features in feature-based RGB-D SLAM. Mach. Vis. Appl. 2018, 29, 827–844. [Google Scholar] [CrossRef] [Green Version]
  80. Meng, L.; Hirayama, T.; Oyanagi, S. The Development of Underwater-Drone equipped with 360-degree Panorama Camera in Opensource Hardware. Procedia Comput. Sci. 2018, 129, 438–442. [Google Scholar] [CrossRef]
  81. Yu, B.; Shang, S. Multi-Year Mapping of Major Crop Yields in an Irrigation District from High Spatial and Temporal Resolution Vegetation Index. Sensors 2018, 18, 3787. [Google Scholar] [CrossRef] [Green Version]
  82. Brumana, R.; Della Torre, S.; Previtali, M.; Barazzetti, L.; Cantini, L.; Oreni, D.; Banfi, F. Generative HBIM modelling to embody complexity (LOD, LOG, LOA, LOI): Surveying, preservation, site intervention—The Basilica di Collemaggio (L’Aquila). Appl. Geomat. 2018, 10, 545–567. [Google Scholar] [CrossRef]
  83. Cariñanos, P.; Marinangeli, F. An updated proposal of the Potential Allergenicity of 150 ornamental Trees and shrubs in Mediterranean Cities. Urban For. Urban Green. 2021, 63, 127218. [Google Scholar] [CrossRef]
  84. BIMforum. Level of Development (LOD) Specification Part & Commentary for Building Information Models and Data. 2020, p. 272. Available online: https://bimforum.org/resources/Documents/LOD%20Spec%202020%20Part%20I%202020-12-31.pdf (accessed on 1 December 2020).
  85. Yuan, Z.; Sun, C.; Wang, Y. Design for Manufacture and Assembly-oriented parametric design of prefabricated buildings. Autom. Constr. 2018, 88, 13–22. [Google Scholar] [CrossRef]
  86. Pecero-Casimiro, R.; Fernández-Rodríguez, S.; Tormo-Molina, R.; Silva-Palacios, I.; Gonzalo-Garijo, A.; Monroy-Colín, A.; Coloma, J.F.; Maya-Manzano, J.M. Producing urban aerobiological risk map for cupressaceae family in the SW iberian peninsula from LiDAR technology. Remote Sens. 2020, 12, 1562. [Google Scholar] [CrossRef]
  87. Varela-González, M.; González-Jorge, H.; Riveiro, B.; Arias, P. Performance testing of LiDAR exploitation software. Comput. Geosci. 2013, 54, 122–129. [Google Scholar] [CrossRef]
  88. Kamel, E.; Memari, A.M. Review of BIM’s application in energy simulation: Tools, issues, and solutions. Autom. Constr. 2019, 97, 164–180. [Google Scholar] [CrossRef]
  89. Kim, J.B.; Jeong, W.; Clayton, M.J.; Haberl, J.S.; Yan, W. Developing a physical BIM library for building thermal energy simulation. Autom. Constr. 2015, 50, 16–28. [Google Scholar] [CrossRef]
  90. Eliseev, M.; Tomchinskaya, T.; Lipenkov, A.; Blinov, A. Using 3D-modeling Technologies to Increase Road Safety. Transp. Res. Procedia 2017, 20, 171–179. [Google Scholar] [CrossRef]
  91. Cariñanos, P.; Casares-Porcel, M.; Díaz de la Guardia, C.; Aira, M.J.; Belmonte, J.; Boi, M.; Elvira-Rendueles, B.; De Linares, C.; Fernández-Rodriguez, S.; Maya-Manzano, J.M.; et al. Assessing allergenicity in urban parks: A nature-based solution to reduce the impact on public health. Environ. Res. 2017, 155, 219–227. [Google Scholar] [CrossRef] [PubMed]
  92. Ucar, Z.; Bettinger, P.; Merry, K.; Akbulut, R.; Siry, J. Estimation of urban woody vegetation cover using multispectral imagery and LiDAR. Urban For. Urban Green. 2018, 29, 248–260. [Google Scholar] [CrossRef]
  93. Ossola, A.; Hopton, M.E. Measuring urban tree loss dynamics across residential landscapes. Sci. Total Environ. 2018, 612, 940–949. [Google Scholar] [CrossRef] [PubMed]
  94. Gómez, J.A.; Guan, C.; Tripathy, P.; Duque, J.C.; Passos, S.; Keith, M.; Liu, J. Analyzing the Spatiotemporal Uncertainty in Urbanization Predictions. Remote Sens. 2021, 13, 512. [Google Scholar] [CrossRef]
  95. Brovkina, O.; Novotny, J.; Cienciala, E.; Zemek, F.; Russ, R. Mapping forest aboveground biomass using airborne hyperspectral and LiDAR data in the mountainous conditions of Central Europe. Ecol. Eng. 2017, 100, 219–230. [Google Scholar] [CrossRef]
  96. Parmehr, E.G.; Amati, M.; Taylor, E.J.; Livesley, S.J. Estimation of urban tree canopy cover using random point sampling and remote sensing methods. Urban For. Urban Green. 2016, 20, 160–171. [Google Scholar] [CrossRef]
  97. Chen, K.; Lu, W.; Xue, F.; Tang, P.; Li, L.H. Automatic building information model reconstruction in high-density urban areas: Augmenting multi-source data with architectural knowledge. Autom. Constr. 2018, 93, 22–34. [Google Scholar] [CrossRef]
  98. ISO 19650-1:2018. Organization and Digitization of Information about Buildings and Civil Engineering Works, Including Building Information Modelling (BIM)—Information Management Using Building Information Modelling—Part 1: Concepts and Principles. 2018. Available online: https://www.iso.org/standard/68078.html (accessed on 1 December 2020).
  99. Torregrosa-Jaime, B.; Martínez, P.J.; González, B.; Payá-Ballester, G. Modelling of a variable refrigerant flow system in energyplus for building energy simulation in an open building information modelling environment. Energies 2019, 12, 22. [Google Scholar] [CrossRef] [Green Version]
  100. Ding, S.; Huang, Y.; Cui, P.; Wu, J.; Li, M.; Liu, D. Impact of viaduct on flow reversion and pollutant dispersion in 2D urban street canyon with different roof shapes—Numerical simulation and wind tunnel experiment. Sci. Total Environ. 2019, 671, 976–991. [Google Scholar] [CrossRef]
  101. Olawumi, T.O.; Chan, D.W.M.; Wong, J.K.W.; Chan, A.P.C. Barriers to the integration of BIM and sustainability practices in construction projects: A Delphi survey of international experts. J. Build. Eng. 2018, 20, 60–71. [Google Scholar] [CrossRef]
  102. ISTRAM. 2020. Available online: http://istram.net/ (accessed on 1 December 2020).
  103. Buccolieri, R.; Gromke, C.; Di Sabatino, S.; Ruck, B. Aerodynamic effects of trees on pollutant concentration in street canyons. Sci. Total Environ. 2009, 407, 5247–5256. [Google Scholar] [CrossRef] [PubMed]
Figure 1. Workflow of LiDAR. (a): reality capture of LiDAR with TOPCON IP-S3 HD1. (b): LiDAR data processing to geo-reference panorama and points and to export data in .las format. (c): noise points cleaning and point density reduction to obtain lighter data.
Remotesensing 14 00618 g001
Figure 2. Views of Revit tree families with the different levels of detail (LODs).
Remotesensing 14 00618 g002
Figure 3. Construction process of one of the studied species in Revit (Cupressuscyparis leylandii).
Remotesensing 14 00618 g003
Figure 4. Workflow of BIM.
Remotesensing 14 00618 g004
Figure 5. 3D model in Revit (top) and 3D simulation in InfraWorks (bottom).
Remotesensing 14 00618 g005
Figure 6. Bar chart of the results obtained in the study. (a) Comparison of maximum IGUZA and obtained IGUZA in our study (b) Contribution of each studied specie to obtained IGUZA.
Remotesensing 14 00618 g006
Table 1. Assessment of allergenicity of species (trees, shrubs, and hedges) belonging to the Cupressaceae family present in the study area.
NumberSpecieNumber of Individuals of Cupressaceae
Family in EAS (n)
Mean width Crown Individuals (m)Mean Height Individuals Hi (m)Allergenic Potential (ap)Pollen Emissions (pe)Principal Pollination Period (mpp) (weeks)Surface Total Area (ST) (π*2502) (m2)Sum Surface Individuals (Si) (m2)Sum Height Indiviudals (Hi) (m)Volumen Individuals (Hi × Si) (m3)Index of Allergenicity of Each Specie (api*pei* pppi*Si*Hi)Contribution of Each Specie to IUGZA (Ii)
1Cupressocyparis leylandii920.493.18433196,349.5441.46292.9112,143.19437,154.980.00589
2Cupressus
arizonica
210.531.464334.6930.61143.685172.510.00007
3Cupressus sempervirens681.148.90433129.38605.2678,306.542,819,035.290.03798
4Juniperus
horizontalis
51.750.4643312.262.2928.091011.250.00001
5Platycadus orientalis51.404.244338.1021.19171.716181.490.00008
TOTAL 1911.063.65---195.89952.2690,793.21-0.04404
Publisher’s Note: MDPI stays neutral with regard to jurisdictional claims in published maps and institutional affiliations.

