
Assessing Storm Response of Multiple Intertidal Bars Using an Open-Source Automatic Processing Toolbox

 , ,
, ,
Abstract
:1. Introduction
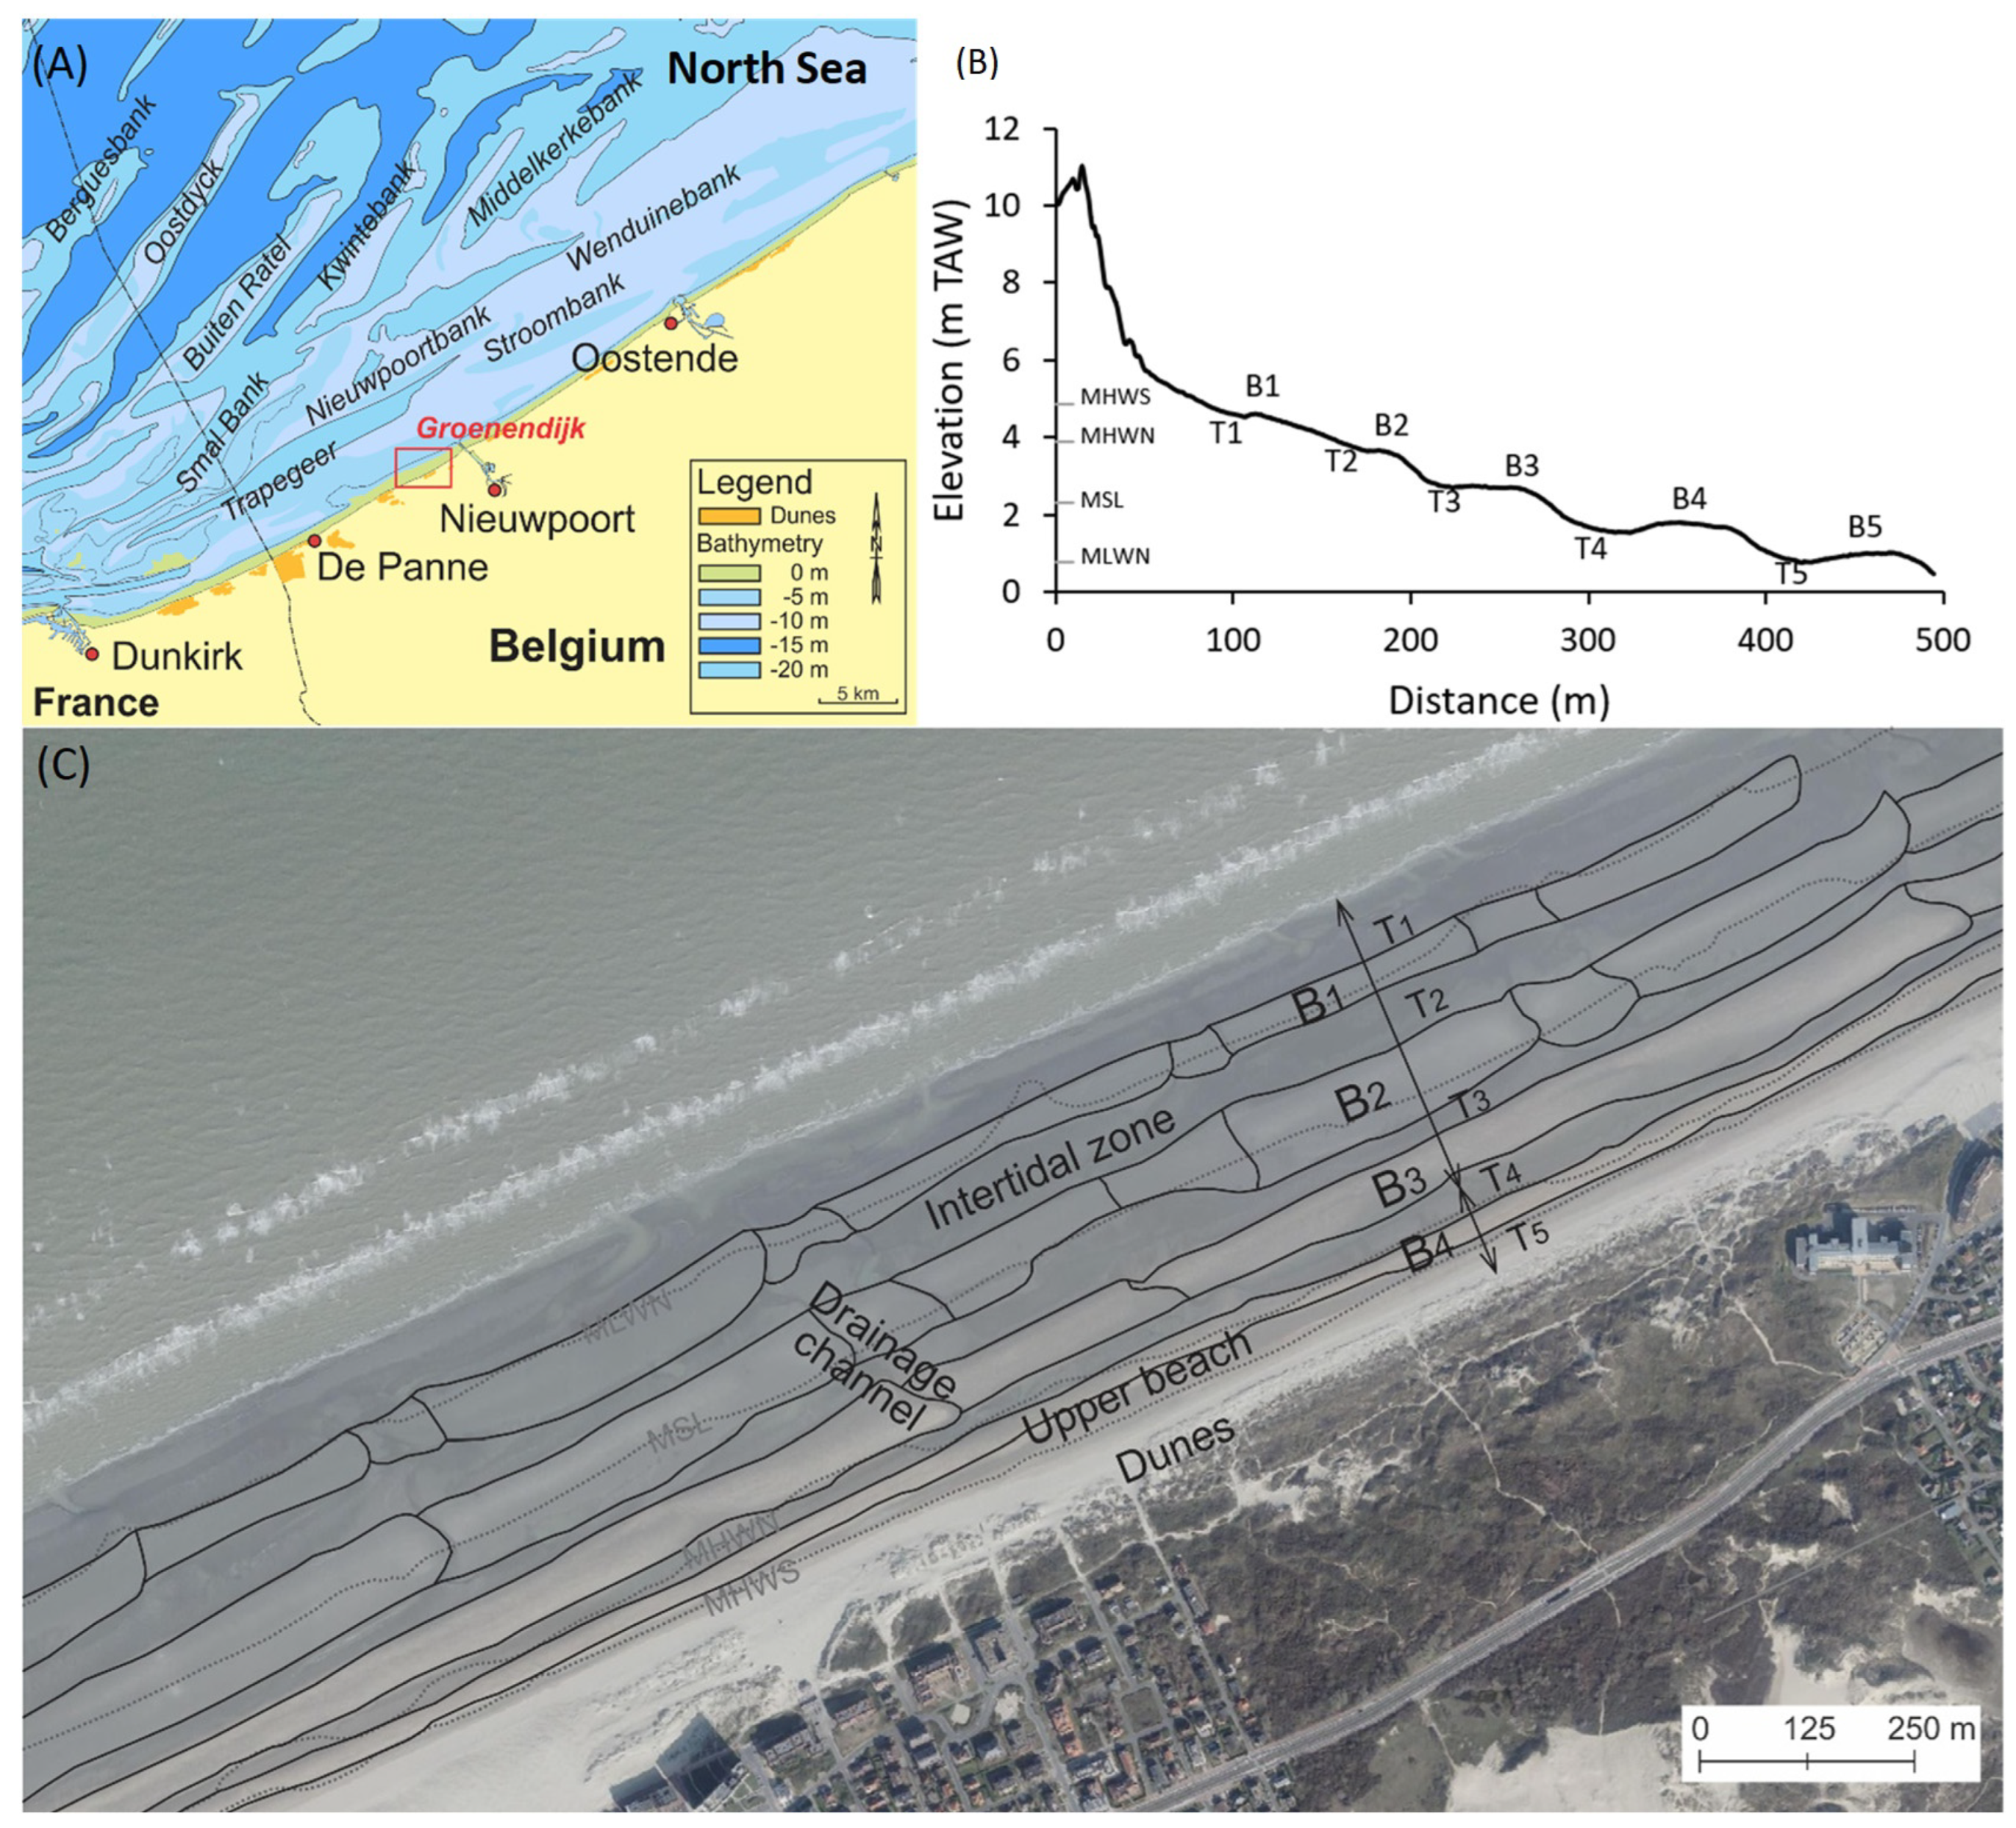
2. Study Site
3. Materials and Methods
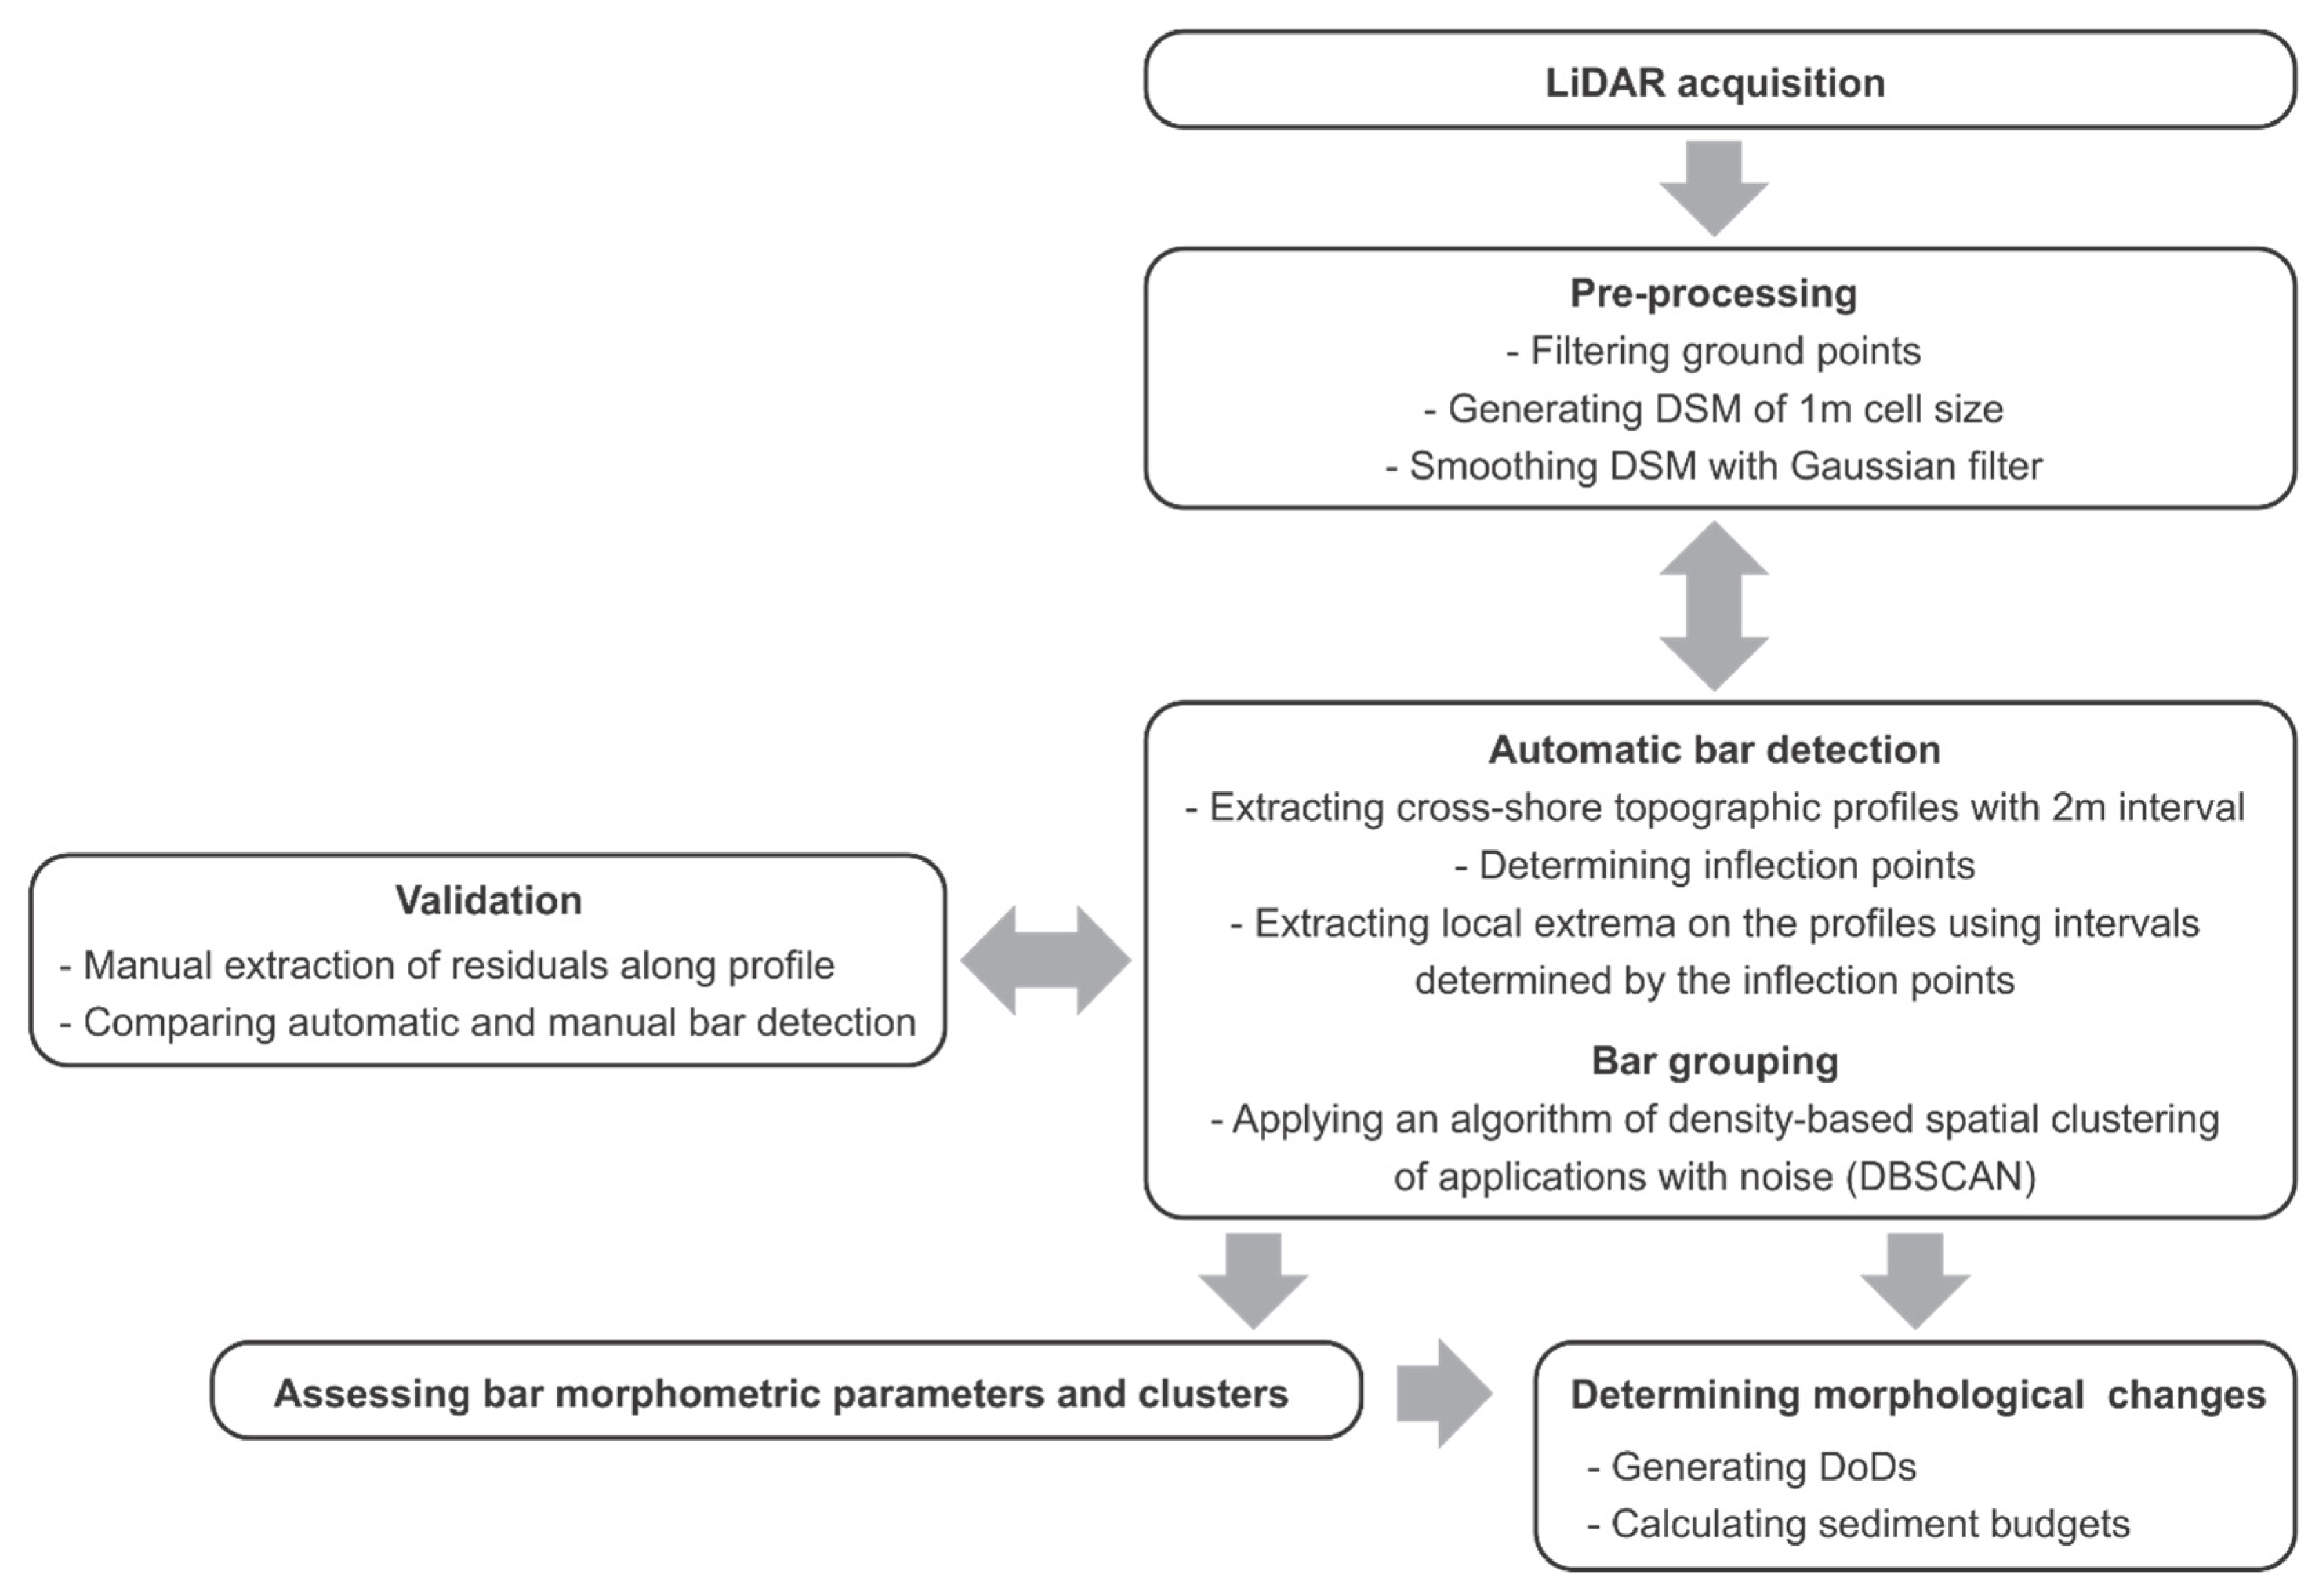
3.1. LiDAR Dataset Collection and Processing
3.2. Bar Detection Procedure
4. Results
4.1. Storm Activity
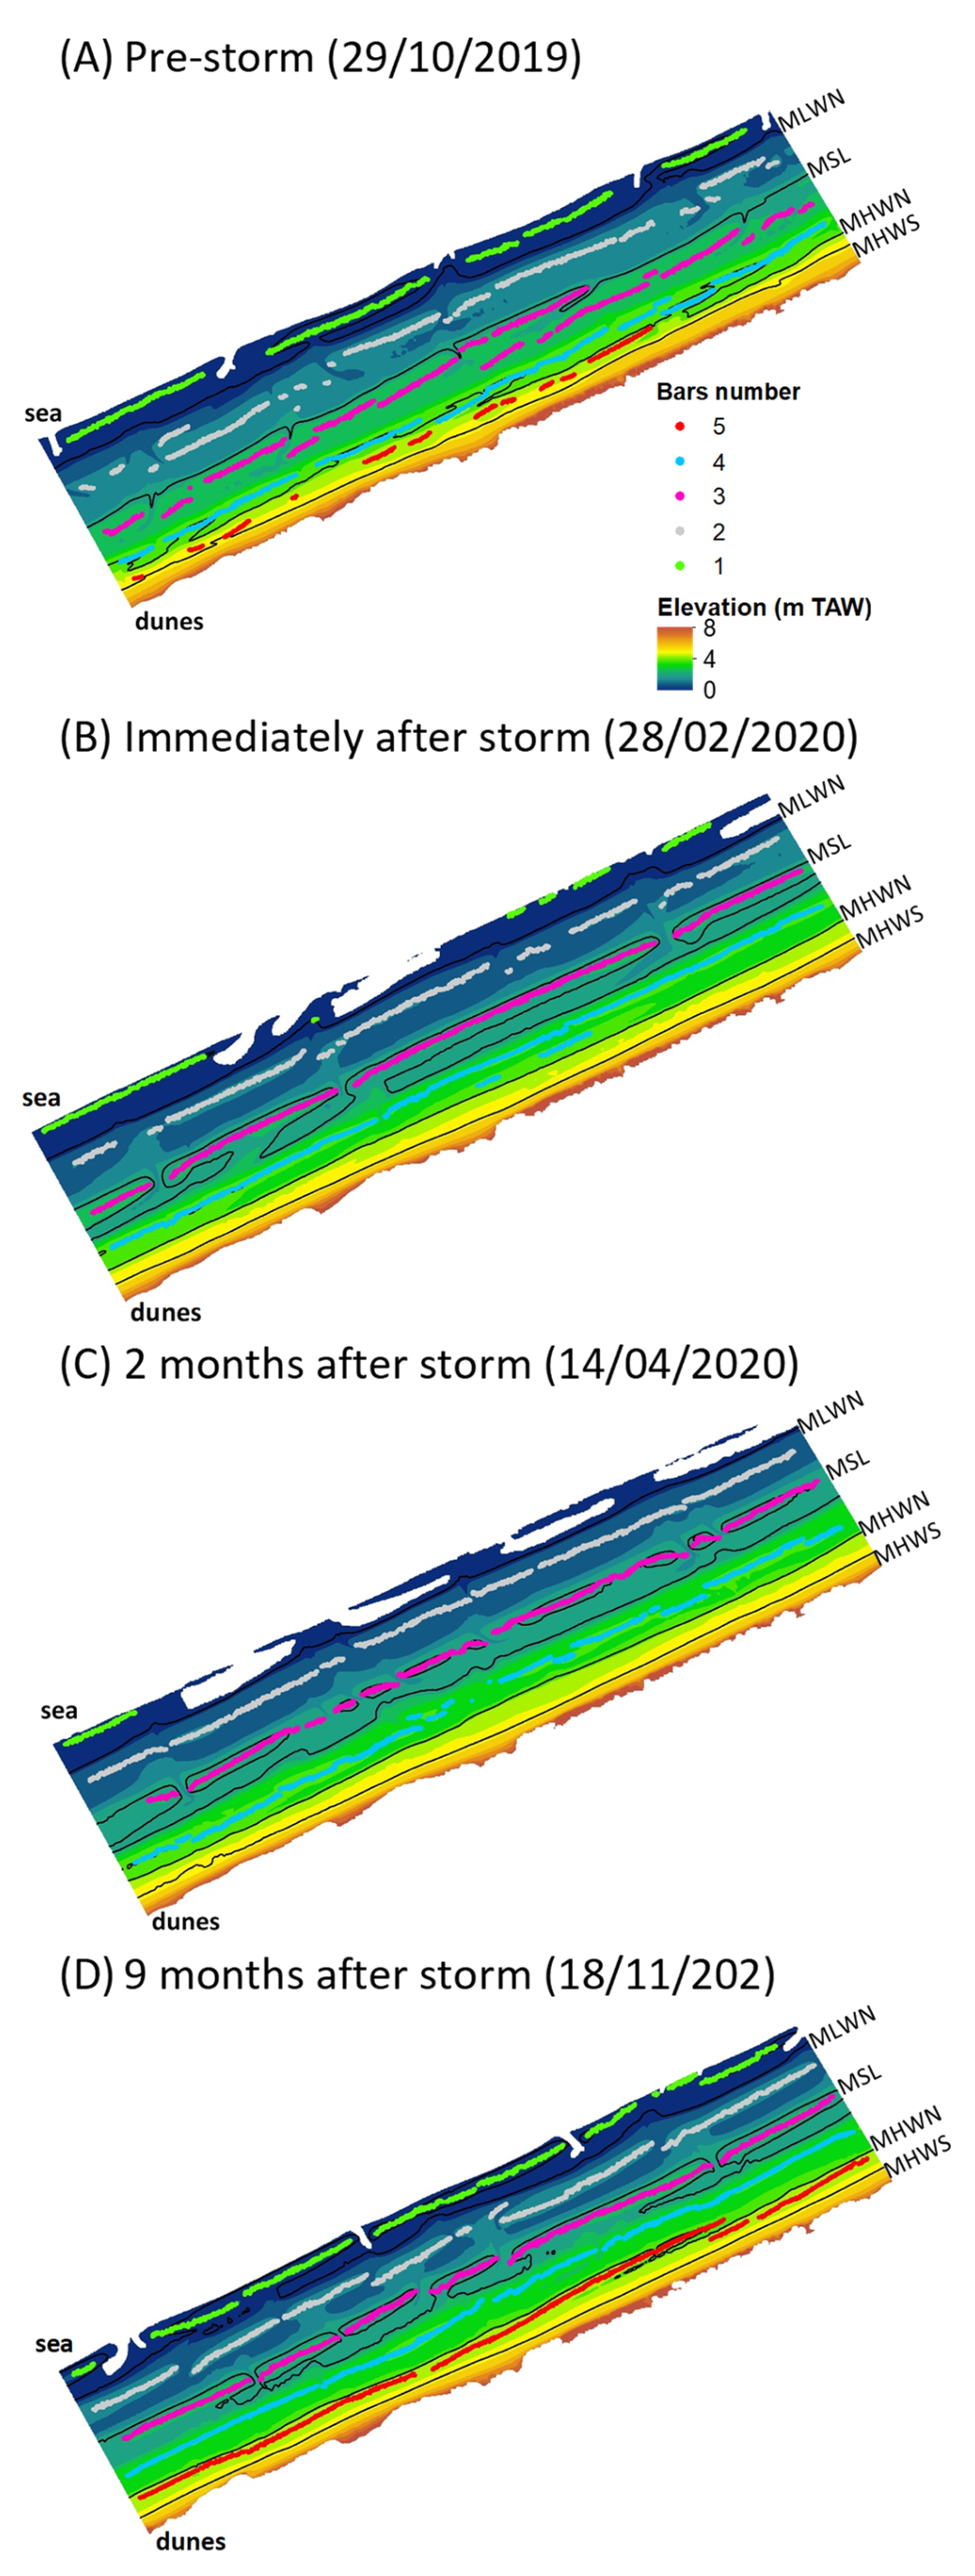
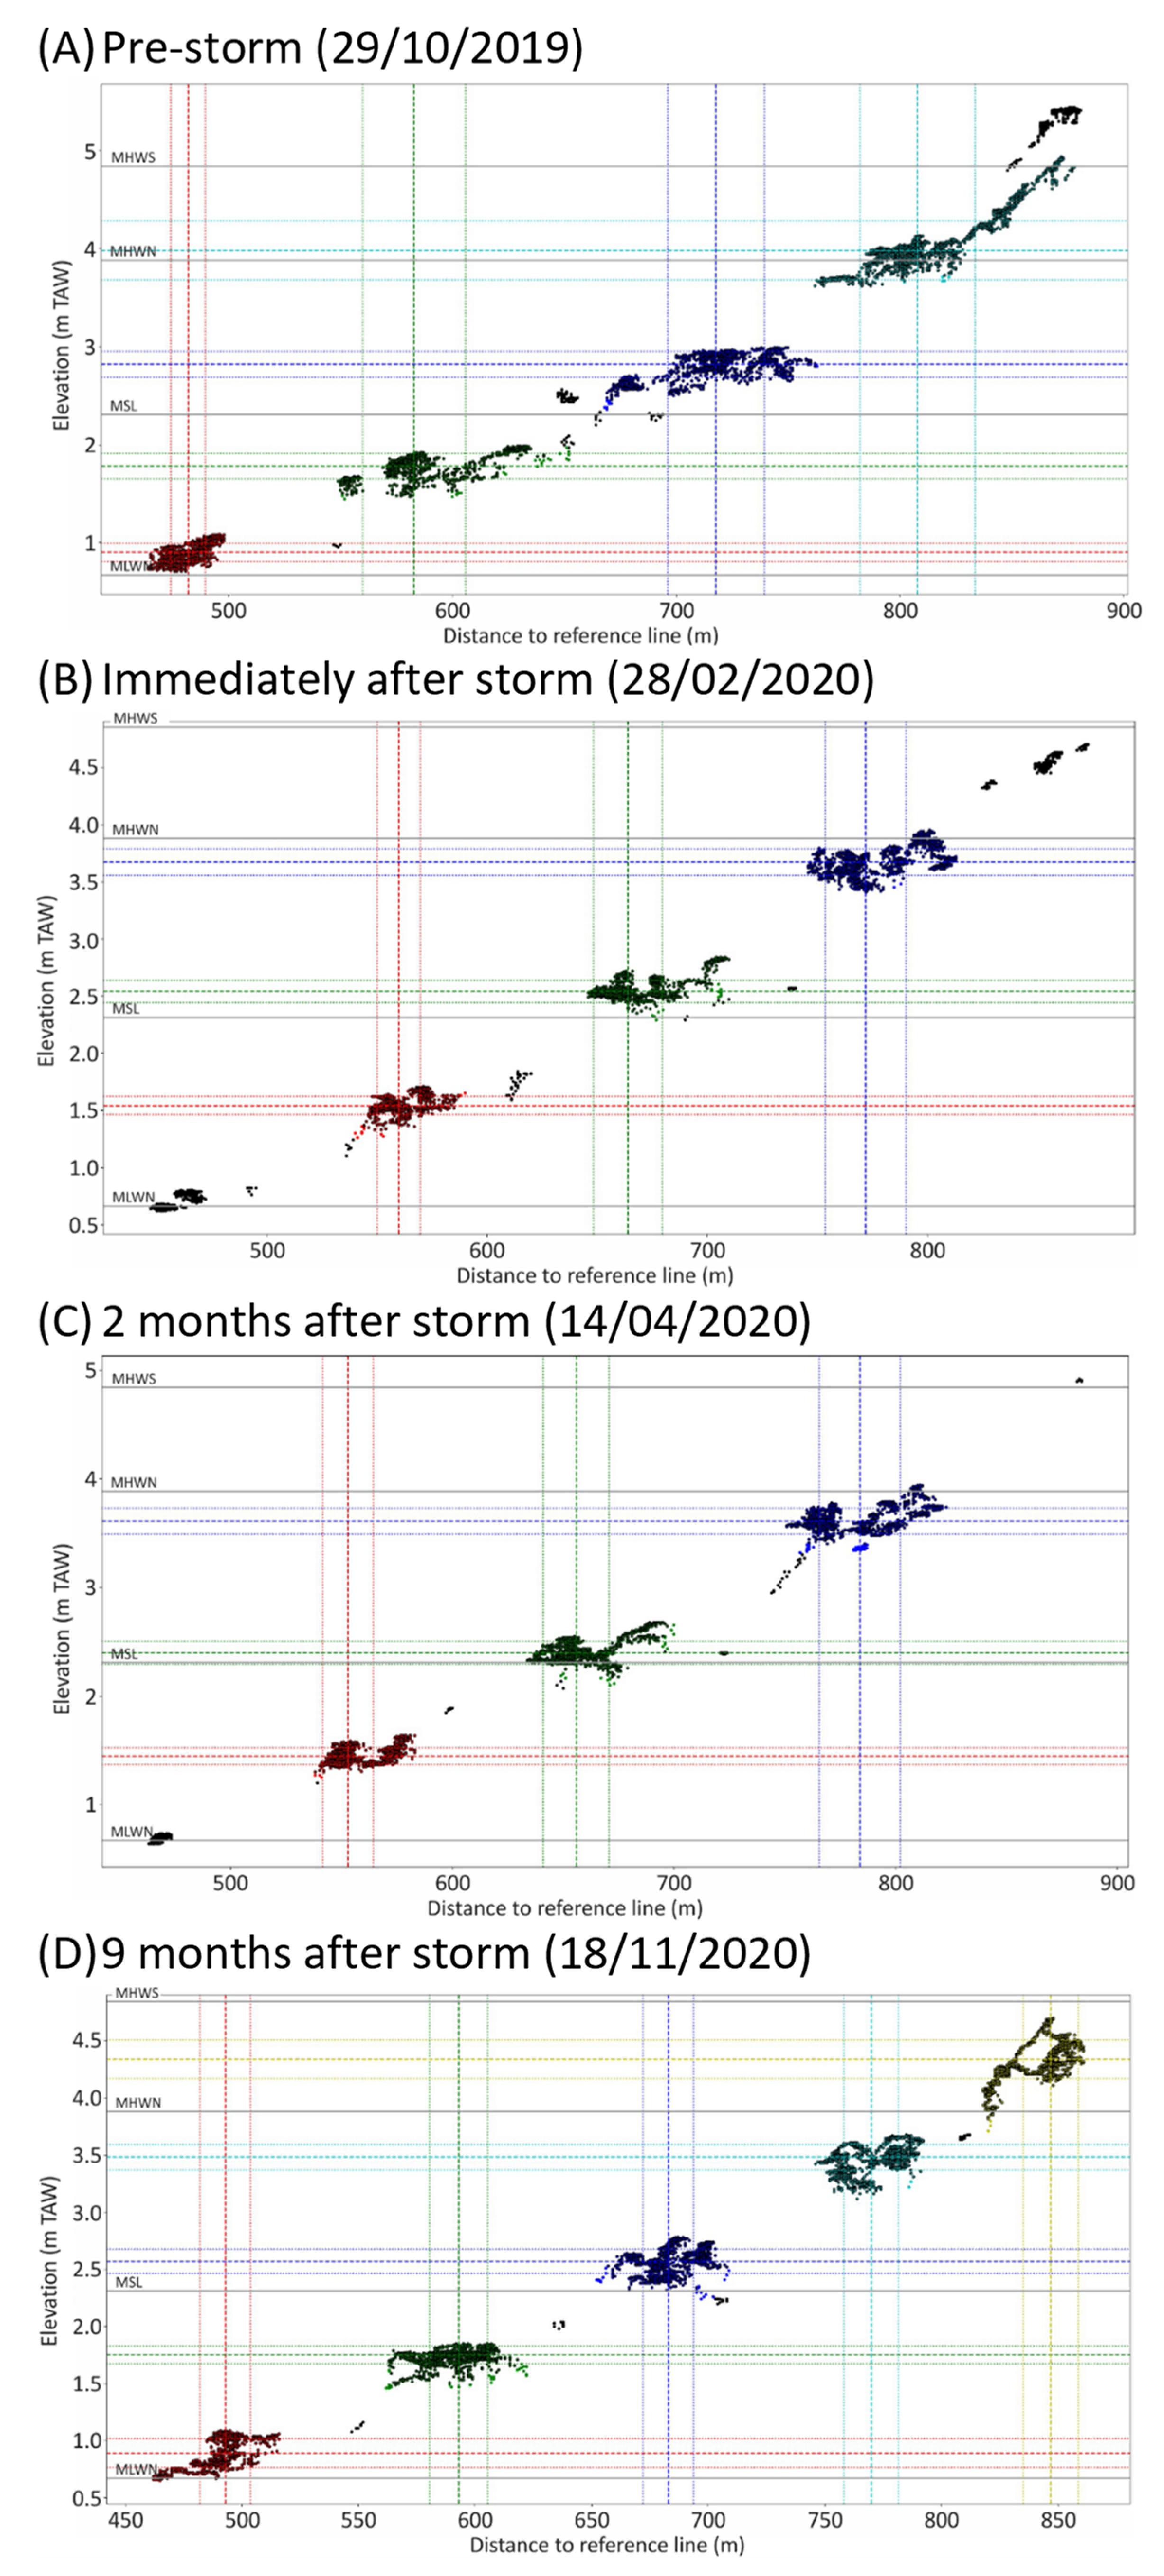
4.2. Bar Detection, Mapping and Characteristics
4.3. Barred Beach Morphodynamics
5. Discussion
5.1. Beach Response and Recovery Periods
5.2. Suitability and Applicability of Toolbox
6. Conclusions
Author Contributions
Funding
Institutional Review Board Statement
Data Availability Statement
Acknowledgments
Conflicts of Interest
References
- Biausque, M.; Grottoli, E.; Jackson, D.W.T.; Cooper, J.A.G. Multiple intertidal bars on beaches: A review. Earth Sci. Rev. 2020, 210, 103358. [Google Scholar] [CrossRef]
- Masselink, G.; Anthony, E.J. Location and height of intertidal bars on macrotidal ridge and runnel beaches. Earth Surf. Process. Landf. 2001, 26, 759–774. [Google Scholar] [CrossRef]
- Anthony, E.J.; Levoy, F.; Monfort, D.; Degryse-Kulkarni, C. Short-term intertidal bar mobility on a ridge-and-runnel beach, Merlimont, northern France. Earth Surf. Process. Landf. 2005, 30, 81–93. [Google Scholar] [CrossRef]
- Houwelingen, S.; Masselink, G.; Bullard, J. Characteristics and dynamics of multiple intertidal bars, North Lincolnshire, England. Earth Surf. Process. Landf. 2006, 31, 428–443. [Google Scholar] [CrossRef]
- Montreuil, A.-L.; Moelans, R.; Houthuys, R.; Bogaert, P.; Chen, M. Characterization of intertidal bar morphodynamics using a bi-annual LiDAR dataset. Remote Sens. 2020, 12, 3841. [Google Scholar] [CrossRef]
- Masselink, G.; Kroon, A.; Davidson-Arnott, R.G.D. Morphodynamics of intertidal bars in wave-dominated coastal settings a review. Geomorphology 2006, 73, 33–49. [Google Scholar] [CrossRef]
- Miles, A.; Ilic, S.; Whyatt, D.; James, M.R. Characterizing beach intertidal bar systems using multi-annual LiDAR data. Earth Surf. Process. Landf. 2019, 44, 1572–1583. [Google Scholar] [CrossRef] [Green Version]
- Andersen, M.S.; Gergely, Á.; Al-Hamdani, Z.; Steinbacher, F.; Larsen, L.R.; Ernstsen, V.B. Processing and performance of topobathymetric lidar data for geomorphometric and morphological classification in a high-energy tidal environment. Hydrol. Earth Syst. Sci. 2017, 21, 43. [Google Scholar] [CrossRef] [Green Version]
- Deronde, B.; Houthuys, R.; Henriet, J.-P.; Van Lancker, V. Monitoring of the sediment dynamics along a sandy shoreline by means of airborne hyperspectral remote sensing and LIDAR: A case study in Belgium. Earth Surf. Process. Landf. 2008, 33, 280–294. [Google Scholar] [CrossRef]
- Theuerkauf, E.J.; Rodriguez, A.B. Impacts of transect location and variations in along-beach morphology on measuring volume change. J. Coast. Res. 2012, 28, 707–718. [Google Scholar]
- Houthuys, R.; Verwaest, T.; Dan, S. Morfologische Evolutie van de Vlaamse Kust tot 2019: Evolutie van de Vlaamse Kust tot 2019; Versie 2.0; WL Rapporten, 18_142_1; Waterbouwkundig Laboratorium: Antwerpen, Belgium, 2021. [Google Scholar]
- Brand, E. Intertidal Beach Morphodynamics of a Macro-Tidal Sandy Coast (Belgium). Ph.D. Thesis, Vrije Universiteit Brussel, Brussel, Belgium, 2019. [Google Scholar]
- Haerens, P.; Bolle, A.; Trouw, K.; Houthuys, R. Definition of storm thresholds for significant morphological change of the sandy beaches along the Belgian coastline. Geomorphology 2012, 143, 104–117. [Google Scholar] [CrossRef]
- Moelans, R.; Montreuil, A.-L.; Chen, M. Open-source Raster Processing Toolbox for the Investigation of Coastal Intertidal Bar Displacement (PROTECT) (1.1). Zenodo 2021. [Google Scholar] [CrossRef]
- Montreuil, A.-L.; Chen, M.; Brand, E.; Verwaest, T.; Houthuys, R. Post-storm recovery assessment of urbanized versus natural sandy macro-tidal beaches and their geomorphic variability. Geomorphology 2020, 356, 107096. [Google Scholar] [CrossRef]
- Castelle, B.; Bujan, S.; Ferreira, S.; Dodet, G. Foredune morphological changes and beach recovery from the extreme 2013/2014 winter at a high-energy sandy coast. Mar. Geol. 2017, 385, 41–55. [Google Scholar] [CrossRef]
- Roberts, T.M.; Wang, P.; Puleo, J.A. Storm-driven cyclic beach morphodynamics of a mixed sand and gravel beach along the Mid-Atlantic coast. USA. Mar. Geol. 2013, 346, 403–421. [Google Scholar] [CrossRef]
- Mulrennan, M.E. Ridge and runnel beach morphodynamics: An example from the central east coast of Ireland. J. Coast. Res. 1992, 8, 906–918. [Google Scholar]


| Parameter | Description |
|---|---|
| Bar elevation (m TAW) | Height value at the position of the crest point |
| Bar width (m) | Distance between two consecutive troughs related to a bar |
| Bar height (m) | Difference of elevation between the crest and seaward trough point |
| Bar symmetry (dimensionless) | Horizontal distance between the crest and landward trough point, divided by the horizontal distance between the trough points on both sides of the bar. |
| Bar volume (m3/m) | Area below the profile curve between the landward trough and seaward trough minus the area under the linear curve when connecting the seaward and landward trough points. |
| 29 October 2019–28 February 2020 | 28 February 2020–10 April 2020 | 10 April 2020–18 November 2020 | ||
|---|---|---|---|---|
| Forcing factors | Number energetic event | 5 | 3 | 2 |
| Duration | 1.53 [2.6] | 1.44 [1.58] | 1.62 [1.75] | |
| Water level (m) | 5.56 [5.86] | 5.52 [5.68] | 5.51 [5.56] | |
| Significant wave height (m) | 2.44 [3.15] | 1.71 [2.09] | 1.77 [1.99] | |
| Wind direction (°) | 265 [277] | 72 [126] | 268 [272] | |
| Wind speed (m/s) | 17.2 [20.2] | 3.89 [4.96] | 11.74 [13.74] |
| Elevation (m TAW) | Width (m) | Symmetry (Dimensionless) | Volume (m3/m) | Height (m) | ||
|---|---|---|---|---|---|---|
| 29 October 2019 | Bar 1 (sea) | 0.90 | 90 | 0.30 | 20 | 0.95 |
| Bar 2 | 1.77 | 92 | 0.30 | 22 | 1.02 | |
| Bar 3 | 2.79 | 90 | 0.25 | 21 | 1.08 | |
| Bar 4 | 4.06 | 57 | 0.22 | 10 | 1.18 | |
| Bar 5 (land) | 4.42 | 52 | 0.21 | 9 | 1.05 | |
| 28 February 2020 | Bar 1 (sea) | 0.72 | 37 | 0.30 | 15 | 0.16 |
| Bar 2 | 1.57 | 58 | 0.30 | 18 | 0.61 | |
| Bar 3 | 2.57 | 109 | 0.38 | 36 | 1.25 | |
| Bar 4 | 3.67 | 76 | 0.31 | 22 | 1.46 | |
| Bar 5 (land) | ||||||
| 10 April 2020 | Bar 1 (sea) | 0.69 | 35 | 0.28 | 15 | 0.16 |
| Bar 2 | 1.46 | 88 | 0.28 | 16 | 0.94 | |
| Bar 3 | 2.42 | 101 | 0.31 | 25 | 1.10 | |
| Bar 4 | 3.62 | 96 | 0.23 | 20 | 1.47 | |
| Bar 5 (land) | ||||||
| 18 November 2020 | Bar 1 (sea) | 0.90 | 90 | 0.29 | 20 | 0.98 |
| Bar 2 | 1.73 | 85 | 0.29 | 24 | 1.07 | |
| Bar 3 | 2.57 | 85 | 0.30 | 26 | 1.22 | |
| Bar 4 | 3.46 | 73 | 0.29 | 17 | 1.25 | |
| Bar 5 (land) | 4.33 | 55 | 0.18 | 7 | 1.16 |
| 29 October 2019–28 February 2020 | 28 February 2020–10 April 2020 | 10 April 2020–18 November 2020 | ||
|---|---|---|---|---|
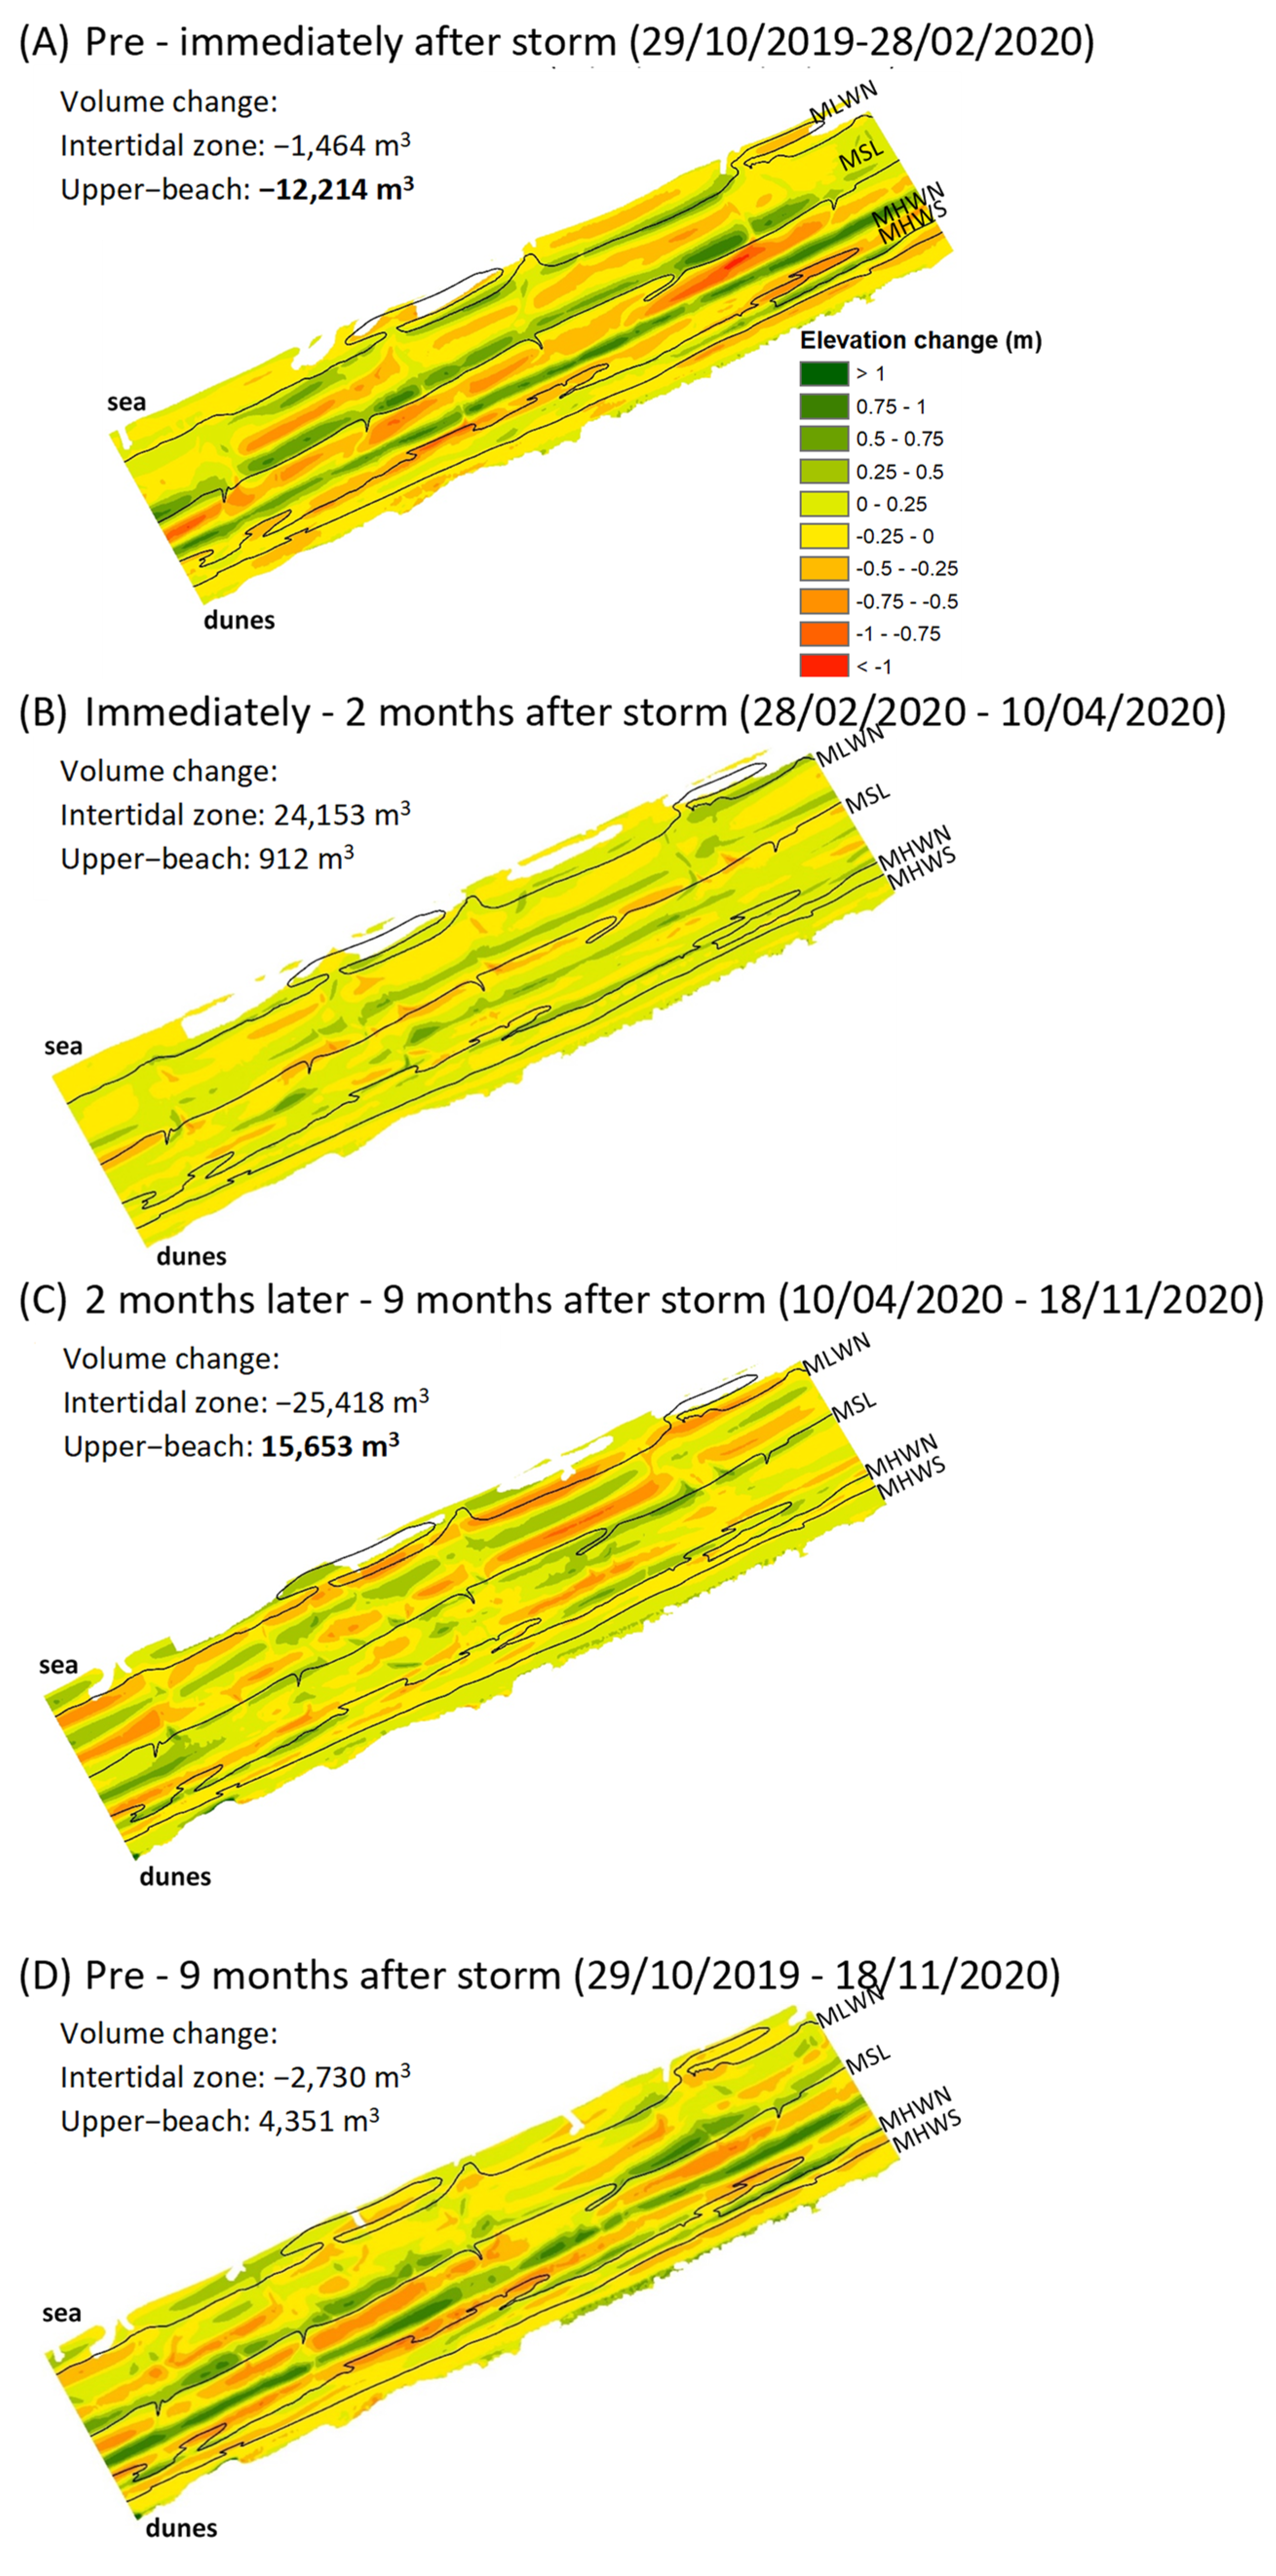
| Volumetric difference | Absolute volume of the intertidal zone (m3) | −1464 | 24,153 | −25,418 |
| Volume of the intertidal zone (m3/month) | −366 | 16,855 | −3498 | |
| Absolut volume of the upper-beach (m3) | −12,214 | 912 | 15,653 | |
| Volume of the upper-beach (m3/month) | −3054 | 636 | 2154 |
Publisher’s Note: MDPI stays neutral with regard to jurisdictional claims in published maps and institutional affiliations. |
© 2022 by the authors. Licensee MDPI, Basel, Switzerland. This article is an open access article distributed under the terms and conditions of the Creative Commons Attribution (CC BY) license (https://creativecommons.org/licenses/by/4.0/).
Share and Cite
Montreuil, A.-L.; Moelans, R.; Houthuys, R.; Bogaert, P.; Chen, M. Assessing Storm Response of Multiple Intertidal Bars Using an Open-Source Automatic Processing Toolbox. Remote Sens. 2022, 14, 1005. https://doi.org/10.3390/rs14041005
Montreuil A-L, Moelans R, Houthuys R, Bogaert P, Chen M. Assessing Storm Response of Multiple Intertidal Bars Using an Open-Source Automatic Processing Toolbox. Remote Sensing. 2022; 14(4):1005. https://doi.org/10.3390/rs14041005
Chicago/Turabian StyleMontreuil, Anne-Lise, Robrecht Moelans, Rik Houthuys, Patrick Bogaert, and Margaret Chen. 2022. "Assessing Storm Response of Multiple Intertidal Bars Using an Open-Source Automatic Processing Toolbox" Remote Sensing 14, no. 4: 1005. https://doi.org/10.3390/rs14041005
APA StyleMontreuil, A.-L., Moelans, R., Houthuys, R., Bogaert, P., & Chen, M. (2022). Assessing Storm Response of Multiple Intertidal Bars Using an Open-Source Automatic Processing Toolbox. Remote Sensing, 14(4), 1005. https://doi.org/10.3390/rs14041005