Article

Identification of the Urban Dry Islands Effect in Beijing: Evidence from Satellite and Ground Observations

1
School of Geography and Information Engineering, China University of Geosciences, Wuhan 430074, China
2
Beijing Municipal Climate Center, Beijing Meteorological Bureau, Beijing 100089, China
3
Key Lab of Urban Environment and Health, Institute of Urban Environment, Chinese Academy of Sciences, Xiamen 361021, China
4
Shandong Provincial Institute of Land Surveying and Mapping, Jinan 250013, China
*
Author to whom correspondence should be addressed.
Remote Sens. 2022, 14(4), 809; https://doi.org/10.3390/rs14040809
Submission received: 29 December 2021 / Revised: 3 February 2022 / Accepted: 7 February 2022 / Published: 9 February 2022

Abstract

:
Urbanization may exert a strong influence on both near-surface and atmospheric moisture. However, studies on the effect of urbanization on atmospheric moisture using remotely sensed observations have been infrequently conducted. To fill this research gap, we used remotely sensed and station-based observations to calculate urban–rural differences in total-column, near-surface, and atmospheric moisture in the Beijing metropolis. Multiple humidity indicators were selected, including precipitation water vapor, relative humidity, water vapor pressure, and absolute humidity. Results showed that both the total-column and near-surface urban dry islands (UDIs) were detected in Beijing. A significant decreasing trend of the near-surface UDIs intensity (i.e., urban minus rural) was found, which was closely related to the expansion of built-up areas (i.e., the moisture reduction in the newly urbanized areas). However, the trend of the total-column UDIs intensity was not significant. A further investigation of the atmospheric urban–rural moisture differences showed that the UDIs effect mainly existed in the near-surface layer, while an urban wet island was found above the 950 hPa pressure level, probably due to enhanced convergence in urban areas. Generally, the UDIs intensity was the strongest in the hot, wet summer and the weakest in the dry, cold winter. However, the UDIs intensity represented by relative humidity was the largest in autumn and showed the strongest correlation with the expansion of built-up areas in Beijing. This study employed satellite observations to understand the UDIs effect and highlighted the significance of urbanization-induced moisture changes on and above the ground. Findings of this study provided new insights into how urbanization affected atmospheric moisture in the boundary layer and paved the way for process-based modeling studies.

1. Introduction

Urbanization, the most evident expression of human modification to the Earth’s terrestrial surface, has been recognized to be a highly significant driver of local and regional climate change [1,2,3,4]. Although urban environments only occupy a relatively small portion of our planet’s land territory (i.e., 0.63% in 2010 [5]), they are home to about 55% of the world’s population and produce more than 70% of global energy use and associated emissions [6]. Therefore, understanding the role of urbanization on the climate system has received considerable attention in the scientific community [7,8,9,10]. Apart from excessive anthropogenic heat emissions, the decreased vegetation cover, increased impervious surfaces, high heat-storage capacity, and impediments to atmospheric motion from urban construction modify the surface energy budget, hydrological cycling, and planetary boundary larger structure, thus leading to changes in temperature, air circulation, humidity, and precipitation [11]. Despite these various effects, urban climate research has long been focused on temperature [12,13,14,15,16] and precipitation [17,18,19,20]. However, this situation has been changing in recent years, with an increasing number of studies paying attention to urbanization-induced humidity changes.
The atmospheric water vapor content has substantial impacts on hydrology, ecosystems, and human health. A reduced level of moisture content, and thus convective available potential energy, plays a negative role in the formation of rainfall [21]. The dryness may also exert water stress on plants, increase fire risk, activate influenza viruses, and ultimately threaten human health [22,23,24]. Previous studies have found that the humidity in urban areas tended to be lower than in surrounding rural areas. This phenomenon was first observed in Berlin and Munich, Germany [25], and was traditionally referred to as urban dry islands (UDIs) [26]. Inspired by this research, similar studies have subsequently been conducted for cities in Japan [27,28,29], the USA [30], Europe [31,32], Russia [33], and China [34,35,36,37,38]. These studies used a wide range of metrics obtained from weather stations to measure humidity differences between urban and rural sites. For example, Yang et al. [34] analyzed the spatiotemporal variations of urban–rural differences in relative humidity through examination of 36 urban stations inside the 6th-loop of Beijing and 6 suburban stations around. Hao et al. [35] found that the drying effect in the Yangtze River Delta was closely related to loss of vegetation and associated changes in hydrological processes. In the same location, Luo and Lau [36] reported that urban expansion explained over 75% of observed decreases in vapor pressure and specific humidity, and nearly 50% of observed changes in relative humidity and vapor pressure deficit.
Findings of previous research improved our understanding of the UDIs effect in terms of the spatial characteristics, seasonal variations, and driving factors. Undoubtedly, the increased availability of data from ground observation stations has advanced research progress in this field, compared with fifty years ago. To date, the detection of UDIs has largely relied on station-based observations, that is, near-surface UDIs. The effect of urbanization on atmospheric moisture content by means of remotely sensed observations has been infrequently conducted. In fact, the urban land surface interacts with the overlying atmosphere through heat, moisture, and momentum exchanges [39]. Previous research has shown that urban heat islands extended beyond the land surface to the canopy layer and even the boundary layer [39,40]. However, how urban expansion will affect atmospheric moisture content due to this land–atmosphere interaction necessitates further examination. Progress in remote sensing techniques with high-precision sensors to obtain atmospheric moisture profiles enables investigation of UDIs on and above the ground. In addition, satellite data can provide continuous spatiotemporal information on large spatial scales. Therefore, remote sensing and ground observations are complementary and indispensable for urban climate research.
With this issue in mind, we thereby used remotely sensed and station-based observations to investigate how urbanization affected total-column, near-surface, and atmospheric moisture content in the boundary layer. The research area was focused on Beijing, the capital city of China, which is located in the North China Plain (Figure 1a). The Beijing metropolitan region is one of the most urbanized and industrialized regions in mainland China, covering an area of 1.641 × 10⁴ km2 and supporting a population of 21.54 million in 2019 (http://www.stats.gov.cn/, accessed on 15 January 2021). Beijing is characterized by a semi-arid temperate continental monsoon climate [41]. Summer (i.e., June, July, and August) is hot and rainy, while winter (i.e., December, January, and February) is cold and dry. A comprehensive understanding of the effect of urbanization on moisture content has great significance for this densely populated, semi-arid metropolis. In this study, we seek to answer the following three questions: (1) what were the spatiotemporal changes of total-column UDIs during the period of 2003–2019 in Beijing; (2) did the temporal changes of near-surface UDIs consist with those of total-column UDIs; and (3) If not, what made the differences between total-column and near-surface UDIs?

2. Materials and Methods

This section specified the data and methodology used for identification of the urban dry islands effect in Beijing. An overview of the data applied in this work is presented in Table A1, while an overview of the methodology is shown in Figure A1.

2.1. Total-Column Precipitation Water Vapor

A wide range of indicators have been used to quantify urban–rural differences in moisture content, including relative/specific/absolute humidity, dew point temperature, water vapor pressure, and so on. Recent studies tended to use multiple indicators for the sake of completeness. Here, we first used the 1 km MODIS precipitation water vapor product to measure total-column UDIs in Beijing (https://ladsweb.modaps.eosdis.nasa.gov/, accessed on 5 April 2020). This product consisted of column (i.e., from the surface to the top of Earth’s atmosphere) water vapor amounts over clear land areas of the globe and above clouds over lands and oceans [42]. The retrieval algorithm was dependent on observations of water vapor attenuation of near-infrared solar radiation reflected by surfaces and clouds [43]. Therefore, it was highly sensitive to boundary-layer water vapor. The total-column precipitation water vapor (or PWV for short) product was essential to understand the hydrological cycle, energy budget, and climate change. This product contained data collected from the Terra (i.e., MOD05_L2) and Aqua (i.e., MYD05_L2) platforms. The daily total-column precipitation water vapor spanning 2003–2019 was estimated by averaging the MOD05_L2 (passing at 10:30 local solar time) and MYD05_L2 (passing at 13:30 local solar time) products, so as to reduce uncertainties. The data before 2003 were excluded because only the Terra platform ran. To facilitate analysis, the daily data were further accumulated into seasonal and annual intervals.

2.2. Station-Observed Humidity Indicators

We next utilized station-based observations to estimate near-surface UDIs in Beijing. According to Yang et al. [34], the five weather stations (i.e., the Tian An Men, Worker’s Stadium, Guan Yuan, Grand View Garden, and Olympic Center) in the central urban district were selected as urban stations, while the five weather stations (i.e., the Yong Le Dian, Cai Yu, Yu Fa, Xiao Tang Shan, and Da Sun Ge Zhuang) apart from the central area were considered as rural stations (Figure 1a). The rural stations were located in areas free from the influence of the urban heat islands effect according to the isotherm distribution derived from land surface temperature data [44]. The hourly relative humidity (RH), vapor pressure (VP), and air temperature at these stations were obtained from China Meteorological Data Service Center (http://data.cma.cn, accessed on 10 April 2020). As the observations before 2008 had a bunch of missing values, we acquired data spanning the period of 2008–2019 at the ten weather stations to ensure the robustness of our analysis. The observational data have been quality-controlled and homogenized using the method proposed by Xu et al. [45]. Given the functional sensitivity of RH and VP to temperature, we also calculated absolute humidity (AH) based on Equation (1) described below. For RH and VP, the hourly data were first averaged on a daily basis, based on which the annual mean was calculated. The AH was first estimated based on the daily vapor pressure and air temperature and then added up over the year to obtain the annual cumulative value.

2.3. Atmospheric Humidity Profile

We further employed the atmospheric humidity profile to investigate how urbanization affected moisture content in different altitudes above the ground level, using the MODIS atmospheric profile product (https://ladsweb.modaps.eosdis.nasa.gov/, accessed on 5 April 2020). This product consisted of temperature and moisture (i.e., dew point temperature) profiles at 20 vertical levels and was produced day and night with a 5 km resolution in both horizontal directions. The MODIS atmospheric temperature profile was retrieved by using a clear-sky synthetic regression retrieval algorithm [46]. The lowest six pressure levels upwards from near the surface were 1000, 950, 920, 850, 780, and 700 hPa, where the altitudes of 850 and 700 hPa corresponded to ~1.5 and 3.0 km, respectively [40]. The atmospheric profile was calculated on a daily basis by averaging data obtained from MOD07_L2 (at 10:30 and 22:30 local solar time) and MYD07_L2 (at 13:30 and 1:30 local solar time). If ideal gas behavior is assumed, the absolute humidity can be estimated by [47]:
A = C · p w T
where A denotes the absolute humidity in g/m3, C is the constant equal to 216.679 gK/J, p w is the vapor pressure in hPa, and T is the temperature in K. The vapor pressure ( p w ) can be estimated using the following equation [48]:
p w = 6.112 e 17.67 T d T d + 243.5  
where T d signifies the dew point temperature in K. That is, the actual vapor pressure of air is equal to the saturated vapor pressure under dew point temperature. The daily absolute humidity, once again, was added up over the year for subsequent analysis. That is, we applied cumulative values for absolute terms such as total-column precipitation water vapor and absolute humidity.

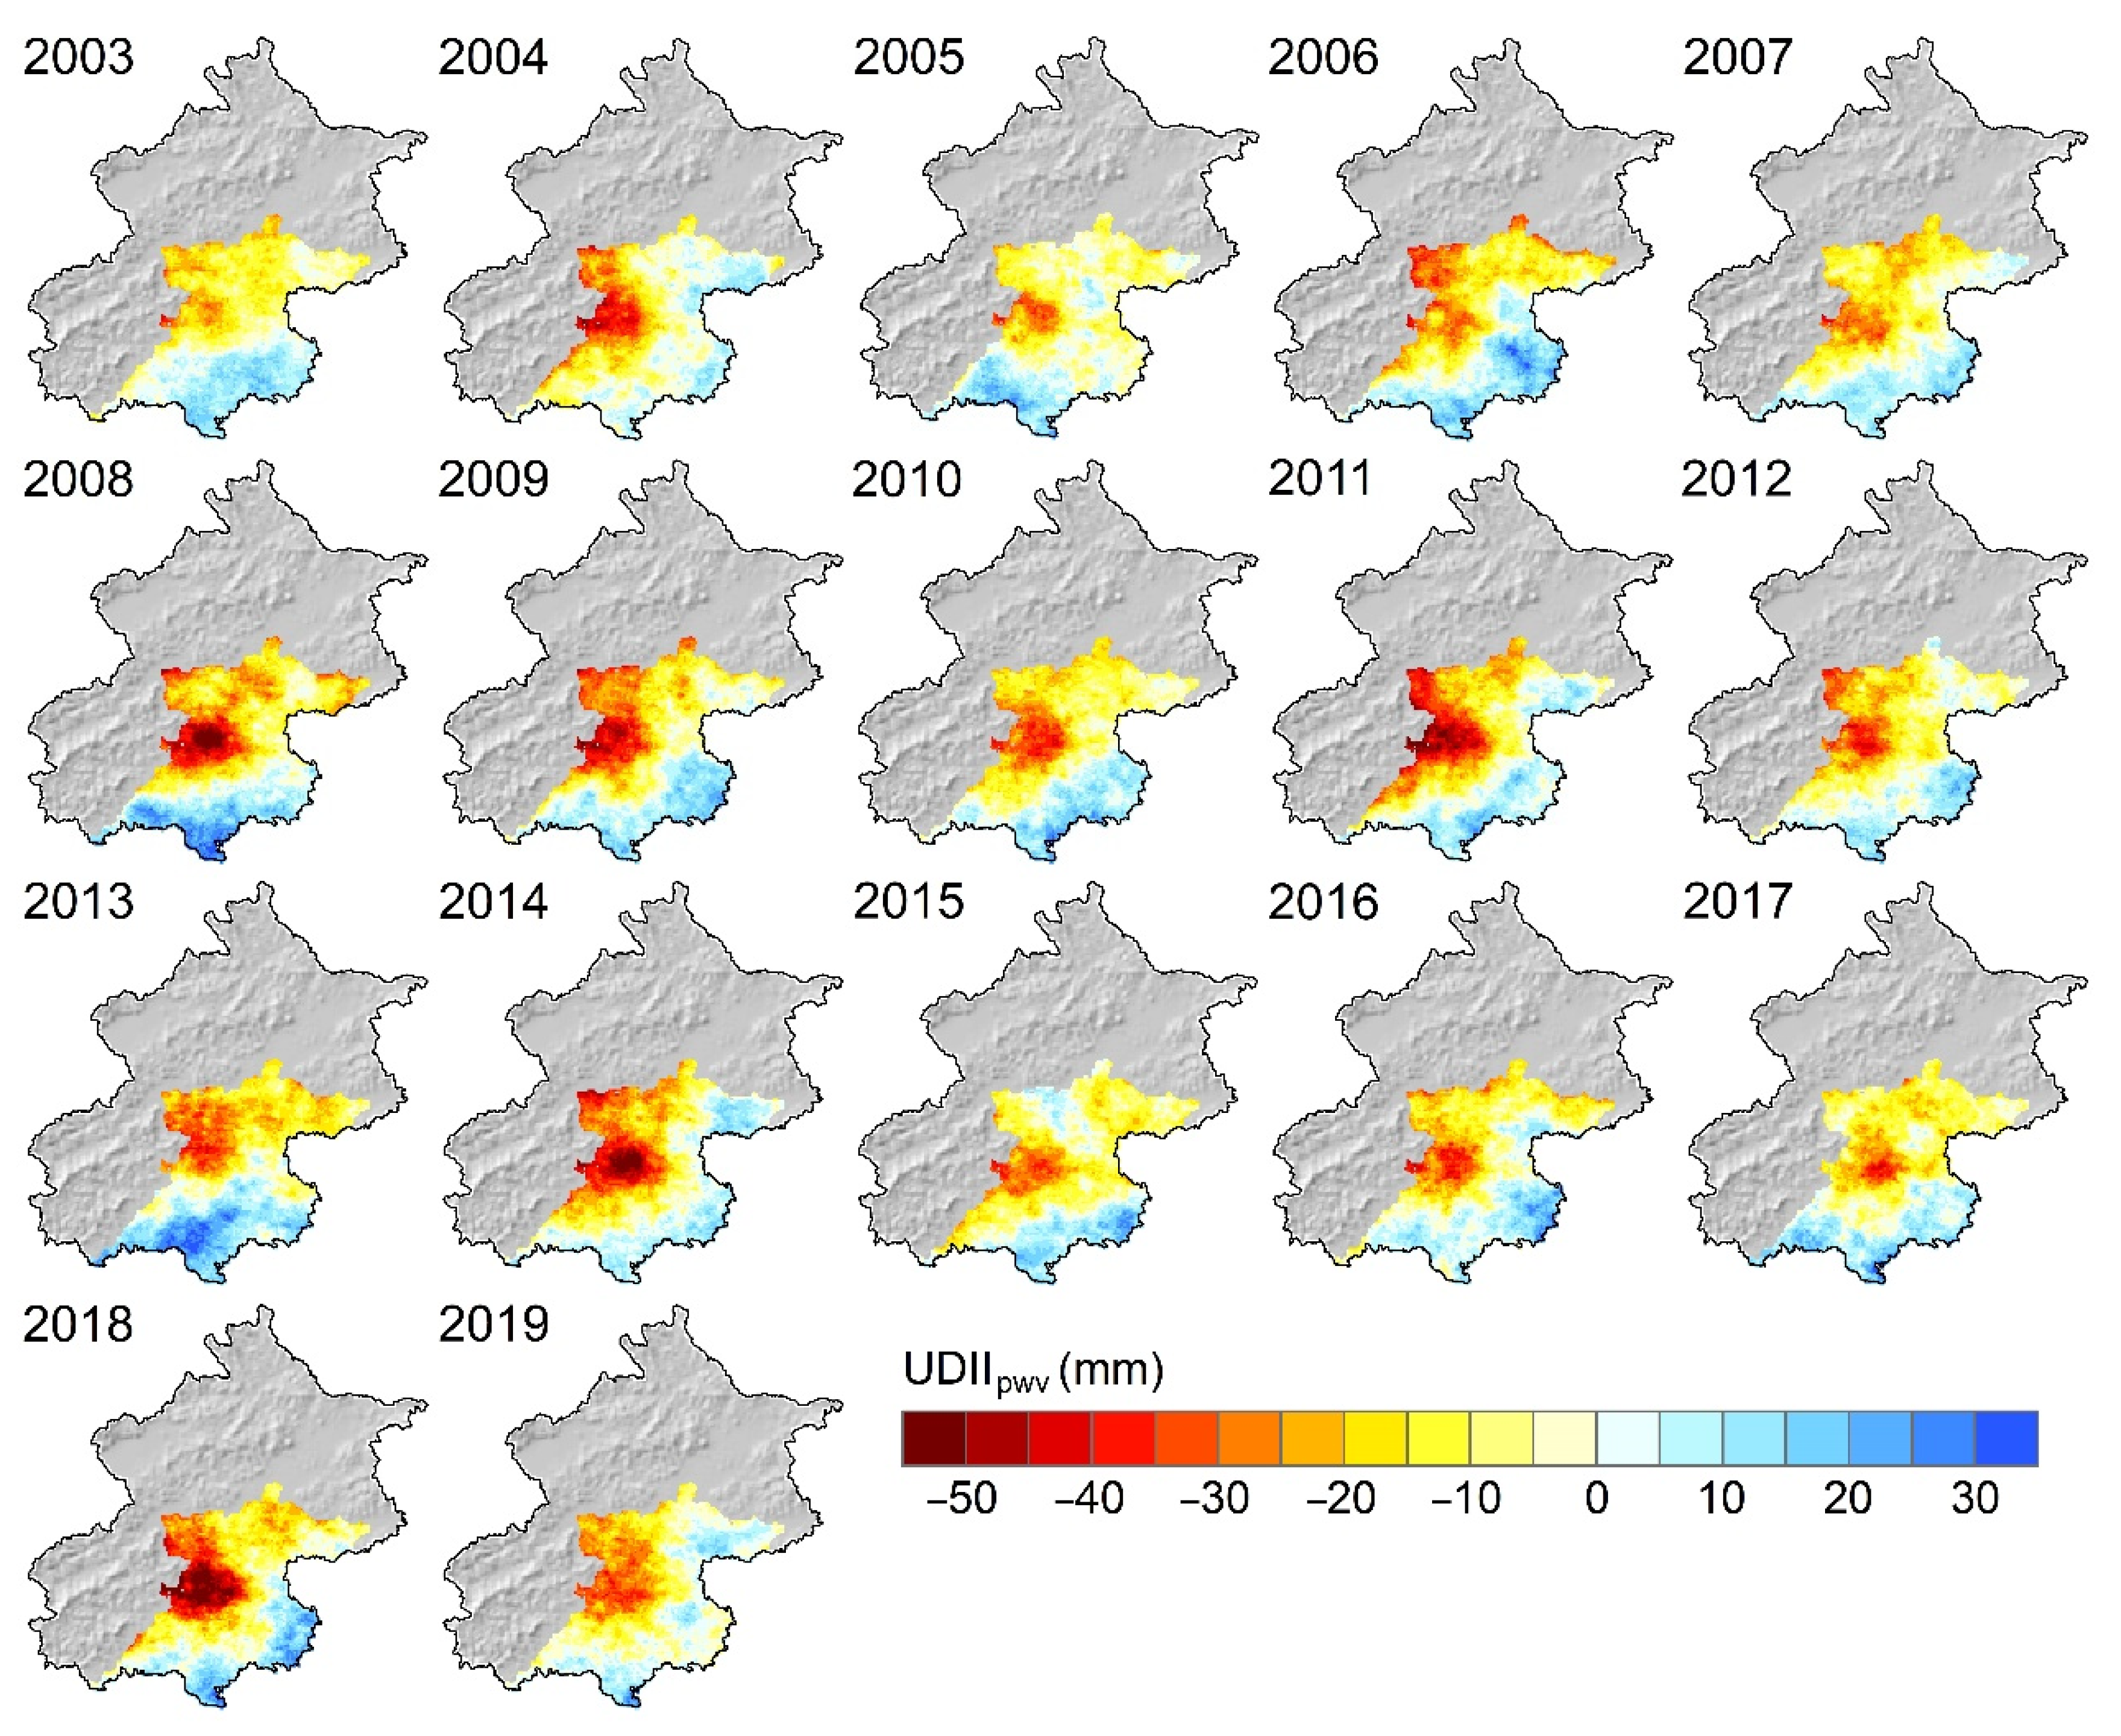
2.4. Urban Dry Islands Intensity Calculation

Prior to calculating urban dry islands intensity (UDII), it was necessary to distinguish urban and rural areas in the imagery. Here, we used the 500 m Terra and Aqua combined MODIS land cover product (MCD12Q1; https://ladsweb.modaps.eosdis.nasa.gov, accessed on 5 April 2020) at a yearly interval to derive urban and built-up lands in Beijing between 2003 and 2018 (in lieu of 2019, which was not available). The MCD12Q1 product was created using supervised classification [49]. A pixel was defined as urban and built-up if at least 30% of its area was made up of impervious surfaces (e.g., building materials, asphalt, and vehicles). The expansion of urban and built-up lands from 2003 to 2018 in the Beijing metropolitan region was shown in Figure 1b. Except urban and built-up lands, the other part of the region was considered as rural lands. As northern and western Beijing is a mountainous area, it was excluded from the following analysis. This urban–rural classification was consistent with the division of urban and rural weather stations shown in Figure 1a. We thereby calculated UDII across Beijing using the following equation:
UDII PWV = PWV ( x , y ) i = 1 n PWV ( x i , y i ) n
where PWV ( x , y ) represents precipitation water vapor at each pixel, PWV ( x i , y i ) the precipitation water vapor at each rural pixel, and n the number of rural pixels. That is, the UDII in a specific year was estimated by subtracting the average precipitation water vapor in rural areas from the precipitation water vapor at each pixel over the plain area of Beijing. The same way was used to calculate urban–rural differences in atmospheric absolute humidity.
To facilitate comparison, we further calculated near-surface UDII using station-based observations. The near-surface UDII was estimated by calculating the differences in humidity indicators between urban and rural stations [34]:
UDII = i = 1 n H U i n j = 1 m H R j m
where i is any station in the urban periphery, n is the total number of urban stations, j is any station in the rural scope, and m is the total number of rural stations.

3. Results

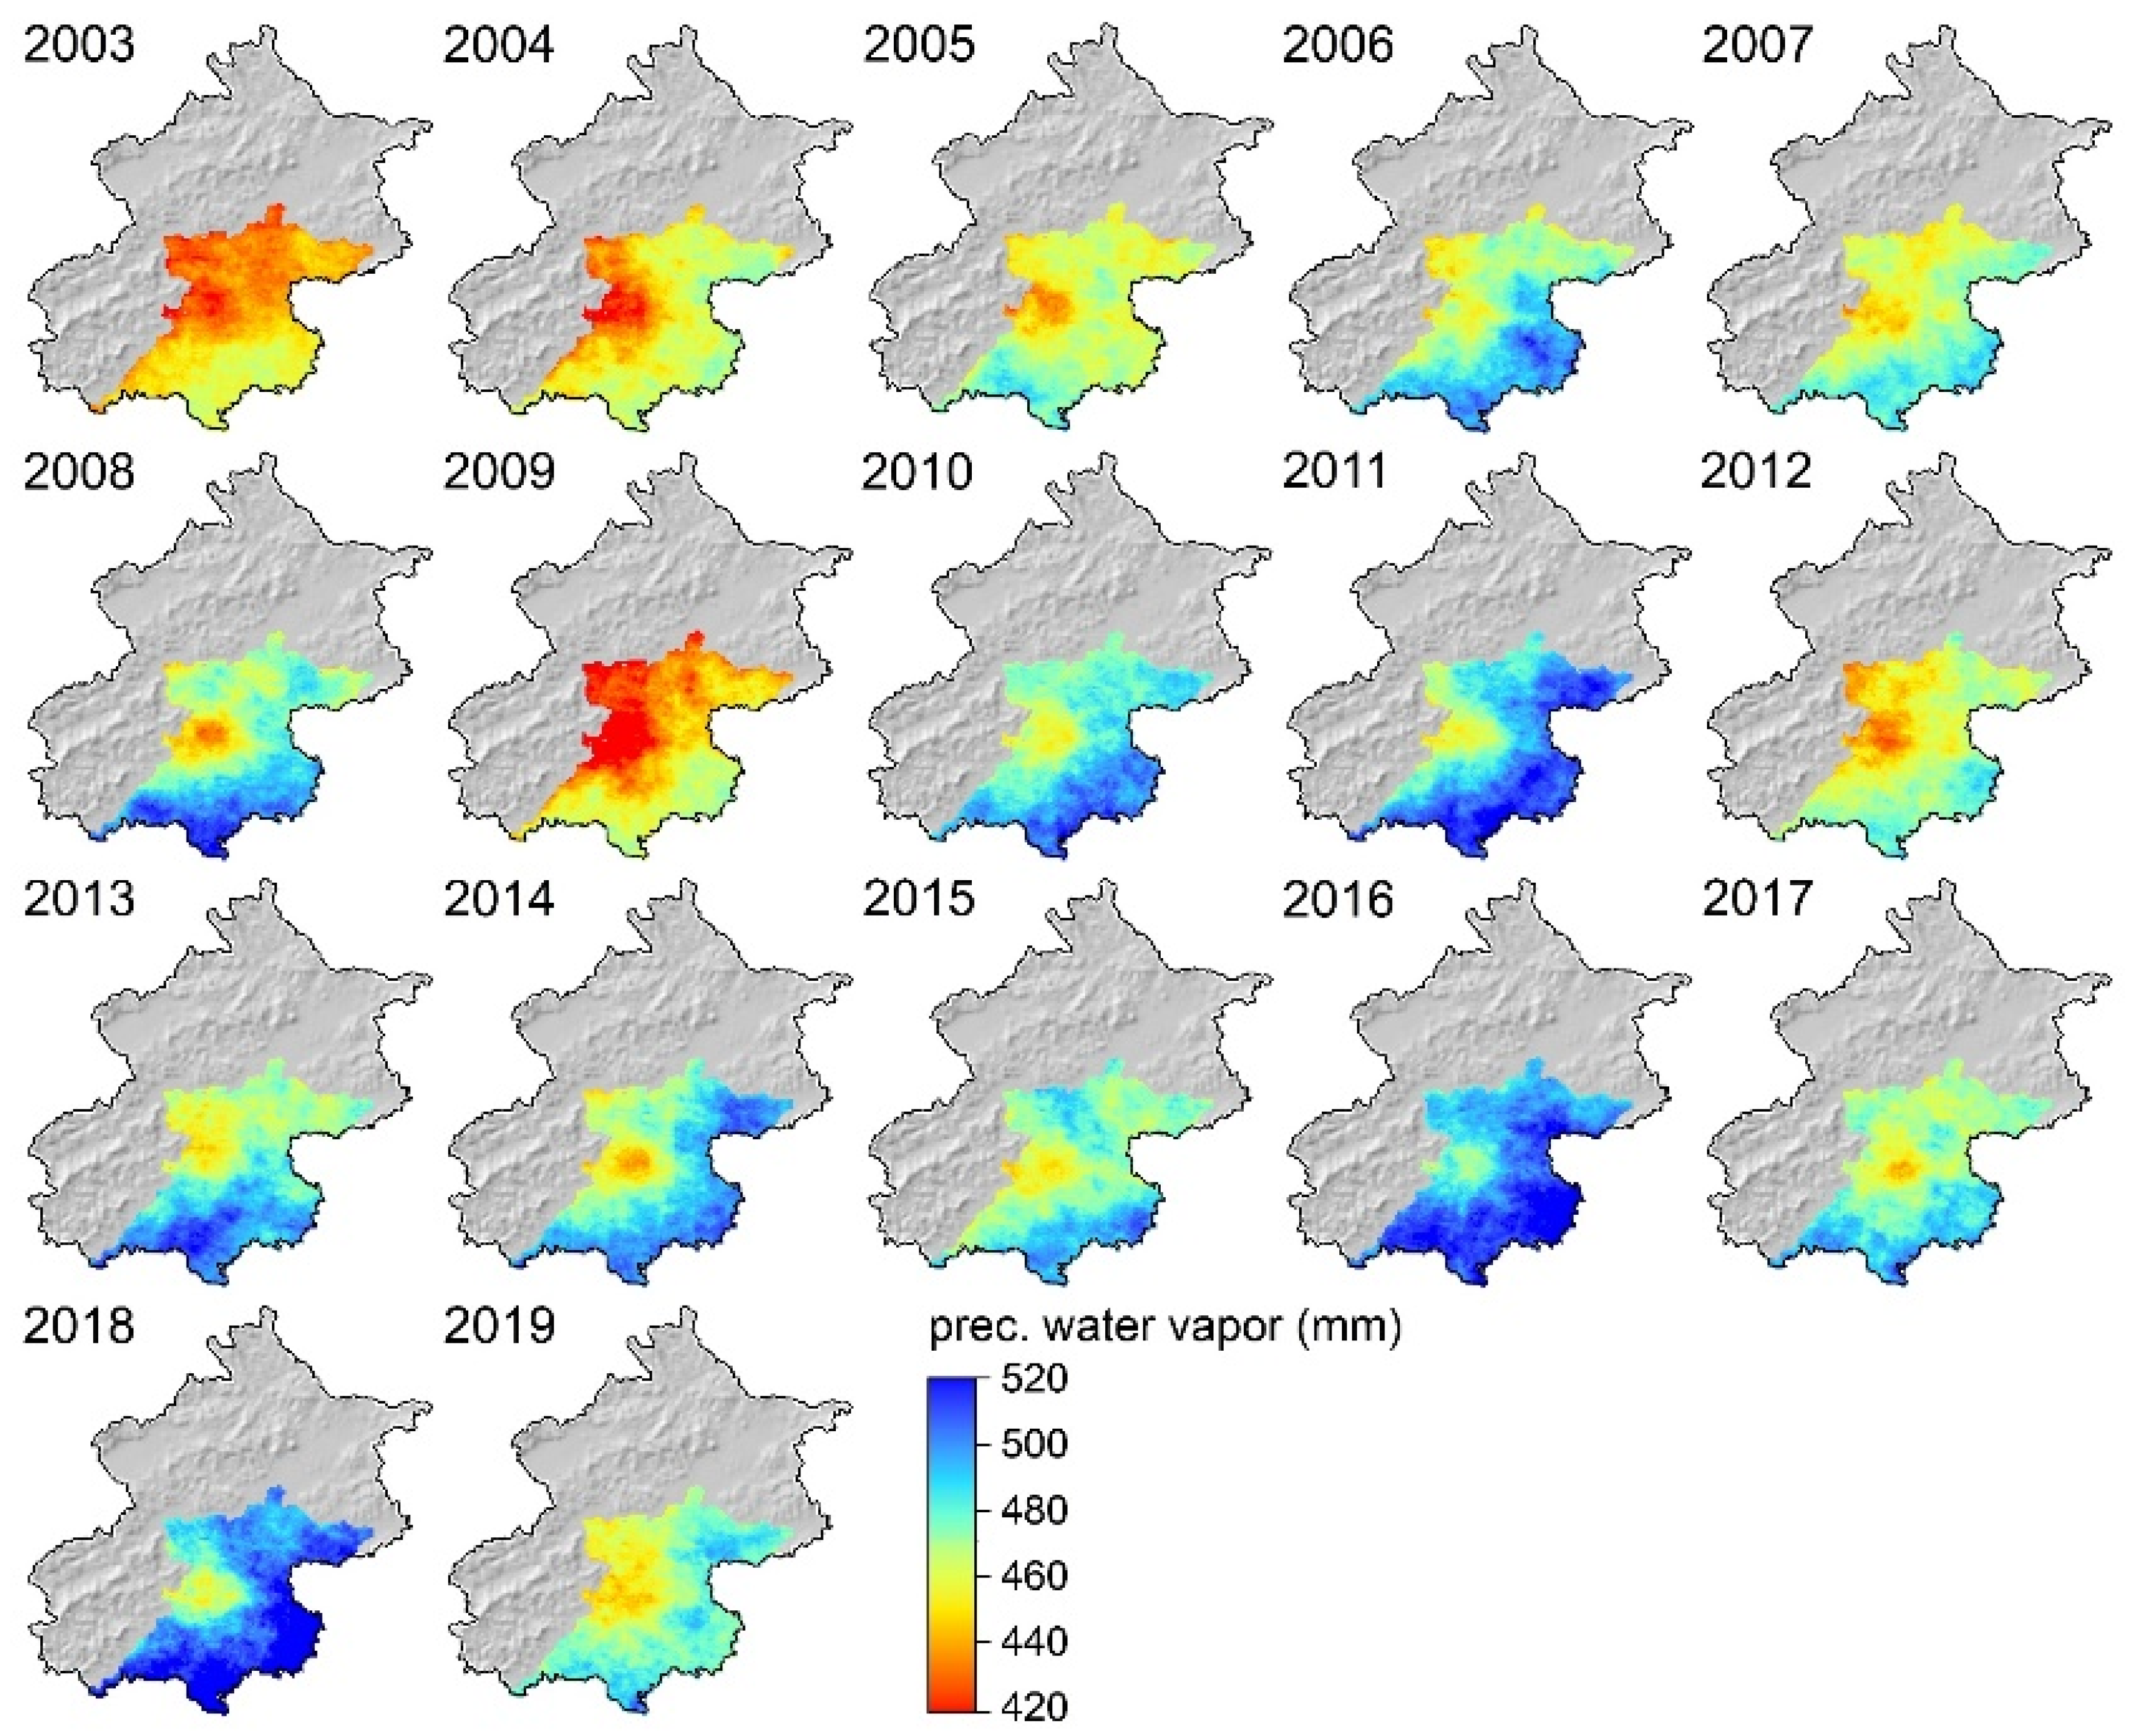
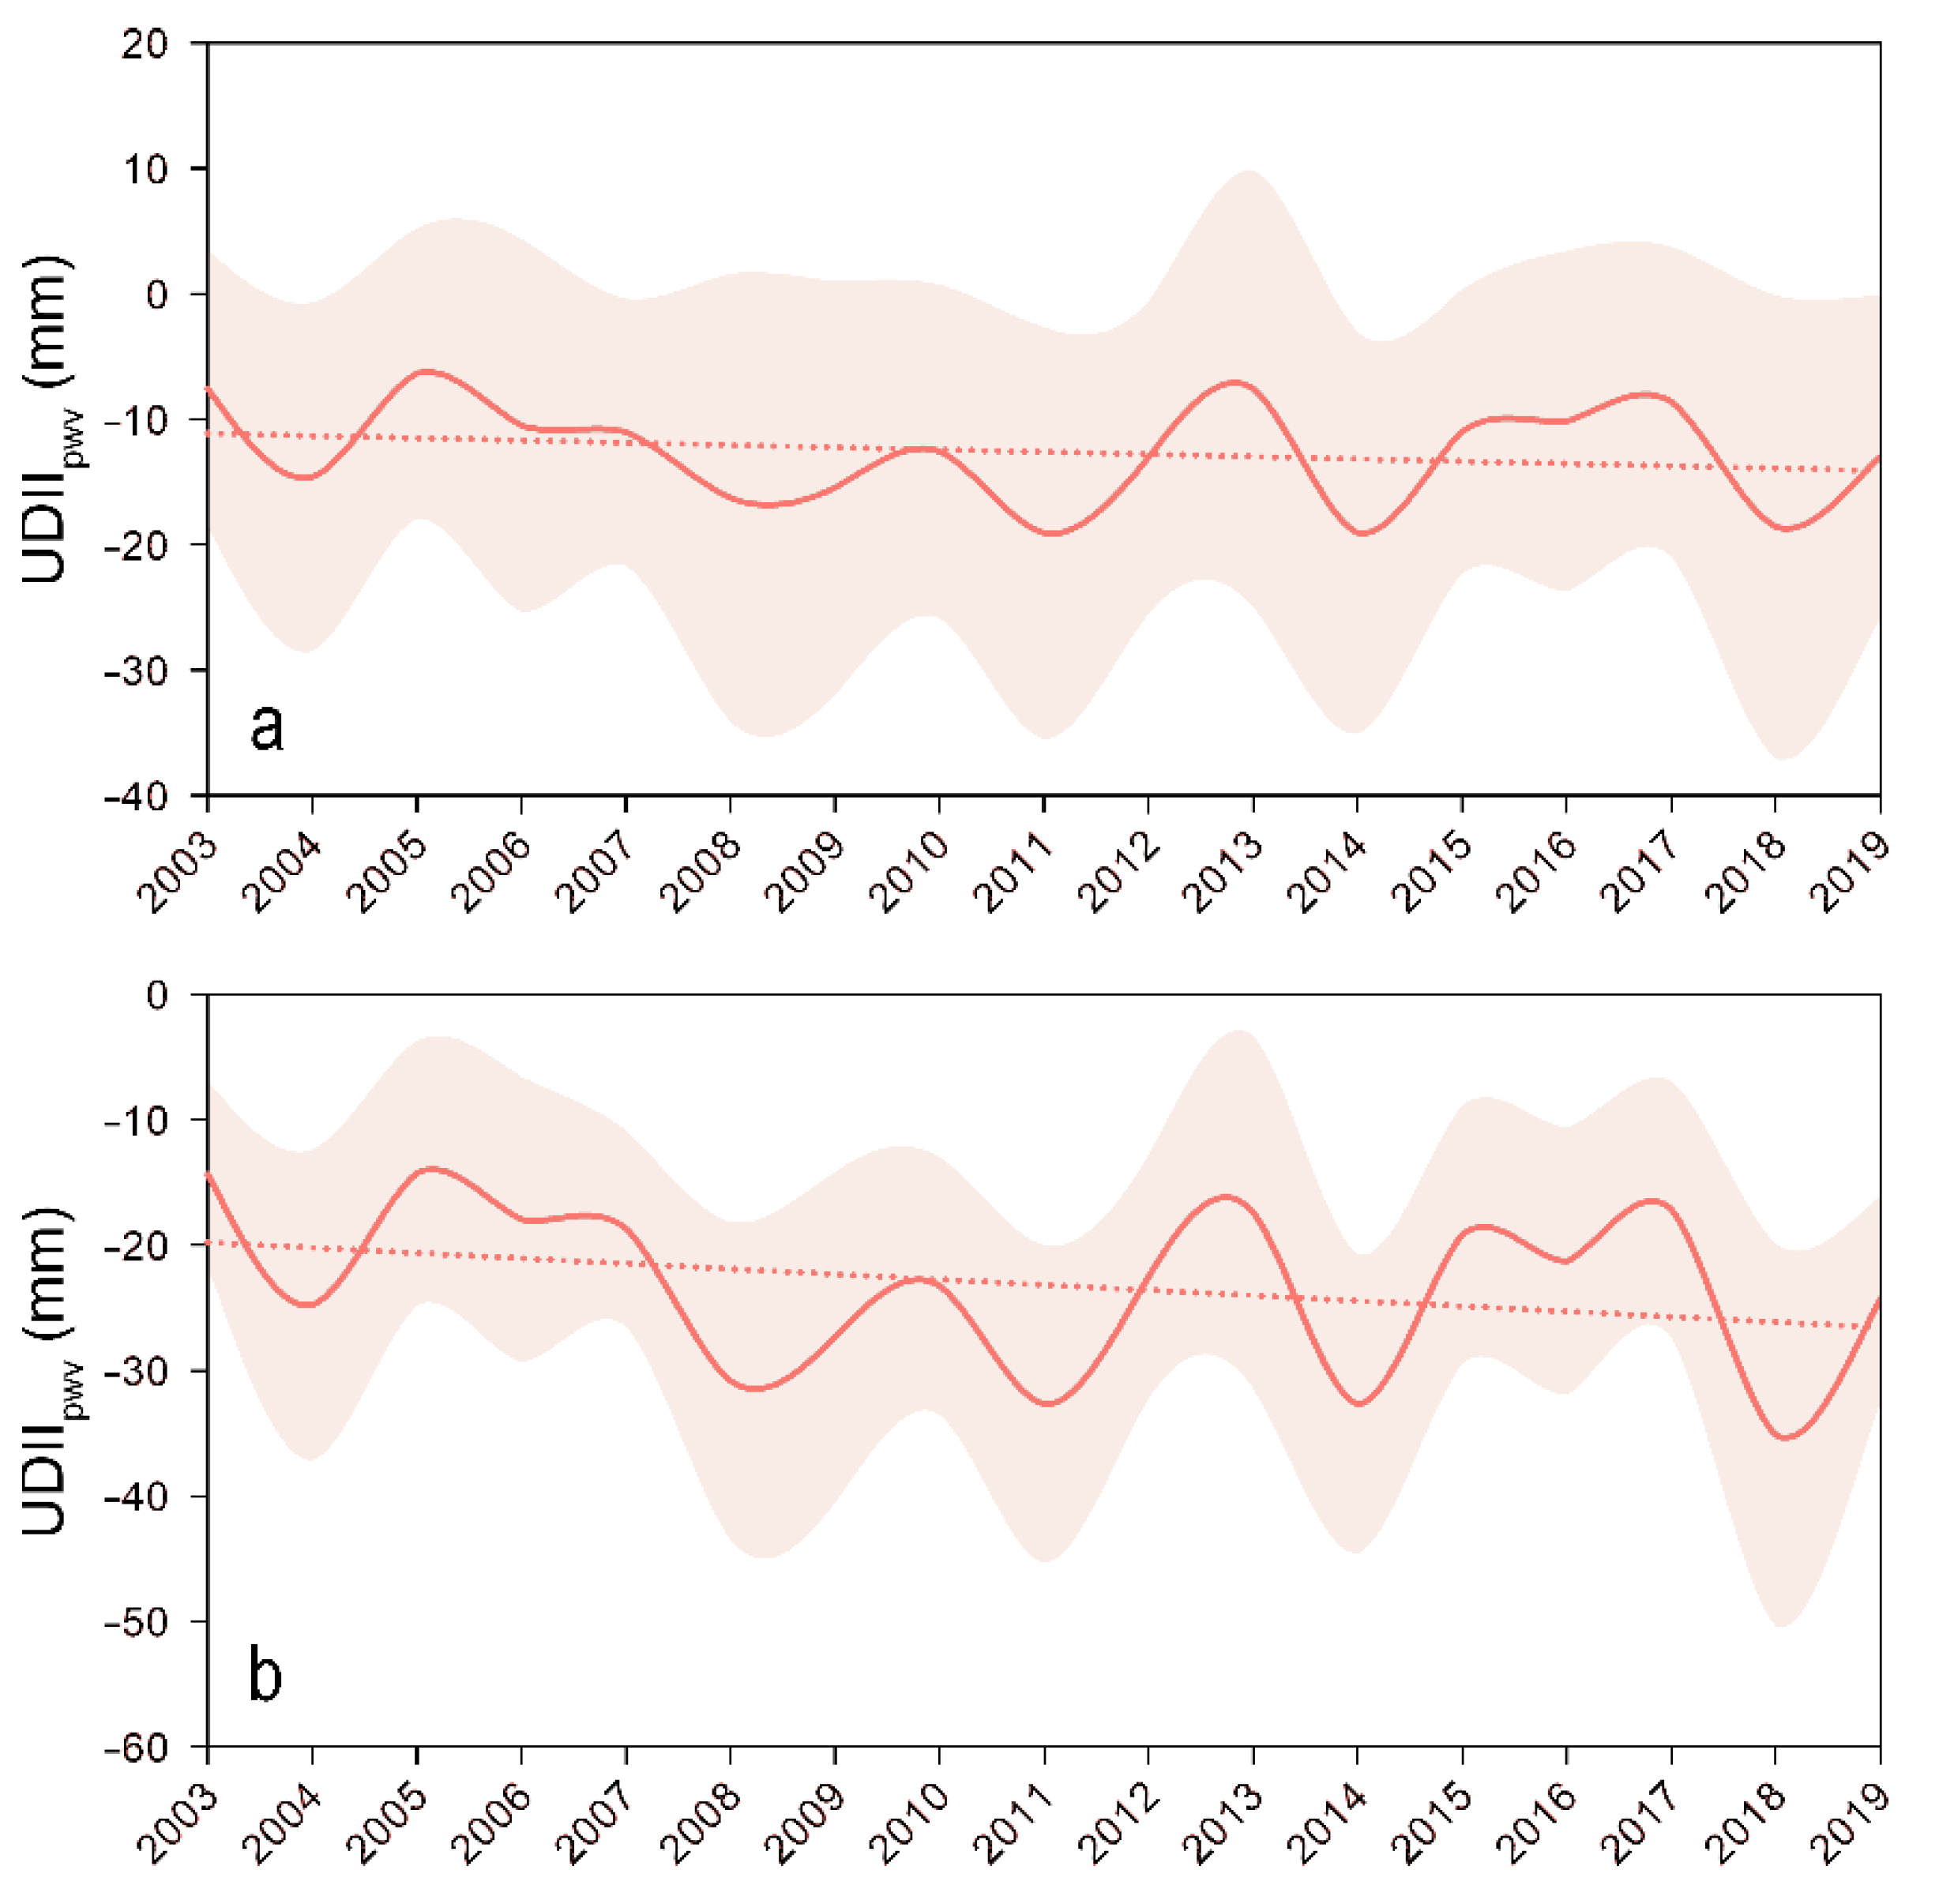
3.1. Urban–Rural Differences in Total-Column Humidity

We first show the spatial pattern and magnitude of annual accumulated total-column PWV in the plain area of Beijing during the period of 2003–2019 (Figure 2). Apparently, the central urban areas were much drier than the surrounding areas, no matter in the dry years (e.g., 2003–2004, 2009) or the wet years (e.g., 2011, 2016, 2018). Across the years, the total-column PWV ranged between 420 and 520 mm, and the temporal variations of PWV were influenced by large-scale background meteorology. That is, urbanization had an impact on the urban–rural differences in PWV, while large-scale forcing determined the amount of moisture content over Beijing in a specific year. Overall, the total-column PWV well reflected the degree of dryness in Beijing, according to observed records from Beijing Meteorological Service (http://bj.cma.gov.cn/, accessed on 7 October 2020). The calculation of UDIIpwv can eliminate the influence of background meteorology to a certain extent. Results show that the UDIIpwv after 2008 became stronger than that during 2003–2007, when the absolute urban–rural differences in PWV were no more than 35 mm in general (Figure 3). In 2008, the Olympic Games were held in Beijing, which necessitated the construction of considerable building infrastructures across the city [50]. The strongest UDIIpwv thus appeared in 2008, 2011, 2014, and 2018, with local UDIIpwv exceeding −50 mm. Generally, the UDIIpwv in the central urban districts of Beijing fell between −40 and −30 mm and was between −20 and−10 mm in the surrounding areas during 2008–2019. Due to the Foehn effect, the areas at the foot of the mountains in the northern and western part of Beijing were drier than the southeastern part, where a positive anomaly was found. Nevertheless, the temporal changes of UDIIpwv show no significant trend during 2003–2019.
To further examine the interannual variability of UDIIpwv, we calculated the average UDIIpwv across the urban area and the central urban districts of Beijing, respectively, during 2003–2019 (Figure 4). For the urban area of Beijing, the time series of UDIIpwv fluctuated around −10 mm, with intra-urban variability being large (i.e., denoted by the shaded areas in Figure 4). However, a drying trend with enlarged urban–rural differences in PWV, though insignificant, was found in the central urban districts of Beijing during the same period, with the full range of variability between −40 and −10 mm. Overall, no significant trends were detected about the temporal changes of UDIIpwv in Beijing. The seasonal variability of UDIIpwv further showed that the summer UDIIpwv was the largest and exceeded far beyond the other seasons, while the winter UDIIpwv was minimal (Figure 5). In the broad urban area, the annual UDIIpwv ranged between −24 and −4 mm, with the summer UDIIpwv between −17 and −4 mm. The magnitude of the spring and autumn UDIIpwv was generally less than 5 mm. By comparison, the UDIIpwv in the central urban districts of Beijing was relatively stronger across all seasons. Compared with the annual UDIIpwv that ranged from −33 to −18 mm, the summer UDIIpwv fell between −24 and −13 mm, indicating that the moisture deficit in spring and autumn also made a contribution to urban dryness. Indeed, a further examination of the monthly UDIIpwv showed that the drying effect manifested in April (mid-spring), peaked in July and August, and decayed in September (early autumn).

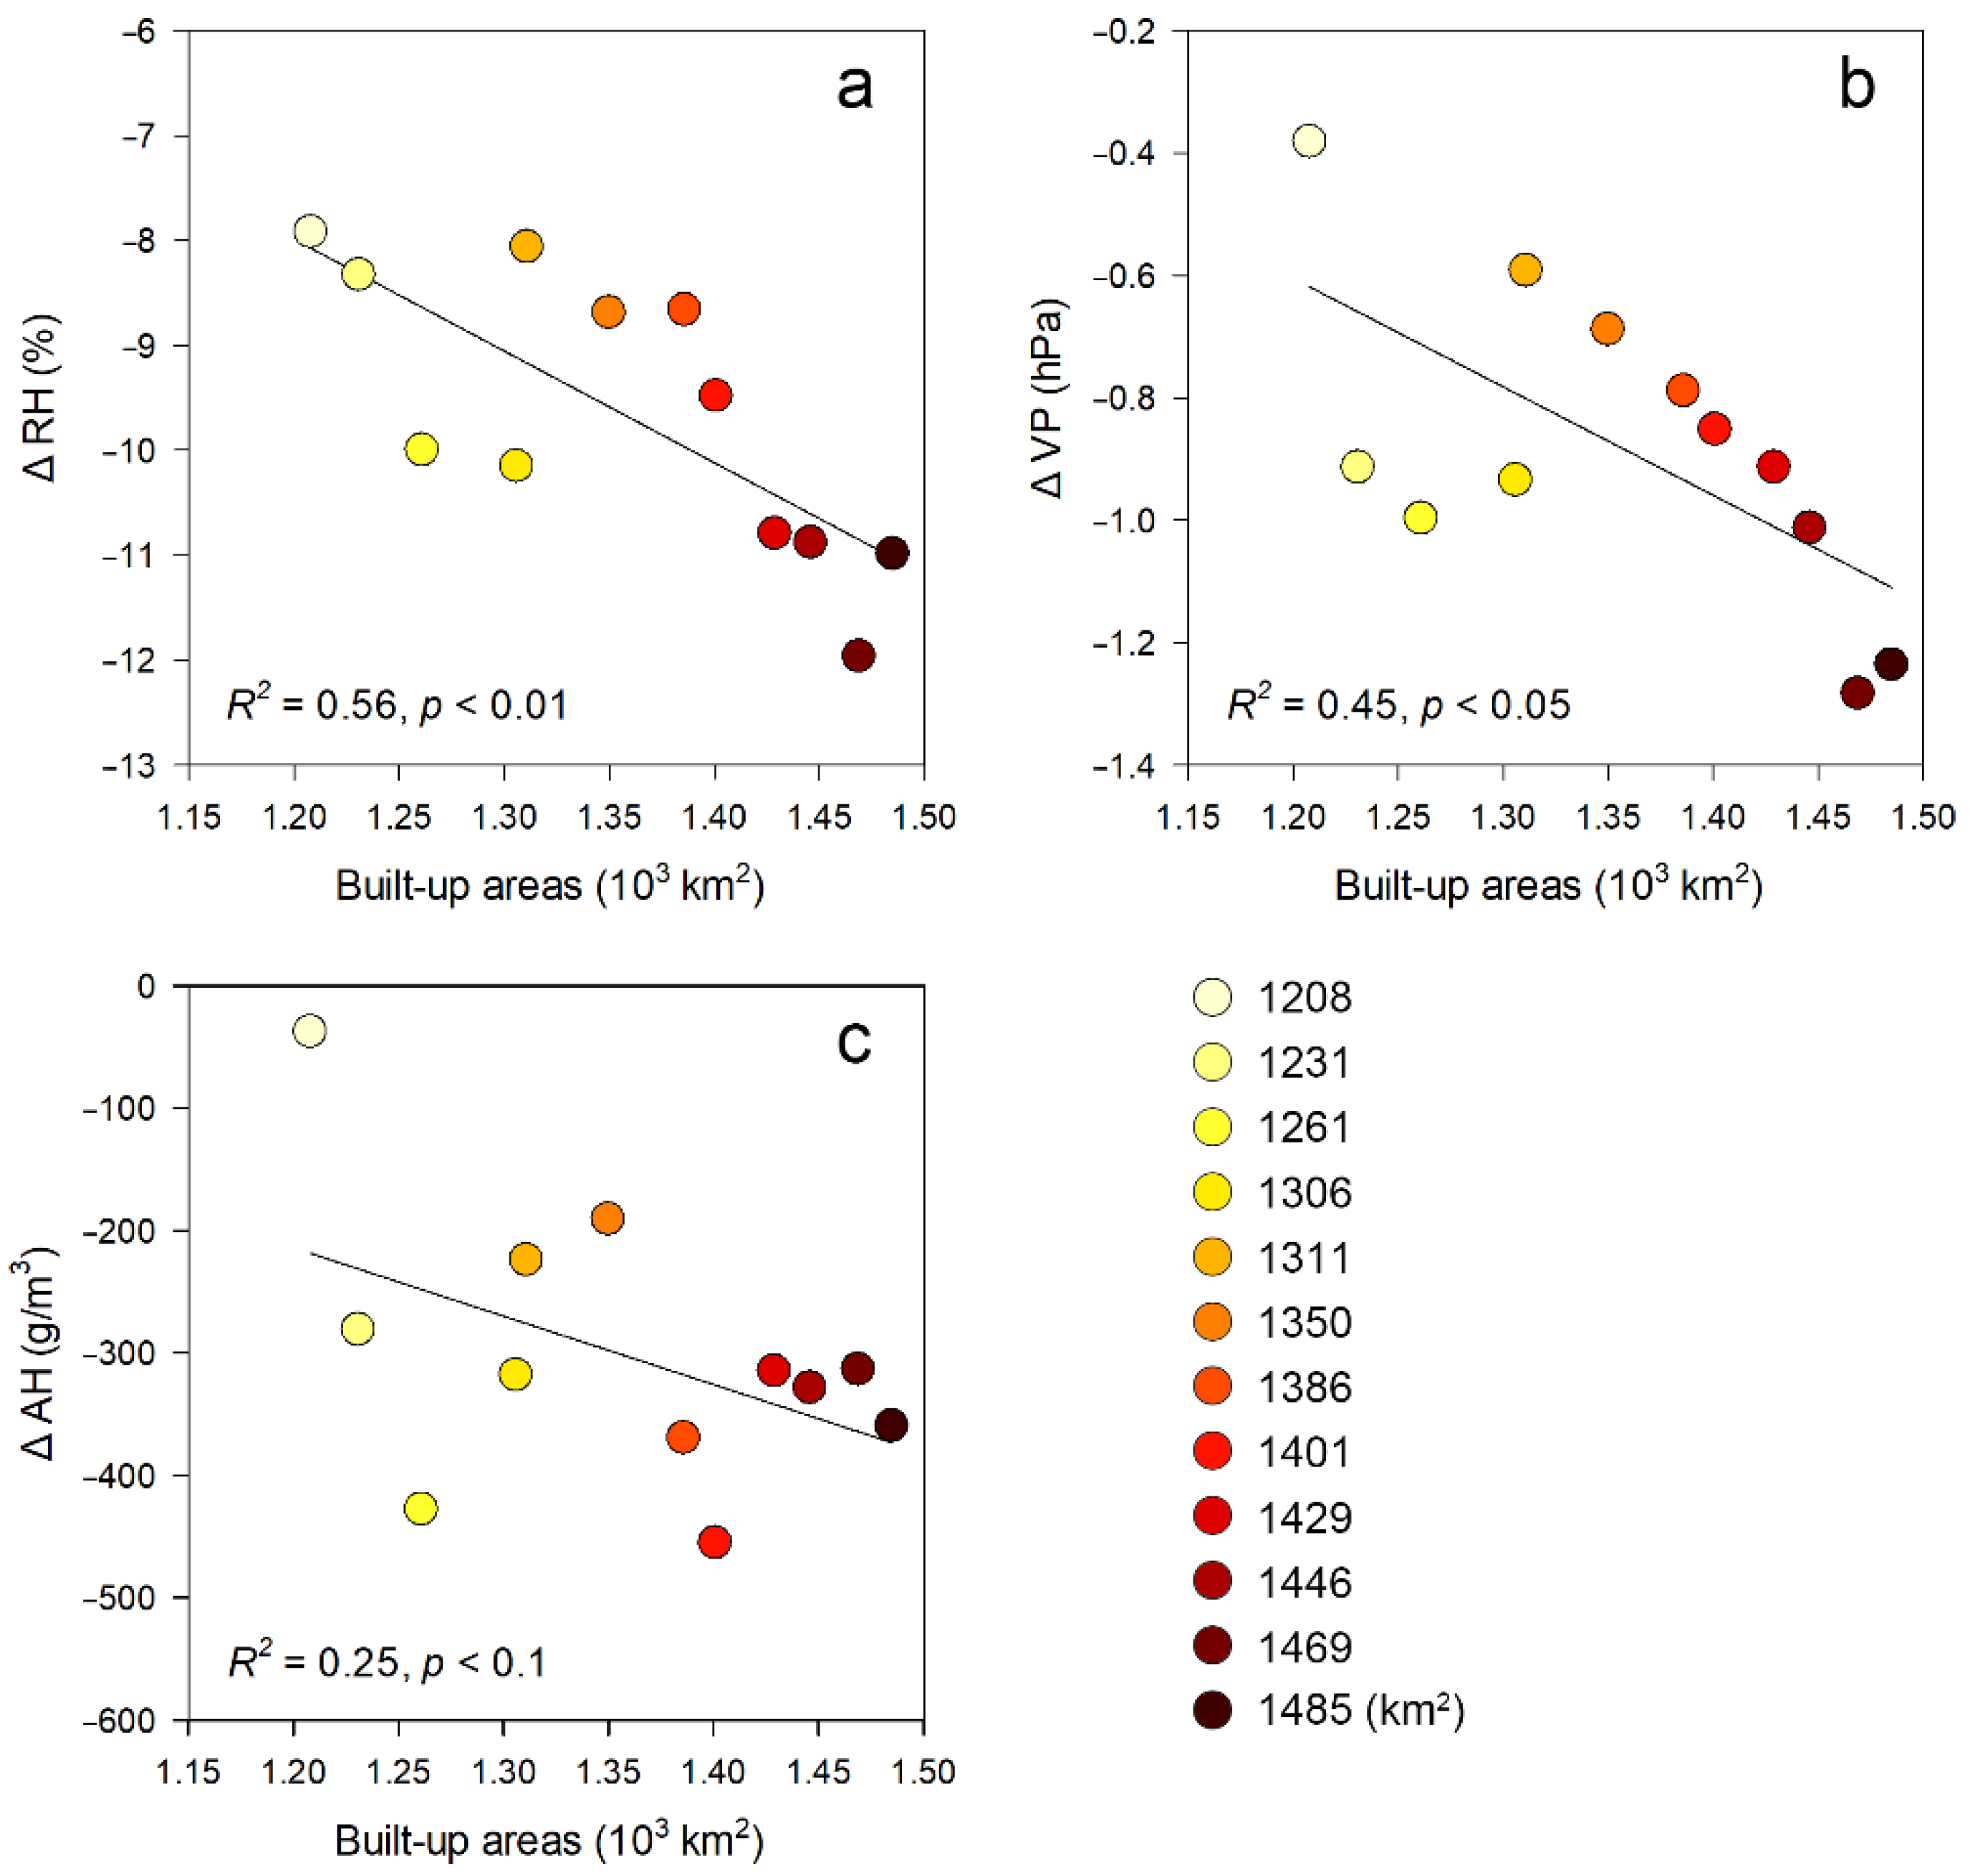
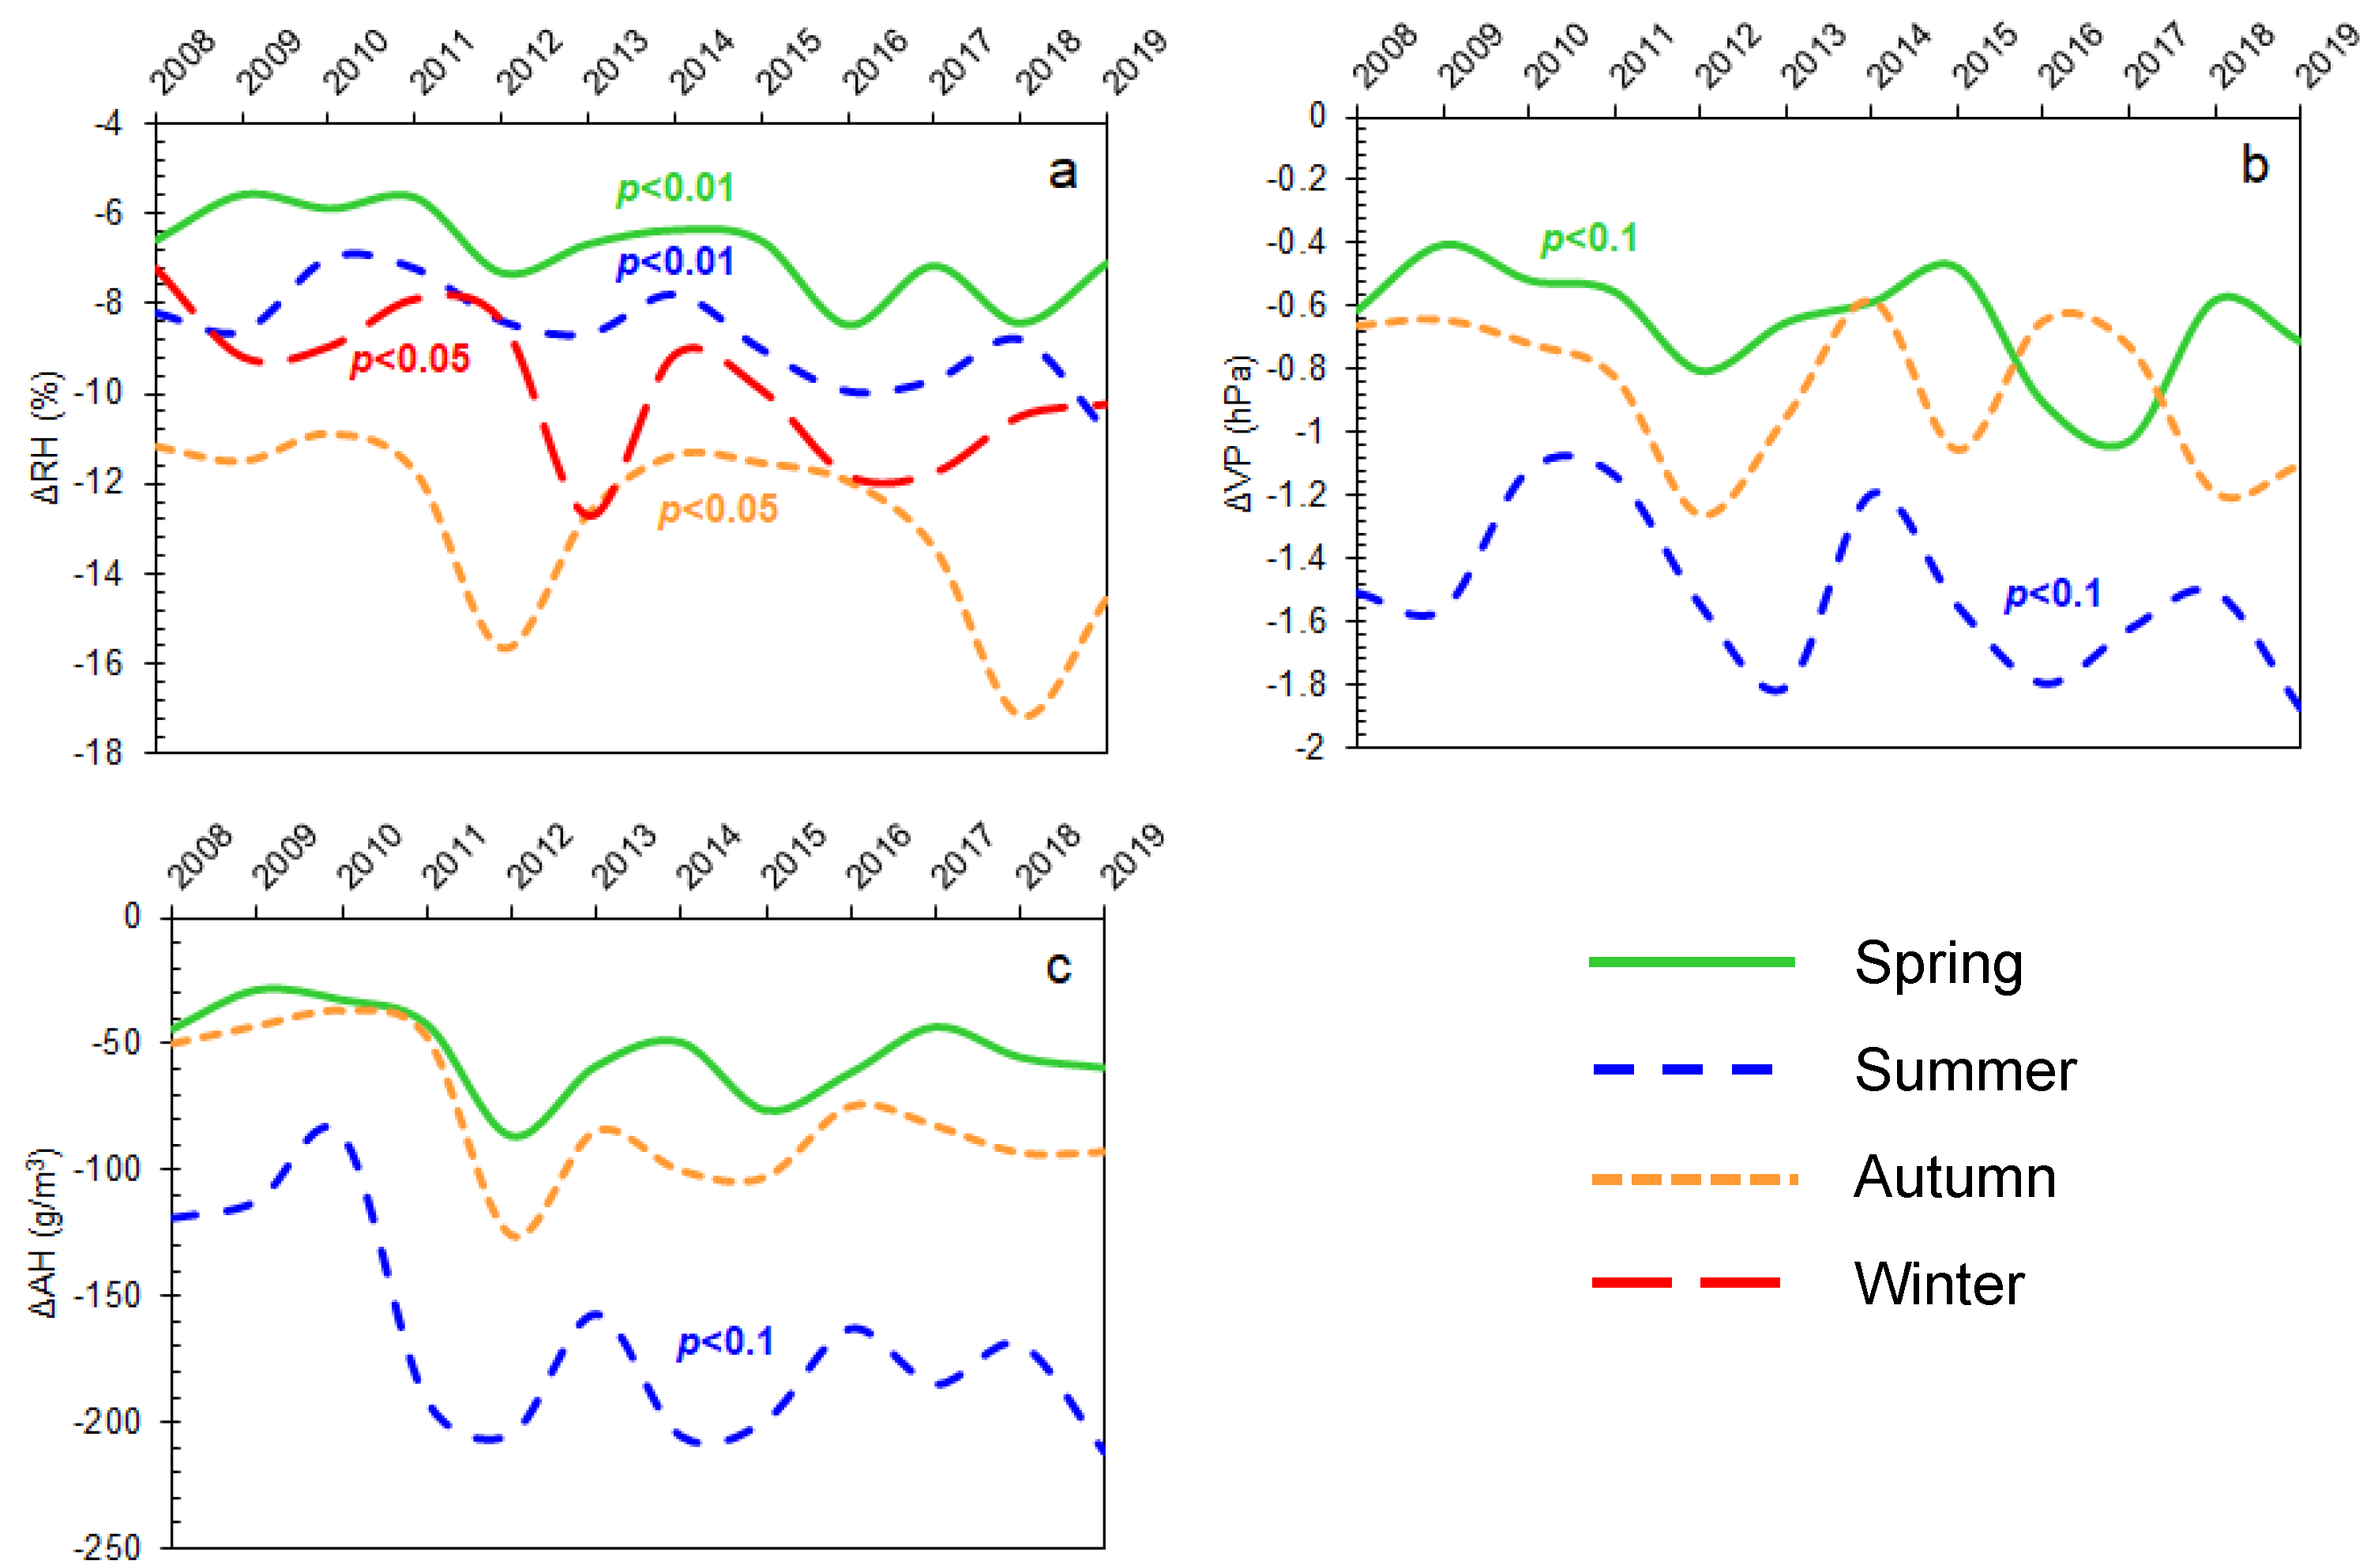
3.2. Urban–Rural Differences in Near-Surface Humidity

We next calculated observed differences in humidity between urban and rural stations to examine how urbanization affected near-surface humidity in Beijing (Figure 6). Results showed that the urban–rural differences in relative humidity (hereafter ΔRH), vapor pressure (hereafter ΔVP), and absolute humidity (hereafter ΔAH) widened over time with the growth of built-up areas, indicating that urban expansion exerted a strong influence on near-surface UDII. The decreasing trend of ΔRH was the most significant (p ≈ 0), followed by ΔVP (p < 0.01), while the trend of ΔAH was weak (p < 0.1). Note that the built-up areas in Beijing decreased from 2009 to 2010, and the urban–rural differences in near-surface humidity narrowed in 2010, especially for ΔVP and ΔAH. The reduction in built-up areas corresponding to 2010 was mainly because fifty villages in the Beijing city were demolished and relocated for better urban development (http://www.beijing.gov.cn/, accessed on 10 October 2020). Indeed, there were significant negative correlations between the built-up areas and near-surface UDII (Figure 7). Expansion of the built-up areas explained 56% of the changes in ΔRH, with p < 0.01. In general, the increment of the built-up areas during 2008–2019 enlarged the urban–rural differences in relative humidity by 2.94%. A significant negative correlation (p < 0.05) was also found between the built-up areas and ΔVP, and the expansion of built-up areas explained 45% of the variance in ΔVP. The increment of the built-up areas from 2008 to 2019 broadened the urban–rural differences in vapor pressure by 0.50 hPa. By contrast, ΔAH had a weak negative correlation with the built-up areas, with the explanation power equal to 25% and p < 0.1.
In addition to the annual moisture differences, we made a step forward in examining the time-series changes of seasonal moisture differences between urban and rural stations during 2008–2019 (Figure 8). It was shown that a decreasing trend (i.e., enlarged moisture differences) was detected in all seasons, whichever indicators were used to characterize the UDIs effect. Moreover, the seasonal variations of ΔRH were different from those of ΔVP and ΔAH. Concretely, the magnitude of ΔRH was the highest in autumn and the lowest in spring, while summer and winter ΔRH was in between, with the magnitude showing minor differences in the two seasons. However, the intensity of UDIs, as revealed by vapor pressure and absolute humidity, was the strongest in summer and the weakest in winter (not shown due to the minimal changes). This was consistent with the seasonal variations of UDIIpwv derived from satellite observations (see Figure 5). For the temporal variations, significant downward trends of ΔRH were detected across all seasons (p < 0.01 in spring and summer; p < 0.05 in autumn and winter). The trends of ΔVP and ΔAH were much weaker. Among the four seasons, the trends of ΔVP and ΔAH in summer were the most evident (p < 0.1).

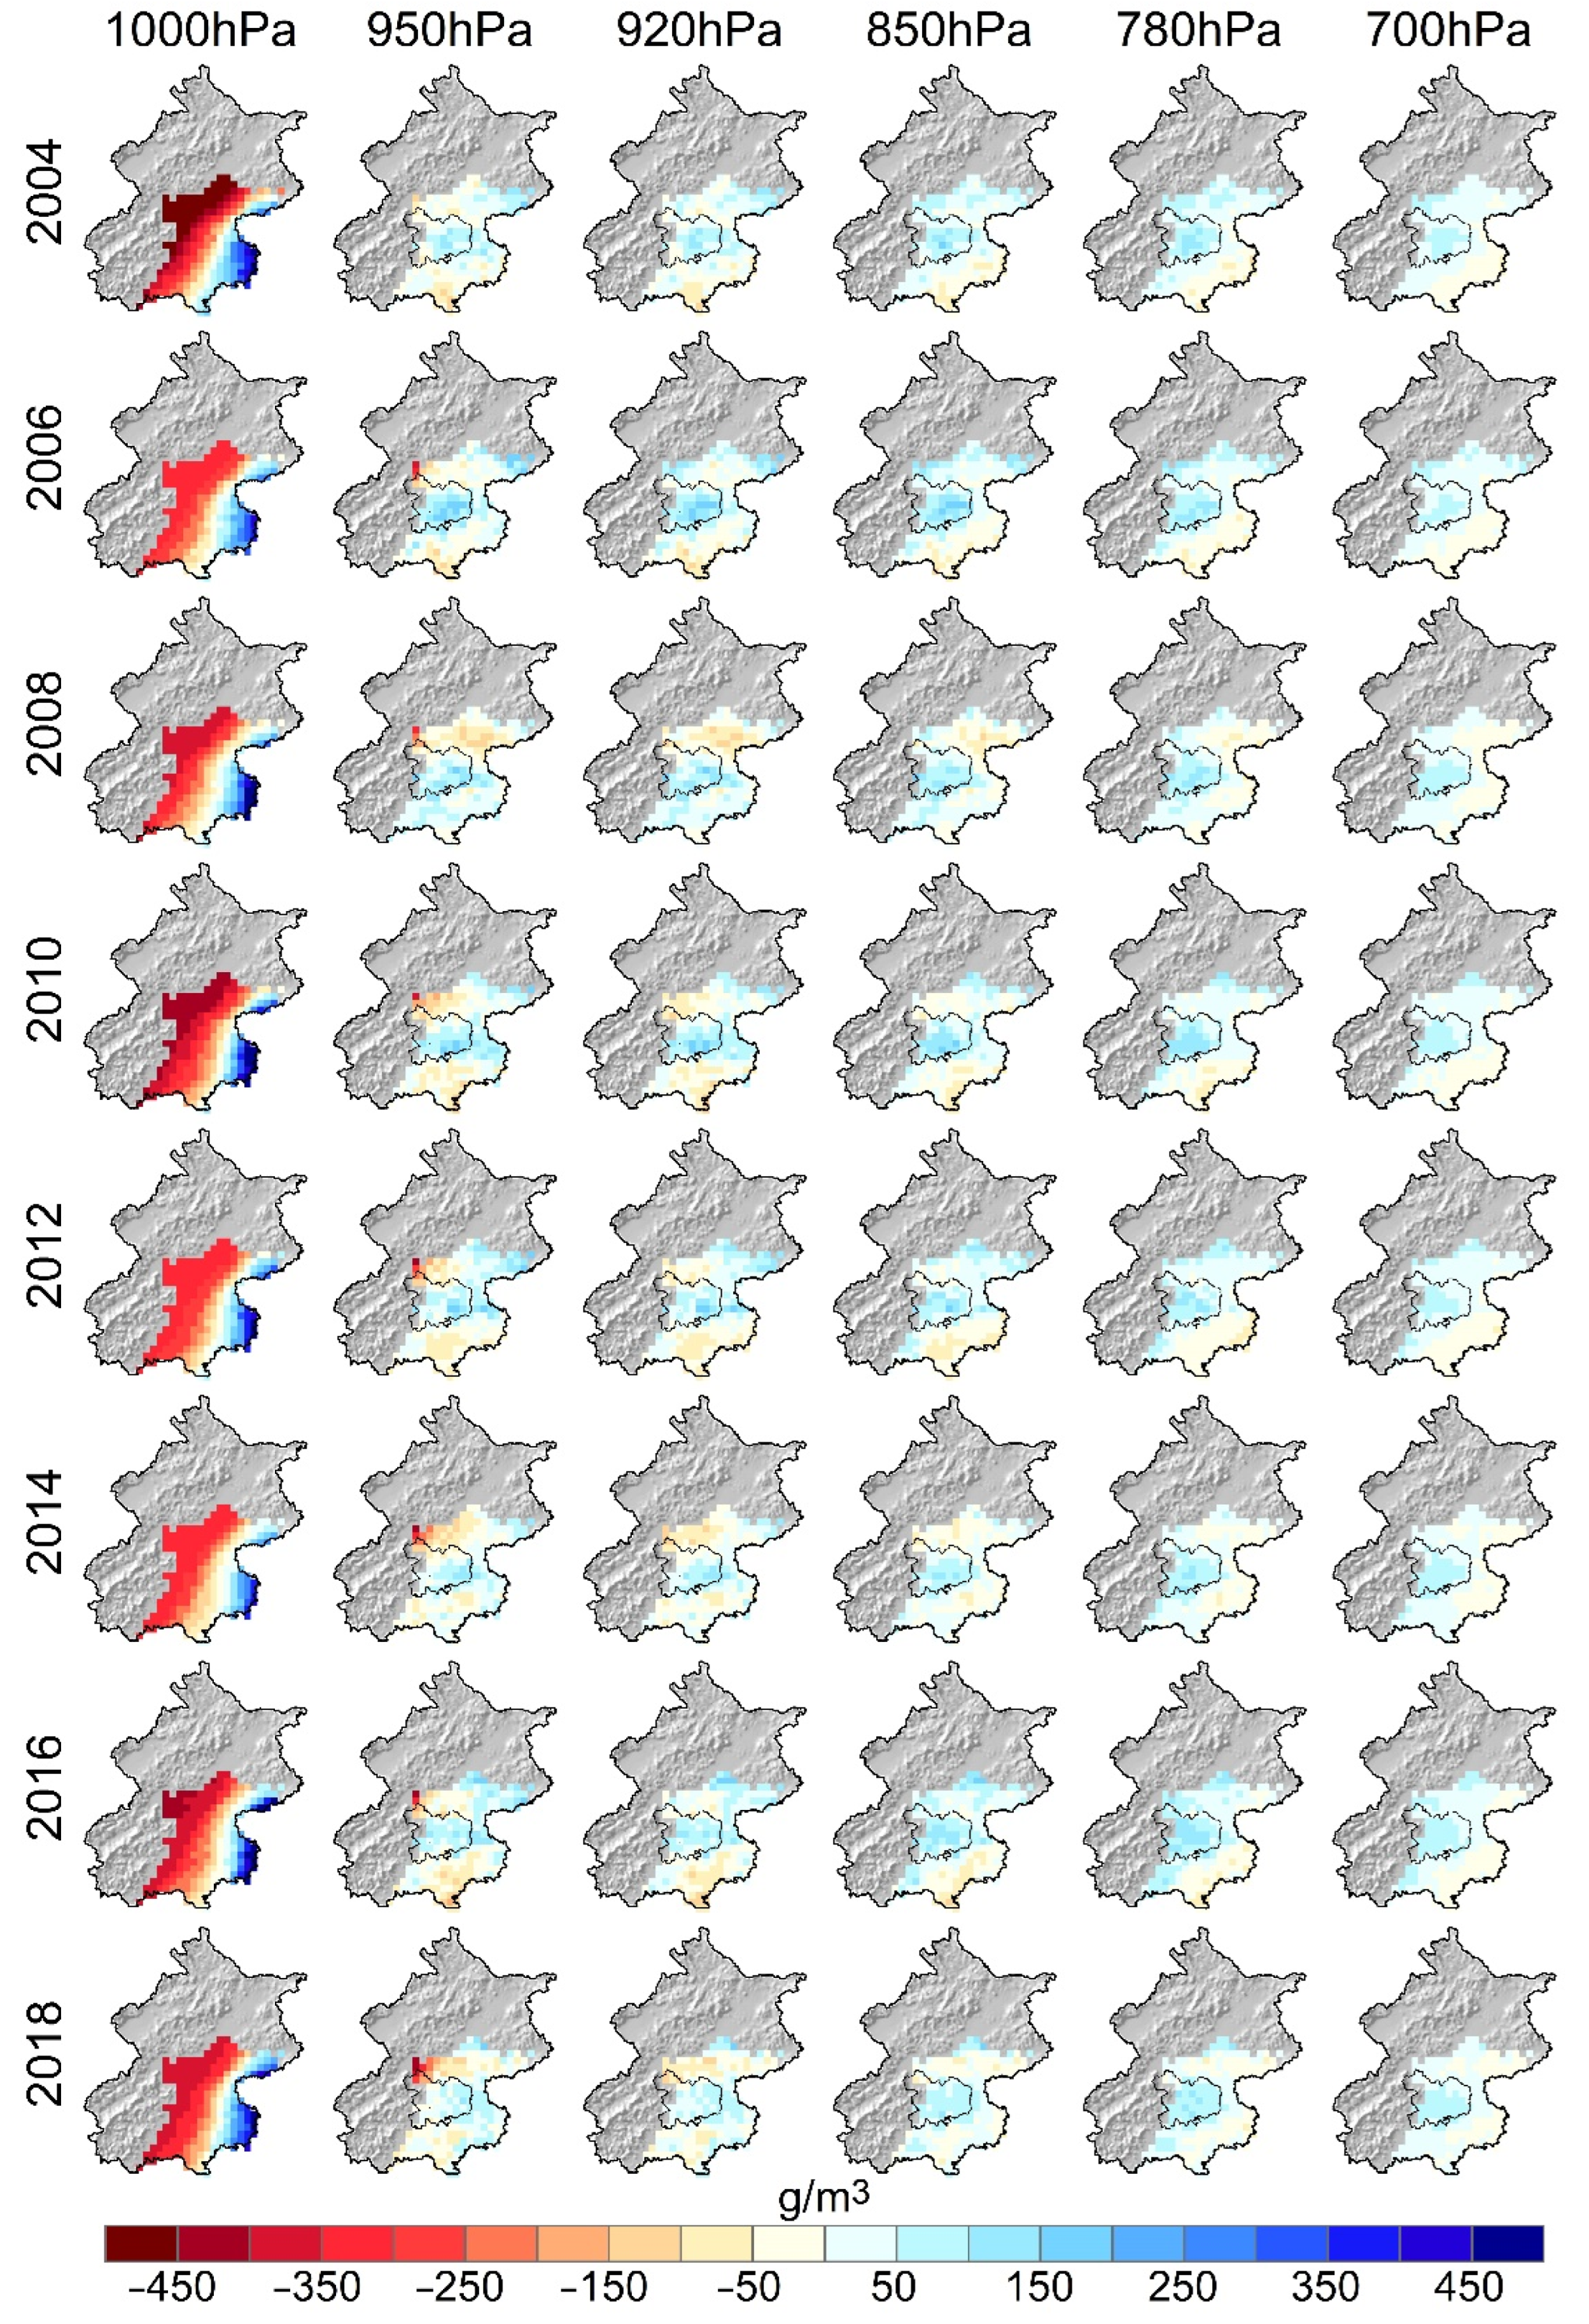
3.3. Urban–Rural Differences in Atmospheric Humidity

In the previous two sections, we analyzed the urban–rural differences in total-column and near-surface humidity in Beijing, using satellite- and station-based observations. Although both total-column and near-surface UDIs were observed, the time-series change of near-surface UDII was far more evident than that of total-column UDII. To examine this discrepancy, we further calculated the urban–rural differences in atmospheric absolute humidity at 1000, 950, 920, 850, 780, and 700 hPa. We showed the results obtained from even years to represent the spatiotemporal changes of atmospheric humidity profile during our study period (Figure 9). Notably, the urban wet islands effect was found in the upper atmosphere (i.e., above 950 hPa). That is, the central urban area (contoured by black solid lines in Figure 9) was wetter than the surrounding area at and above 950 hPa. The urban wet islands intensity was the highest at 950 hPa, on the order of 100–150 g/m3 while in the surrounding area (especially the northern and southern parts of the central urban area), a drying effect with a humidity deficit of 0–100 g/m3 was estimated. In addition, the drying effect became stronger since 2008 at this pressure level. As the altitudes elevated from 950 to 700 hPa (~3.0 km above the ground), the urban wet islands intensity got weaker, and so did the drying effect in the surrounding area. At the 700 hPa pressure level, the urban wet islands intensity was reduced to 0–100 g/m3, while the moisture deficit in the nearby area was generally no more than 50 g/m3. The MODIS atmospheric profile data at 1000 hPa had a large proportion of missing values because near-surface pressure in Beijing was usually less than 1000 hPa across the year. Hence, the near-surface moisture deficit derived from the MODIS atmospheric profile was excluded from the analysis.

4. Discussion

Compared with previous studies focused on near-surface UDIs using station-based observations, this research made a comprehensive assessment of total-column, near-surface, and atmospheric UDIs in the Beijing metropolitan region, using both remotely sensed and station-based observations. Results showed the existence of total-column and near-surface UDIs. However, the atmospheric UDIs were mainly manifested in the near-surface layer, while urban wet islands were found at and above 950 hPa. The urban wet islands effect in the upper atmosphere (i.e., ≤950 hPa) can neutralize the near-surface dry islands effect, thus leading to the non-significant time-series changes in the total-column UDII (as shown in Figure 4). The increased temperature and roughness length of the urban underlying surfaces led to enhanced convergence, which pumped the relatively warm and moist surface air into the upper atmospheres [51,52]. Meanwhile, Moriwaki et al. [29] reported that near-surface UDIs (characterized by absolute humidity) in the Matsuyama Plain, Japan, were closely related to a higher cloud base level in urban areas than in rural areas. For the detailed physical processes that drove such changes, numerical approaches should be conducted in future research. This can also help understand the formation of rainfall in urban areas, a debate that has lasted for several decades [51].
Compared with research on urban heat islands, the measurement of UDIs was much more complex due to the lack of a unified indicator and the sensitivity of humidity to temperature [53]. The lack of standard methods to quantify UDIs and the functional sensitivity of humidity to temperature made direct comparison difficult. Recent studies preferred to use multiple metrics, so as to overcome the limitations of individual metrics [35,36,38]. In this study, we used station-observed relative humidity, vapor pressure, and absolute humidity to calculate near-surface UDIs intensity in Beijing, respectively. We found that the correlation between ΔRH and the built-up areas was stronger than ΔVP and ΔAH. Previous studies reported that the trends of vapor pressure deficit and relative humidity had a stronger relationship with the urban expansion rate in the Yangtze River Delta, Pearl River Delta, and Beijing–Tianjin–Hebei, compared with the trends of actual vapor pressure and specific humidity [36,37,38]. Findings of previous studies were generally consistent with ours. The better performance of relative humidity and vapor pressure deficit was largely attributed to the higher temperatures in urban areas. That is, the strong urban heat islands effect, in conjunction with reduced evapotranspiration, made the relative humidity much lower and vapor pressure deficit much higher in urban areas than in rural areas [33,34,38,54].
In terms of seasonal variations, the UDIs intensity was generally the strongest in hot, wet summer and the weakest in cold, dry winter over Beijing. This was especially evident in the seasonal variations of total-column UDIIpwv. However, the seasonal variations of ΔRH were an exception. We showed that the largest ΔRH was observed in fall, while the largest ΔVP and ΔAH were observed in summer, which was consistent with previous research conducted in Beijing, as well as Matsuyama, Japan [29,34,54]. Yang et al. [34], focused specifically on relative humidity in Beijing, speculated that the maximum ΔRH in autumn was probably because of a delay of soil moisture change in rural areas after the rainy season (i.e., summer). Nevertheless, the exact physical mechanisms associated with the seasonal variations of ΔRH need further investigation. Typically, dry seasons were characterized by much less moisture in the atmosphere, and the moisture differences between urban and rural areas were smaller than wet seasons. In addition to the reduced evapotranspiration, a more rapid draining of surface water in urban areas aggravated the drying effect. This was especially true in the monsoon season, when the rainfall events were concentrated, and short-term rainstorms frequently happened [34].
Although the UDIs effect has been widely observed, urban areas were not necessarily drier than the surrounding rural areas. On the contrary, positive moisture differences, defined as urban moisture excess (UME), were temporarily observed, especially during clear and calm summer nights [55,56]. In Hong Kong, the UME effect was even frequently observed day and night, and the UME intensity was higher in the daytime than in the nighttime due to excessive daytime anthropogenic moisture release (e.g., heating–ventilation–air-conditioning systems, vehicles, industries, and human metabolism; [53]). In addition, how, and to what extent, the existence of water bodies can regulate urbanization-induced moisture changes necessitates further investigation [57]. Changes in urban humidity will in turn affect urban temperature and vice versa. For example, previous research has shown that the UDIs effect mitigated the impact of urbanization on observed climatic warming in China [58]. This was because the existence of UDIs reduced the urban–rural differences in cloud cover, which arose from increased anthropogenic aerosols in urban areas. The interaction between urban temperature and humidity was very important because it was closely related to human comfort and health in the hot and wet summer, especially under the background of global warming [47,59,60,61]. Future research should extend the scope of the urbanization impact on climate change to account for human health dimensions [11].
Undoubtedly, remote sensing was an important technique to investigate the spatiotemporal patterns and physical drivers of the UDIs effect. This was especially true with the subsurface and atmospheric exploration of urbanization-induced climate change [40]. However, it should be noted that remotely sensed observations were carried out over clear land areas with free cloud cover. The effect of urbanization on humidity under rainy and cloudy weather conditions thus necessitated further investigation. In addition, the 1 km high-resolution total-column precipitation water vapor data used in this study were derived from near-infrared bands. Therefore, only the daytime UDIIpwv was calculated here. Among the limited number of studies that examined the diurnal course of UDII, Moriwaki et al. [29] found that the daytime UDII (i.e., urban–rural differences in absolute humidity) was much stronger than the nighttime. Nevertheless, future research should pay more attention to the diurnal variations of UDII. Finally, remotely sensed data had trade-offs between spatiotemporal resolution and spectral resolution, and we currently cannot acquire a high-resolution atmospheric profile product (i.e., 1 km resolution or higher). With the rapid development of remote sensing techniques, we believe that this issue can be solved in the future.

5. Conclusions

This study made a first integrated assessment of total-column, near-surface, and atmospheric UDIs in the Beijing metropolitan region, using advanced remotely sensed observations and traditional station-based observations. Multiple humidity indicators were used, including total-column precipitation water vapor, relative humidity, vapor pressure, and absolute humidity, so as to reduce the uncertainties of using a single indicator. The specific research findings were that: (1) urban construction resulted in drier environments in urban areas than the surrounding rural areas; (2) both the total-column and near-surface UDIs existed, with the intensity of near-surface UDIs significantly correlated with the built-up areas; (3) the atmospheric UDIs were manifested in the near-surface layer, while urban wet islands were found above 950 hPa; (4) the intensity of UDIs was generally the strongest in summer and the weakest in winter; (5) urban–rural differences in relative humidity had the strongest connection with the built-up areas, and the differences were the largest in autumn. This study demonstrated that remote sensing was an important technique to study the UDIs effect and extended the scope of the UDIs study from the ground to the boundary layer. Future research should use numerical models to better understand the physical drivers of the urban–rural moisture contrast on and above the ground and focus on the impact of the interaction between urban temperature and humidity on human health.

Author Contributions

Conceptualization, Q.L. and Q.C.; methodology, Q.L. and L.H.; formal analysis, Q.C. and Q.L.; writing—original draft preparation, Q.C.; writing—review and editing, Q.L., Y.L. and F.W.; visualization, Q.C., Q.L. and L.H.; funding acquisition, Q.L. All authors have read and agreed to the published version of the manuscript.

Funding

This work was jointly supported by China Meteorological Administration through the Feng-Yun III Satellite Ground Application Project (Grants FY-3(03)-AS-12.09, FY-APP-2021.0408, and FY-APP-2021.0107) and the Chinese Academy of Sciences through the International Partnership Program (Grant 132C35KYSB20200007).

Institutional Review Board Statement

Not applicable.

Informed Consent Statement

Not applicable.

Data Availability Statement

Data is available upon request from the corresponding author.

Conflicts of Interest

The authors declare no conflict of interest.

Appendix A

Table A1. Description of the data used in this study.
DataProductResolutionYearWebsite
Land use/land coverMODIS MCD12Q1500 m2003–2018https://ladsweb.modaps.eosdis.nasa.gov
(accessed on 5 April 2020)
Total-column precipitation water vaporMODIS MOD05_L2
MODIS MYD05_L2
1 km2003–2019https://ladsweb.modaps.eosdis.nasa.gov
(accessed on 5 April 2020)
Atmospheric profileMODIS MOD07_L2
MODIS MYD07_L2
5 km2003–2019https://ladsweb.modaps.eosdis.nasa.gov
(accessed on 5 April 2020)
Station-based observation2008–2019http://data.cma.cn/
(accessed on 10 April 2020)
Figure A1. Overview of the methodology used in this study.
Remotesensing 14 00809 g0a1

References

  1. Kalnay, E.; Cai, M. Impact of urbanization and land-use change on climate. Nature 2003, 423, 528–531. [Google Scholar] [CrossRef] [PubMed]
  2. Oke, T.R. Towards better scientific communication in urban climate. Theor. Appl. Clim. 2006, 84, 179–190. [Google Scholar] [CrossRef]
  3. Georgescu, M.; Miguez-Macho, G.; Steyaert, L.T.; Weaver, C.P. Climatic effects of 30 years of landscape change over the Greater Phoenix, Arizona, region: 1. Surface energy budget changes. J. Geophys. Res. Atmos. 2019, 114, D05110. [Google Scholar]
  4. Georgescu, M.; Miguez-Macho, G.; Steyaert, L.T.; Weaver, C.P. Climatic effects of 30 years of landscape change over the Greater Phoenix, Arizona, region: 2. Dynamical and thermo-dynamical response. J. Geophys. Res. Atmos. 2019, 114, D05111. [Google Scholar] [CrossRef] [Green Version]
  5. Liu, X.; Hu, G.; Chen, Y.; Li, X.; Xu, X.; Li, S.; Pei, F.; Wang, S. High-resolution multi-temporal mapping of global urban land using Landsat images based on the Google Earth Engine Platform. Remote Sens. Environ. 2018, 209, 227–239. [Google Scholar] [CrossRef]
  6. Seto, K.C.; Golden, J.S.; Alberti, M.; Turner, B.L. Sustainability in an urbanizing planet. Proc. Natl Acad. Sci. USA 2017, 114, 8935–8938. [Google Scholar] [CrossRef] [Green Version]
  7. Mills, G. Cities as agents of global change. Int. J. Clim. 2007, 27, 1849–1857. [Google Scholar] [CrossRef]
  8. Grimm, N.B.; Faeth, S.H.; Golubiewski, N.E.; Redman, C.L.; Wu, J.; Bai, X.; Briggs, J.M. Global change and the ecology of cities. Science 2008, 319, 756–760. [Google Scholar] [CrossRef] [Green Version]
  9. Seto, K.C.; Shepherd, J.M. Global urban land-use trends and climate impacts. Curr. Opin. Environ. Sustain. 2009, 1, 89–95. [Google Scholar] [CrossRef]
  10. Bai, X.; Dawson, R.J.; Ürge-Vorsatz, D.; Delgado, G.C.; Barau, A.S.; Dhakal, S.; Dodman, D.; Leonardsen, L.; Masson-Delmotte, V.; Roberts, D.C.; et al. Six research priorities for cities and climate change. Nature 2018, 555, 23–25. [Google Scholar] [CrossRef]
  11. Cao, Q.; Liu, Y.; Georgescu, M.; Wu, J.G. Impacts of landscape changes on local and regional climate: A systematic review. Landsc. Ecol. 2020, 35, 1269–1290. [Google Scholar] [CrossRef]
  12. Brazel, A.; Gober, P.; Lee, S.; Grossman-Clarke, S.; Zehnder, J.; Hedquist, B.; Comparri, E. Determinants of changes in the regional urban heat island in metropolitan Phoenix (Arizona, USA) between 1990 and 2004. Clim. Res. 2007, 33, 171–182. [Google Scholar] [CrossRef] [Green Version]
  13. Buyantuyev, A.; Wu, J.G. Urban heat islands and landscape heterogeneity: Linking spatio-temporal variations in surface temperatures to land-cover and socioeconomic patterns. Landsc. Ecol. 2010, 25, 17–33. [Google Scholar] [CrossRef]
  14. Myint, S.W.; Wentz, E.A.; Brazel, A.J.; Quattrochi, D.A. The impact of distinct anthropogenic and vegetation features on urban warming. Landsc. Ecol. 2013, 28, 959–978. [Google Scholar] [CrossRef] [Green Version]
  15. Sharma, A.; Fernando, H.J.; Hamlet, A.F.; Hellmann, J.J.; Barlage, M.; Chen, F. Urban meteo-rological modeling using WRF: A sensitivity study. Int. J. Clim. 2017, 37, 1885–1900. [Google Scholar] [CrossRef]
  16. He, B. Potentials of meteorological characteristics and synoptic conditions to mitigate urban heat island effects. Urban Clim. 2018, 24, 26–33. [Google Scholar] [CrossRef]
  17. Shepherd, J.M.; Carter, M.; Manyin, M.; Messen, D.; Burian, S. The impact of urbanization on current and future coastal precipitation: A case study for Houston. Environ. Plan. B Plan. Des. 2010, 37, 284–304. [Google Scholar] [CrossRef] [Green Version]
  18. Niyogi, D.; Pyle, P.; Lei, M.; Arya, S.P.; Kishtawal, C.M.; Shepherd, M.; Chen, F.; Wolfe, B. Urban modification of thunderstorms: An observational storm climatology and model case study for the Indianapolis urban region. J. Appl. Meteorol. Clim. 2011, 50, 1129–1144. [Google Scholar] [CrossRef]
  19. Kusaka, H.; Nawata, K.; Suzuki-Parker, A.; Takane, Y.; Furuhashi, N. Mechanism of precipitation increase with urbanization in Tokyo as revealed by ensemble climate simulations. J. Appl. Meteorol. Clim. 2014, 53, 824–839. [Google Scholar] [CrossRef]
  20. Wang, J.; Feng, J.; Yan, Z. Impact of extensive urbanization on summertime rainfall in the Beijing region and the role of local precipitation recycling. J. Geophys. Res. Atmos. 2018, 123, 3323–3340. [Google Scholar] [CrossRef]
  21. Pielke, R.A.; Niyogi, D. The role of landscape processes within the climate system. In Landform-Structure, Evolution, Process Control: Proceedings of the International Symposium on Landform Organized by the Research Training Group 437; Otto, J.C., Dikau, R., Eds.; Springer: Berlin, Germany, 2010; pp. 67–85. [Google Scholar]
  22. Shaman, J.; Pitzer, V.E.; Viboud, C.; Grenfell, B.T.; Lipsitch, M. Absolute humidity and the seasonal onset of influenza in the continental United States. PLoS Biol. 2010, 8, e1000316. [Google Scholar] [CrossRef]
  23. Novick, K.A.; Ficklin, D.L.; Stoy, P.C.; Williams, C.A.; Bohrer, G.; Oishi, A.C.; Papuga, S.A.; Blanken, P.D.; Noormets, A.; Sulman, B.N.; et al. The increasing importance of atmospheric demand for ecosystem water and carbon fluxes. Nat. Clim. Chang. 2016, 6, 1023–1027. [Google Scholar] [CrossRef] [Green Version]
  24. Le Page, Y.L.; Morton, D.; Hartin, C.; Bond-Lamberty, B.; Pereira, J.M.C.; Hurtt, G.; Asrar, G. Synergy between land use and climate change increases future fire risk in Amazon forests. Earth Syst. Dyn. 2017, 8, 1237–1246. [Google Scholar] [CrossRef] [Green Version]
  25. Kratzer, P.A. The Climate of Cities; Friedrich Vieweg & Sohn: Berlin, Germany, 1956; p. 184. [Google Scholar]
  26. Hilberg, S.D. Diurnal temperature and moisture cycles. Summ. METROMEX 1978, 2, 25–42. [Google Scholar]
  27. Hage, K.D. Urban-rural humidity differences. J. Appl. Meteorol. Clim. 1975, 14, 1277–1283. [Google Scholar] [CrossRef]
  28. Sakakibara, Y. Features of water vapor pressure difference between urban and rural in Obuse, Nagano. Tenki 2001, 48, 151–158. [Google Scholar]
  29. Moriwaki, R.; Watanabe, K.; Morimoto, K. Urban dry island phenomenon and its impact on cloud base level. J. JSCE 2013, 1, 521–529. [Google Scholar] [CrossRef] [Green Version]
  30. Ackerman, B. Climatology of Chicago area urban-rural differences in humidity. J. Appl. Meteorol. Clim. 1987, 26, 427–430. [Google Scholar] [CrossRef]
  31. Lee, D.O. Urban-rural humidity differences in London. Int. J. Clim. 1991, 11, 577–582. [Google Scholar] [CrossRef]
  32. Cuadrat, J.M.; Vicente-Serrano, S.; Saz, M.A. Influence of different factors on relative air humidity in Zaragoza, Spain. Front. Earth Sci. 2015, 3, 10. [Google Scholar] [CrossRef] [Green Version]
  33. Lokoshchenko, M.A. Urban heat island and urban dry island in Moscow and their centennial changes. J. Appl. Meteorol. Clim. 2017, 56, 2729–2745. [Google Scholar] [CrossRef]
  34. Yang, P.; Ren, G.; Hou, W. Temporal-spatial patterns of relative humidity and the urban dryness island effect in Beijing City. J. Appl. Meteorol. Clim. 2017, 56, 2221–2237. [Google Scholar] [CrossRef]
  35. Hao, L.; Huang, X.; Qin, M.; Liu, Y.; Li, W.; Sun, G. Ecohydrological processes explain urban dry island effects in a wet region, southern China. Water Resour. Res. 2018, 54, 6757–6771. [Google Scholar] [CrossRef]
  36. Luo, M.; Lau, N.C. Urban expansion and drying climate in an urban agglomeration of east China. Geophys. Res. Lett 2019, 46, 6868–6877. [Google Scholar] [CrossRef]
  37. Lin, L.; Chan, T.O.; Ge, E.; Wang, X.; Zhao, Y.; Yang, Y.; Ning, G.; Zeng, Z.; Luo, M. Effects of urban land expansion on decreasing atmospheric moisture in Guangdong, South China. Urban Clim. 2020, 32, 100626. [Google Scholar] [CrossRef]
  38. Li, X.; Fan, W.; Wang, L.; Luo, M.; Yao, R.; Wang, S.; Wang, L. Effect of urban expansion on atmospheric humidity in Beijing-Tianjin-Hebei urban agglomeration. Sci. Total Environ. 2021, 759, 144305. [Google Scholar] [CrossRef]
  39. Oke, T.R.; Mills, G.; Christen, A.; Voogt, J.A. Urban Climates; Cambridge University Press: Cambridge, UK, 2017. [Google Scholar]
  40. Huang, F.; Zhan, W.; Wang, Z.H.; Voogt, J.; Hu, L.; Quan, J.; Liu, C.; Zhang, N.; Lai, J. Satellite identification of atmospheric-surface-subsurface urban heat islands under clear sky. Remote Sens. Environ. 2020, 250, 112039. [Google Scholar] [CrossRef]
  41. Cao, Q.; Luan, Q.; Liu, Y.; Wang, R. The effects of 2D and 3D building morphology on urban environments: A multi-scale analysis in the Beijing metropolitan region. Build. Environ. 2021, 192, 107635. [Google Scholar] [CrossRef]
  42. Borbas, E.E.; Menzel, P.; Gao, B. MODIS Atmosphere L2 Water Vapor Product. In NASA MODIS Adaptive Processing System; Goddard Space Flight Center: Greenbelt, MD, USA, 2017. [Google Scholar]
  43. Gao, B.; Kaufman, Y.J. Algorithm Technical Background Document: The MODIS Near-IR Water Vapor Algorithm, Product ID: MOD05—Total Precipitable Water. Sci. Publ. Rep. 1998, 25. [Google Scholar]
  44. Ren, Y.; Ren, G. A remote-sensing method of selecting reference stations for evaluating urbanization effect on surface air temperature trends. J. Clim. 2011, 24, 3179–3189. [Google Scholar] [CrossRef] [Green Version]
  45. Xu, W.; Li, Q.; Wang, X.; Yang, S.; Cao, L.; Feng, Y. Homogenization of Chinese daily surface air temperatures and analysis of trends in the extreme temperature indices. J. Geophys. Res. Atmos. 2013, 118, 9708–9720. [Google Scholar] [CrossRef]
  46. Borbas, E.E.; Seemann, S.; Li, Z.; Li, J.; Kern, A.; Menzel, W.P. MODIS Atmosphere Profiles Product (07_L2). In NASA MODIS Adaptive Processing System; Goddard Space Flight Center: Greenbelt, MD, USA, 2016. [Google Scholar]
  47. He, B.; Wang, J.; Liu, H.; Ulpiani, G. Localized synergies between heat waves and urban heat islands: Implications on human thermal comfort and urban heat management. Environ. Res. 2021, 193, 110584. [Google Scholar] [CrossRef] [PubMed]
  48. Bolton, D. The computation of equivalent potential temperature. Mon. Weather Rev. 1980, 108, 1046–1053. [Google Scholar] [CrossRef] [Green Version]
  49. Friedl, M.A.; Sulla-Menashe, D.; Tan, B.; Schneider, A.; Ramankutty, N.; Sibley, A.; Huang, X. MODIS Collection 5 global land cover: Algorithm refinements and characterization of new datasets. Remote Sens. Environ. 2010, 114, 168–182. [Google Scholar] [CrossRef]
  50. Meng, Q.; Zhang, L.; Sun, Z.; Meng, F.; Wang, L.; Sun, Y. Characterizing spatial and temporal trends of surface urban heat island effect in an urban main built-up area: A 12-year case study in Beijing, China. Remote Sens. Environ. 2018, 204, 826–837. [Google Scholar] [CrossRef]
  51. Shepherd, J.M. A review of current investigations of urban-induced rainfall and recommendations for the future. Earth Interact. 2005, 9, 1–27. [Google Scholar] [CrossRef] [Green Version]
  52. Wang, J.; Feng, J.; Yan, Z.; Hu, Y.; Jia, G. Nested high-resolution modeling of the impact of urbanization on regional climate in three vast urban agglomerations in China. J. Geophys. Res. Atmos. 2012, 117, D21103. [Google Scholar] [CrossRef] [Green Version]
  53. Wang, Z.; Song, J.; Chan, P.; Li, Y. The urban moisture island phenomenon and its mechanisms in a high-rise high-density city. Int. J. Clim. 2021, 41, E150–E170. [Google Scholar] [CrossRef]
  54. Liu, W.; You, H.; Dou, J. Urban-rural humidity and temperature differences in the Beijing area. Theor. Appl. Clim. 2009, 96, 201–207. [Google Scholar] [CrossRef]
  55. Richards, K. Urban and rural dewfall, surface moisture, and associated canopy-level air temperature and humidity measurements for Vancouver, Canada. Bound. Layer Meteorol. 2005, 114, 143–163. [Google Scholar] [CrossRef]
  56. Kuttler, W.; Weber, S.; Schonnefeld, J.; Hesselschwerdt, A. Urban/rural atmospheric water vapour pressure differences and urban moisture excess in Krefeld, Germany. Int. J. Clim. 2007, 27, 2005–2015. [Google Scholar] [CrossRef]
  57. Zhao, Z.; Sharifi, A.; Dong, X.; Shen, L.; He, B. Spatial variability and temporal heterogeneity of surface urban heat island patterns and the suitability of local climate zones for land surface temperature characterization. Remote Sens. 2021, 13, 4338. [Google Scholar] [CrossRef]
  58. Du, J.; Wang, K.; Jiang, S.; Cui, B.; Wang, J.; Zhao, C.; Li, J. Urban dry island effect mitigated urbanization effect on observed warming in China. J. Clim. 2019, 32, 5705–5723. [Google Scholar] [CrossRef]
  59. Mora, C.; Dousset, B.; Caldwell, I.R.; Powell, F.E.; Geronimo, R.C.; Bielecki, C.R.; Counsell, C.W.W.; Dietrich, B.S.; Johnston, E.T.; Louis, L.V.; et al. Global risk of deadly heat. Nat. Clim. Chang. 2017, 7, 501–506. [Google Scholar] [CrossRef]
  60. Russo, S.; Sillmann, J.; Sippel, S.; Barcikowska, M.J.; Ghisetti, C.; Smid, M.; O’Neill, B. Half a degree and rapid socioeconomic development matter for heatwave risk. Nat. Commun. 2019, 10, 136. [Google Scholar] [CrossRef] [PubMed]
  61. Cao, Q.; Yu, D.; Georgescu, M.; Wu, J.G.; Wang, W. Impacts of future urban expansion on summer climate and heat-related human health in eastern China. Environ. Int. 2018, 112, 134–146. [Google Scholar] [CrossRef]
Figure 1. Location and administrative division of the Beijing municipality with topography overlaid (a), and urban land expansion in Beijing from 2003 to 2019 (b). The blue contours outline the central urban districts including Dongcheng, Xicheng, Chaoyang, Haidian, Fengtai, and Shijingshan. The green circles denote the weather stations in urban and rural areas. The shaded areas in (b) illustrated the rural scope.
Remotesensing 14 00809 g001
Figure 2. The spatial pattern of annual accumulated total-column precipitation water vapor (unit: mm) in the plain area of Beijing during 2003–2019.
Remotesensing 14 00809 g002
Figure 3. The spatial pattern of urban–rural differences in the total-column precipitation water vapor (UDIIpwv; unit: mm) in the plain area of Beijing during 2003–2019.
Remotesensing 14 00809 g003
Figure 4. Time series of annual UDIIpwv averaged across the (a) urban area and (b) central urban districts of Beijing. The shaded area represents one standard deviation above and below the mean.
Remotesensing 14 00809 g004
Figure 5. Annual, spring, summer, autumn, and winter UDIIpwv across the (a) urban area and (b) central urban districts of Beijing based on the 17-year average (i.e., 2003–2019).
Remotesensing 14 00809 g005
Figure 6. (a) Observed time series of urban–rural differences in relative humidity (ΔRH; %), water vapor pressure (ΔVP; hPa), and absolute humidity (ΔAH; g/m3); (b) temporal changes of the built-up areas in Beijing during 2008–2019.
Remotesensing 14 00809 g006
Figure 7. The relationship between observed urban dry islands intensity and the built-up areas in Beijing for the period of 2008–2019: (a) ΔRH versus built-up areas, (b) ΔVP versus built-up areas, and (c) ΔAH versus built-up areas.
Remotesensing 14 00809 g007
Figure 8. Observed time series of urban–rural differences in relative humidity (ΔRH; a), vapor pressure (ΔVP; b), and absolute humidity (ΔAH; c) in spring, summer, autumn, and winter during the period of 2008–2019 in Beijing.
Remotesensing 14 00809 g008
Figure 9. The spatial pattern of urban–rural differences in absolute humidity at 1000, 950, 920, 850, 780, and 700 hPa in the even years between 2003 and 2019 (unit: g/m3).
Remotesensing 14 00809 g009
Publisher’s Note: MDPI stays neutral with regard to jurisdictional claims in published maps and institutional affiliations.

