Abstract
Industrial heat sources have made a great contribution to Chinese economic development. However, it has also been found that emissions from industrial heat sources are the main contribution to regional air pollution. Therefore, the detection of industrial heat sources and the expression of related information is becoming important. In this paper, the detection of industrial heat sources was used to express industrial information, thus that the accuracy of the detection of industrial thermal anomalies could be improved and the problems of noise and missing parameters addressed. A model for expressing industrial information based on object-oriented industrial heat sources and using multi-source thermal anomaly data in China was, therefore, proposed. It was a new real-time, objective, and real way to describe the production operation status of industrial heat sources on a large-scale area. First, 4340 working industrial heat sources in mainland China were detected by applying an adaptive k-means algorithm to ACF (NPP VIIRS 375-m active fire/hotspot data) data from the period 19 January 2012 to 31 December 2020. Secondly, several features of working industrial heat sources were extracted from NPP VIIRS 375-m active fire/hotspot data (ACF), VIIRS Nightfire data (VNF), and the Fires product based on Landsat-8 AIRCAS (L8F) data. Areas containing working industrial heat sources were then identified based on these different types of fire data. Light, land-surface temperature, and CO2 and N2O emissions data related to the working industrial heat sources were also extracted. The results show that feature parameters extracted from the multi-source thermal anomaly data mostly have a good positive correlation with the other parameters.
1. Introduction
The term ‘industrial heat source’ refers to factories and plants that are engaged in the combustion of fossil fuels and that are sources of heat emissions. These include factories where smelting and rolling of non-ferrous metals are carried out, cement plants, oil refineries and exploration fields, and chemical processing plants [1,2,3]. Facilities such as these have made a great contribution to the growth of the Chinese economy in the past two decades. However, research based on satellite remote sensing data found that industrial heat sources were the main cause of regional air pollution and man-made CO2 emissions [4,5]. It is, therefore, necessary to have near real-time monitoring data on the spatial layout of Chinese industrial heat sources and their heat emissions to support environmental monitoring and decision making.
Traditional bottom-up survey methods, such as those based on statistics and field investigations by the public, are time-consuming, strongly subjective, and incomplete at some times, especially in remote areas. It is difficult to meet the needs of near real-time monitoring of large-scale industrial heat sources in this way [2,6]. Recent research shows that, using long-term series of remote sensing thermal anomaly products, industrial heat sources can be identified and monitored. For example, NPP VIIRS nocturnal thermal anomaly data were applied to the detection of oil and gas fields [7]. Zhou (2018) used the Landsat-8 thermal infrared monitoring sensor to detect industrial activity [8]. Liu et al. (2018) [2] identified industrial heat sources across the globe based on their “space–time–temperature” characteristics in long-term VIIRS Nightfire (VNF) data. Ma et al. (2018) used active fire point data (ACF), which have a stronger response to hotspots with small areas, and adopted the improved adaptive k-means algorithm based on vector data to identify and analyze industrial heat sources in China and India from 2012 to 2017 at a fine-scale [1,9]. It can be a partial solution to Liu’s (2018) indivisibility problem, where multiple industrial heat sources cannot be divided due to the adjacent or similar on their geographical distributions. Lai [10] verified the identification of industrial heat sources in China by applying the DBSCAN clustering method and the logistic regression clustering analysis method to ACF data. The detection accuracy was found to be up to 97.3%.
Having an accurate and multivariate expression for industrial heat source information is important to allow these sources to be identified and monitored. However, there is little recent research on the expression of industrial heat source information over large regions. At present, most industrial heat source information is obtained from bottom-up surveys such as statistical yearbooks [11,12,13]. However, the list acquisition method cannot be applied to large regions as it is time-consuming and strongly subjective [14]. Wooster et al. (2012) [15] found that the thermal radiation power of enterprises was linearly related to the average volume of coal and flue gas emissions. Some researchers and scholars have tried to express information related to factories and plants based on thermal anomaly data of small areas. Sun et al. [14] detected industrial thermal anomalies using ACF and land-cover data in Hebei province. They found that the fire radiative power (FRP) of thermal anomalies can be used to characterize industrial energy consumption and indirectly reflects industrial production scales and pollution emission levels. Qiu (2020) [16] identified the thermal anomalies produced by two cement plants based on the plants’ geographical locations and ACF data. It was concluded that the FRP could be used to estimate the emissions of principal pollutants such as nitrogen oxide (NO2) and sulfur dioxide (SO2). Gu (2020) [17] demonstrated that industrial thermal anomalies in Landsat 8 data acquired in different seasons could also be used for local environment analysis. However, those methods cannot be applied to large-scale regions because of two main weaknesses. First, the accuracy of the detection of industrial thermal anomalies is influenced by the accuracy of the land-cover data. Second, there is no satisfactory method of dealing with the noise and missing parameters related to industrial thermal anomalies.
In this study, industrial heat source detection was introduced on the expression of industrial information to improve the accuracy of the detection of industrial thermal anomalies. According to position-invariance, temporal consistency, and temperature similarity of hot spots on one static-and-persistent industrial heat source, an object-oriented concept based on one industrial heat source was introduced to deal with the problems of noise and missing parameters associated with industrial thermal anomalies. A model for expressing industrial information based on object-oriented industrial heat sources using multi-thermal anomaly data for China was then proposed. First, working industrial heat sources in mainland China were detected by applying an adaptive k-means algorithm to ACF data covering the period 19 January 2012 to 31 December 2020. Secondly, several features associated with working industrial heat sources were extracted from ACF data, VIIRS Nightfire data (VNF), and L8F. Thirdly, the locations of working industrial heat sources were identified by Light, land-surface temperature, and CO2, and N2O emission information associated with working industrial heat sources were also extracted and are discussed in the paper. The model can be a new real-time, objective, and real way to describe the production operation status of industrial heat sources in large-scale areas.
The paper is organized as follows. Section 2 describes the study area, data sources, main data preprocessing steps, and methodology. Section 3 describes the experimental results obtained using the multi-source data and discusses and analyses the characteristics of the different features associated with heavy industrial heat sources in mainland China. Then, the discussion was shown in Section 4. Conclusions and recommendations for future research are given in Section 5.
2. Materials and Methods
2.1. Study Area
Mainland China is located in East Asia and on the west coast of the Pacific Ocean. China’s land border is 22,800 km long, and the country covers approximately 9.6 million km2. Since economic reforms began in 1978, China’s economy has grown to become the world’s second-largest, and China is now the world’s largest industrial country (Figure 1). However, it has been reported that China’s energy consumption almost doubled between 1995 and 2015 to 2976 Mtoe from 1045 million tons of oil equivalent (Mtoe) [6]. In response to this situation, China has made considerable efforts to address the resulting problems. For example, the “Air Pollution Prevention Plan” was announced by the State Council on 12 September 2013 to improve the quality of the environment [18], and supply-side structural reforms were implemented that led to thousands of polluting factories being shut down [19].
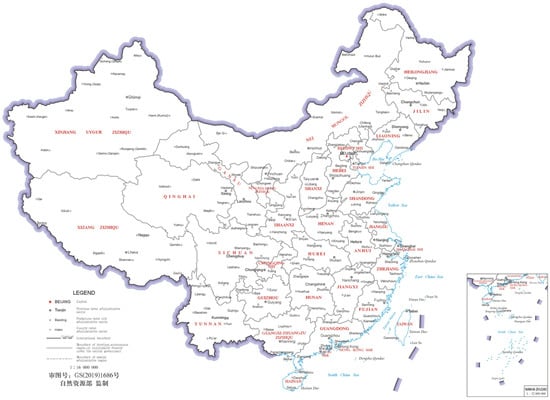
Figure 1.
The study region of China. The projection system is CGCS2000_3_Degree_GK_CM_108EEC.
2.2. Data Sources and Preprocessing
2.2.1. Thermal Anomaly (Fire/Hotspot) Data and Preprocessing
Thermal anomaly (fire/hotspot) data concern those points where the temperature is significantly higher than that of the surroundings. These points are associated with forest and grassland fires, agricultural straw burning, active volcanic eruptions, gas combustion in open-cast coal mines and oil fields, high-temperature sources in iron and steel or cement plants, etc. [2]. Since 1981, Dozier [20] has detected surface fires and heat sources using mid-infrared sensors and by applying Wien’s displacement law. Recently, many thermal anomaly (fire/hotspot) data detection models were developed, but few sustainable and stable products have been launched publicly [9]. In this study, 3 publicly available thermal anomaly (fire/hotspot) data sets were used: NPP VIIRS 375-m active fire/hotspot data (ACF), VIIRS Nightfire data (VNF), and the Fires product based on Landsat-8 AIRCAS (L8F) data.
ACF, the NASA Land-SIPS VIIRS 375-m active fire product, is based on 375-m (I-band) data reprocessed by NASA’s Land-SIPS [21]. Several modified versions of this product based on the MOD14/MYD14 algorithm have been produced [22]. Since 19 January 2012, the newest ACF data set was updated daily and can be freely obtained from the Fire Information for Resource Management System (FIRMS) [23]. A total of 4,837,801 ACF data points covering mainland China from the period 19 January 2012 to 31 December 2020 were obtained. The number of ACF data points (total 458,494) per 5 km × 5 km grid cell in 2020 is shown in Figure 2a.
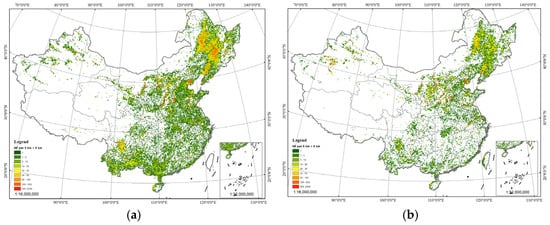
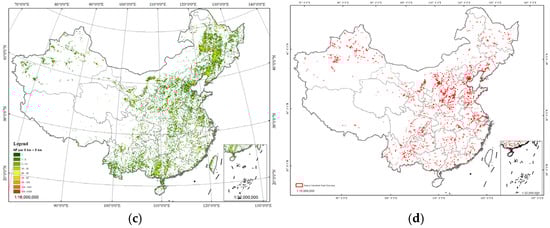
Figure 2.
The spatial distribution of 2787 working industrial heat sources and number of thermal anomalies (fire/hotspot) (NF) per 5 km × 5 km grid cell in 2020. (a) NF per 5 km × 5 km cell of ACF data in 2020, (b) NF per 5 km × 5 km cell of VNF data in 2020, and (c) NF per 5 km × 5 km cell of L8F data in 2020. (d) The spatial distribution of 2787 working industrial heat sources in 2020.
VNF (VIIRS Nightfire) data, which have a spatial resolution of 750 m, were obtained from the SNPP VIIRS multispectral bands, including the day/night band (DNB), the near-infrared bands (M7 and M8), the short-wave infrared band (M10), and the mid-infrared bands (M12 and M13). These products have been publicly available from the Earth Observation Group (EOG) since 1 March 2012 [24]. In this study, 2,393,406 thermal anomalies were detected in VNF data of mainland China covering the period 1 March 2012 to 31 December 2020. The number of VNF data points (total 249,437) per 5 km × 5 km grid in 2020 is shown in Figure 2b.
L8F, the Landsat-8 thermal anomaly product is based on Landsat-8 data and the normalized burning ratio short-wave (NBRS) algorithm [25]. The data for the east Asia area can be obtained from the Aerospace Information Research Institute of the Chinese Academy of Sciences [26]. In this study, 893,106 thermal anomalies were detected in L8F data of mainland China covering the period 1 January 2014 to 31 December 2020. The number of L8F data points (total 82,061) per 5 km × 5 km grid in 2020 is shown in Figure 2c.
2.2.2. Industrial Heat Sources Data and Preprocessing
An adaptive k-means algorithm based on DACF and Flint light data was used to detect working industrial heat sources between 2012 and 2020 (Ma 2018, 2019). Using this algorithm, 4392 working industrial heat sources present in mainland China between 2012 and 2020 were detected based on 4,837,801 ACF data points covering the period 19 January 2012 to 31 December 2020 and annual Flint light data for 2012 to 2020. Finally, 4340 industrial heat sources were identified by manual verification of high-resolution Google Earth images as well as through field investigations. The number of working industrial heat sources in 2020 was 2787. The spatial distribution of these heat sources is shown in Figure 2d.
2.2.3. Other Data and Preprocessing
In order to extract more information related to heavy industrial heat sources, other data were used in this study, including Flint light data, land-surface temperature (LST) data, information about CO2 emissions produced by the combustion of fossil fuels as well as emissions of the greenhouse gas N2O.
The use of lighting is necessary for most heavy industrial production. Therefore, light data were also considered in this paper. Flint light data were derived from NPP VIIRS night-time light (NTL) data. As a result of statistical cleaning and average noise reduction preprocessing, these data are free, or at least less affected by, the effects of background noise, volcanoes, and fires. The global annual data from the years 2012 to 2020 can be obtained from AIRCAS [27]. The annual data for mainland China were clipped according to the administrative boundaries of mainland China. The spatial distribution of DN values in 2020 Flint light data of mainland China is shown in Figure 3a.
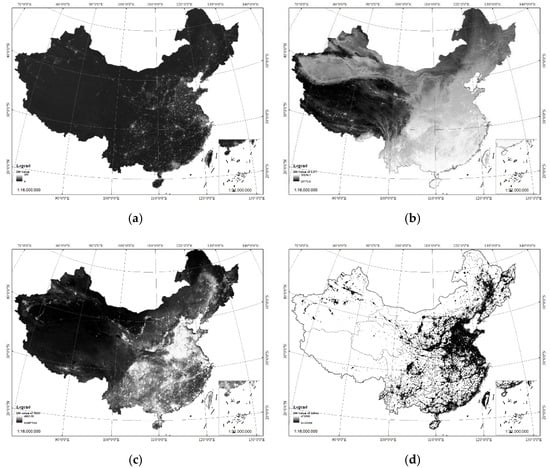
Figure 3.
The spatial distribution of the DN values of Flint light, TRIMS LST, and N2O, and CO2 emissions data for mainland China. (a) The DN values of Flint light data for 2020, (b) the DN values of TRIMS LST data for 2020 stretched by histogram equalization, (c) the DN values of EDGARv6.0 data for 2018 stretched by histogram equalization, and (d) the DN values of ODIAC2020b data for 2019 stretched by histogram equalization.
In the case of heavy industry, the LST of working industrial heat sources is usually higher than the background LST. This includes the flaring of petroleum gas in oil fields and the burning of fossil fuels in factories (e.g., in cement plants and steelworks) [9]. Thermal and Reanalysis Integrating Moderate-resolution Spatial-seamless LST (TRIMS LST) data are produced by a satellite thermal infrared remote sensing reanalysis data integration method based on a new land-surface temperature-time decomposition model [3]. TRIMS LST data is a high-quality all-weather surface-temperature data set that is combined by Aqua MODIS LST products and GLDAS data, and the auxiliary data included the vegetation index. Daily TRIMS LST data from the period 1 January 2012 to 31 December 2020 can be obtained from the National Qinghai-Tibet Plateau Scientific Data Center. The annual TRIMS LST data for mainland China represents the mean of 365 days of night-time TRIMS LST data; the spatial distribution of TRIMS LST values for 2020 that have been stretched using histogram equalization is shown in Figure 3b. Land surface temperatures (in Kelvin) can be obtained from these values using the formula 0.01 × TRIMS LST.
Emissions of the greenhouse gas N2O produced by the burning of fossil fuels is one of the main types of factory emissions [28]. The Emissions Database for Global Atmospheric Research (EDGAR) provides independent emission estimates based on international statistics and a consistent methodology used by the Intergovernmental Panel on Climate Change (IPCC) [29]. EDGARv6.0 N2O emissions data with a resolution of 0.1° × 0.1° was used in this study. The global annual EDGARv6.0 data from the period 2012 to 2018 were downloaded from the European Commission website [30]. The annual EDGARv6.0 data for mainland China were then clipped to match the administrative boundaries of mainland China. The spatial distribution of DN values in the 2018 data after stretching by histogram equalization is shown in Figure 3c.
CO2 produced by the burning of fossil fuels is another important type of gas emitted by factories, particularly industrial factories and mines. The Open-Data Inventory for Anthropogenic Carbon dioxide (ODIAC), a high-spatial-resolution global data product that gives information about CO2 emissions resulting from fossil fuel combustion, was also used in this study. ODIAC monthly global fossil-fuel CO2 emissions data for 2012 to 2019 (ODIAC2020b), which have a resolution of 1 km × 1 km, were downloaded from the Center for Global Environmental Research, National Institute for Environmental Studies (NIES). Monthly mainland China ODIAC2020b data were adjusted according to the administrative boundaries of mainland China. The annual data represent the mean of 12 months of ODIAC2020b data. The spatial distribution of the DN values of 2019 ODIAC2020b data for mainland China after stretching by histogram equalization is shown in Figure 3d.
2.3. A Model for the Expression of Industrial Information Based on Object-Oriented Industrial Heat Sources Detected Using Multi-Source Thermal Anomaly Data in Mainland China
A total of 4340 industrial heat sources were detected in this study. In this section, the extraction of information related to these heat sources and the expression of this information will be described. In order to acquire more information about the heat sources, thermal anomaly data from multiple sources together with the other types of data described above were used. The main steps in the processing of the thermal and other types of data are shown in Figure 4. Feature extraction from the thermal anomaly data and other information about the industrial heat sources was the focus of this data processing.
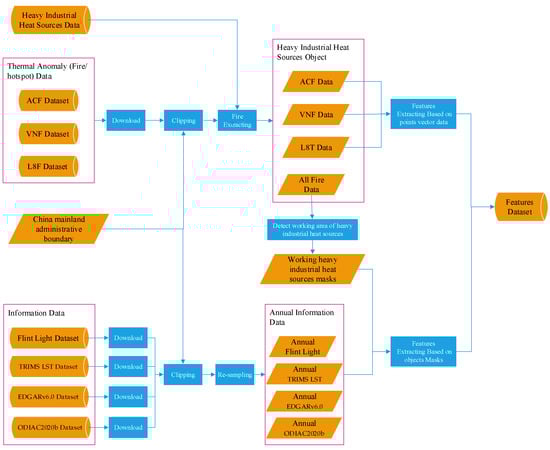
Figure 4.
The architecture of the model for expressing industrial information based on object-oriented industrial heat sources detected using multi-source thermal anomaly data of mainland China.
2.3.1. Feature Extraction Based on Thermal Anomaly Data
The thermal anomaly data, which consisted of long time series of ACF, VNF, and L8F data, were all vector point data. The steps used for extracting the features from these different types of data were similar except that different feature descriptors were used. The main steps in the feature extraction were as follows.
Step 1: The thermal anomalies related to industrial heat sources were extracted from the ACF/VNF/L8F data based on the regional distributions of industrial heat sources.
Step 2: Abnormal thermal anomalies associated with different industrial heat sources were identified as those anomalies with DN values that deviated from the mean by more than three standard deviations.
Step 3: Parameters of abnormal thermal anomalies for different industrial heat sources were revised using B-spline interpolation based on the temporal consistency of long time-series of data for the anomalies related to individual industrial heat sources. Figure 5 shows one parameter revision sample on Taiyuan Iron and Steel Comply Ltd. (TISCO).
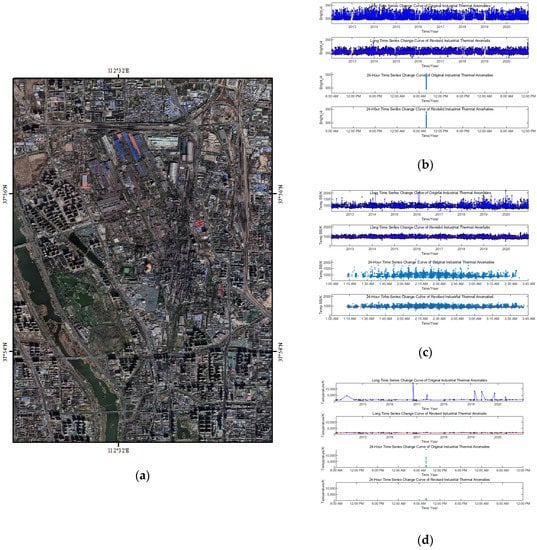
Figure 5.
Google Earth image of the Taiyuan Iron and Steel Comply Ltd. (TISCO) together with details of parameter revisions. (a) Google Earth image of TISCO, (b) revised bright_ti4 values of all the ACF at the TISCO site, (c) revised Temp_BB values of all the VNF at the TISCO site, and (d) revised temperatures of all the L8F in TISCO. bright_ti4, Temp_BB, and temperatures were all attribute information of ACF, VNF, and L8F.
Step 4: Features associated with industrial heat sources were extracted. These definitions of features included the following:
where Oi (I = {1, 2, 3, …, K}) represents the ith industrial heat source. K was set to 4340 in this study. T is the time period t ∈ {2012, 2013, 2014, …, 2020} for ACF and VNF data; t ∈ {2014, 2015, 2016, …, 2020} for L8F data. Pj is the jth industrial thermal anomaly associated with the ith industrial heat source, fp represents a feature of pj, and is the sum of for the ith industrial heat source and the tth year.
Eight features were investigated. These included the total number of industrial thermal anomalies in the ACF data that were associated with working industrial heat sources (NACFH), the total Bright_ti4 value of all the industrial thermal anomalies in the ACF data that were associated with working industrial heat sources (ACFT), and the total FRP (Fire Radiative Power) of these industrial thermal anomalies (ACFFRP); also included the total number of industrial thermal anomalies in the VNF data that were associated with working industrial heat sources (NVNFH), the total Temp_BB ((the IR-source temperature assuming a blackbody source) of all the industrial thermal anomalies in the VNF data that were associated with working industrial heat sources (VNFBB), and the sum of the RH values (IR-source radiant heat values) of these industrial thermal anomalies (VNFRH). The final two features were the total number of industrial thermal anomalies in the L8F data that were associated with working industrial heat sources (NL8FH) and the sum of the temperatures of these industrial thermal anomalies).
2.3.2. Feature Extraction Based on the Other Data
The other data used in this study, which comprised the Flint light data, TRIMS LST data, EDGARv6.0 N2O emission data, and ODIAC2020b CO2 emission data, were all raster data. These data were processed in a similar way to the thermal anomaly data, except that different feature descriptors were used.
Step 1: based on the deviations in their positions compared to those in the different types of thermal anomaly data, all types of industrial thermal anomalies were united to conform areas of industrial heat sources.
Step 2: the industrial thermal anomaly data were rasterized to raster masks. Frequency raster masks for the different types of industrial thermal anomaly data for the different types of the other data were then produced. The DN values of the frequency raster masks represented the number of industrial thermal anomalies located within each pixel.
Step 3: industrial heat source features were extracted from the data. The extracted features included the following:
where cj represents the jth pixel/cell. and are the DN value of the jth pixel/cell in the original data and the frequency raster mask data, respectively. and t have the same meanings as in Equation (1). is the total DN value of the ith industrial heat source in the different types of data for year t, and is the sum of the frequencies for the ith industrial heat source in the different types of data for year t.
Eight features were extracted at this stage, including and for the Flint light data, TRIMS LST data, EDGARv6.0 data, and ODIAC2020b data.
2.4. Evaluation of the Correlation between Parameters
In order to evaluate the degree of correlation between the different feature parameters, Pearson’s linear correlation coefficient was used. This was calculated as
where Si and Sj represent the e ith and jth feature parameter sets for all the industrial heat sources in the target region. Si is an M × Ni matrix and can be written as
.
M is the number of industrial heat sources in the target region, and Ni stands for the number of dimensions of the ith feature parameter. As the feature parameters were all annual data, Ni also denotes the years that the different parameters were associated with (2012, 2013, 2014, …, 2020). Because these years were different for the original abnormal thermal anomalies and the other types of data, the subsets and were used to calculate the Pearson’s linear correlation coefficient between the ith and jth feature parameters. There was some overlap between the years for Si and Sj, for example, the years 2014 to 2018 were common to both subsets in the case of the L8FT feature and the F1 feature in the EDGARv6.0 data.
3. Results
3.1. Analysis of Features Associated with Industrial Thermal Anomalies at the National Scale
As mentioned in Section 2.3, two categories of features were used in this study. Eight features were used in the statistical feature extraction: NACFH, NVCFH, NL8H, ACFT, ACFFRP, VNFBB, VNFRH, and L8FH. Four information features were extracted from the other data, including each of F1 feature from the Flint light data, TRIMS LST data, EDGARv6.0 data and ODIAC2020b data.
Table 1 shows the results of a correlation analysis between 12 different features associated with the complete set of industrial heat sources at the national scale. Some conclusions can be drawn from these results.

Table 1.
Correlation between different features of all the industrial heat sources at the national scale.
(1). Based on the original data, Pearson’s linear correlation coefficients between the different features were all high, except for ACFT. The coefficient between NACFH and ACFFRP found using the ACF data was 1.0, which denotes a perfect correlation. Based on the VNF data, the correlations between NVNFH, VNFBB, and VNFRH all had high positive values. An almost perfect positive correlation (0.99) was also found between NL8FH and L8FT in the case of the L8F data, whereas, based on the original ACF data, the linear correlations between ACFT and NACFH/ACFFRP were all weak (0.5). This means that the total Bright_ti4 value for all the ACF industrial thermal anomalies cannot represent the production status of industrial heat sources.
(2). Features of the total industrial thermal anomalies associated with different industrial heat sources (NACFH, NVCFH and NL8H) were well correlated with the other feature parameters except for F1_EDGARv6.0, ACFT, and F1_ODIAC2020b. The value of Pearson’s linear correlation coefficient between NACFH and NVCFH had the highest value (0.91): as shown in Figure 6a, the values of NVCFH were 0.62 times those of NACFH, which is reasonable given that NVCFH was extracted from VNF data, whereas NACFH was extracted from ACF data that contained both daytime and night-time thermal anomalies. The NL8FH values were found to be 0.09 times those of NACFN (see Figure 6b) because of the different satellite revisit periods and the differences in swath width and spatial resolution between the NPP and Landsat-8 satellites. The correlation coefficient between ACFFRP and NVCFH was also high at 0.9.
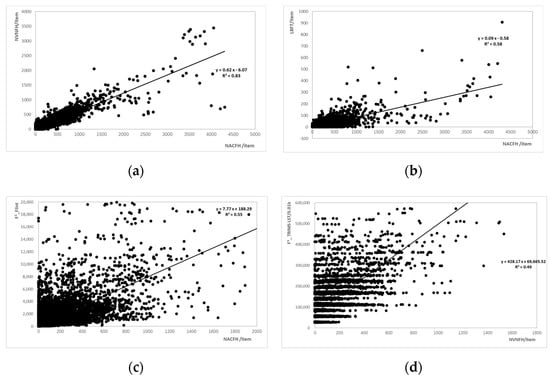
Figure 6.
Linear regression between the different features for all the detected industrial heat sources in mainland China: (a) linear regression between NACFH and NVNFH, (b) linear regression between NACFH and NL8FH, (c) linear regression between NACFH and F1 Flint, and (d) linear regression between NVNFH and F1 TRIMS LST.
(3). Except for ACFT, the temperature features ACFT, VNFBB, L8FT, and F1 TRIMS LST were all positively correlated with each other. The linear correlation between the temperature features and the other parameters was also good, except for F1_EDGARv6.0, ACFT, and F1_ODIAC2020b. A plot of F1 TRIMS LST against NVNFH produced a stratified distribution (see Figure 6d). This result could be used to help classify different types of industrial heat sources.
(4). The estimates of the fire radiative power of industrial heat sources as given by ACFFRP, VNFRH, and the F1_Flint night-light parameter were closely related to the other parameters except for ACFT, F1_ EDGARv6.0, and F1_ ODIAC2020b. As shown in Table 1 and Figure 6c, these three parameters can be used to characterize industrial heat sources.
(5). F1_ EDGARv6.0, ACFT, and F1_ ODIAC2020b, which describe the emissions of N2O and CO2, all had relatively low (compared with other features) correlations with other parameters. The values of the correlation coefficients between F1_ EDGARv6.0 and the other parameters ranged from 0.31 to 0.52, and for F1_ ODIAC2020b, they ranged from 0.14 to 0.52. This may have been related to the spatial resolution of the original data - 0.1° × 0.1° and 1 km × 1 km for F1_ EDGARv6.0 and F1_ ODIAC2020b, respectively. In addition, we cannot exclude the possibility that the N2O and CO2 emissions from the industrial heat sources detected in this paper were not the main sources of these emissions at certain scales. To draw more accurate conclusions about this, more experimental data are needed.
3.2. Analysis of Features at the Regional Scale
In order to analyze how the parameter distributions varied between regions, the Beijing-Tianjin-Hebei Urban Agglomeration (BTH), and the Yangtze River Delta region (YRD) were selected for further analysis (see Figure 7). These constitute two of the most economically important regions in China. As the historical backgrounds, geographic environments, and locations of these two regions are different, the development models followed by industrial heat sources in these two regions are also different. Table 2 and Figure 7 show the results of a correlation analysis between different features associated with all the detected industrial heat sources in these two regions.
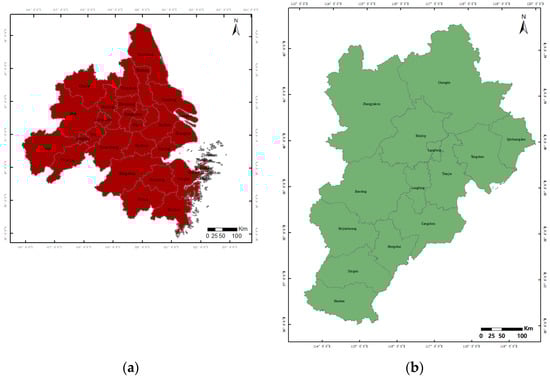
Figure 7.
The two different regions selected for the regional analysis: (a) the Yangtze River Delta region and (b) the Beijing-Tianjin-Hebei Urban Agglomeration.
Table 2.
Pearson’s linear correlation coefficient for the relationships between different features of all the industrial heat sources in the Beijing-Tianjin-Hebei Urban Agglomeration (BTH) and the Yangtze River Delta region (YRD).
(1). The Pearson’s linear correlation coefficients between all the features derived from the original ACF and L8F data were high for both regions. However, the values of the correlation coefficients between NVNFH, VNFBB, and VNFRH, derived from the VNF data, were very different in the two regions. The coefficients between NVNFH, VNFBB, and VNFRH were lower in the BTH than in the YRD, almost as low as for the national scale.
(2). In both regions NACFH, NVCFH, and NL8H had a fairly good positive correlation with the other feature parameters, except F1_ EDGARv6.0 and F1_ ODIAC2020b (see Table 2). However, the situation in the two regions was different in some cases. The values of Pearson’s linear correlation coefficient between the three statistical characteristics and the five other parameters (NACFH, NVCFH, ACFT, ACFFRP, and F1_ Flint) were higher in the BTH than in the YRD. As shown in Figure 8a, the slope of the linear regression between NVCFH and NACFH was higher in the BTH (0.67) than in the YRD (0.47). The cloudy conditions in the YRD may have contributed to these results. However, the slope of the regression between NL8FH/ F1_ Flint and NACFH in the YRD was slightly higher than the slope in the BTH (Figure 8b,c), and the coefficients between the three statistical characteristics and VNFBB/VNFRH/F1 TRIMS LST in the BTH were lower than in the YRD.
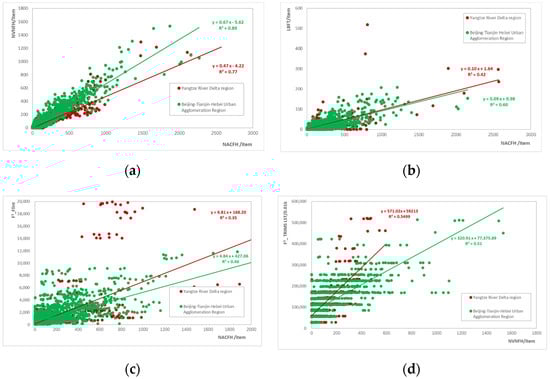
Figure 8.
Linear regressions between different features for the complete set of detected industrial heat sources in the Beijing-Tianjin-Hebei Urban Agglomeration (BTH) and the Yangtze River Delta region (YRD): (a) linear regression between the parameters NACFH and NVNFH, (b) linear regression between the parameters NACFH and NL8FH, (c) linear regression between the parameters NACFH and F1 Flint and (d) linear regression between the parameters NVNFH and F1 TRIMS LST.
(3). The temperature features ACFT, VNFBB, L8FT, and F1 TRIMS LST were all positively correlated, and a plot of F1 TRIMS LST against NVNFH again produced a stratified distribution (see Figure 8d).
(4). The estimates of the fire radiative power of different industrial heat sources (including ACFFRP, VNFRH, and the F1_ Flint night-light parameters) and the emission parameters for N2O and CO2 produced similar results as those for mainland China as a whole.
4. Discussion
4.1. Comparison with Existing Industrial Heat Sources Derived from VNF
A global industrial heat source has been obtained according to temperature and spatial persistence in a time-series of VNF data (Liu et al., 2018) [2]. Here, Liu’s result was selected for comparison with industrial heat sources detected by our method. In Liu’s inventory, 2398 objects of industrial heat sources (as shown in Figure 9) were detected on China’s mainland. A total of 4340 objects were founded by our method. The num of objects detected (4340) by our results was 81% higher than Liu’s results (2398).
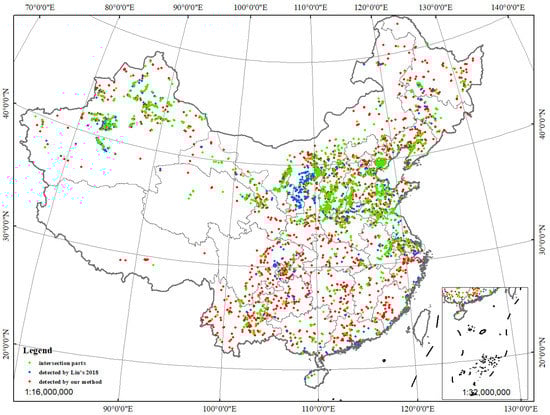
Figure 9.
Comparison of our industrial heat sources results with results detected by Liu et al. (2018).
We have conducted two-sites-specific validations on BTH and YRD. Industrial heat source objects detected by Liu’s and our methods on the above two-sites were all overlaid on the high-resolution Google Earth images. Then, they were all verified with object-by-object visual interpretation. The validation in BTH showed that 250 of 255 (98.04%) industrial heat source objects by Liu’s result, and 461 of 474 (97.04%) industrial heat source objects by our method, were correctly identified. While, 140 of 157 (94.42%) industrial heat source objects by Liu’s result, and 220 of 233 (97.04%) industrial heat source objects by our method, were correctly identified on YRD. The average accuracy (96.32%, 681/707) by our results was higher than Liu’s (94.66%, 390/412). It showed that detection objects by our methods obtained much more heat source objects and kept good recognition accuracy compared with Liu’s method.
The difference in spatial distribution is shown in Figure 9. A total of 2244 objects (marked with green points in Figure 9) in our results (corresponding to 1773 objects in Liu’s inventory) were spatially matched, with 2096 objects (marked with red points in Figure 9) only detected by our method and 625 objects (marked with blue points in Figure 9) only detected in Liu’s inventory. Those 2096 objects only detected by our method were distributed throughout the whole mainland. Our results found much more industrial heat sources compared with Liu’s results in the south of China. It may be because there are many cloudy and rainy weather conditions in the south of China to influence detection of VNF.
Most of the omissions of our results (625 objects marked with blue points in Figure 9) are located in the North-West of Shaanxi Province and south of the Inner Mongolia area (shown in Figure 10). The mean area of the 625 objects missing in our results was 1.51 km2, comparing 0.35 km2 with the mean area on 2096 objects only detected by our method. Some of the 625 objects missing in our results were gas-flaring sites (shown in Figure 10e) with only a small site. Some were not industrial heat sources (shown in Figure 10c). Some cannot be recognized as industrial heat sources based on high-resolution images (shown in Figure 10d).
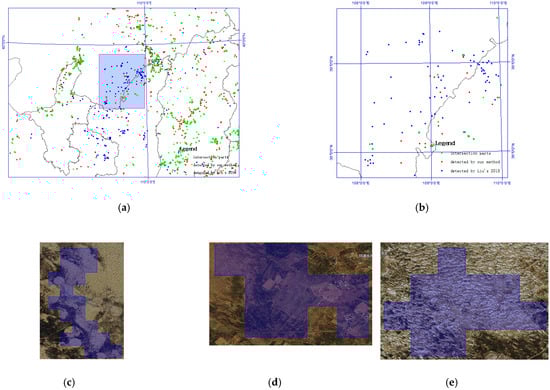
Figure 10.
The spatial distribution of working industrial heat sources in the North-West of Shaanxi Province and south of Inner Mongolia area. (a) The spatial distribution of working industrial heat sources in the north of China. (b) The spatial distribution of working industrial heat sources in North-West of Shaanxi Province and south of Inner Mongolia area. (c) High-resolution image of one object (marked as a in (b)). (d) High-resolution image of one object (marked as a in (b)). (e) High-resolution image of one object (marked as a in (c)).
4.2. Expression of Industrial Information Model
The list acquisition method from bottom-up surveys cannot be applied to large regions as it is time-consuming and strongly subjective. Up to 20 December 2021, the expression model of industrial heat source information over large regions is lacking. In order to keep an accurate and multivariate expression for industrial heat source information, industrial heat sources detection model was applied to the expression of industrial information. A model for expressing industrial information based on object-oriented industrial heat sources using multi-thermal anomaly data for China mainland was then proposed. First, 4340 working industrial heat sources in mainland China were detected by applying an adaptive k-means algorithm to 4,837,801 ACF data points acquired between 19 January 2012 and 31 December 2020. Secondly, thermal anomalies related to industrial heat sources were extracted from the ACF/VNF/L8F data by regional distributions of industrial heat sources. Then, the missing thermal anomalies and parameters were revised based on those consistencies in time and space for different industrial heat sources. Thus, several features associated with working industrial heat sources were extracted from ACF data, VNF, and L8F. Thirdly, the locations of working industrial heat sources were identified by light, land-surface temperature, and CO2 and N2O emission information associated with working industrial heat sources were also extracted and were discussed.
From the temporal and spatial analysis, the number of thermal anomalies related to industrial heat sources (NACFH, NVCFH, and NL8H), temperature features (VNFBB, L8FT, and F1 TRIMS LST), F1_Flint features showed a good positive correlation with each other. The results showed that features of NACFH, NVCFH, NL8H, VNFBB, L8FT were more accurate to expression industrial heat sources information. Moreover, F1 TRIMS LST against NVNFH produced a stratified distribution. It illustrated that temperature features (VNFBB, L8FT, and F1 TRIMS LST) could be used to classify finite-sized sub-categories [2]. While, F1_ EDGARv6.0 and F1_ ODIAC2020b, which describe the emissions of N2O and CO2, all had relatively low (compared with other features) correlations with other parameters. That result was different from Tao et al. (2020). The different scale of research objects may be the main reason. This may have been related to the spatial resolution of the original data—0.1° × 0.1° and 1 km × 1 km for F1_ EDGARv6.0 and F1_ ODIAC2020b, respectively. However, the mean area of the 4340 objects missing in our results was 0.88 km2. Thus, we cannot exclude the possibility that the N2O and CO2 emissions from the industrial heat sources detected in this paper were not the main sources of these emissions at certain scales. To draw more accurate conclusions about this, more experimental data on a big spatial scale is needed.
In order to verify the effectiveness and accuracy of our features on industrial heat sources, much more data and experiments are needed. Firstly, data related to environmental change, such as concentrations data of oxygen, carbon monoxide, nitrogen monoxide, nitrogen dioxide, sulfur dioxide, and PM2.5, etc., based on ground stations and satellite data, would be used to analyze the impact of industrial production on environmental pollution. Moreover, economic data would also be considered in future studies. Secondly, much more experiments in different scales, such as national, regional, provincial, urban, even rural scales, would be designed to illustrate the validity of our expression parameters on industrial heat sources.
5. Conclusions
In order to monitor and evaluate the operation of industrial plants and mines objectively, in this study, the detection of heat sources was used as the basis for providing other information about these industrial operations. Thermal anomaly data derived from three types of data, ACF, VNF, and L8F, were used in this study. First, 4340 working industrial heat sources in mainland China were detected by applying an adaptive k-means algorithm to ACF data acquired between 19 January 2012 and 31 December 2020. Secondly, several features associated with working industrial heat sources were extracted using NPP VIIRS 375 m active fire/hotspot data (ACF), VIIRS Nightfire data (VNF), and the Fires product which is based on Landsat-8 AIRCAS data (L8F). Areas containing working industrial heat sources were identified using these different types of fire data. Light, land-surface temperature, and CO2 and N2O emission information related to working industrial heat sources were also used. Results show that the new model can be a new real-time, objective, and real way to describe the production operation status of industrial heat sources on a large-scale area. More conclusions drawn from the results are as follows.
(1) At the national scale, the Pearson’s linear correlation coefficients between different features extracted from any one of the original data sets were high, except for ACFT. The features describing the number of thermal anomalies related to industrial heat sources (NACFH, NVCFH, and NL8H) showed a good positive correlation with the other features. The temperature features VNFBB, L8FT, and F1 TRIMS LST were all positively correlated with each other. A plot of F1 TRIMS LST against NVNFH produced a stratified distribution. The correlation between the parameters related to N2O and CO2 emissions - F1_ EDGARv6.0, ACFT and F1 _ ODIAC2020b and other parameters were not as good (as for other parameters).
(2) At the regional scale, there were some differences between the BTH and YRD except that the same patterns as for the national data were generally visible. The Pearson’s linear correlation coefficients between different features obtained from either the ACF or L8F data were high in both regions. However, the results for the correlation between NVNFH, VNFBB, and VNFRH, which were derived from the VNF data, were very different in the two. In both regions, the statistical characteristics NACFH, NVCFH, and NL8H were fairly well correlated with the other feature parameters. The Pearson’s linear correlation coefficients between the three statistical characteristics and the five other parameters (NACFH, NVCFH, ACFT, ACFFRP, and F1 _ Flint) were higher in the BTH than in the YRD. The temperature features ACFT, VNFBB, L8FT, and F1 TRIMS LST were all positively correlated with each other, and a plot of F1 TRIMS LST against NVNFH produced a stratified distribution in both regions.
The results suggest that industrial information based on object-oriented industrial heat sources detected using multiple types of thermal anomaly data can be used to monitor and evaluate the operation of industrial plants and mines. This could be beneficial to heavy industry regulation and policy-makers. Future studies should focus on producing industrial thermal anomaly data based on multiple types of thermal anomaly data to improve the accuracy of the industrial information. We also plan to examine the relationship between industrial information and economic development, as well as to continue to make efforts to investigate the connection to climate change and carbon neutrality using emissions data with a much higher spatial resolution. These are important issues in terms of the Paris Agreement (2015) [31,32].
Author Contributions
Conceptualization, C.M.; methodology, C.M.; software, C.M.; validation, C.M., X.S. and W.X. formal analysis, Y.Z.; investigation, X.S. and Y.Z.; resources, C.M.; data curation, X.S.; writing—original draft preparation, C.M.; writing—review and editing, W.X.; visualization, X.S.; supervision, J.L and J.Y.; project administration, J.L.; funding acquisition, C.M. All authors have read and agreed to the published version of the manuscript.
Funding
This research was funded by National Natural Science Funds for Key Projects of China (grant number 61731022), the National Key Research and Development Program of China (grant number 2020YFA0607503), and the Youth Innovation Promotion Association of the Chinese Academy of Science (grant number 2021126).
Institutional Review Board Statement
Not applicable.
Informed Consent Statement
Not applicable.
Data Availability Statement
Not applicable.
Acknowledgments
The ACF Data were downloaded from the FIRMS website. The VNF data were obtained from the academic sector at the Colorado School of Mines. The L8F and Flint light data were obtained from AIRCAS. We also wish to thank the providers of the TRIMS LST, EDGARv6.0, and ODIAC2020b data. This research was financially supported by the Youth Innovation Promotion Association of the Chinese Academy of Science (2021126). The authors thank the editors and the three anonymous reviewers for their valuable comments that helped to improve our manuscript.
Conflicts of Interest
The authors declare no conflict of interest.
Abbreviations
| ACF: | NPP VIIRS 375-m active fire/hotspot data |
| ACFFRP: | The total FRP (Fire Radiative Power) value of all the ACF thermal anomalies in areas containing working industrial heat sources |
| ACFT: | The total Bright_ti4 value of all the ACF thermal anomalies in areas containing working industrial heat sources |
| AIRCAS: | Aerospace Information Research Institute [of the] Chinese Academy of Sciences |
| BTH: | Beijing-Tianjin-Hebei Urban Agglomeration |
| DNNTL: | The sum of the digital numbers (DNs) of the Flint night-time light data of areas containing a working industrial heat source |
| EDGAR: | Emissions Database for Global Atmospheric Research |
| EOG: | Earth Observation Group |
| IPCC: | Intergovernmental Panel on Climate Change |
| L8F: | Fires product based on Landsat-8 AIRCAS data |
| L8FT: | The sum of the temperatures of all the L8F thermal anomalies in areas containing working industrial heat sources |
| LST: | Land surface temperature |
| NACFH: | The total number of ACF thermal anomalies in areas containing working industrial heat sources |
| NIES: | National Institute for Environmental Studies |
| NL8FH: | The total number of L8F thermal anomalies in areas containing working industrial heat sources |
| NVNFH: | The total number of VNF thermal anomalies in areas containing working industrial heat sources |
| NWH: | The number of working industrial heat sources |
| ODIAC: | Open-Data Inventory for Anthropogenic Carbon Dioxide |
| TRIMS LST: | Thermal and Reanalysis Integrating Moderate-resolution Spatial-seamless LST |
| VNF: | VIIRS Nightfire Data |
| VNFBB: | The total Temp_BB value of all the VNF thermal anomalies in areas containing working industrial heat sources (IR-source temperatures assuming blackbody sources (derived using the Nightfire algorithm)) |
| VNFRH: | The total RH value of all the VNF thermal anomalies in areas containing working industrial heat sources (IR-source radiant heat (derived using the Nightfire algorithm)) |
| YRD: | Yangtze River Delta region |
References
- Ma, C.; Yang, J.; Chen, F.; Ma, Y.; Liu, J.; Li, X.; Duan, J.; Guo, R. Assessing Heavy industry heat source Distribution in China Using Real-Time VIIRS Active Fire/Hotspot Data. Sustainability 2018, 10, 4419. [Google Scholar] [CrossRef] [Green Version]
- Liu, Y.; Hu, C.; Zhan, W.; Sun, C.; Murch, B.; Ma, L. Identifying industrial heat sources using time-series of the VIIRS Nightfire product with an object-oriented approach. Remote Sens. Environ. 2018, 204, 347–365. [Google Scholar] [CrossRef]
- Zhang, X.; Zhou, J.; Liang, S.; Wang, D. A practical reanalysis data and thermal infrared remote sensing data merging (RTM) method for reconstruction of a 1-km all-weather land surface temperature. Remote Sens. Environ. 2021, 260, 112437. [Google Scholar] [CrossRef]
- Park, C.; Jeong, S.; Park, H.; Yun, J.; Liu, J. Evaluation of the Potential Use of Satellite-Derived XCO2 in Detecting CO2 Enhancement in Megacities with Limited Ground Observations: A Case Study in Seoul Using Orbiting Carbon Observatory-2. Asia-Pac. J. Atmos. Sci. 2020, 57, 289–299. [Google Scholar] [CrossRef]
- Reuter, M.; Buchwitz, M.; Schneising, O.; Krautwurst, S.; O’Dell, C.W.; Richter, A.; Bovensmann, H.; Burrows, J.P. Towards monitoring localized CO2 emissions from space: Co-located regional CO2 and NO2 enhancements observed by the OCO-2 and S5P satellites. Atmos. Chem. Phys. 2019, 19, 9371–9383. [Google Scholar] [CrossRef] [Green Version]
- Zhang, P.; Yuan, C.; Sun, Q.; Liu, A.; You, S.; Li, X.; Zhang, Y.; Jiao, X.; Dun, D.; Sun, M.; et al. Satellite-based detection and characterization of industrial heat sources in China. Environ. Sci. Technol. 2019, 53, 11031–11042. [Google Scholar] [CrossRef] [PubMed]
- Baugh, K. Characterization of Gas Flaring in North Dakota using the Satellite Data Product, VIIRS Nightfire. In Proceedings of the AGU Fall Meeting 2015, San Francisco, CA, USA, 14–18 December 2015. [Google Scholar]
- Zhou, Y.; Zhao, F.; Wang, S.; Liu, W.; Wang, L. A Method for Monitoring Iron and Steel Factory Economic Activity Based on Satellites. Sustainability 2018, 10, 1935. [Google Scholar] [CrossRef] [Green Version]
- Ma, C.; Niu, Z.; Ma, Y.; Chen, F.; Yang, J.; Liu, J. Assessing the Distribution of Heavy Industrial Heat Sources in India between 2012 and 2018. ISPRS Int. J. Geo-Inf. 2019, 8, 568. [Google Scholar] [CrossRef] [Green Version]
- Lai, J. Study on Remote Sensing Identification and Spatial Distribution Pattern of Heat Source in Heavy Industry; Northwest Normal University: Lanzhou, China, 2020. [Google Scholar]
- Lu, C.; Li, W. A comprehensive city-level GHGs inventory accounting quantitative estimation with an empirical case of Baoding. Sci. Total Environ. 2018, 651, 601–613. [Google Scholar] [CrossRef] [PubMed]
- Zhang, S.; Ren, H.; Zhou, W.; Yu, Y.; Chen, C. Assessing air pollution abatement co-benefits of energy efficiency improvement in cement industry: A city level analysis. J. Clean. Prod. 2018, 185, 761–771. [Google Scholar] [CrossRef] [Green Version]
- Tong, D.; Zhang, Q.; Davis, S.J.; Li, F.; Zheng, B.; Geng, G.; Xue, T.; Li, M.; Hong, C.; Lu, Z.; et al. Targeted emission reductions from global super-polluting power plant units. Nat. Sustain. 2018, 1, 59–68. [Google Scholar] [CrossRef] [Green Version]
- Sun, S.; Li, L.I.; Zhao, W.J.; Wang, L.; Qiu, Y.; Jiang, L.; Zhang, L. Industrial pollution emissions based on thermal anomaly remote sensing monitoring: A case study of southern Hebei urban agglomerations, China. China Environ. Sci. 2019, 7, 3120–3129. [Google Scholar]
- Wooster, M.J.; Xu, W.; Nightingale, T. Sentinel-3 SLSTR active fire detection and FRP product: Pre-launch algorithm development and performance evaluation using MODIS and ASTER datasets. Remote Sens. Environ. 2012, 120, 236–254. [Google Scholar] [CrossRef]
- Qiu, Y.; Li, L.; Lu, H.; Li, J.; Wang, X.; Jiang, L.; Jingping, S. Estimation of Air Pollution Emission from Cement Plant in Beijing Based on Thermal Anomaly Detection. Res. Environ. Sci. 2020, 33, 2265–2271. [Google Scholar]
- Gu, Y.C.; Meng, Q.Y.; Hu, D. Analysis of environmental effects of industrial thermal anomalies. Remote Sens. Land Resour. 2020, 32, 190–198. [Google Scholar]
- Air Pollution Prevention Plan. Available online: http://www.gov.cn/zwgk/2013-09/12/content_2486773.htm (accessed on 25 November 2021).
- China Shuts Down Thousands of Firms for Pollution Offences. Available online: http://www.360doc.com/content/07/0508/23/21275_489581.shtml (accessed on 25 November 2021).
- Dozier, D.M. The Diffusion of Evaluation Methods among Public Relations Practitioners. In Proceedings of the Journalism Annual Convention, East Lansing, MI, USA, 9 August 1981; pp. 1–34. [Google Scholar]
- NASA. NASA VIIRS Land Science Investigator Processing System (SIPS) Visible Infrared Imaging Radiometer Suite (VIIRS)375 m & 750 m Active Fire Products. 2018. Available online: https://viirsland.gsfc.nasa.gov/PDF/VIIRS_activefire_User_Guide.pdf (accessed on 25 November 2021).
- Schroeder, W.; Oliva, P.; Giglio, L.; Csiszar, I.A. The new VIIRS 375 m activefire detection data product: Algorithm description and initial assessment. Remote Sens. Environ. 2014, 143, 85–96. [Google Scholar] [CrossRef]
- VIIRS I-Band 375 m Active Fire Data. Available online: https://earthdata.nasa.gov/earth-observation-data/near-real-time/firms/viirs-i-band-active-fire-data (accessed on 25 November 2021).
- VIIRS Nightfire. Available online: https://eogdata.mines.edu/products/vnf/ (accessed on 25 November 2021).
- Yang, H.E.; Yang, J.; Yong, M.A.; Liu, J. A method for fire detection using landsat 8 data. J. Infrared Millim. Waves 2016, 5, 600–608. [Google Scholar]
- Surface High Temperature Point Detection System. Available online: http://satsee.radi.ac.cn:8080/map.html (accessed on 25 November 2021).
- DMSP/OLS Night Light (Codenamed “Flint”). Available online: https://download.csdn.net/download/-denghaojian/10992041 (accessed on 25 November 2021).
- Tao, J.; Fan, M.; Gu, J.; Chen, L. Satellite observations of the return-to-work over China during the period of COVID-19. J. Remote Sens. 2020, 7, 824–836. [Google Scholar]
- Crippa, M.; Guizzardi, D.; Muntean, M.; Schaaf, E.; Dentener, F.; van Aardenne, J.A.; Monni, S.; Doering, U.; Olivier, J.G.J.; Pagliari, V.; et al. Gridded emissions of air pollutants for the period 1970–2012 within EDGAR v4.3.2. Earth Syst. Sci. Data Discuss. 2018, 10, 1987–2013. [Google Scholar] [CrossRef] [Green Version]
- European Commission. Available online: https://edgar.jrc.ec.europa.eu/gallery?release=v60ghg&-substance=N2O§or=TOTALS (accessed on 25 November 2021).
- Oda, T.; Maksyutov, S.; Andres, R.J. The Open-source Data Inventory for Anthropogenic CO2, version 2016 (ODIAC2016): A global monthly fossil fuel CO2 gridded emissions data product for tracer transport simulations and surface flux inversions. Earth Syst. Sci. Data 2018, 10, 87–107. [Google Scholar] [CrossRef] [PubMed] [Green Version]
- Paris Agreement. Available online: https://en.wikipedia.org/wiki/Paris_Agreement (accessed on 25 November 2021).
Publisher’s Note: MDPI stays neutral with regard to jurisdictional claims in published maps and institutional affiliations. |
© 2022 by the authors. Licensee MDPI, Basel, Switzerland. This article is an open access article distributed under the terms and conditions of the Creative Commons Attribution (CC BY) license (https://creativecommons.org/licenses/by/4.0/).