Article

Complex Ecosystem Impact of Rapid Expansion of Industrial and Mining Land on the Tibetan Plateau

1
Research Institute for Smart Cities, School of Architecture and Urban Planning, Shenzhen University, Shenzhen 518060, China
2
Key Laboratory of Land Surface Pattern and Simulation, Institute of Geographic Sciences and Natural Resources Research, Chinese Academy of Sciences, Beijing 100101, China
3
State Key Laboratory of Tibetan Plateau Earth System, Resources and Environment, Beijing 100101, China
4
College of Resources and Environment, University of Chinese Academy of Sciences, Beijing 100049, China
5
Department of Land Resource Management, School of Public Administration, China University of Geosciences, Wuhan 430074, China
*
Author to whom correspondence should be addressed.
Remote Sens. 2022, 14(4), 872; https://doi.org/10.3390/rs14040872
Submission received: 18 January 2022 / Revised: 9 February 2022 / Accepted: 9 February 2022 / Published: 11 February 2022
(This article belongs to the Section Environmental Remote Sensing)

Abstract

:
The ecological security of the Tibetan Plateau is vital for sustainable development. In recent years, biodiversity loss and ecosystem degradation caused by industrial and mining activities have attracted wide attention. However, a synthesis assessment of the impacts of industrial and mining land (IML) on the ecosystem is currently lacking. In this study, based on the land cover data and normalized differential vegetation index, we used the landscape ecological index, Theil-Sen trend analysis and equivalent value factors method to evaluate the change in IML and its ecosystem impact on the TP. The results demonstrated that the area of IML expanded by 3.3 times (228.56%) during 1990–2020, and reached 968.95 km² in 2020. Within this area, the newly added, stable, and reduced areas were 842.71, 126.26, and 168.65 km², respectively. Simultaneously, IML expansion made the landscape more fragmented during 1990–2020. The number of patches, splitting index, and landscape shape index in 2020 increased by 3.59-, 2.70-, and 1.90-fold compared to those in 1990, respectively. Furthermore, the difference in the vegetation change between the IML and its 10 km buffer zone was significant. About 77.34% of the vegetation in the IML area showed a trend of decrease, while about 76.51% of the vegetation in the buffer zone of IML showed a trend of increase. In addition, the expansion of IML also reduced the total ecological services value by USD 6969.31 million (0.66%) from 1990 to 2020. However, the lowered value was USD 8649.50 million (0.82%) in the newly added IML. This study highlights the rapid expansion of IML and reveals the ecosystem structure, ecosystem quality, and ecosystem service impact on the TP, which helps guide ecosystem protection and the sustainable development of mining.

1. Introduction

Mineral resources provide energy and mineral raw materials for the economic development of a region or country, and thus contributing to the growth of the mining industry. The rapid development of the mining industry has resulted in a series of ecosystem problems while providing important material security for economic and social development [1]. The direct effects of industrial and mining land (IML) development are landscape fragmentation, reduced vegetation fraction, changes in landform and soil alteration, and disruptions in hydrological regimes [2,3,4]. Additionally, there are a number of possible indirect effects, such as air pollution, soil erosion, toxicity, and freshwater pollution [5,6,7]. Furthermore, research has shown that although vegetation as a whole is greening under the influence of climate change [8], due to the expansion of land use, the greening trend of vegetation in some areas has been offset [9,10]. These issues are directly related to the lives and property of people and the sustainable development of the social economy. Therefore, more attention has been paid to the relationship between mining activities and the ecosystem [11,12,13].
From a global perspective, between 2008 and 2016, mining activities were identified as the dominant driver of deforestation [14]. The continuous expansion of lithium mining has strong negative correlations with the normalized differential vegetation index (NDVI) and soil moisture index [15]. In such cases, it is important to think about mining and land reclamation together. Continuous mining destroys vegetation/soil systems and reduces soil productivity and fertility, while the goal of reclamation involves returning the mine soil to its original state by restoring the nutritional properties of soil through a series of reclamation methods [4,16]. It was verified that the vegetated areas, composed mainly of riparian forest and pasture, presented greater losses because of tailings dam failure. Surface mining of land not only leads to the loss of the ecosystem, but also indirectly affects the livelihood of farmers [14]. In addition, Kumi-Boateng et al. (2012) [17] revealed an alarming rate of land use and land cover conversions in the Tarkwa mining area of the Ankobra Basin.
In China, many studies have focused on the impact of mining a specific mineral, such as coal, on the ecosystem. For example, mining activities have had a distinct negative impact on the vegetation ecology in the Shanxi coal mine [18]. From 2005–2020, the ecological service value (ESV) of the surrounding areas of the Yanzhou coal mine in Shandong Province exhibited a decreasing trend. Therefore, a set of research schemes was proposed that comprehensively examine the supply, trade-off, and demand of ecosystem services [19]. In addition, the qualitative relationship between vegetation diversity and ecosystem factors were analyzed in the Antaibao mining area in China, based on a regional scale [17]. The vegetation coverage changes were studied in an open-pit coal mine by calculating the variation trends in the NDVI and obtaining a transition matrix of land cover [20]. Studies were undertaken to evaluate the historical impacts of mining activities on surface biophysical characteristics, and to predict the future changes in pattern of vegetation cover [21].
On the Tibetan Plateau (TP), the mineral resources mainly include potassium, copper, gold, geothermal, and Salt Lake minerals (boron, lithium). At the beginning of the 21st century, under the background of the development of the western region in China, a strategic shift in the national mineral resources, and the construction of the Qinghai–Tibet Railway, a precious historical opportunity was provided to exploit Tibet’s mineral resources. Tibet’s mineral resources developed rapidly in the early stages but, due to extensive mining, backward mining and selection techniques, unregulated management, and lack of attention to ecological geological ecosystem protection, this development has had a great impact on the mine and the surrounding geological ecosystem [22,23].
However, due to the absence of pervasive high-resolution and long time-series data, some studies have focused on the ecosystem of local IML on the TP, such as the Duolong mining area in Tibet, a gold mine in North Tibet, and mineral resources in eastern Tibet [22,23,24]. Although few studies have adopted individual IML as the scale to analyze the impact of IML use changes on the ecosystem, quantitative analysis of the impact of IML use changes on the ecosystem of the whole TP is lacking. Therefore, there is a need to investigate the effect of the expansion of each IML on vegetation. Identifying the impacts of IML on vegetation and determining the effective range of the impacts is of great practical significance for mining ecosystem management, ecological conservation/planning, sustainable mining development, and the protection of key ecosystems inside and outside the IML. In addition, in previous studies, a single indicator, such as NDVI or ESV, was used to characterize the impact of IML on the ecosystem [25]. There is still a lack of comprehensive and quantitative analyses and research.
In this study, comprehensive multivariate factors, such as the landscape index, NDVI, and ESV, were used to evaluate the complex ecosystem impact of IML. This study had the following objectives: (1) to quantitatively analyze the impact of the rapidly expanding IML on the ecological systems of the TP; (2) to analyze whether IML development has an evident impact on the ecological indicators or utilization; and (3) to understand how to balance the development of IML and the protection of the ecosystem. To address these questions, we analyzed the change in IML from 1990 to 2020 in the TP and its 10 km buffers based on high-resolution, large-scale, and long time-series land cover datasets and the NDVI, to systematically analyze the impact of IML on non-mining land, landscape patterns, the NDVI, and the ESV. We hope that our findings can contribute to policies promoting ecological conservation and the development of rational, green, and eco-friendly IML in the Tibet Autonomous Region and Qinghai Province.

2. Materials and Methods
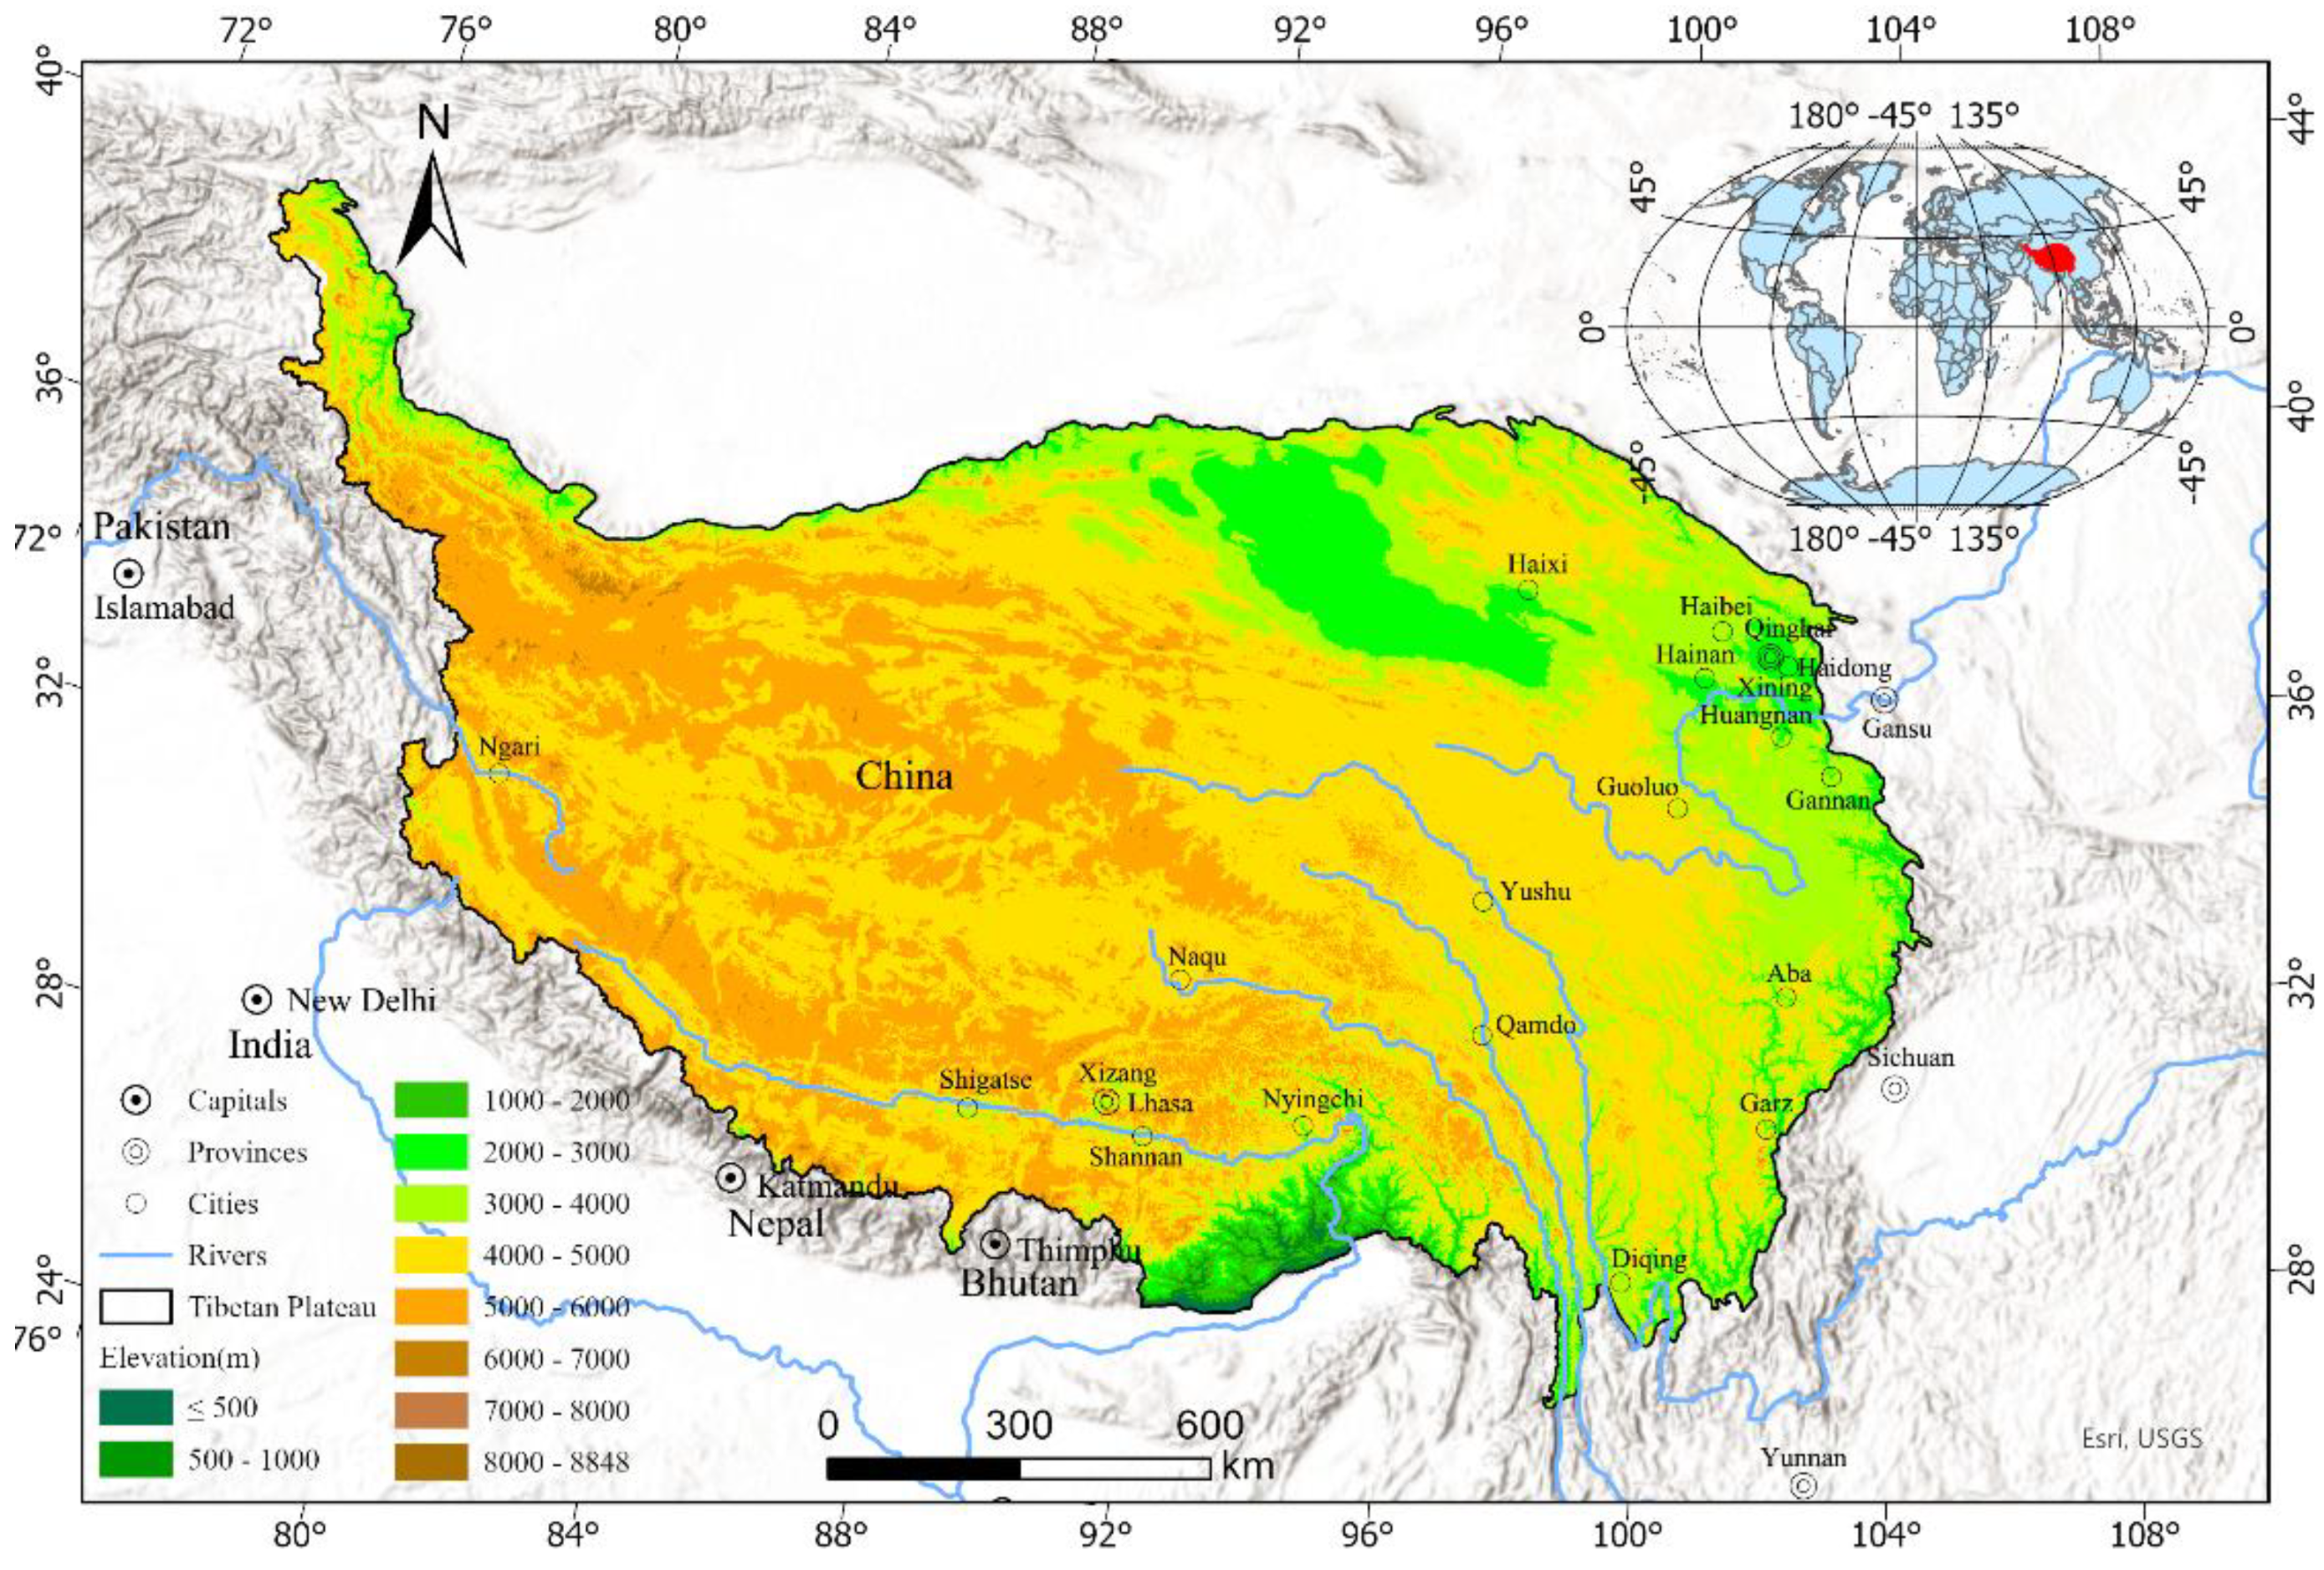
2.1. Study Area

The TP is located at 26°00′ N–39°46′ N, 73°18′ E–104°46′ E, has a combined area of 2.5 million km2, and accounts for 26% of China’s territory (Figure 1). The average elevation of the TP exceeds 4400 m above sea level (asl), with a maximum of 8848 m asl. Notably, TP is characterized by low temperature, strong radiation, and scant precipitation [26]. The vegetation type in the TP is dominated by grasslands, accounting for approximately 59.2% of the total area of the plateau [27,28]. In addition, the IMLs on the TP play a key role in economic development in China and have recently displayed an increasing trend. There are 143 types of mining on the Tibetan Plateau, 102 of which have been developed, and 41 of them are to be mined. The total value of the output of the mining industry has shown a continuously increasing trend for a number of decades [29]. However, the ecosystem of the TP is fragile and sensitive to human activities and climate change, making it more susceptible to destruction from industrial and mining activities [30]. Therefore, assessing the impact of IML on the ecosystem is important for providing decision support to protect the ecological harmony of the TP.

2.2. Data Resources

2.2.1. Land Use Datasets

The land use data for 1990, 2000, 2010, and 2020 used in this study were derived from the Resource and Environmental Science and Data Center (http://www.resdc.cn/, accessed on 10 December 2021), using a spatial resolution of 30 m and accuracy of 80.06%, which are parameters used widely in related research [32,33]. IML mainly includes mines, large industrial areas, oil fields, salt fields, and quarries. With the support of these data, we carried out an analysis of the regional distribution, trend of change, and the reasons for the change in IML over a decade spanning from 1990 to 2020. Notably, in this study, we only calculated the area of IML greater than 0.0027 km2 (including three pixels).
The expansion of IML may be the most irreversible and severe form of land use [15]; its effects transcend far beyond the physical boundaries of mining [34,35,36,37]. The 10 km buffer zone around the IML is considered to be the scope of the impact of mining on vegetation [15,35]. To fully characterize the influence of the evolution of IML on regional ecosystems and conveniently compare the difference in vegetation change between IML central regions and non-mining lands, 10 km buffers for each IML (with intervals of 1 km) were selected to depict vegetation change trends. In addition, the IML change was divided into three categories—added mining, reduced mining, and stable mining—to represent the different states of IML.

2.2.2. Normalized Difference Vegetation Index

In this study, we used Landsat NDVI data from 1990 to 2020 (yearly maximum composite datasets, 30 m resolution). The Landsat NDVI data were downloaded from Google Earth Engine (GEE) (https://earthengine.google.com/, accessed on 10, December 2021) [38]. The Landsat images in “LANDSAT/LT05/C01/T1_SR” were atmospherically corrected using Land Surface Reflectance Code (LaSRC), and a cloud, shadow, water, and snow mask produced using CFMask was included, in addition to a per-pixel saturation mask in the Earth Engine Data Catalog. The Landsat NDVI was used to analyze the spatial trend of vegetation and estimate the ESV in the IML and its 10 km buffer.

2.3. Methods

In order to evaluate the impact of IML change on the ecosystem, two studies were carried out in this research. Firstly, we identified the temporal and spatial characteristics of IML changes from 1990 to 2020. Secondly, the ecosystem impact assessment of IML change focused on the ecosystem structure, ecosystem quality, and ecosystem service (Figure 2). Specifically, based on the common landscape index, NDVI trends, and ESV changes [19,39], comprehensive impacts of IML change on the ecosystem were identified by comparing the IML area with its 10 km buffer zone. We briefly describe each of the methods in the following sections. In addition, a more detailed description of the formulas and procedures is provided in the Supplementary Materials.

2.3.1. Landscape Change

Landscape indices, such as the number of patches (NP), patch density (PD), largest patch index (LPI), perimeter area fractal dimension (PAFRAC), landscape shape index (LSI), patch cohesion index (COHESION), splitting index (SPLIT), and aggregation index (AI) were chosen to reflect the landscape fragmentation, proximity, and vergence characteristics of the selected IML. Among these, NP and PD reflect the degree of landscape fragmentation; the larger the value, the higher the degree of landscape fragmentation. PAFRAC reflects the fractal dimension of plaque shape complexity. The higher the AI value, the more common the boundaries between the plaques and the denser the plaque distribution. COHESION describes the degree of habitat fragmentation in a landscape; the higher the value, the greater the plaque distribution. The LPI reflects landscape dominance information and centralized distribution. LSI, calculated using Fragstats 4.2, is an index that reflects the shape characteristics of landscape patches; the larger the value, the more complex the shape of the plaque. For details, refer to the tutorial of the FRAGSTATS software (https://www.umass.edu/landeco/research/fragstats/downloads/fragstats_downloads.html, accessed on 10 December 2021).

2.3.2. Change Detection Using Normalized Difference Vegetation Index

To analyze the trends in vegetation changes during the study period, a simple regression using the Theil–Sen estimator was employed using the yearly NDVI. The slope in the multiyear regression equation for each pixel represents the interannual variation rate of the vegetation NDVI [8]. In addition, the Mann–Kendall (MK) test was used to detect the significance of the trend changes. The formulas for this method are derived from previous studies [40,41].
In this study, R statistical software was used to perform the Theil–Sen analyses by adding the TREND packages, respectively. However, the Theil–Sen analysis of NDVI in 1990–2020 was performed in the GEE cloud platform using “ee.Reducer.sensSlope” and “ee.Reducer.kendallsCorrelation” (https://earthengine.google.com/, accessed on 10 December 2021), because over 30 GB of data was beyond the computational load of a general local computer and server.

2.3.3. Equivalent Value Factors Method

The use of equivalent value factors (EVFs) is the most general approach to evaluate ES. The ESV estimation includes three parts. First, on the basis of the EVF of ESV [42,43], the grain output per unit area in the study area/grain output per unit area in the entire country ratio is used as the regional revision coefficient. The Chinese ecosystem services value of the unit area of different ecosystem types was replaced by that of the study area. The corresponding equation is as Equation (1) [44,45].
λ ( t ) = Q ( t ) Q 0 ( t ) ,   t = 1990 ,   2000 ,   2010   and   2020
E f ( j , t ) = λ ( t ) E ( i )
where λ ( t ) is the revision coefficient for year t ; Q (t) and Q 0 ( t ) are the yields per unit of the study area and the entire nation for year t , respectively. E f ( j , t ) is the spatialized E i for the ESV of grid j for year t ; and E ( i ) is standard EVF for the ESV of ecosystem type i . According to Equation (1), λ ( 1990 )   λ ( 2000 ) , λ ( 2010 ) , and λ ( 2020 ) are 0.77, 0.86, 0.91, and 0.84, respectively, and the revised EVFs of different ecosystem types in Tibetan Plateau in 2020 are adjusted and shown in Table 1. For the revised EVFs of different ecosystem types for 1990, 2000, and 2010, please refer to Supplementary Material Tables S2–S4.
Second, a spatial distribution map of the EVF was established based on the relationship between the EVF and NDVI [30,46,47]. Finally, the ESV was calculated based on Xie’s standard equivalent value factor of ecosystem services of the natural grain yield of 1 hm2 farmland of the national annual average yield, which is 3406.50 CNY/hm2. The data used to calculate ESV in this part were for the years 1990, 2000, 2010, and 2020, with 30 m land cover data and 30 m Landsat NDVI. The calculation process was implemented in Python using spatial analysis functions from the ArcPy package.

3. Results

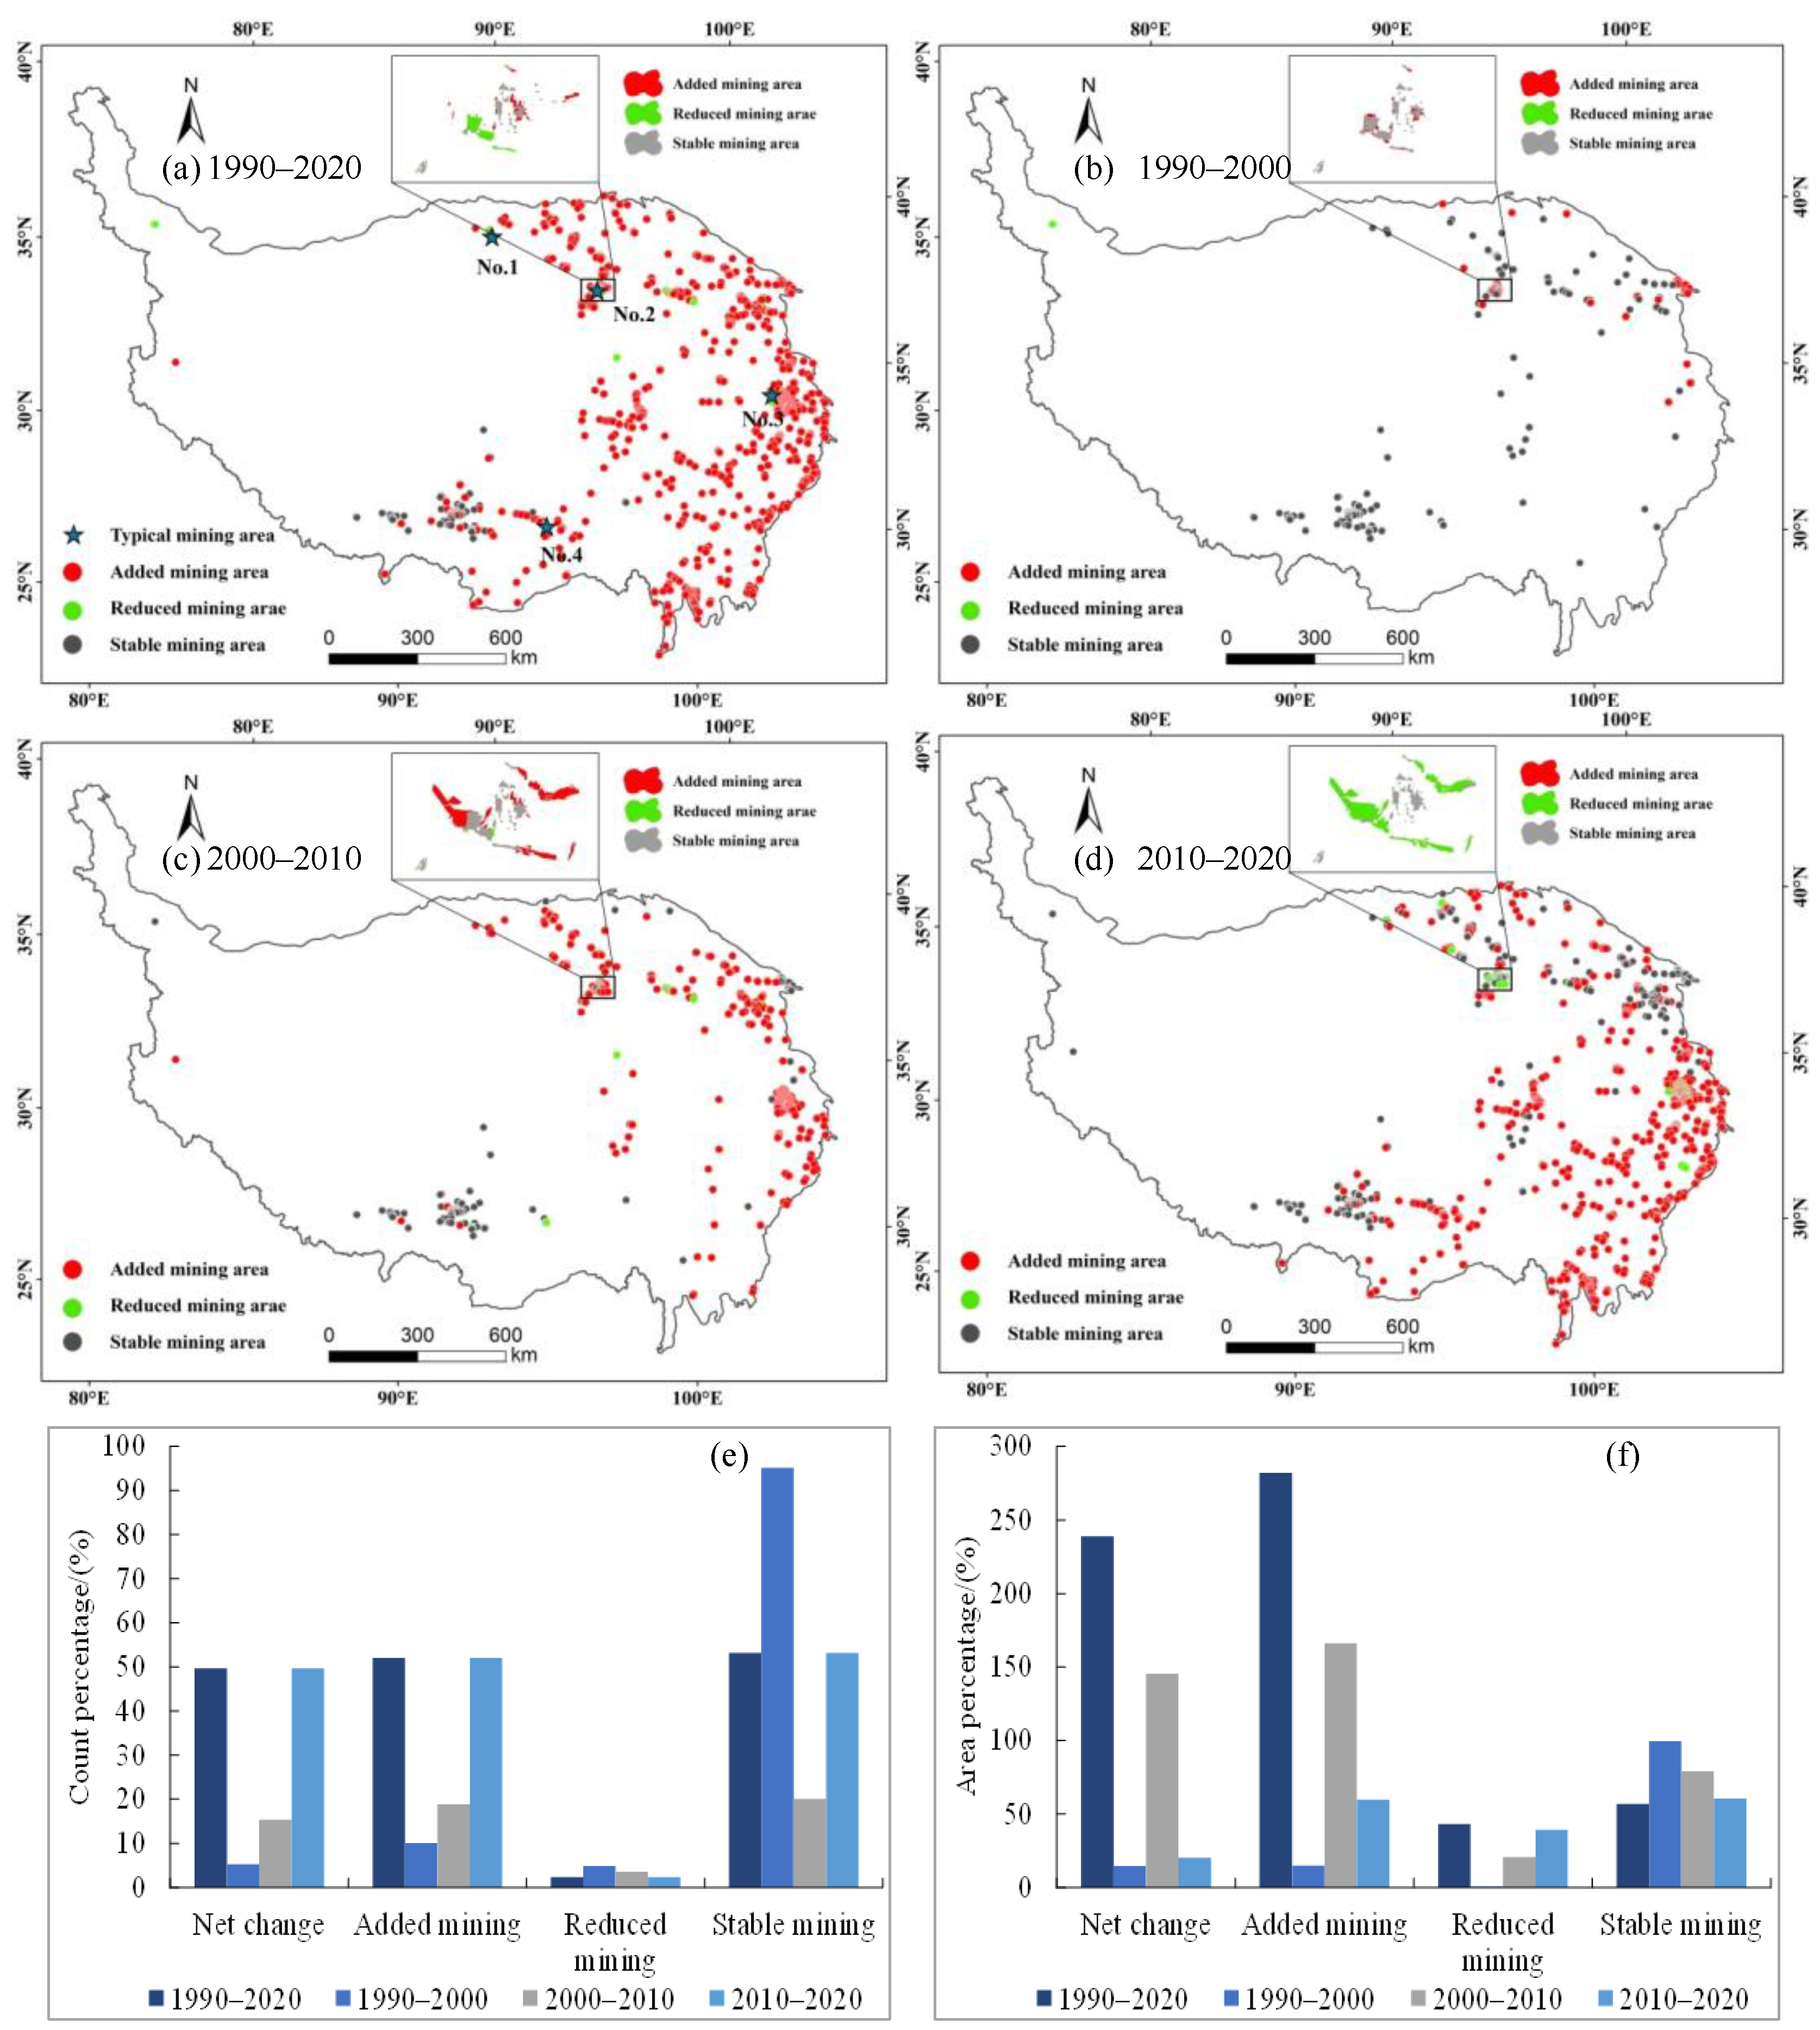
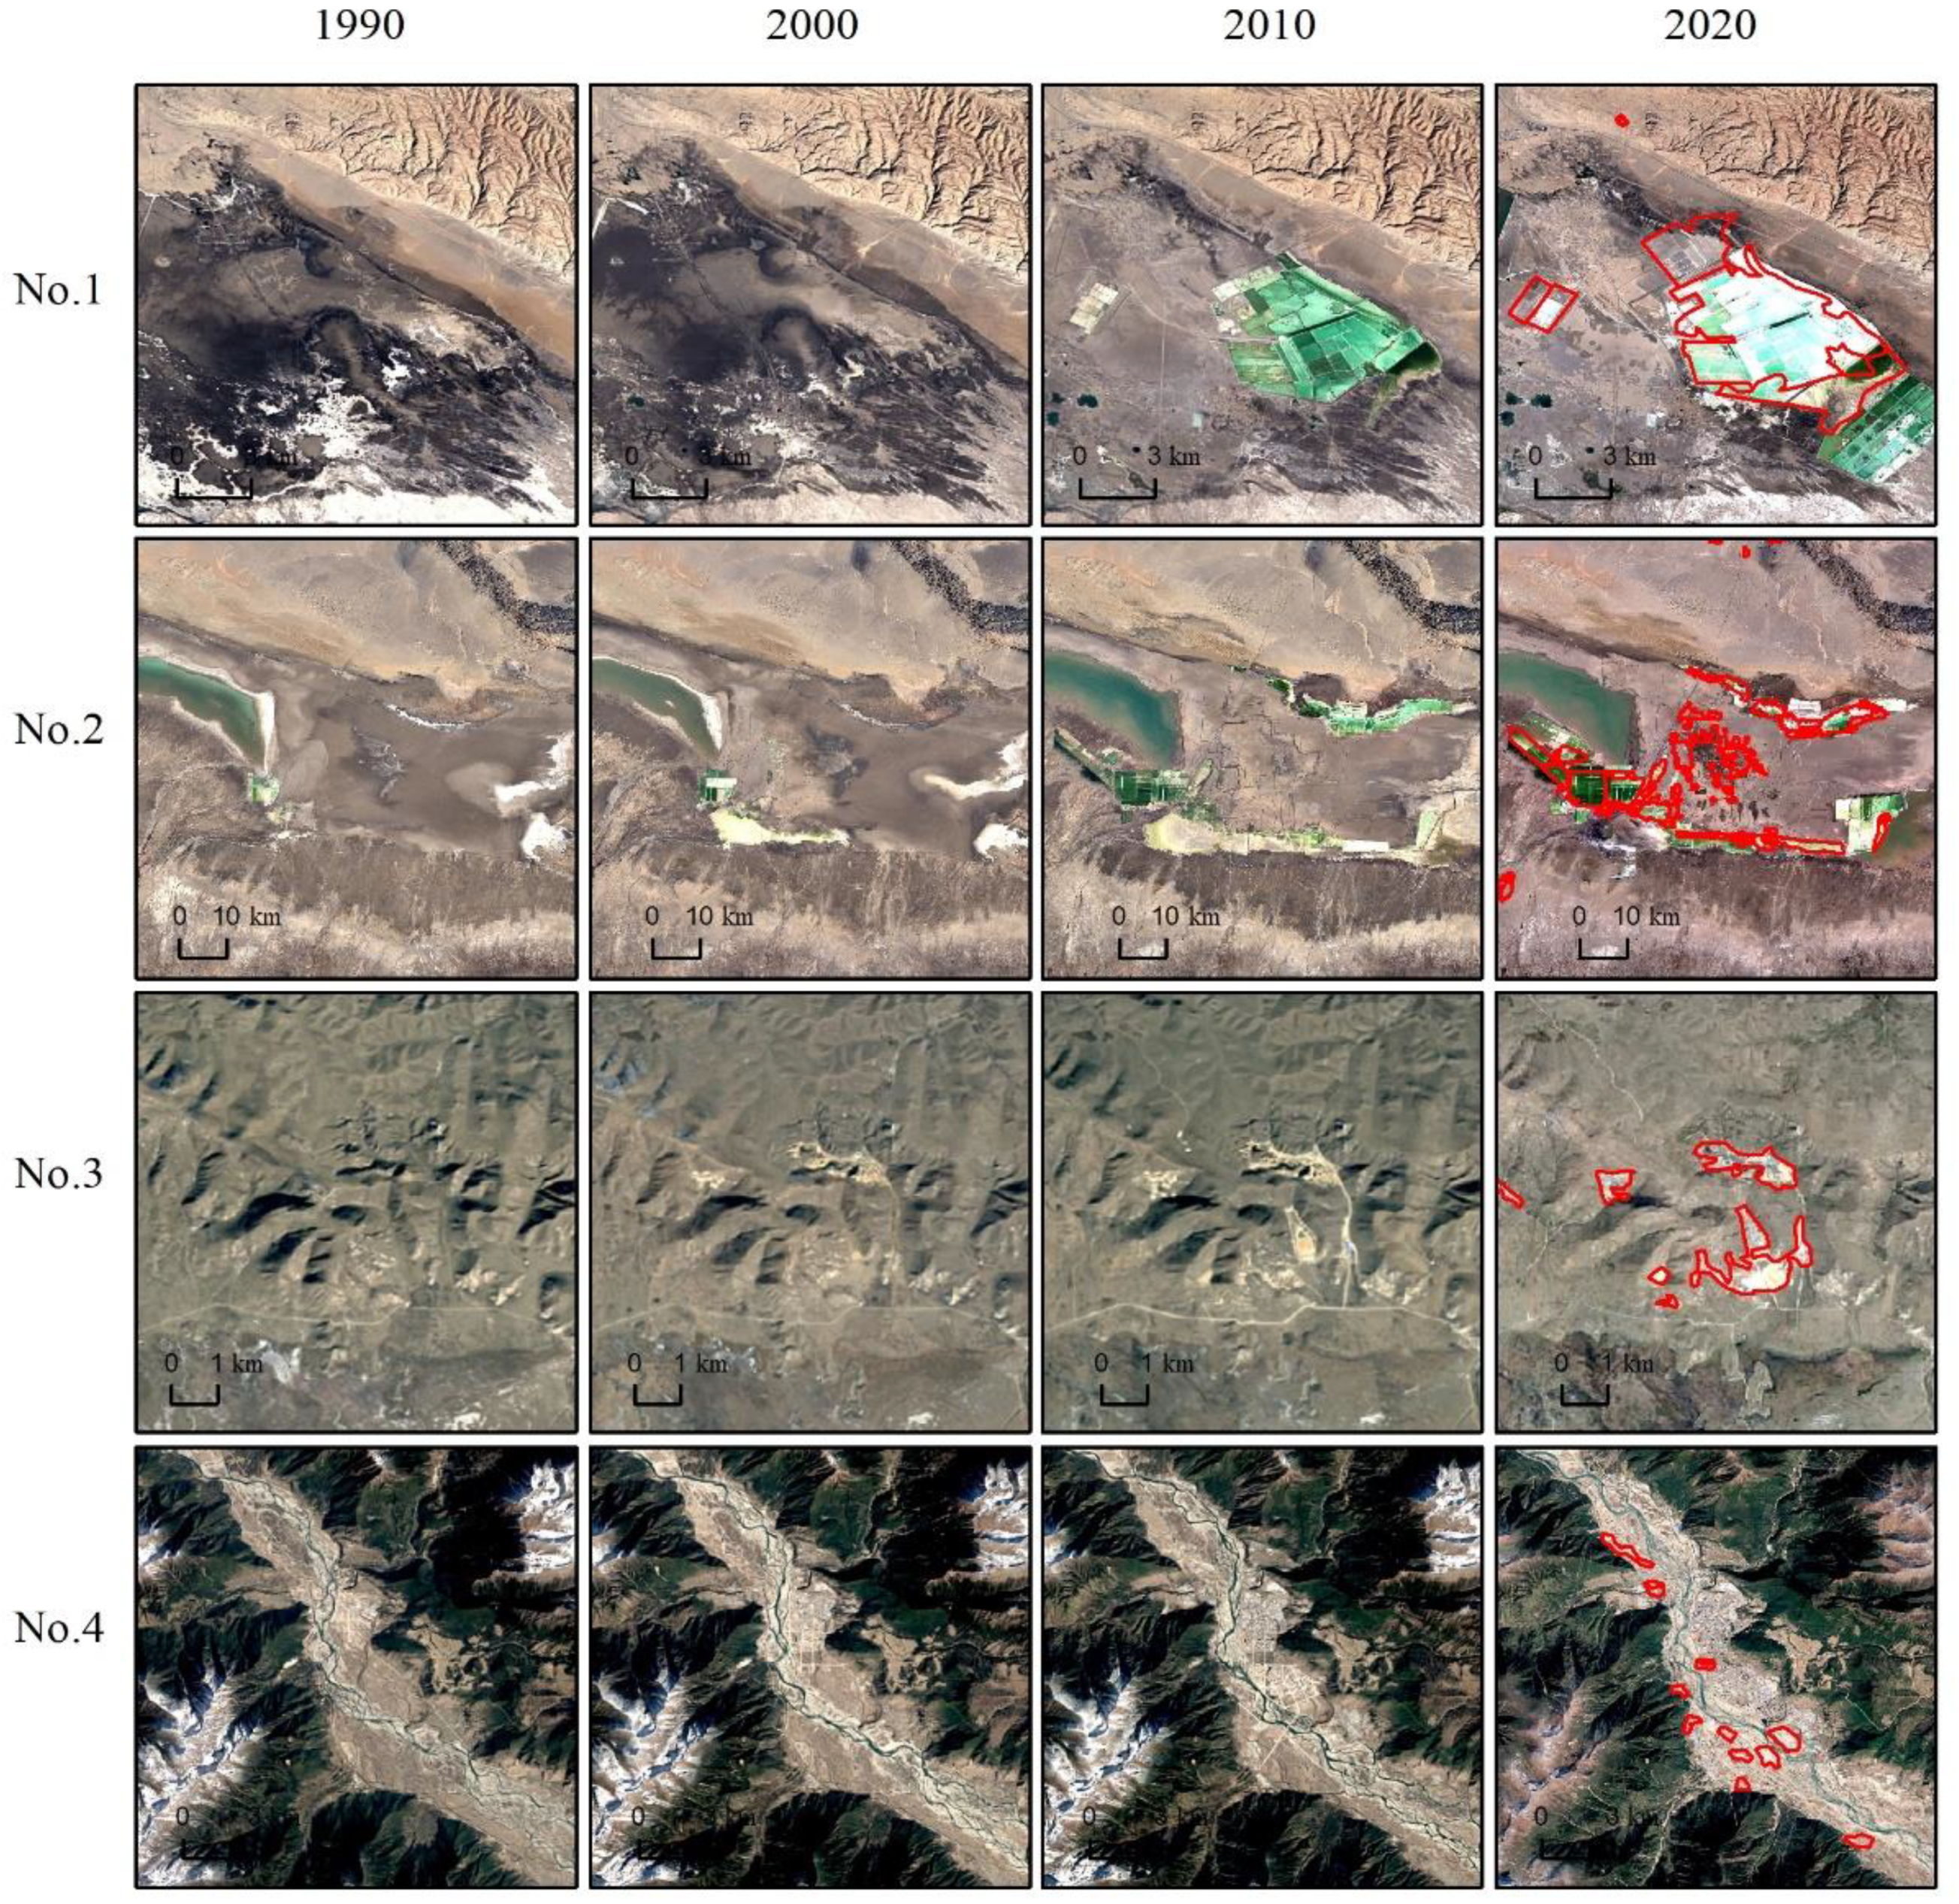
3.1. Distribution and Expansion of Industrial and Mining Land on the Tibetan Plateau

In 2020, there were 1689 mining sites on the TP, with a total area of 968.95 km2, accounting for 0.04% of the total TP; of these, 177 mining sites had an area of greater than 1 km2, accounting for 4.53%. The area of the maximum mining sites was 62.26 km2. The IML was mainly distributed in the mid-east of the TP and along various traffic lines, major cities, county towns, and surrounding areas (Figure 3a), including the G315 National Highway, G219 National Highway, Lhasa City, and Nyingchi. The larger IML was mainly distributed along the national highway G315, specifically in the Golmud City, Gonghe, Haixi Autonomous Prefecture, Dulan, and Tianjun Counties, of which Golmud City covers an area of 160.10 km2, accounting for 16.52% (Figure 3b).
From 1990 to 2020, the total area and patch number of IML exhibited a significant expansion trend (Figure 4a). The total increased area of IML was 842.71 km2 (increased by 285.75% during 1990–2020). The patch number of IML increased by approximately 6.8 times, from 257 in 1990 to 1740 in 2020. The fastest area expansion was from 338.01 km2 (0.01%) in 2000 to 829.77 km2 (0.03%) in 2010 (Figure 4c), with an increased area ratio of 166.24% (about 2.5 times). From 1990 to 2020, the net increase rates of IML’s area were 228.56% (about 3.3 times). In the three periods of 1990–2000 (Figure 4b), 2000–2010, and 2010–2020 (Figure 4d), the area of IML also showed a discrepancy in expansion. The net increase ratios of area were 14.61%, 145.49%, and 16.77% during the three periods, respectively.
The newly added IML was mainly distributed in the northern part of Qinghai Province along with G315 (Germu City), southern Tibet, eastern Sichuan, and Yunnan. The large increased area of IML mainly occurred in the northern TP during 2010–2020. The result of the IML expansion was validated in the Google Earth high-resolution image provided in Figure 5. The IML in Qinghai Province, which has been preferentially mined, decreased during 2010 and 2020, similar to the IML in Golmud City. Notably, the reduced proportion of IML in the past five years is higher than that in the earlier 10 years, and has mainly occurred in the Xinjiang-Qinghai section along the G215.
According to the change transfer matrix of IML (Figure 6), from 1990 to 2020, approximately 842.71 km2 of other types were transformed into IML, accounting for a net increase ratio of 58.77%. Among the transferred types, the IML mainly encroached on low-coverage grassland, marshland, saline land, mid-covered grassland, and sandy type, accounting for 15.06%, 5.63%, 5.38%, 8.22%, and 8.06% of the total IML area, respectively. Approximately 168.65 km2 of IML was transferred to other land use types, and the net reduction ratio was 18.65% (mainly in reservoir pits and marshes), accounting for 12.94% (Figure 6a).
The area and proportion of IML imported from other land covers during the three periods 1990–2000, 2000–2010, and 2010–2020 were 338.01 km2 (12.80%), 829.77 km2 (53.41%), and 727.49 km2 (38.71%), respectively. In the two periods of 1990–2000 and 2000–2010 (Figure 6b,c), marshland, saline land, and low-coverage grassland were the three land cover types with higher proportions occupied by IML. In 2010–2020, the types from other transfers into IML gradually increased, with an area of more than 1% occupying 10 types (Figure 6d). The area of low-coverage grassland increased significantly, and occupied the most area among all the land use types, whereas the areas of marshland and saline land types decreased.
Among the transfers from IML to other land types, from 1990 to 2000, the proportion was very low (all below 0.1%). During 2000–2010 and 2010–2020, the area of IML converted to other types increased, particularly during 2010–2020, when about 28.40% of IML was converted to other types, and the proportion of IML converted to reservoir pits and marshes reached 20.52%. During 2000–2010, approximately 6.45% of IML was converted to other land cover types, such as saline land, low-coverage grassland, reservoir pits, lakes, and urban land.

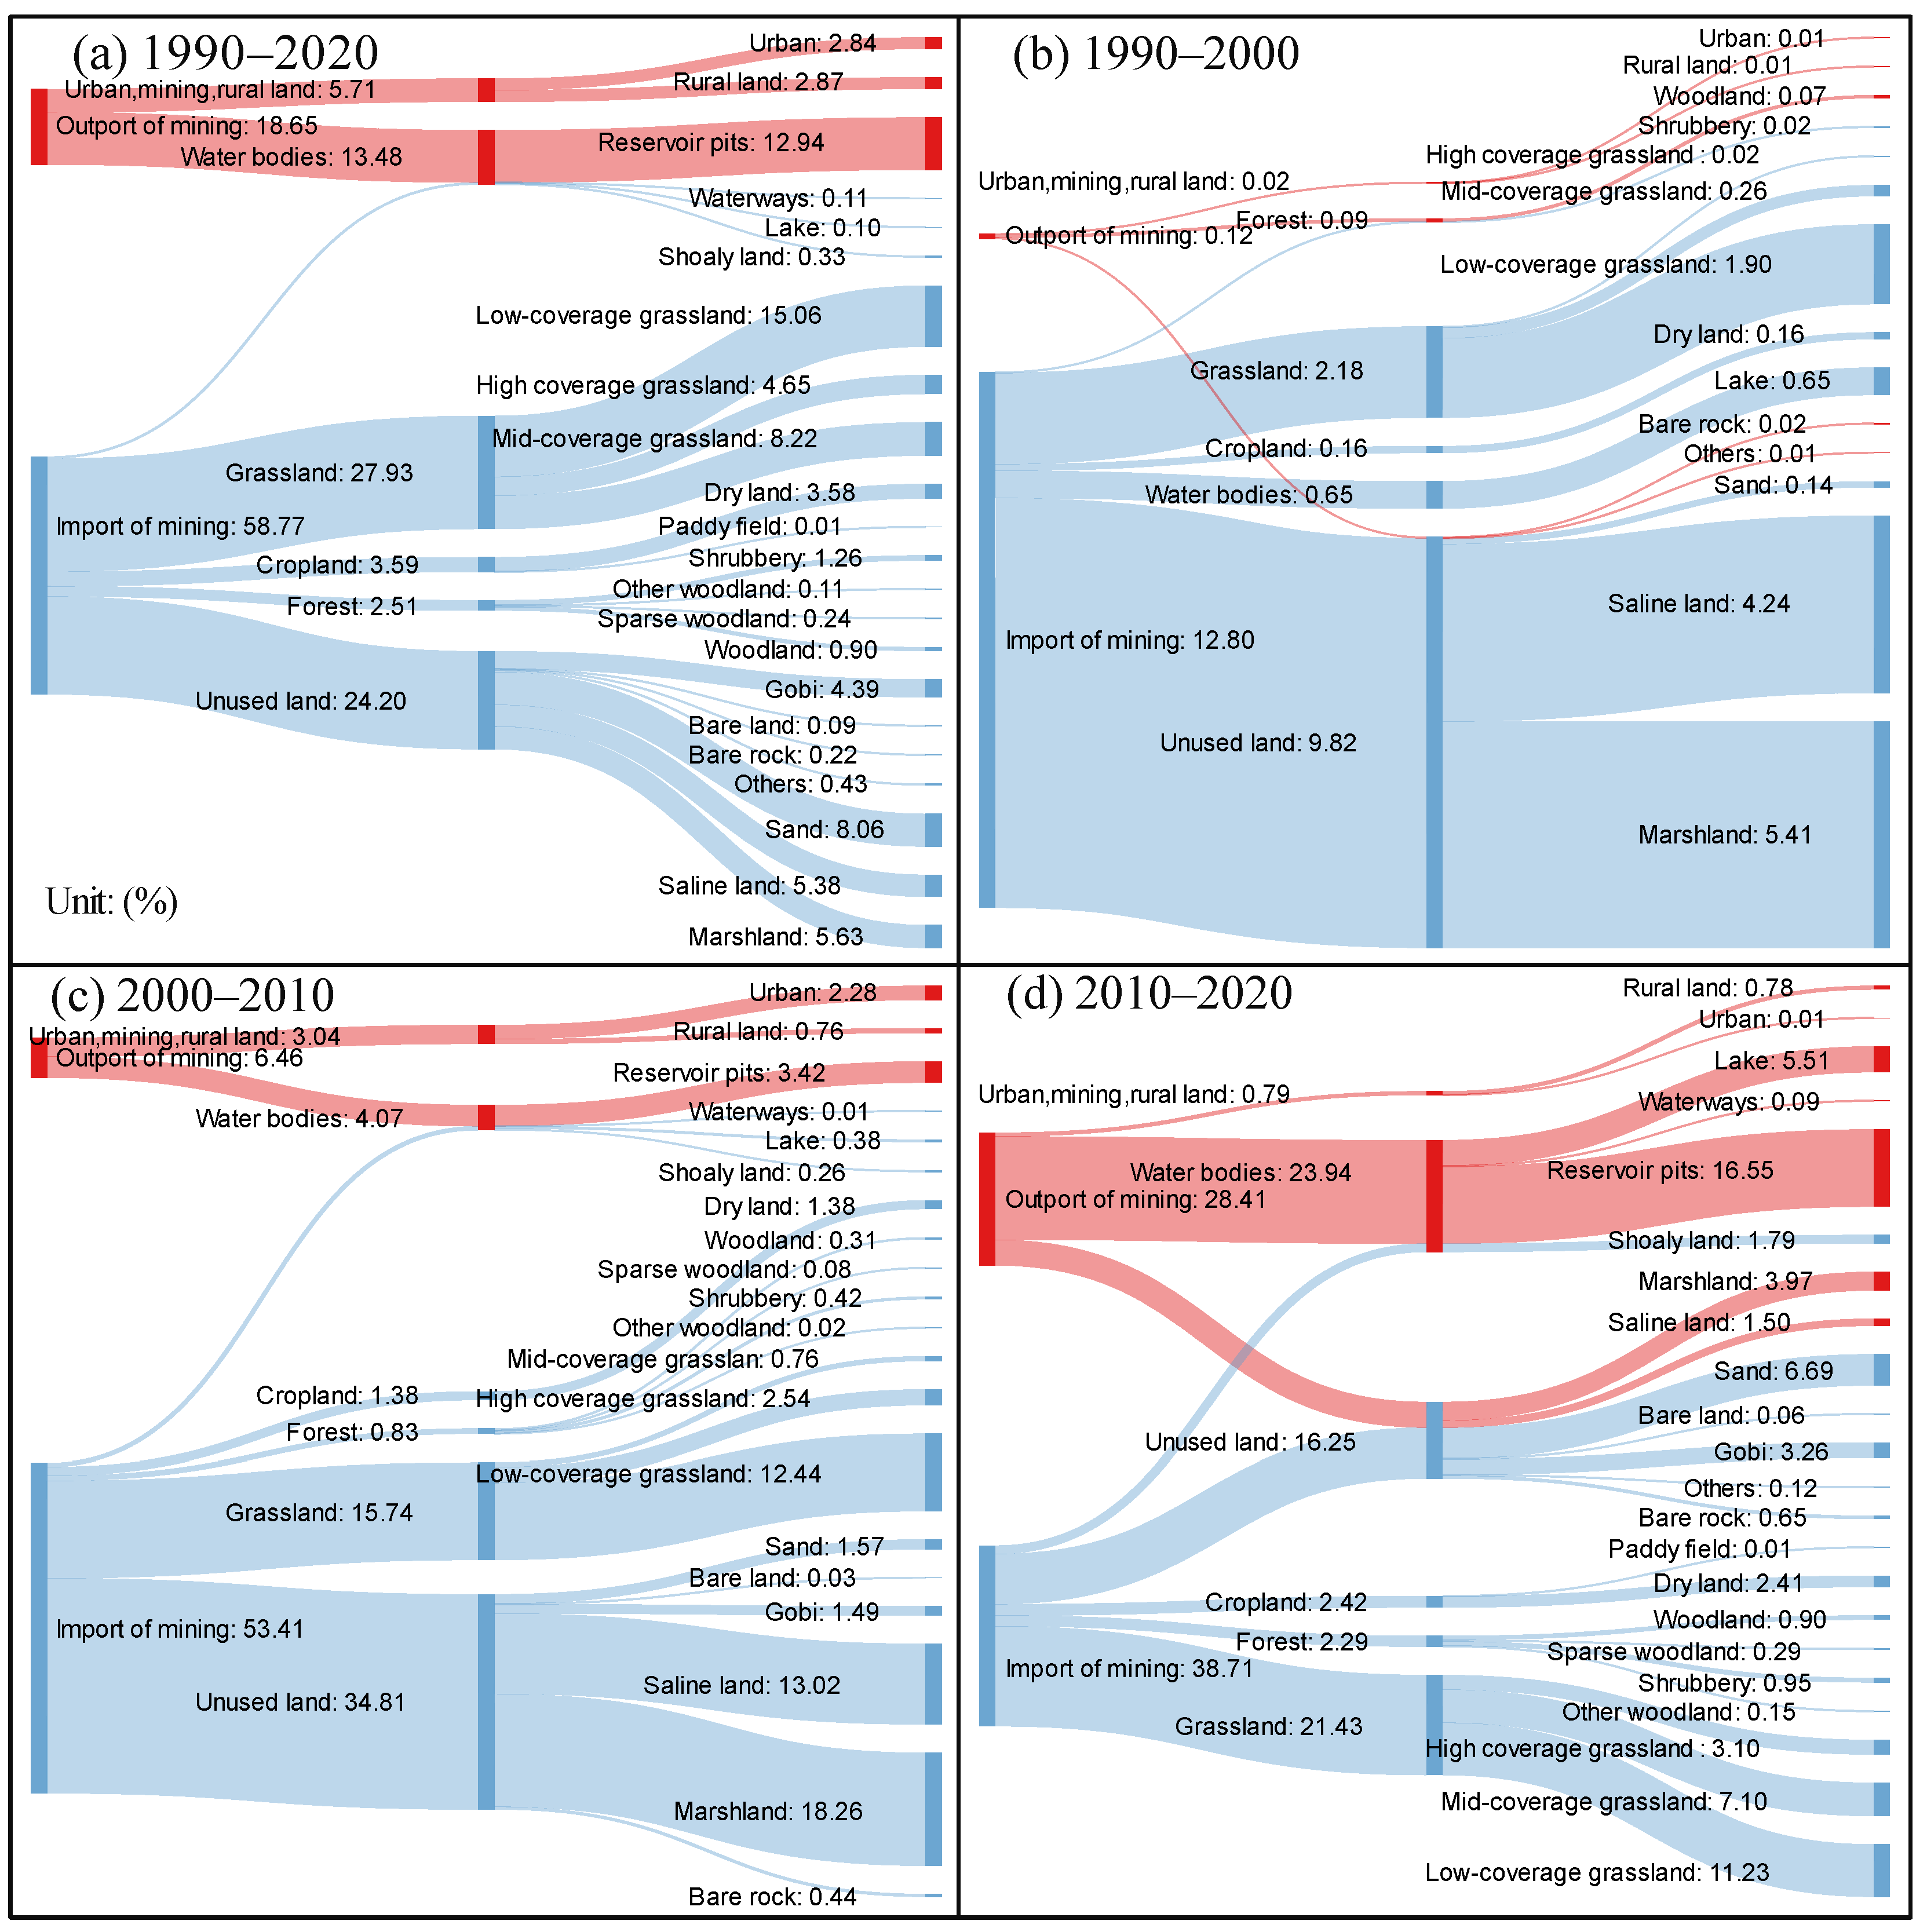
3.2. Landscape Change in Industrial and Mining Land

It can be seen from the landscape index of IML in Figure 7 that the NP, SPLIT, LSI, and PAFRAC indices displayed a distinct upward trend, all of which were at their lowest in 1990 and reached a peak in 2020. Compared to 1990, by 2020, the NP, SPLIT, LSI, and PAFRAC increased by 3.59, 2.70, 1.90, and 1.02 times, respectively. This suggests that the degree of fragmentation of the IML increased, and the shape of the patch in the IML tended to be complicated and irregular.
Between 1990 and 2000, all indicators exhibited a slight upward trend. However, during 2000–2010, the IML increased continuously, and the index displayed a pattern of an accelerated increase. With the continuous expansion of the IML, the LPI index showed an evident upward trend. It is worth noting that, after 2010, although the area of the IML continued to increase, the type of land cover converted to IML was more diversified.
From 1990 to 2020, the NP of the newly added IML was higher than the average of the entire mining region, whereas the NP of the reduced area and the stable area was much lower than the average of the NP (Figure 7a). The LSI value of 15.83 in the newly added IML was also evidently higher than the average of 11.88. Notably, the LPI value of the reduced IML (43.51) was much higher than the average of the IML of 18.93, whereas the LPI values of the newly added (13.89) and stable areas (10.69) were lower than the average of the IML (Figure 7b).
Comparing the changes in the landscape index of IML in three different regions during three periods, it was found that the values of the landscape index, such as the LSI, in newly added areas were far higher than the average of the 1990–2020 value, but inverse to that of the reduced area. For example, during 2000–2010, the LPI of the newly added area was approximately two times higher than that in 1990–2020.

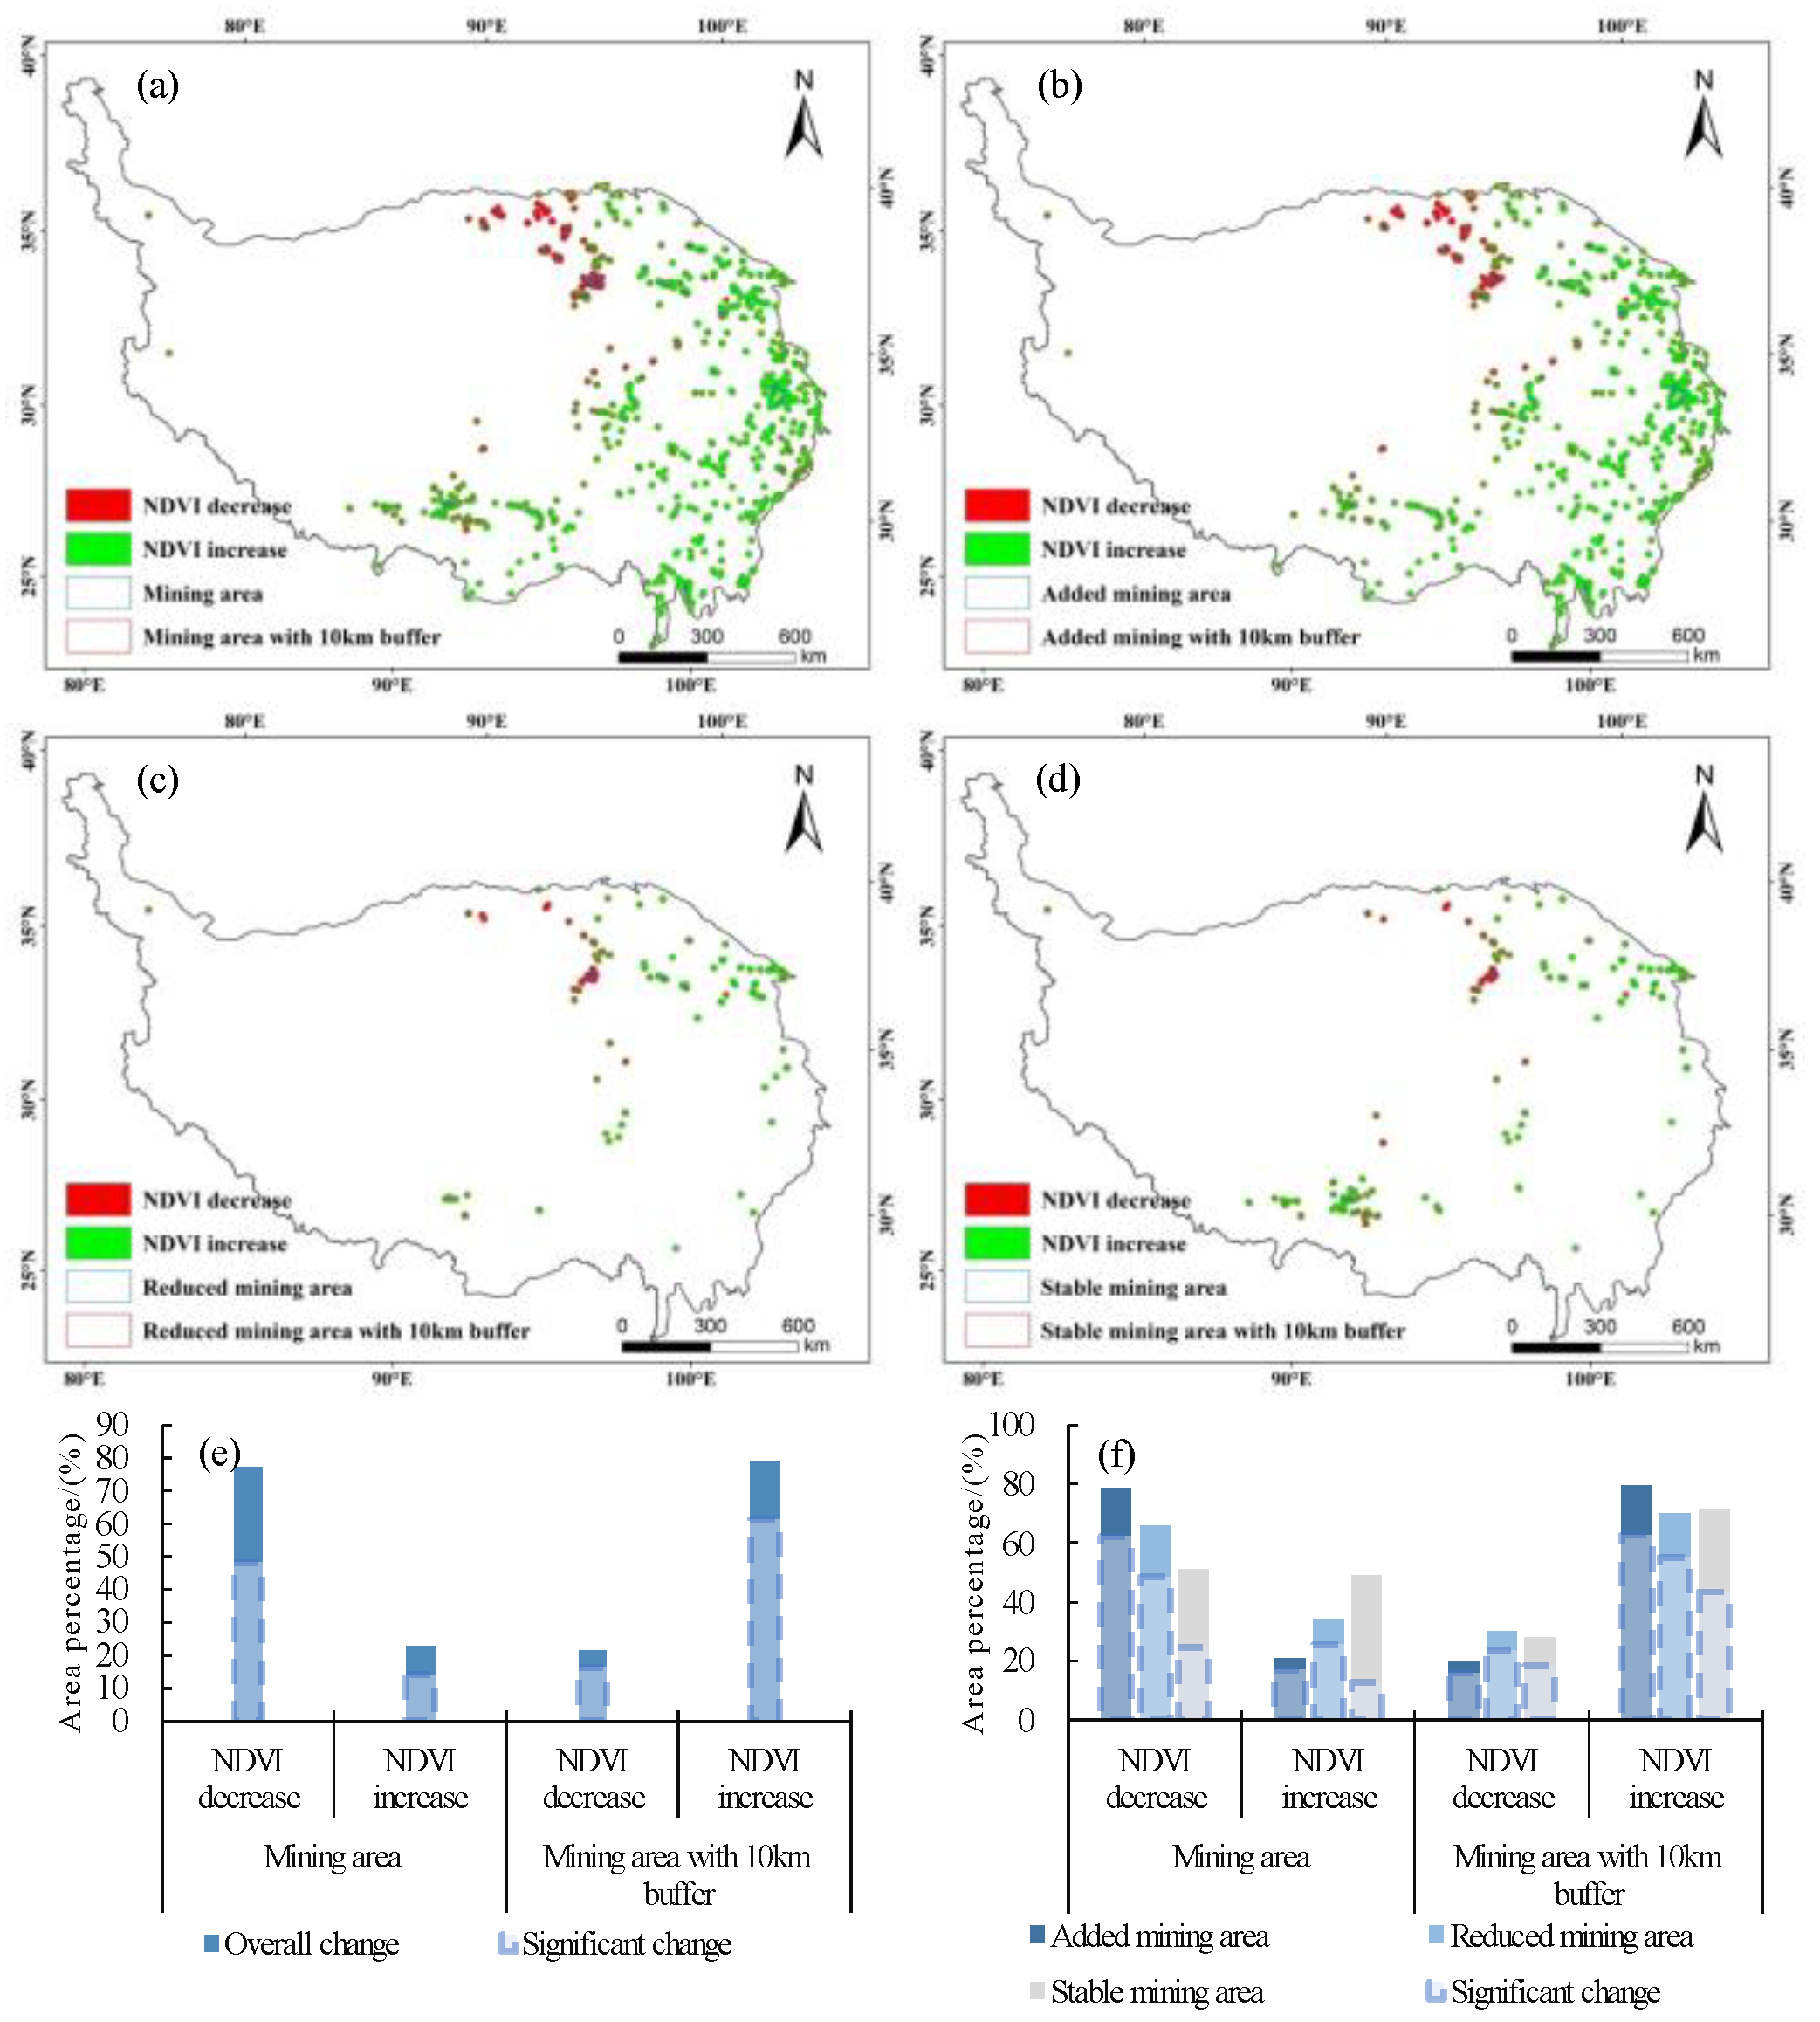
3.3. Comparison of Normalized Difference Vegetation Index Changing Trends between Industrial and Mining Land and its 10 km Buffer

From 1990 to 2020, the NDVI of the IML displayed a decreasing trend, with a decrease of 452.53 km2 (77.34%) in the area. However, the NDVI within the 10 km buffer of IML increased, with an increase of 1.30 × 10⁵ km2 (76.51%) (Figure 8). The area ratio of the decreased NDVI of 77.34% was higher than the increased NDVI of 21.33% in the newly added IML. However, within the 10 km buffer area of the newly added IML, the area ratio of the increased NDVI (79.74%) was higher than that of the decreased NDVI (20.26%).
This shows that the newly added IML has prominent negative effects on the vegetation, but the effect of mining activities on vegetation can be ignored when the vegetation distance to the IML is about 10 km. In addition, the number of IML areas having an increase in NDVI (52.01%) was significantly higher than the number in which NDVI decreased (2.30%) in the newly added IML, indicating that most of the new added IML areas do not cause substantial disturbances to the vegetation, but the larger the newly added IML, the stronger the negative effect on the vegetation. Therefore, the surrounding vegetation in the newly added larger-area IML in Lhasa and southeastern Tibet mainly decreased, whereas the surrounding vegetation in the newly added smaller-area IML in Qinghai did not exhibit a prominent decreasing trend.
The vegetation in the reduced IML area and within the 10 km buffer area of the reduced IML was better than that in the newly added IML. Overall, 65.59% of the vegetation NDVI exhibited a decreasing trend in the reduced IML. The decreased vegetation NDVI was mainly distributed along the highway road of the G315 line in Qinghai Province, especially in Golmud City. This illustrates that the IML evolved from emerging to shrinking, and that the negative influence on vegetation was decreasing.
For stable IML, the vegetation NDVI was better than that of the newly added and reduced IML. The vegetation in the stable IML showed no significant decreasing trends. In addition, the number of IML areas in the 10 km buffer zone of stable IML (showing increasing trends of vegetation NDVI) was also higher than that of the newly added and reduced IML.
From 1990 to 2000, the number and size of the IML areas were stable. The overall trend of vegetation NDVI in newly added areas mainly decreased, but in the reduced area, the NDVI increased. The difference between the three time periods was reflected in the change in vegetation NDVI in the stable area. From 1990 to 2000, the decreased vegetation of the stable IML area was slightly higher than the increased vegetation, but opposite in the other two time periods. The vegetation change in the 10 km buffer zone was homogeneous with respect to the different time periods. Within 10 km, there was no specific impact on the vegetation of the IML (Figure 9).
Comparing the differences in NDVI changes in mining sites during 2000–2010 and 2010–2020, it was found that the faster the area expansion of IML, the higher the proportion of vegetation NDVI decrease. For example, the area proportion from 2000 to 2010 of decreased NDVI (81.04%) in the newly added IML was 11.99% higher than that in 2010–2020 (69.05%). However, the decreasing trend of vegetation NDVI in the 10 km buffer zone was not distinct. In contrast, in 2010–2020, the proportion of IML expansion was low, but the proportion of decreased NDVI in the 10 km buffer zone of the newly added IML was high (Figure 9).

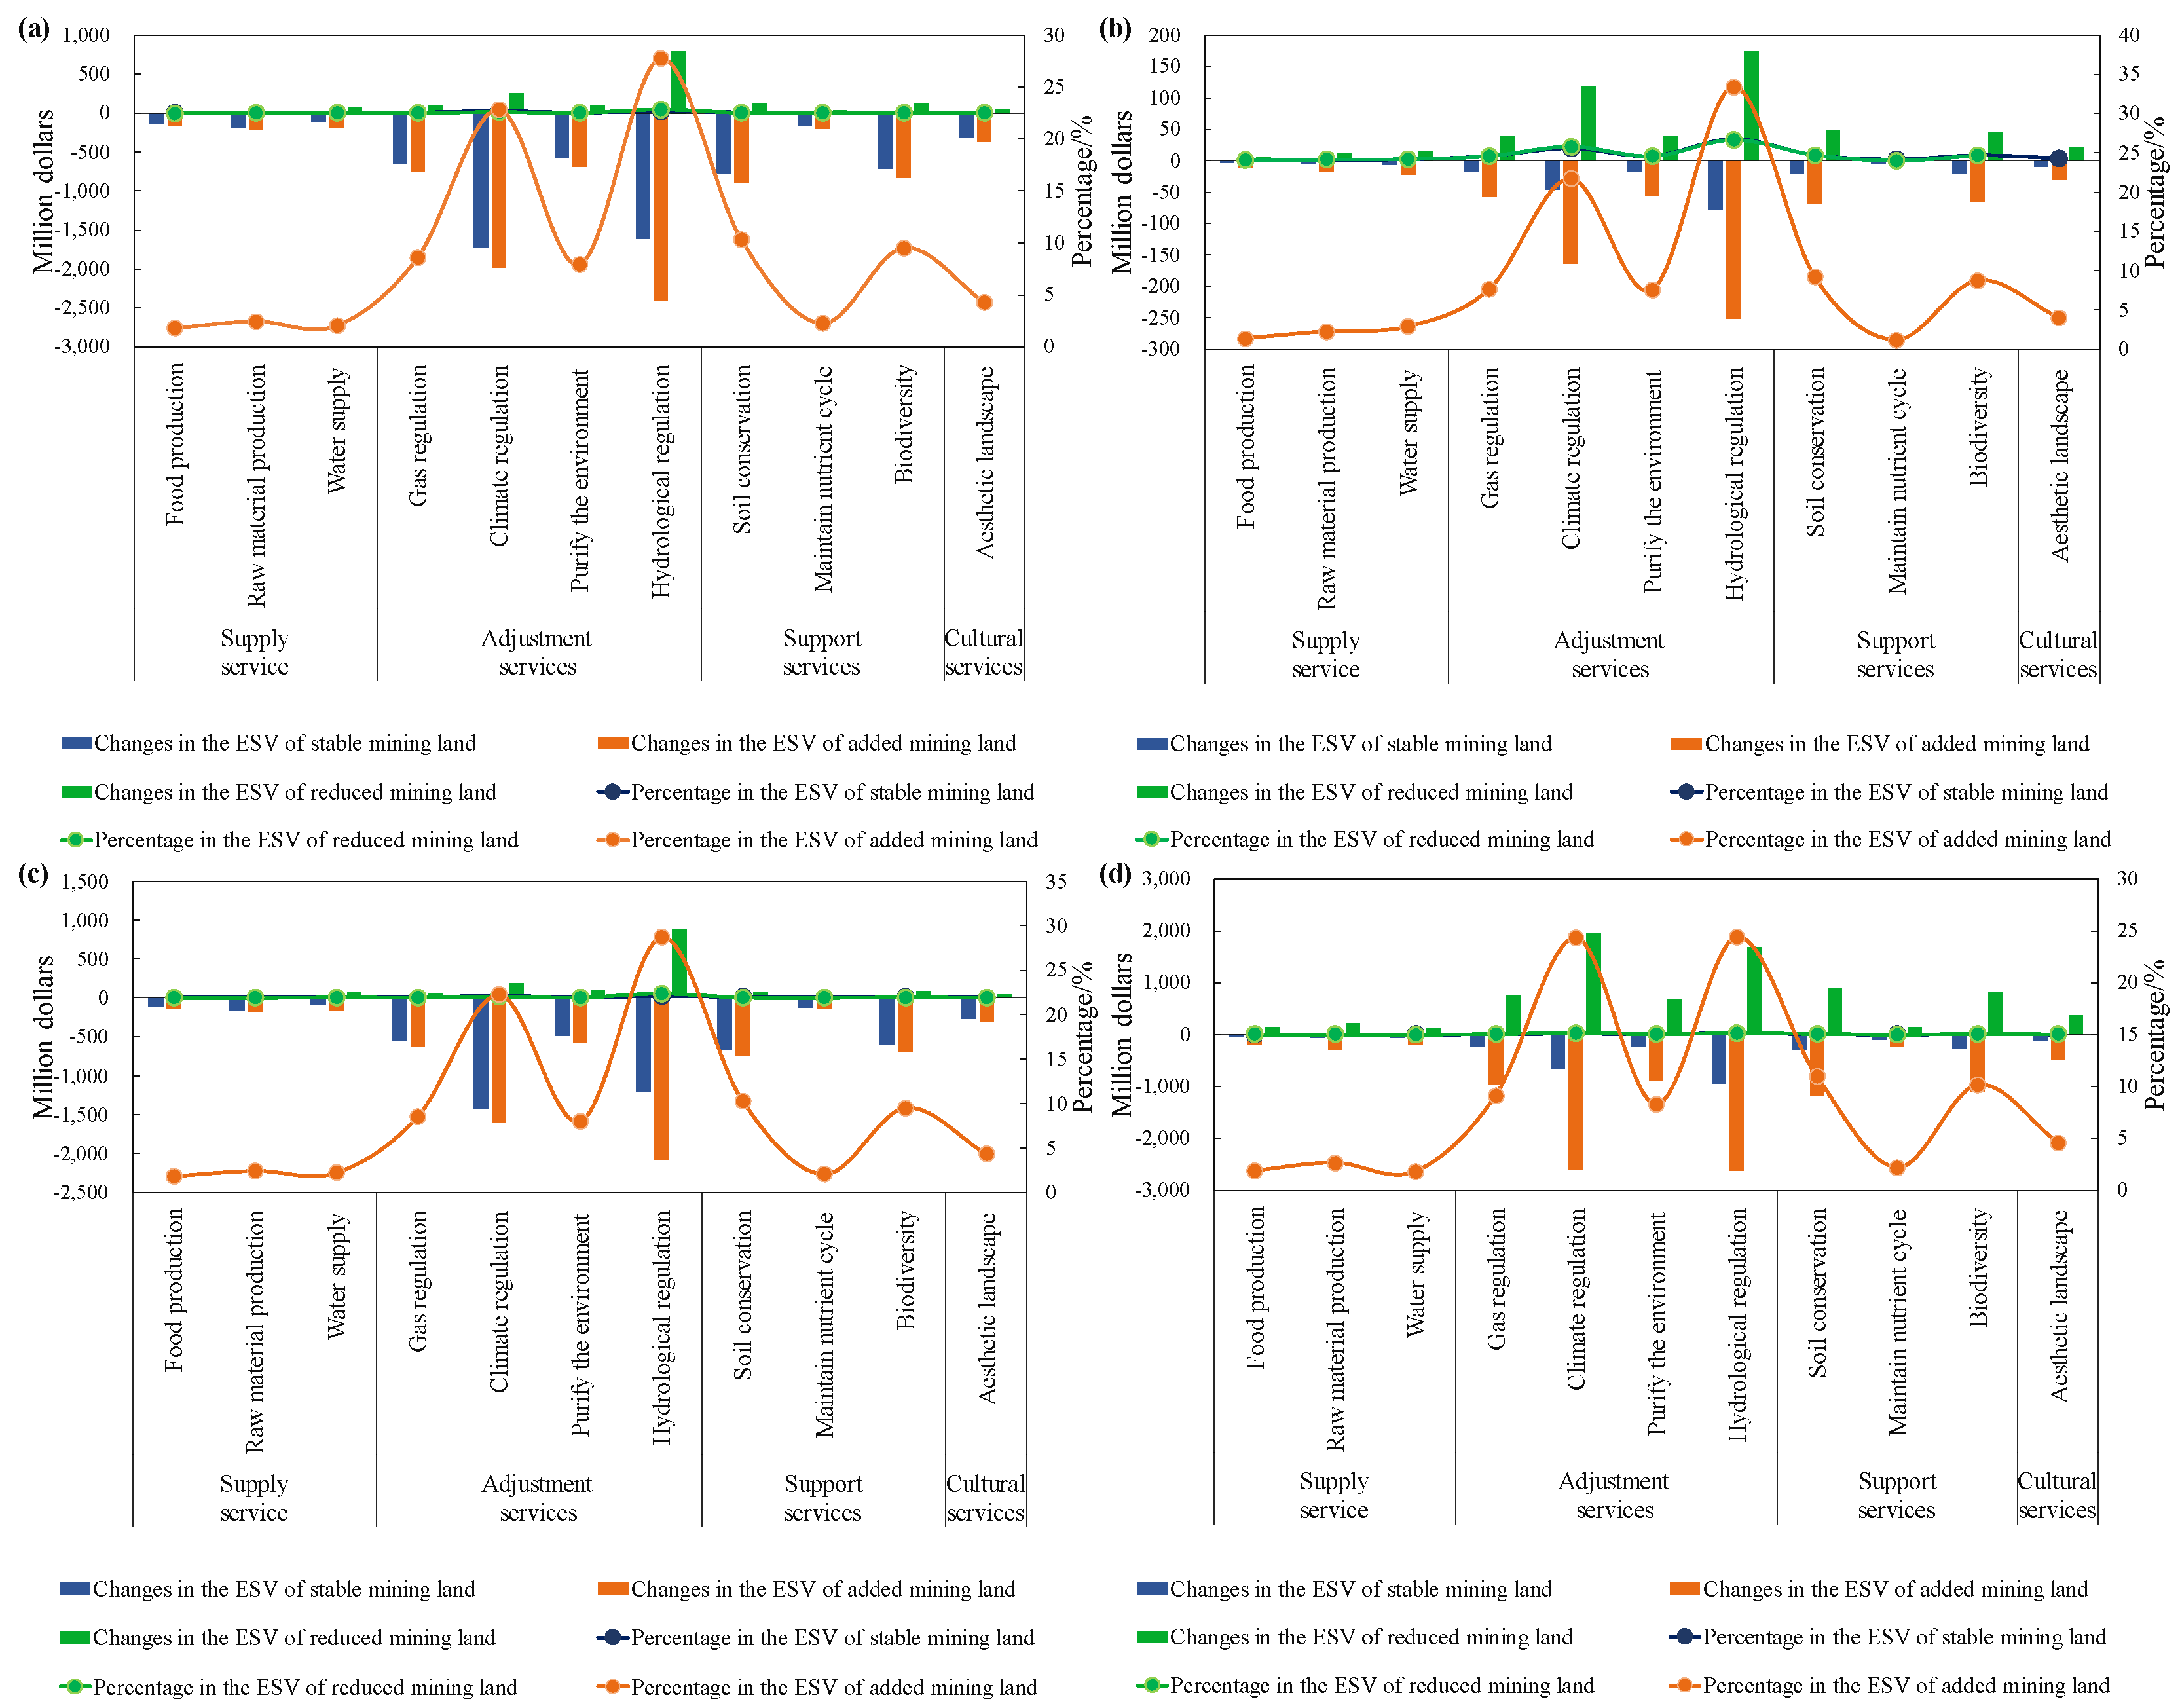
3.4. Differentiation of Ecological Services Value in Industrial and Mining Land and Its 10 km Buffer

From 1990 to 2020, the change in IML reduced the total ESV by USD 6969.31 million (Figure 10a). Climate regulation, hydrological regulation, soil conservation, and biodiversity were the main types of ESV reduction, having reductions of 24.66%, 23.14%, 11.21%, and 10.23%, respectively. Due to the expansion of IML, the ESV decreased by USD 8649.90 million, and the proportion of hydrological regulation and climate regulation decreased by 27.74% and 22.85%, respectively. As the IML was converted into non-mining land, the total ESV increased by USD 1680.59 million, mainly increasing the value of hydrological regulation, accounting for 46.84%, followed by climate regulation with an increasing ratio of 15.32%.
It was found that the ESV was generally reduced in three periods (1990–2000, 2000–2010, and 2010–2020), with decreases of USD 226.57 million, USD 5682.71 million, and USD 3059.29 million, respectively. From the perspective of reduced types of ecological services, the reduced ecological value was mainly concentrated on three types of actions: hydrological regulation, climate regulation, and soil conservation. Among these, the value of hydrological regulation decreased by 34.03%, 21.21%, and 30.9 4% during 1990–2000, 2000–2010, and 2010–2020, respectively. The proportion of climate regulation was also reduced by more than 20%, and the proportion of soil conservation ecological services was reduced by approximately 10% (Figure 10b–d).
Within the 10 km buffer zone of the IML, the ESV generally displayed an improving trend from 1990 to 2020, having a total increase of USD 61,207.99 million (Figure 11a). The increase in the proportion was mainly due to the value of climate regulation and hydrological regulation, accounting for 26.36% and 21.69%, respectively. The value of each ecological service within 10 km of the newly added IML also increased, with an overall increase of USD 58,086.66 million. With regard to ecological types, hydrological regulation (27.74%) and climate regulation value (22.85%) prominently increased. Within the 10 km buffer of the reduced IML, the ESV of each ecological type also increased, but the improved ESV in the reduced IML was much lower than that of the ESV in the newly added IML, and the overall increase was USD 3121.33 million.
During the three time periods, the ESV of the IML within 10 km in 1990–2000 and 2010–2020 increased by USD 577.28 million and USD 41,010.82 million, respectively. From 1990 to 2000, the type of ecosystem service with the largest increase in value was hydrological regulation, at approximately USD 203.85 million (35.31%). The difference between the areas surrounding newly added and reduced IML was not substantial. In 2010–2020, the increase in the ESV was 66 times that of 1990–2000, and the increase in the ESV around the newly added IML was 8.9 times that of the reduced IML. The maximum increases in climate-adjusted ecological services in the periphery of the newly added and the reduced IML were USD 10,232.17 million (27.74%) and USD 1145.89 million (27.68%), respectively (Figure 11b–d).

4. Discussion

4.1. Expansion of Industrial and Mining Land and Its Effects on Ecological Services Value

The three stages of IML area change are closely related to the economic development in China (Figure 12). China’s mining expanded remarkably from 1990 to 2020, with an increase of 2.7 times [39,48]. On the TP, during the period 1990–2000, the IML area was in a weaker stage of development. From 2000–2010, with the rapid development of the economy, industrial activities became more common, with an expansion rate of 3.4 times, resulting in the accelerated decrease in NDVI and ESV in IML in this period (Figure 8 and Figure 10).
Since the 21st century, the TP has experienced a rapid increase in the area of IML due to the development of the Western region, the strategic shift of the national mineral resources, and the construction of the Qinghai–Tibet Railway. With the increase in road network density, more convenient transportation has indirectly promoted the development and utilization of IML. In addition, the added value of the secondary industry of Qinghai and Tibet also exhibited distinct increasing trends from 1990 to 2020 (Figure 12), prompting the demand for mineral and fossil fuel resources to grow, which stimulated the rapid development of the mining industry, and, in turn, promoted the rapid development of the social economy. The ESV showed an increasing trend in the TP, which is consistent with the results obtained by [49]. Although IML has a significant negative impact on ESV [50,51], when it occurred on the whole TP, its impact was limited (Figure 12), and a similar result was found in the Shanxi coal mine [52]. It can be interpreted that, despite the rapid expansion of IML, the proportion of IML was still relatively low on the TP, and the mining impacts were under the tolerable threshold.

4.2. Effect of Expansion of Industrial and Mining Land on Vegetation Index

In this study, the results indicated that IML on the TP caused a gradual increase in landscape patches and landscape fragmentation, and a gradual decline in landscape connectivity. Similar results have been reported in other typical mines, such as in Inner Mongolia [53]. Simultaneously, the NDVI trend displayed a significant decrease in IML; however, an increasing trend was detected during 1990–2020 in the 10 km buffer of IML. This suggests that the mining expansion over the last 30 years has caused deterioration in mining vegetation on the TP. However, the impact distance of the IML on the ecosystem in this study was generally within 2 km, and as the altitude increased, the distance increased to 4 km. Previous research also mentioned that the impact range of IML was mainly concentrated in the range of 1–5 km [25], which indicated that the influence of IML on vegetation was in the conventional range.
The vegetation is more fragile in the TP than in other areas in the east, and the negative impact of the IML on vegetation was similar to that associated with the observed expansion of urban land in the eastern region [50]. The expansion of urban land in the east radiates to a buffer zone [54]. The difference between urban land and IML is that urban land is generally more concentrated and much larger than the IML. Although the impact of urban land on vegetation is higher than that of IML, urban land has a significant enhancement effect on vegetation due to the heat island effect and climatic factors, which offset the reduction in vegetation caused by about 40% of the land distribution and occupation [10,55]. From one point of view, the trend of vegetation reduction in the IML during the stabilization period is significantly smaller than that in the newly added and reduced IML. It also suggests that the negative impact of the development of IML on vegetation is higher than the impact on the vegetation of stable IML. This conclusion is supported by previous research results [25]. Similar research has found that the impact of IML on the ecosystem has different levels of severe, moderate, and mild impacts [25]. However, the IML accounts for a small proportion and has a small impact on the ecology of TP. Nonetheless, the IML area is growing rapidly and more attention should be paid to it.
In the study area, it was found that the rapid expansion of mining operations on the TP had a strong correlation with ongoing NDVI decrease. The expanding mining industry may be an important stressor of the overall health of the local ecosystem, especially for the factors we examined. The vegetation is turning green under conditions of warming, increased precipitation, and human engineering activities on the TP. However, some of the easily overlooked vegetation has a browning trend. Although climate change is the most important cause of vegetation change [8], with respect to the TP, studies have concluded that human activities play an important role in the degradation of vegetation [56]. In addition, grazing activities are important human factors affecting the vegetation of alpine grasslands, and the impact of grazing activities on vegetation is not a simple linear relationship [57]. However, our results suggest that mining activity is also one cause of the vegetation degradation in the IML. In particular, in 2000–2010, the area of IML expansion was synchronous with the decline in vegetation NDVI. The results of this study are similar to those of Hou et al. (2019) and Firozjaei et al. (2021) [21,58]. In Hou’s study, the disturbance effect of vegetation was similar in the IML, recovery area, and control area, and the negative impact of the IML on vegetation was distinctly higher than that of the other contrastive areas [59]. The expansion of the IML is dominated by the occupation of low-coverage grassland and marshland, which have higher vegetation coverage than other land cover classifications, and the reduction in the high coverage type is one of the main reasons for the decrease in the NDVI in the area of the IML. This results in serious health problems due to the expansion of lithium and coal mining [60]. In addition, except for the direct effect of vegetation degeneration, the potential role of mining activities, such as urban expansion-induced cropland displacement, potentially leading to the loss of forest area elsewhere, should be noted [61].

4.3. Limitations and Future Outlook

The NDVI used in the research is not an intrinsic physical quantity, although it is indeed correlated with certain physical properties of the vegetation canopy. However, this characteristic will lead to bias in the results. As such, vegetation indices are highly useful measurements despite their limitations [62]. In particular, on the Tibetan Plateau, which has a sparse population and low economic vitality, data are deficient. Therefore, the NDVI is known to be an effective index for representing vegetation greenness, such as in vegetation productivity research on the Tibetan Plateau [63], and for identification of variations and responses of vegetation to climate change on the Tibetan Plateau [64]. Therefore, in future research, it may be possible to develop a comprehensive vegetation index that is more conducive to the study of plateau vegetation, such as that seen in existing exploratory studies of a unified vegetation index [65].
In addition, although the economic value of a standard equivalent value factor of ecosystem services has been revised multiple times since Costanza proposed and revised it in 1997 and 2014, respectively [66,67], it is a macro-regional measurement index, and factors vary in different regions and different years. In this study, although the regional revision coefficient of EVF was revised using grain per unit area in the TP [44,45], there are also a large number of uncertainties that exist in the revised EVF in the TP, such as the impact of inflation. Therefore, more related factors need to be considered in future research.

5. Conclusions

Economic development and rapid expansion of the IML have a bidirectional effect, resulting in a complex ecosystem impact on the TP. In summary, this can be reflected as follows. First, the expansion of IML on low-coverage grasslands resulted in the reduction in the ESV of the IML. However, its influence was mainly concentrated in the IML, and there was no evident impact on the vegetation and ESV in the 10 km buffer zone. Second, the expansion of the IML also intensified landscape pattern fragmentation, especially in the newly added IML. Third, the number of grid cells of the vegetation NDVI having a decreasing trend was greater than that having an increasing trend in the newly added IML. Although it is intended that IML has a limited negative impact on vegetation on the TP, to improve the sustainable use of IML, we suggest that more attention must be paid to the newly added IML because of the more fragile ecosystem of the TP. In addition, regarding the stable IML during the past 30 years, reasonable measures should be taken to repair its impact on the surrounding environment.

Supplementary Materials

The following are available online at https://www.mdpi.com/article/10.3390/rs14040872/s1, Table S1: Landscape indicators and their descriptions; Table S2: Revised EVF of ecosystem type in 1990; Table S3: Revised EVF of ecosystem type in 2000; Table S4: Revised EVF of Tibetan Plateau of ecosystem type in 2010; and Formula S1–S19.

Author Contributions

Q.L.: Methodology, Software, Visualization, Data curation and Writing—original draft, Writing—Review & editing. Y.Z.: Conceptualization and Supervision. X.W.: Writing—Review & editing, Language check. S.L.: Writing—Review & editing. All authors have read and agreed to the published version of the manuscript.

Funding

This work is supported and funded by the Second Tibetan Plateau Scientific Expedition and Research (Grant No. 2019QZKK0603), Strategic Priority Research Program of the Chinese Academy of Sciences (Grant No. XDA20040201).

Data Availability Statement

The data presented in this study are available in article and Supplementary Materials.

Acknowledgments

Thanks to Binghua Zhang for help downloading the Google images. Thanks to the satellite remote sensing data and statistic data sharing platform.

Conflicts of Interest

The authors declare that they have no known competing financial interest or personal relationships that could have appeared to influence the work reported in this paper.

References

  1. Shou, S.W.; Wei, Z.; Dan, W.X.; Yu, X.L.; Adjei, K.; Amaning. Research on Ecological Carrying Capacity and Sustainable Development in Tibet; China Environmental Science Press: Beijing, China, 2015. [Google Scholar]
  2. Kumar, A.; Maiti, S.K. Assessment of potentially toxic heavy metal contamination in agricultural fields, sediment, and water from an abandoned chromite-asbestos mine waste of Roro hill, Chaibasa, India. Environ. Earth Sci. 2015, 74, 2617–2633. [Google Scholar] [CrossRef]
  3. Ahirwal, J.; Maiti, S.K. Assessment of soil properties of different land uses generated due to surface coal mining activities in tropical Sal (Shorea robusta) forest, India. Catena 2016, 140, 155–163. [Google Scholar] [CrossRef]
  4. Feng, Y.; Wang, J.; Bai, Z.; Reading, L. Effects of surface coal mining and land reclamation on soil properties: A review. Earth-Science Rev. 2019, 191, 12–25. [Google Scholar] [CrossRef]
  5. Borrelli, P.; Panagos, P.; Ballabio, C.; Lugato, E.; Weynants, M.; Montanarella, L. Towards a Pan-European Assessment of Land Susceptibility to Wind Erosion. Land Degrad. Dev. 2016, 27, 1093–1105. [Google Scholar] [CrossRef]
  6. Wong, M. Ecological restoration of mine degraded soils, with emphasis on metal contaminated soils. Chemosphere 2002, 50, 775–780. [Google Scholar] [CrossRef]
  7. Xia, H.; Cai, X. Ecological restoration technologies for mined lands: A review. Ying Yong Sheng Tai Xue Bao 2002, 13, 1471–1477. [Google Scholar]
  8. Chen, B.; Zhang, X.; Tao, J.; Wu, J.; Wang, J.; Shi, P.; Zhang, Y.-J.; Yu, C. The impact of climate change and anthropogenic activities on alpine grassland over the Qinghai-Tibet Plateau. Agric. For. Meteorol. 2014, 189–190, 11–18. [Google Scholar] [CrossRef]
  9. Liu, X.; Pei, F.; Wen, Y.; Li, X.; Wang, S.; Wu, C.; Cai, Y.; Wu, J.; Chen, J.; Feng, K.; et al. Global urban expansion offsets climate-driven increases in terrestrial net primary productivity. Nat. Commun. 2019, 10, 1–8. [Google Scholar] [CrossRef] [Green Version]
  10. Guan, X.; Shen, H.; Li, X.; Gan, W.; Zhang, L. A long-term and comprehensive assessment of the urbanization-induced impacts on vegetation net primary productivity. Sci. Total Environ. 2019, 669, 342–352. [Google Scholar] [CrossRef]
  11. Maus, V.; Giljum, S.; Gutschlhofer, J.; Da Silva, D.M.; Probst, M.; Gass, S.L.B.; Luckeneder, S.; Lieber, M.; McCallum, I. A global-scale data set of mining areas. Sci. Data 2020, 7, 1–13. [Google Scholar] [CrossRef]
  12. Prior, T.; Giurco, D.; Mudd, G.; Mason, L.; Behrisch, J. Resource depletion, peak minerals and the implications for sustainable resource management. Glob. Environ. Change 2012, 22, 577–587. [Google Scholar] [CrossRef]
  13. Winkler, K.; Fuchs, R.; Rounsevell, M.; Herold, M. Global land use changes are four times greater than previously estimated. Nat. Commun. 2021, 12, 1–10. [Google Scholar] [CrossRef] [PubMed]
  14. Obodai, J.; Adjei, K.A.; Odai, S.N.; Lumor, M. Land use/land cover dynamics using landsat data in a gold mining basin-the Ankobra, Ghana. Remote Sens. Appl. Soc. Environ. 2018, 13, 247–256. [Google Scholar] [CrossRef]
  15. Nanos, N.; Martin, J.A.R. Multiscale analysis of heavy metal contents in soils: Spatial variability in the Duero river basin (Spain). Geoderma 2012, 189–190, 554–562. [Google Scholar] [CrossRef]
  16. Upadhyay, N.; Verma, S.; Singh, A.P.; Devi, S.; Vishwakarma, K.; Kumar, N.; Pandey, A.; Dubey, K.; Mishra, R.; Tripathi, D.K.; et al. Soil ecophysiological and microbiological indices of soil health: A study of coal mining site in sonbhadra, uttar Pradesh. J. Soil Sci. Plant Nutr. 2016, 16, 778–800. [Google Scholar] [CrossRef] [Green Version]
  17. Kumi-Boateng, B.; Mireku-Gyimah, D.; Duker, A.A. A spatio-temporal based estimation of vegetation changes in the Tarkwa Mining Area of Ghana. Res. J. Environ. Earth Sci. 2012, 4, 215–229. [Google Scholar]
  18. Liu, S.; Li, W.; Qiao, W.; Wang, Q.; Hu, Y.; Wang, Z. Effect of natural conditions and mining activities on vegetation variations in arid and semiarid mining regions. Ecol. Indic. 2019, 103, 331–345. [Google Scholar] [CrossRef]
  19. Li, J.; Liang, J.; Wu, Y.; Yin, S.; Yang, Z.; Hu, Z. Quantitative evaluation of ecological cumulative effect in mining area using a pixel-based time series model of ecosystem service value. Ecol. Indic. 2020, 120, 106873. [Google Scholar] [CrossRef]
  20. Liu, X.; Zhou, W.; Bai, Z. Vegetation coverage change and stability in large open-pit coal mine dumps in China during 1990–2015. Ecol. Eng. 2016, 95, 447–451. [Google Scholar] [CrossRef]
  21. Firozjaei, M.K.; Sedighi, A.; Firozjaei, H.K.; Kiavarz, M.; Homaee, M.; Arsanjani, J.J.; Makki, M.; Naimi, B.; Alavipanah, S.K. A historical and future impact assessment of mining activities on surface biophysical characteristics change: A remote sensing-based approach. Ecol. Indic. 2020, 122, 107264. [Google Scholar] [CrossRef]
  22. Wang, J.; Dai, J.; Wu, Y. Remote Sensing Survey of the Eco—Geological Environment in the Duolong Mining Area. Tibet. Geol. Explor. 2018, 54, 781–790. [Google Scholar]
  23. Yu, H.; Zheng, Z.; Cheng, S.; Gao, Y.; Yang, G. The Study on Ecological Environment Status and Protection of Mine in Tibet—Taking Placer Gold Mine in North Tibet for Example. J. Sichuan Norm. Univ. 2011, 34, 260–266. [Google Scholar]
  24. Lu, Y.; Hao, W.; Cai, L. Review of remote sensing investigation of mineral resources development status in eastern Tibet. Geol. Surv. Chin. 2016, 3, 35–40. [Google Scholar]
  25. Wu, Z.; Lei, S.; Lu, Q.; Bian, Z.; Ge, S. Spatial distribution of the impact of surface mining on the landscape ecological health of semi-arid grasslands. Ecol. Indic. 2019, 111, 105996. [Google Scholar] [CrossRef]
  26. Li, S.; Zhang, H.; Zhou, X.; Yu, H.; Li, W. Enhancing protected areas for biodiversity and ecosystem services in the Qinghai–Tibet Plateau. Ecosyst. Serv. 2020, 43, 101090. [Google Scholar] [CrossRef]
  27. Zhang, Y.; Qi, W.; Zhou, C.; Ding, M.; Liu, L.; Gao, J.; Bai, W.; Wang, Z.; Zheng, D. Spatial and temporal variability in the net primary production of alpine grassland on the Tibetan Plateau since 1982. J. Geogr. Sci. 2014, 24, 269–287. [Google Scholar] [CrossRef]
  28. Wang, X.; Zhang, Y.; Wu, X.; Zheng, D.; Wang, Z.; Yan, J.; Liu, L.; Zhang, B.; Zhao, Z.; Bai, W.; et al. Spatial and temporal characteristics of land use and cover changes in the Tibetan Plateau. Chin. Sci. Bull. 2019, 64, 2865–2875. [Google Scholar] [CrossRef] [Green Version]
  29. Mima, D. Study on the Model of Green Mining Economics with Ecotone in Tibet Autonomous Region of PRC; University of Geosciences: Wuhan, China, 2017. [Google Scholar]
  30. Li, S.; Bing, Z.; Jin, G. Spatially Explicit Mapping of Soil Conservation Service in Monetary Units Due to Land Use/Cover Change for the Three Gorges Reservoir Area, China. Remote. Sens. 2019, 11, 468. [Google Scholar] [CrossRef] [Green Version]
  31. Fu, J.; Jiang, D.; Huang, Y. 1 km grid population dataset of China (2005, 2010). Acta Geogr. Sin. 2014, 69, 136–139. [Google Scholar] [CrossRef]
  32. He, Z.; Du, J.; Chen, L.; Zhu, X.; Lin, P.; Zhao, M.; Fang, S. Impacts of recent climate extremes on spring phenol-ogy in arid-mountain ecosystems in China. Agr. Forest Meteorol. 2018, 260, 31–40. [Google Scholar] [CrossRef]
  33. Liu, J.Y.; Zhuang, D.F.; Luo, D.; Xiao, X. Land-cover classification of China: Integrated analysis of AVHRR im-agery and geophysical data. Int. J. Remote Sens. 2003, 24, 2485–2500. [Google Scholar] [CrossRef]
  34. Sun, J.; Wang, X.; Chen, A.; Ma, Y.; Cui, M.; Piao, S. NDVI indicated characteristics of vegetation cover change in China’s metropolises over the last three decades. Environ. Monit. Assess. 2010, 179, 1–14. [Google Scholar] [CrossRef] [PubMed]
  35. Yao, R.; Cao, J.; Wang, L.; Zhang, W.; Wu, X. Urbanization effects on vegetation cover in major African cities during 2001–2007. Int. J. Appl. Earth Obs. Geoinf. 2019, 75, 44–53. [Google Scholar] [CrossRef]
  36. Sun, Y.; Zhao, S.; Qu, W. Quantifying spatiotemporal patterns of urban expansion in three capital cities in Northeast China over the past three decades using satellite data sets. Environ. Earth Sci. 2014, 73, 7221–7235. [Google Scholar] [CrossRef]
  37. Tobler, W.R. A Computer Movie Simulating Urban Growth in the Detroit Region. Econ. Geogr. 1970, 46, 234–240. [Google Scholar] [CrossRef]
  38. Gorelick, N.; Hancher, M.; Dixon, M.; Ilyushchenko, S.; Thau, D.; Moore, R. Google Earth Engine: Planetary-scale geospatial analysis for everyone. Remote Sens. Environ. 2017, 202, 18–27. [Google Scholar] [CrossRef]
  39. Xiang, J.; Li, X.; Xiao, R.; Wang, Y. Effects of land use transition on ecological vulnerability in poverty-stricken mountainous areas of China: A complex network approach. J. Environ. Manag3. 2021, 297, 113206. [Google Scholar] [CrossRef]
  40. Tosic, I. Spatial and temporal variability of winter and summer precipitation over Serbia and Montenegro. Arch. Meteorol. Geophys. Bioclimatol. Ser. B 2004, 77, 47–56. [Google Scholar] [CrossRef]
  41. Kendall, M.G. Rank Correlation Methods. J. Inst. Actuar. 1949. [Google Scholar] [CrossRef]
  42. Jiang, W.; Wu, T.; Fu, B. The value of ecosystem services in China: A systematic review for twenty years. Ecosyst. Serv. 2021, 52, 101365. [Google Scholar] [CrossRef]
  43. Xie, G.; Zhang, C.; Zhang, L.; Chen, W.; Li, S. Improvement of the Evaluation Method for Ecosystem Service Value Based on Per Unit Area. J. Nat. Res. 2015, 30, 1243–1254. [Google Scholar]
  44. Xu, L.; Xu, X.; Luo, T.; Zhu, G.; Ma, Z. Services based on land use: A case study of Bohai Rim. Geographical re-search. Geogr. Res. 2012, 31, 1775–1784. [Google Scholar] [CrossRef]
  45. Zhang, L.; Yu, X.; Jiang, M.; Xue, Z.; Lu, X.; Zou, Y. A consistent ecosystem services valuation method based on Total Economic Value and Equivalent Value Factors: A case study in the Sanjiang Plain, Northeast China. Ecol. Complex. 2017, 29, 40–48. [Google Scholar] [CrossRef]
  46. Gutman, G.; Ignatov, A. The derivation of the green vegetation fraction from NOAA/AVHRR data for use in numerical weather prediction models. Int. J. Remote Sens. 1998, 19, 1533–1543. [Google Scholar] [CrossRef]
  47. Bi, X.; Ge, J. Evaluating Ecosystem Service Valuation in China Based on the IGBP Land Cover Datasets. J. Mt. Sci. 2004, 22, 48–53. [Google Scholar]
  48. Zhang, C.; Kuang, W.; Wu, J.; Liu, J.; Tian, H. Industrial land expansion in rural China threatens environmental securities. Front. Environ. Sci. Eng. 2020, 15, 1–13. [Google Scholar] [CrossRef]
  49. Jiang, W.; Lü, Y.; Liu, Y.; Gao, W. Ecosystem service value of the Qinghai-Tibet Plateau significantly increased during 25 years. Ecosyst. Serv. 2020, 44, 101146. [Google Scholar] [CrossRef]
  50. Liu, A.; Kuang, W.; Ding, F.; Yan, H.; Yang, T. Impacts of urban and industrial land expansion on net primary productivity of China during 2000–2015. Arid Land Geogr. 2017, 40, 805–816. [Google Scholar]
  51. Zhang, G.; Zheng, D.; Xie, L.; Zhang, X.; Wu, H.; Li, S. Mapping changes in the value of ecosystem services in the Yangtze River Middle Reaches Megalopolis, China. Ecosyst. Serv. 2021, 48, 101252. [Google Scholar] [CrossRef]
  52. Xiao, W.; Zhang, W.; Ye, Y.; Lv, X.; Yang, W. Is underground coal mining causing land degradation and significantly damaging ecosystems in semi-arid areas? A study from an Ecological Capital perspective. Land Degrad. Dev. 2020, 31, 1969–1989. [Google Scholar] [CrossRef]
  53. Wu, Z.; Lei, S.; Lu, Q.; Bian, Z. Impacts of Large-Scale Open-Pit Coal Base on the Landscape Ecological Health of Semi-Arid Grasslands. Remote Sens. 2019, 11, 1820. [Google Scholar] [CrossRef] [Green Version]
  54. Du, J.; Fu, Q.; Fang, S.; Wu, J.; He, P.; Quan, Z. Effects of rapid urbanization on vegetation cover in the metropolises of China over the last four decades. Ecol. Indic. 2019, 107, 105458. [Google Scholar] [CrossRef]
  55. Zhao, S.Q.; Liu, S.G.; Zhou, D.C. Prevalent vegetation growth enhancement in urban environment. Proc. Natl. Acad. Sci. USA 2016, 113, 6313–6318. [Google Scholar] [CrossRef] [PubMed] [Green Version]
  56. Li, L.; Zhang, Y.; Liu, L.; Wu, J.; Wang, Z.; Li, S.; Zhang, H.; Zu, J.; Ding, M.; Paudel, B. Spatiotemporal Patterns of Vegetation Greenness Change and Associated Climatic and Anthropogenic Drivers on the Tibetan Plateau during 2000–2015. Remote Sens. 2018, 10, 1525. [Google Scholar] [CrossRef] [Green Version]
  57. Li, C.; de Jong, R.; Schmid, B.; Wulf, H.; Schaepman, M. Spatial variation of human influences on grassland biomass on the Qinghai-Tibetan plateau. Sci. Total Environ. 2019, 665, 678–689. [Google Scholar] [CrossRef]
  58. Hou, H.; Wang, R.; Murayama, Y. Scenario-based modelling for urban sustainability focusing on changes in cropland under rapid urbanization: A case study of Hangzhou from 1990 to 2035. Sci. Total Environ. 2019, 661, 422–431. [Google Scholar] [CrossRef]
  59. Hou, X.-Y.; Liu, S.-L.; Cheng, F.-Y.; Zhang, Y.-Q.; Dong, S.-K.; Su, X.-K.; Liu, G.-H. Vegetation community composition along disturbance gradients of four typical open-pit mines in Yunnan Province of southwest China. Land Degrad. Dev. 2018, 30, 437–447. [Google Scholar] [CrossRef]
  60. Liu, W.; Agusdinata, D.B.; Myint, S.W. Spatiotemporal patterns of lithium mining and environmental degradation in the Atacama Salt Flat, Chile. Int. J. Appl. Earth Obs. Geoinf. 2019, 80, 145–156. [Google Scholar] [CrossRef]
  61. Van Vliet, J. Direct and indirect loss of natural area from urban expansion. Nat. Sustain. 2019, 2, 755–763. [Google Scholar] [CrossRef]
  62. Carlson, T.N.; Ripley, D.A. On the relation between NDVI, fractional vegetation cover, and leaf area index. Remote Sens. Environ. 1997, 62, 241–252. [Google Scholar] [CrossRef]
  63. Chen, A.; Huang, L.; Liu, Q.; Piao, S. Optimal temperature of vegetation productivity and its linkage with climate and elevation on the Tibetan Plateau. Glob. Chang. Biol. 2021, 27, 1942–1951. [Google Scholar] [CrossRef] [PubMed]
  64. Pang, G.; Wang, X.; Yang, M. Using the NDVI to identify variations in, and responses of, vegetation to climate change on the Tibetan Plateau from 1982 to 2012. Quat. Int. 2016, 444, 87–96. [Google Scholar] [CrossRef]
  65. Camps-Valls, G.; Campos-Taberner, M.; Moreno-Martínez, A.; Walther, S.; Duveiller, G.; Cescatti, A.; Mahecha, M.D.; Muñoz-Marí, J.; García-Haro, F.J.; Guanter, L.; et al. A unified vegetation index for quantifying the terrestrial biosphere. Sci. Adv. 2021, 7, eabc7447. [Google Scholar] [CrossRef] [PubMed]
  66. Costanza, R.; D’Arge, R.; De Groot, R.; Farber, S.; Grasso, M.; Hannon, B.; Limburg, K.; Naeem, S.; O’Neill, R.V.; Paruelo, J. The value of the world’s ecosystem services and natural capital. Nature 1997, 387, 253–260. [Google Scholar] [CrossRef]
  67. Costanza, R.; de Groot, R.; Sutton, P.; van der Ploeg, S.; Anderson, S.J.; Kubiszewski, I.; Farber, S.; Turner, R.K. Changes in the global value of ecosystem services. Glob. Environ. Change 2014, 26, 152–158. [Google Scholar] [CrossRef]
Figure 1. Location of the Tibetan Plateau. The boundary of the Tibetan Plateau is considered to be as per [31].
Remotesensing 14 00872 g001
Figure 2. Conceptual framework in this study.
Remotesensing 14 00872 g002
Figure 3. (a) Distribution of industrial and mining lands on the Tibetan Plateau in 2020. (b) Statistics of major county-level administrative units in the distribution of industrial and mining lands having an area greater than 3 km2.
Remotesensing 14 00872 g003
Figure 4. Changes in industrial and mining lands during 1990–2020 (a), 1990–2000 (b), 2000–2010 (c), and 2010–2020 (d), respectively, (e) change count percentage of industrial and mining lands and (f) change area percentage of industrial and mining lands. The most distinct change areas are shown in the panel.
Remotesensing 14 00872 g004
Figure 5. Google Earth Image (the resolution of NO.1 and NO.2 was 15 m, and that of NO.3 and NO.4 was 7.5 m) of industrial and mining lands’ change in typical areas during the period 1990–2020. The location of four typical industrial and mining land sites on the Tibetan Plateau is shown in Figure 4a.
Remotesensing 14 00872 g005
Figure 6. Transfer matrix of industrial and mining lands. (a): 1990–2020, (b): 1990–2000, (c): 2000–2010, (d): 2010–2020. Note: The number in the figure means net percentage change in the transfer in and transfer out of industrial and mining lands.
Remotesensing 14 00872 g006
Figure 7. Change in the landscape index of industrial and mining lands in newly added, reduced, and stable areas, and the study area, during 1990–2020 (1), 1990–2000 (2), 2000–2010 (3), and 2010–2020 (4). (a) change of NP and COHESION, (b) change of LPI and SPLIT, (c) change of LSI and PAFRAC and (d) change of PD and AI.
Remotesensing 14 00872 g007
Figure 8. Trends of NDVI in 1990–2020: (a) all of the study area, (b) added industrial and mining lands, (c) reduced industrial and mining lands, (d) stable industrial and mining lands, (e) area percentage of NDVI trends in the whole study area and (f) area percentage of NDVI trends in added, reduced and stable industrial and mining lands, respectively.
Remotesensing 14 00872 g008
Figure 9. Trends of NDVI in 1990–2000, 2000–2010, and 2010–2020: (ac) added industrial and mining lands; (df) reduced industrial and mining lands; (gi) stable industrial and mining lands, (j) area percentage of NDVI trends in 1990–2000, (k) area percentage of NDVI trends in 200–2010 and (l) area percentage of NDVI trends in 2010-2020.
Remotesensing 14 00872 g009
Figure 10. Impact of industrial and mining lands on the ecological services value of different ecological service types during (a)1990–2020, (b) 1990–2000, (c) 2000–2010, and (d) 2010–2020.
Remotesensing 14 00872 g010
Figure 11. Impact of industrial and mining lands (within the 10 km buffer) on the ecological service value of different ecological service types in 10-km buffer zone during (a) 1990–2020, (b) 1990–2000, (c) 2000–2010, and (d) 2010–2020.
Remotesensing 14 00872 g011
Figure 12. Ecological services value and the added value of the secondary industry from 1990 to 2020.
Remotesensing 14 00872 g012
Table 1. Revised EVF of Tibetan Plateau ecosystem services per unit area of ecosystem type in 2020.
Ecosystem ServiceLand TypesCultivated LandForestGrasslandWetlandWilderness Waters
Supply serviceFood production1.86 0.85 0.59 0.43 0.01 0.67
Raw material production0.41 1.95 0.87 0.42 0.03 0.19
Water supply−2.19 1.01 0.48 2.18 0.02 8.78
Adjustment servicesGas regulation1.50 6.41 3.04 1.60 0.11 0.80
Climate regulation0.78 19.18 8.04 3.02 0.08 2.38
Purify the environment0.23 5.62 2.65 3.02 0.34 4.80
Hydrological regulation2.51 12.55 5.89 20.35 0.20 91.87
Support servicesSoil conservation0.87 7.80 3.70 1.94 0.13 0.78
Maintain nutrient cycle10.24 0.60 0.29 0.15 0.01 0.06
Biodiversity0.29 7.11 3.37 6.61 0.12 2.15
Cultural servicesAesthetic landscape0.13 3.12 1.49 3.97 0.05 1.66
Publisher’s Note: MDPI stays neutral with regard to jurisdictional claims in published maps and institutional affiliations.

