Article

Vegetation Monitoring of Protected Areas in Rugged Mountains Using an Improved Shadow-Eliminated Vegetation Index (SEVI)

1
Key Laboratory of Spatial Data Mining & Information Sharing of Ministry of Education, National & Local Joint Engineering Research Center of Satellite Geospatial Information Technology, Academy of Digital China (Fujian), Fuzhou University, Fuzhou 350108, China
2
Institute of Remote Sensing and Digital Earth, Chinese Academy of Sciences, Beijing 100094, China
*
Author to whom correspondence should be addressed.
Remote Sens. 2022, 14(4), 882; https://doi.org/10.3390/rs14040882
Submission received: 2 January 2022 / Revised: 28 January 2022 / Accepted: 9 February 2022 / Published: 12 February 2022
(This article belongs to the Special Issue Environmental Stress and Natural Vegetation Growth)

Abstract

:
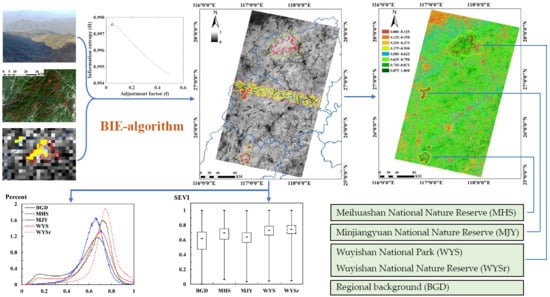
It is significant to study the vegetation of protected areas in rugged mountains where the vegetation grows naturally with minimal eco-society environmental stress from anthropogenic activities. The shadow-eliminated vegetation index (SEVI) was used to monitor the vegetation of protected areas, since it successfully removes topographic shadow effects. In order to auto achieve the best adjustment factor for SEVI calculation from regional area images, we developed a new calculation algorithm using block information entropy (BIE-algorithm). The BIE-algorithm auto-detected typical blocks (subareas) from slope images and achieved the best adjustment factor from a block where the SEVI obtained the highest information entropy in an entire scene. Our obtained regional SEVI result from two scenes of Landsat 8 OLI images using the BIE-algorithm exhibited an overall flat feature with the impression of the relief being drastically removed. It achieved balanced values among three types of samples: Sunny area, self-shadow, and cast shadow, with SEVI means of 0.73, 0.77, and 0.75, respectively, and the corresponding SEVI relative errors of self-shadow and cast shadow were only 4.99% and 1.84%, respectively. The linear regression of SEVI vs. the cosine of the solar incidence angle was nearly horizontal, with an inclination of −0.0207 and a coefficient of determination of 0.0042. The regional SEVI revealed that the vegetation growth level sequence of three protected areas was Wuyishan National Park (SEVI mean of 0.718) > Meihuashan National Nature Reserve (0.672) > Minjiangyuan National Nature Reserve (0.624) > regional background (0.572). The vegetation growth in the protected areas was influenced by the terrain slope and years of establishment of the protected area and by the surrounding buffer zone. The homogeneous distribution of vegetation in a block is influenced by many factors, such as the actual vegetation types, block size, and shape, which need consideration when the proposed BIE-algorithm is used.

Graphical Abstract

1. Introduction

The terrestrial vegetation plays an important role in biodiversity conservation, ecological sustainability, and in achieving carbon neutrality [1,2,3,4]. Protected areas are useful for natural vegetation growth and mitigating vegetation degradation and deforestation [5,6,7,8,9,10,11,12], since they suffer minimal eco-society environmental stress from human beings [13,14]. Thus, it is significant to monitor the vegetation growth of protected areas. In addition to field surveys, remotely sensed measures have become an effective technology in vegetation monitoring [15,16,17,18,19,20,21,22,23]. However, remote sensing of vegetation in mountain environments is notoriously difficult, due to the anisotropic nature of spectral variation caused by the topographic effect [24,25]. Therefore, the topographic effect should be corrected when monitoring the vegetation of rugged mountains using remote sensing [26,27]. In the past decades, many topographic correction methods have been developed, such as cosine correction [28,29,30], C-correction [28], sun–canopy–sensor (SCS) correction [31,32], SCS+C correction [33,34], Minnaert correction [35], the adaptive shade compensation (ASC) model [36], the Gamma method [37], the Sandmeier model [38], the Santini model [39], the BRDF-based atmospheric and topographic correction (BRATC) model [40], the approach based on path length correction (PLC) [41], and the four-scale bidirectional reflection model of the slope geometric optical model [42,43]. In addition to these digital elevation model (DEM)-based empirical and physical topographic correction methods, spectral feature approaches in the form of vegetation indices have also been studied, such as the modified enhanced vegetation index [44] and the shadow-eliminated vegetation index (SEVI) [45]. The SEVI successfully removes the under-illuminated effect in the topographic shadows of rugged mountains, specifically in cast shadows, where the under-illuminated effect is difficult to eliminate using conventional topographic correction methods based on DEM. Cast shadows are derived from the obstructing of solar direct irradiance from a higher mountain, otherwise they are sunny areas. Indeed, we planned to use the SEVI to monitor the vegetation of protected areas in rugged mountains. In practical applications with the SEVI, the adjustment factor plays an important role in balancing the under-elimination or over-elimination of terrain shadows. The proposed calculation algorithm, using the coefficient of correlation (r-algorithm), requires careful selection of a typical subarea with prominent terrain shadows and a green vegetation cover symmetry between shaded and sunny hillsides [45], so it depends on the expertise and manual operation. Using the r-algorithm requires a great deal of time for the selection of typical subareas from multi-scene remote-sensing images for large areas of rugged mountains, e.g., the mountainous areas in South China. Aiming to reduce the manual operation and time requirements, we considered developing a new calculation algorithm to achieve the best adjustment factor for every scene image to auto-detect the typical subarea. Information entropy is a quantitative measurement of the uncertainty of an outcome in a probabilistic event [46]. It has been widely used in ecological complexity and sustainability studies, as well as in remote-sensing image classification [47,48,49,50]. Thus, the SEVI was considered for improvement using topographic slope and information entropy of the vegetation index to auto-detect typical rugged blocks (subareas) and achieve the best adjustment factor from a block where the SEVI obtains the highest information entropy in an entire scene, which is better than the manual selection of a rugged subarea for comparison of the coefficient of correlation using the r-algorithm. Therefore, the objectives in this study were to (1) develop a new calculation algorithm using information entropy and blocks to replace the r-algorithm to achieve the best adjustment factor for a scene of SEVI calculation; and (2) monitor and analyze the vegetation of protected areas in rugged mountains using the improved SEVI.

2. Study Areas and Data

2.1. Study Areas

The study areas of three national protected areas in Fujian Province, China were selected, the Meihuashan National Nature Reserve (MHS), the Minjiangyuan National Nature Reserve (MJY), and Wuyishan National Park (WYS) (Figure 1). They are located in a typical subtropical monsoon climate zone. The elevation and the slope of these protected areas are listed in Table 1. MHS (25°15′14″–25°35′44″N, 116°45′25″–116°57′33″E) was established in September 1988 and is located in the southwest of Fujian Province, covering an area of 221.68 km2. It has an annual precipitation of 1700 mm–2000 mm and an annual temperature of 13 °C–18 °C. MJY (25°35′47″–26°49′56″N, 116°46′41″–116°59′24″E) was established in February 2006 and is located in the west of Fujian Province, covering an area of 130.22 km2. It has an annual precipitation mean of about 1775 mm and an annual temperature mean of approximately 16.7 °C. WYS (27°31′20″–27°55′49″N, 117°24′12″–117°59′19″E) is located in the north of Fujian Province and was established in September 2021. It was developed from the Wuyishan National Nature Reserve (WYSr), which was set up in April 1979 and joined the International Man and Biosphere Reserve Network of UNESCO in 1987 [51,52,53]. WYS covers an area of 1027.8 km2, has an annual precipitation mean of more than 2000 mm, and an annual temperature mean of approximately 12 °C; it is famous for its majestic mountainous appearance and biodiversity.

2.2. Data

Two scenes from Landsat 8 Operational Land Imager (OLI) multi-spectral images (Path/Row of 120/41 and 120/42) with a 30-m spatial resolution, acquired on 28 October 2018, were downloaded from the Geospatial Data Cloud site, Computer Network Information Center, the Chinese Academy of Sciences (http://www.gscloud.cn, accessed on 13 May 2021). The sun azimuth and elevation of these images are listed in Table 1. The 30-m Advanced Spaceborne Thermal Emission and Reflection Radiometer Global Digital Elevation Model Version 2 (ASTER GDEM V2) was also obtained from the same website. The image digital number (DN) was transformed into radiance using the band gain and bias provided by the image metadata, and the physical parameters of the surface reflectance (ρ) were obtained using the atmospheric correction of the fast line-of-sight atmospheric analysis of spectral hypercubes (FLAASH).

3. Methods

We developed a new calculation algorithm using block information entropy (BIE-algorithm) to calculate an improved SEVI that includes slope resampling, block detection, SEVI calculation, information entropy comparison, and adjustment factor selection. After the performance evaluation of the SEVI, computed using the BIE-algorithm, the vegetation of protected areas was monitored and analyzed using the improved SEVI (Figure 2).

3.1. BIE-Algorithm Development

We supposed that if green vegetation in rugged terrain is homogeneous, then the information entropy of SEVI in rugged terrain would be increased when the topographic effect is eliminated. Once the topographic effect is completely removed, the information entropy of SEVI reaches its maximum, which is a low percentage event. Then, we designed the processing procedure of the BIE-algorithm as follows. First, the slope calculated from the DEM of the 30-m spatial resolution is resampled to a 6-km resolution. The pixels of the 1% highest slope of the 6-km resolution are extracted as blocks. Second, the SEVI is calculated using the surface reflectance of the red band and near-infrared (NIR) band with an adjustment factor (Formula (1)), and the information entropy of SEVI in every block is calculated (Formulas (2) and (3)). The optimized adjustment factor for a block is achieved when the information entropy of SEVI achieves its maximum value (Formula (4)). Finally, the best adjustment factor for a scene is obtained from the block that achieves the highest information entropy of SEVI among the blocks (Formula (5)).
SEVI = ρ n i r ρ r + f ( Δ ) · 1 ρ r   ,
H = i = 1 n p i · l n ( p i ) l n ( n ) ,
p i = x i i = 1 n x i , i = 1 n p i = 1 , 0 < p i < 1 ,
f b = a r g m a x ( H ) , f ( Δ ) ( 0.001 ,   1.000 ) ,
f s = a r g m a x ( H b ) , f ( Δ ) ( f b j , j = 1 , , m ) ,
where ρ n i r is surface reflectance of the near infrared band, ρ r is surface reflectance of the red band, f ( Δ ) is the adjustment factor, H is the information entropy of SEVI in a block, p i is the percentage of a pixel SEVI value in a selected block, x i is a pixel value of SEVI, n is the number of pixels in a selected block, f b is an optimized adjustment factor for a block, f s is the best adjustment factor for a whole scene, H b is the maximum information entropy of SEVI in a block, and m is the number of selected blocks in an entire scene image.

3.2. Performance Evaluation

The idea of using the BIE-algorithm was to improve the SEVI calculation, therefore we used the SEVI performance in the removal of the topographic effect to evaluate the BIE-algorithm’s effectiveness. First, two SEVI scenes were achieved using the best adjustment factors calculated by the BIE-algorithm. Since illumination conditions change along with the seasonal sun zenith angle [54], the SEVI images were normalized using Formula (6) to develop the improved SEVI of the study, and the intersected area between the two SEVI scenes was used to verify SEVI mosaic accuracy. As a comparison, the conventionally used normalized difference vegetation index (NDVI) was computed (Formula (7)). In addition, the cosine of the solar incidence angle (cos i) was also computed and used for accuracy validation of the topographic correction. Thus, the evaluation data included surface reflectance, SEVI, NDVI, and cos i. Second, 223 sets of evaluation samples (yellow points in Figure 1) were randomly selected from two scenes of images to assess the performance of the SEVI (BIE-algorithm) in the removal of the topographic effect. Considering Tobler’s first law of geography (TFL) [55], every set of evaluation samples, including three types of self-shadow, cast shadow, and sunny area, were selected from the closely located pixels of homogenous vegetation cover. The samples were confirmed with the aid of higher-spatial-resolution images from Baidu Maps and GF-2. Finally, the specific methods of vision analysis, box plot, the mean, the relative error of shaded area vs. sunny area (Formula (8)), and scatter plots of vegetation indices vs. cos i were used in the evaluation.
S E V I = S E V I S E V I m i n S E V I m a x S E V I m i n ,
where S E V I is the normalized S E V I , S E V I m i n is the minimum S E V I of an entire scene, and S E V I m a x is the maximum S E V I of an entire scene.
N D V I = ρ n i r ρ r ρ n i r + ρ r ,
E r = x ¯ s h a x ¯ s u n x ¯ s u n × 100 % ,
where E r is the relative error, x ¯ s h a is the vegetation indices’ mean of shadow samples, such as the cast shadow and self-shadow, and x ¯ s u n is the vegetation indices’ mean of sunny area samples.

3.3. Vegetation Monitoring and Analysis

We used the normalized improved SEVI to monitor and analyze the vegetation distribution of the three protected areas. Mosaicked SEVI was used as the regional background (BGD) to compare with the SEVI of protected areas. In order to better illustrate the spatial distribution of vegetation in the vision, the achieved SEVI was graded into eight levels using an interval of 0.125, and the normalized SEVI and graded SEVI of the protected areas were clipped and zoomed in. Then, the transverse comparison method was used to discover the vegetation distribution characteristics of these protected areas. The specific comparison methods included a histogram, mean, and box plot. Considering the size differences between the three protected areas, a histogram of pixel percentage replaced that of the pixel number. In addition, we used the SEVI of buffer zones (SEVIb), years of establishment, and the topographic factors of protected areas as the basic influence factors to further analyze the vegetation of these protected areas. The surrounding buffer zone was set as twice the size of the corresponding protected area.

4. Results

4.1. Block and Adjustment Factor

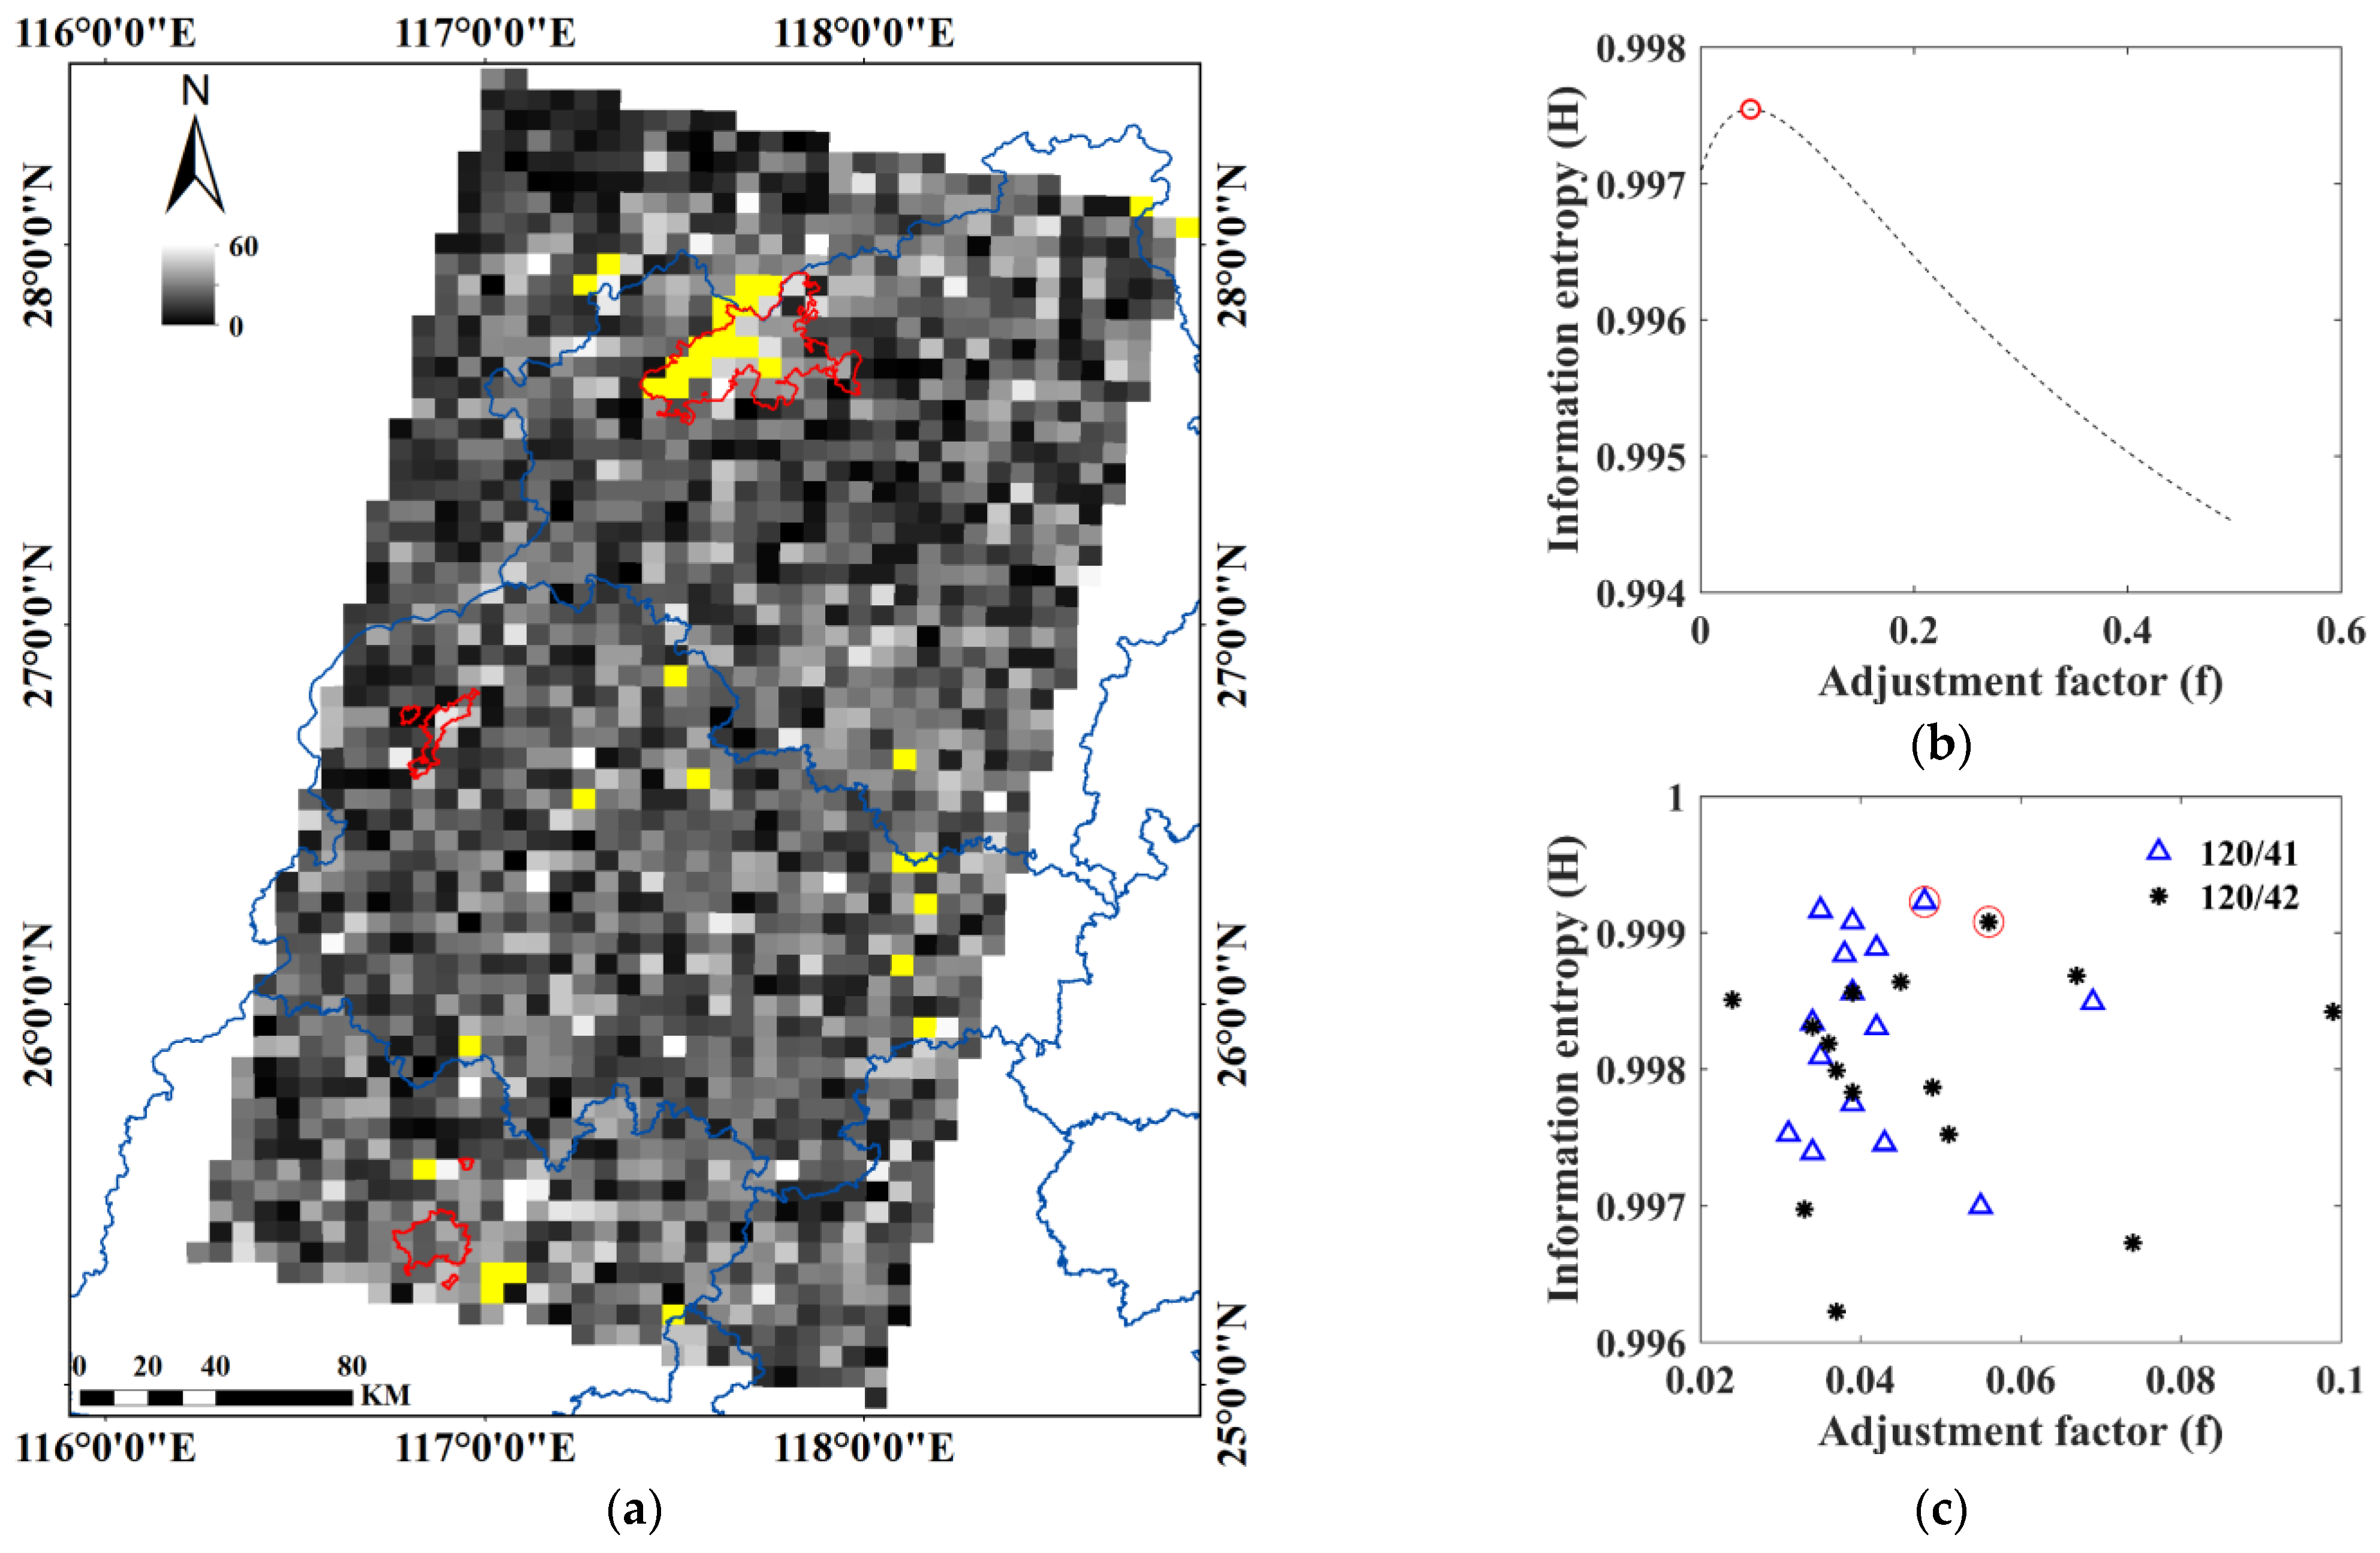
The resampled slope image with a 6-km spatial resolution showed that the majority of blocks were located in WYS and four blocks were close to MHS; however, MJY remained away from the blocks (yellow pixels of blocks and red shapes of protected areas in Figure 3a). After calculation of the information entropy of the SEVI in the blocks, the optimized adjustment factor for every block was obtained from the peak of the maximum entropy (shown in Figure 3b). Then, the best adjustment factor for each scene of the Landsat 8 OLI image was achieved from the block that obtained the highest information entropy of the SEVI (Figure 3c). Finally, we determined that the best adjustment factors were 0.048 for the Landsat 8 OLI image of 120/41 and 0.056 for the Landsat 8 OLI image of 120/42 using our developed BIE-algorithm, and we used them to calculate the SEVI results.

4.2. Performance of BIE-Algorithm

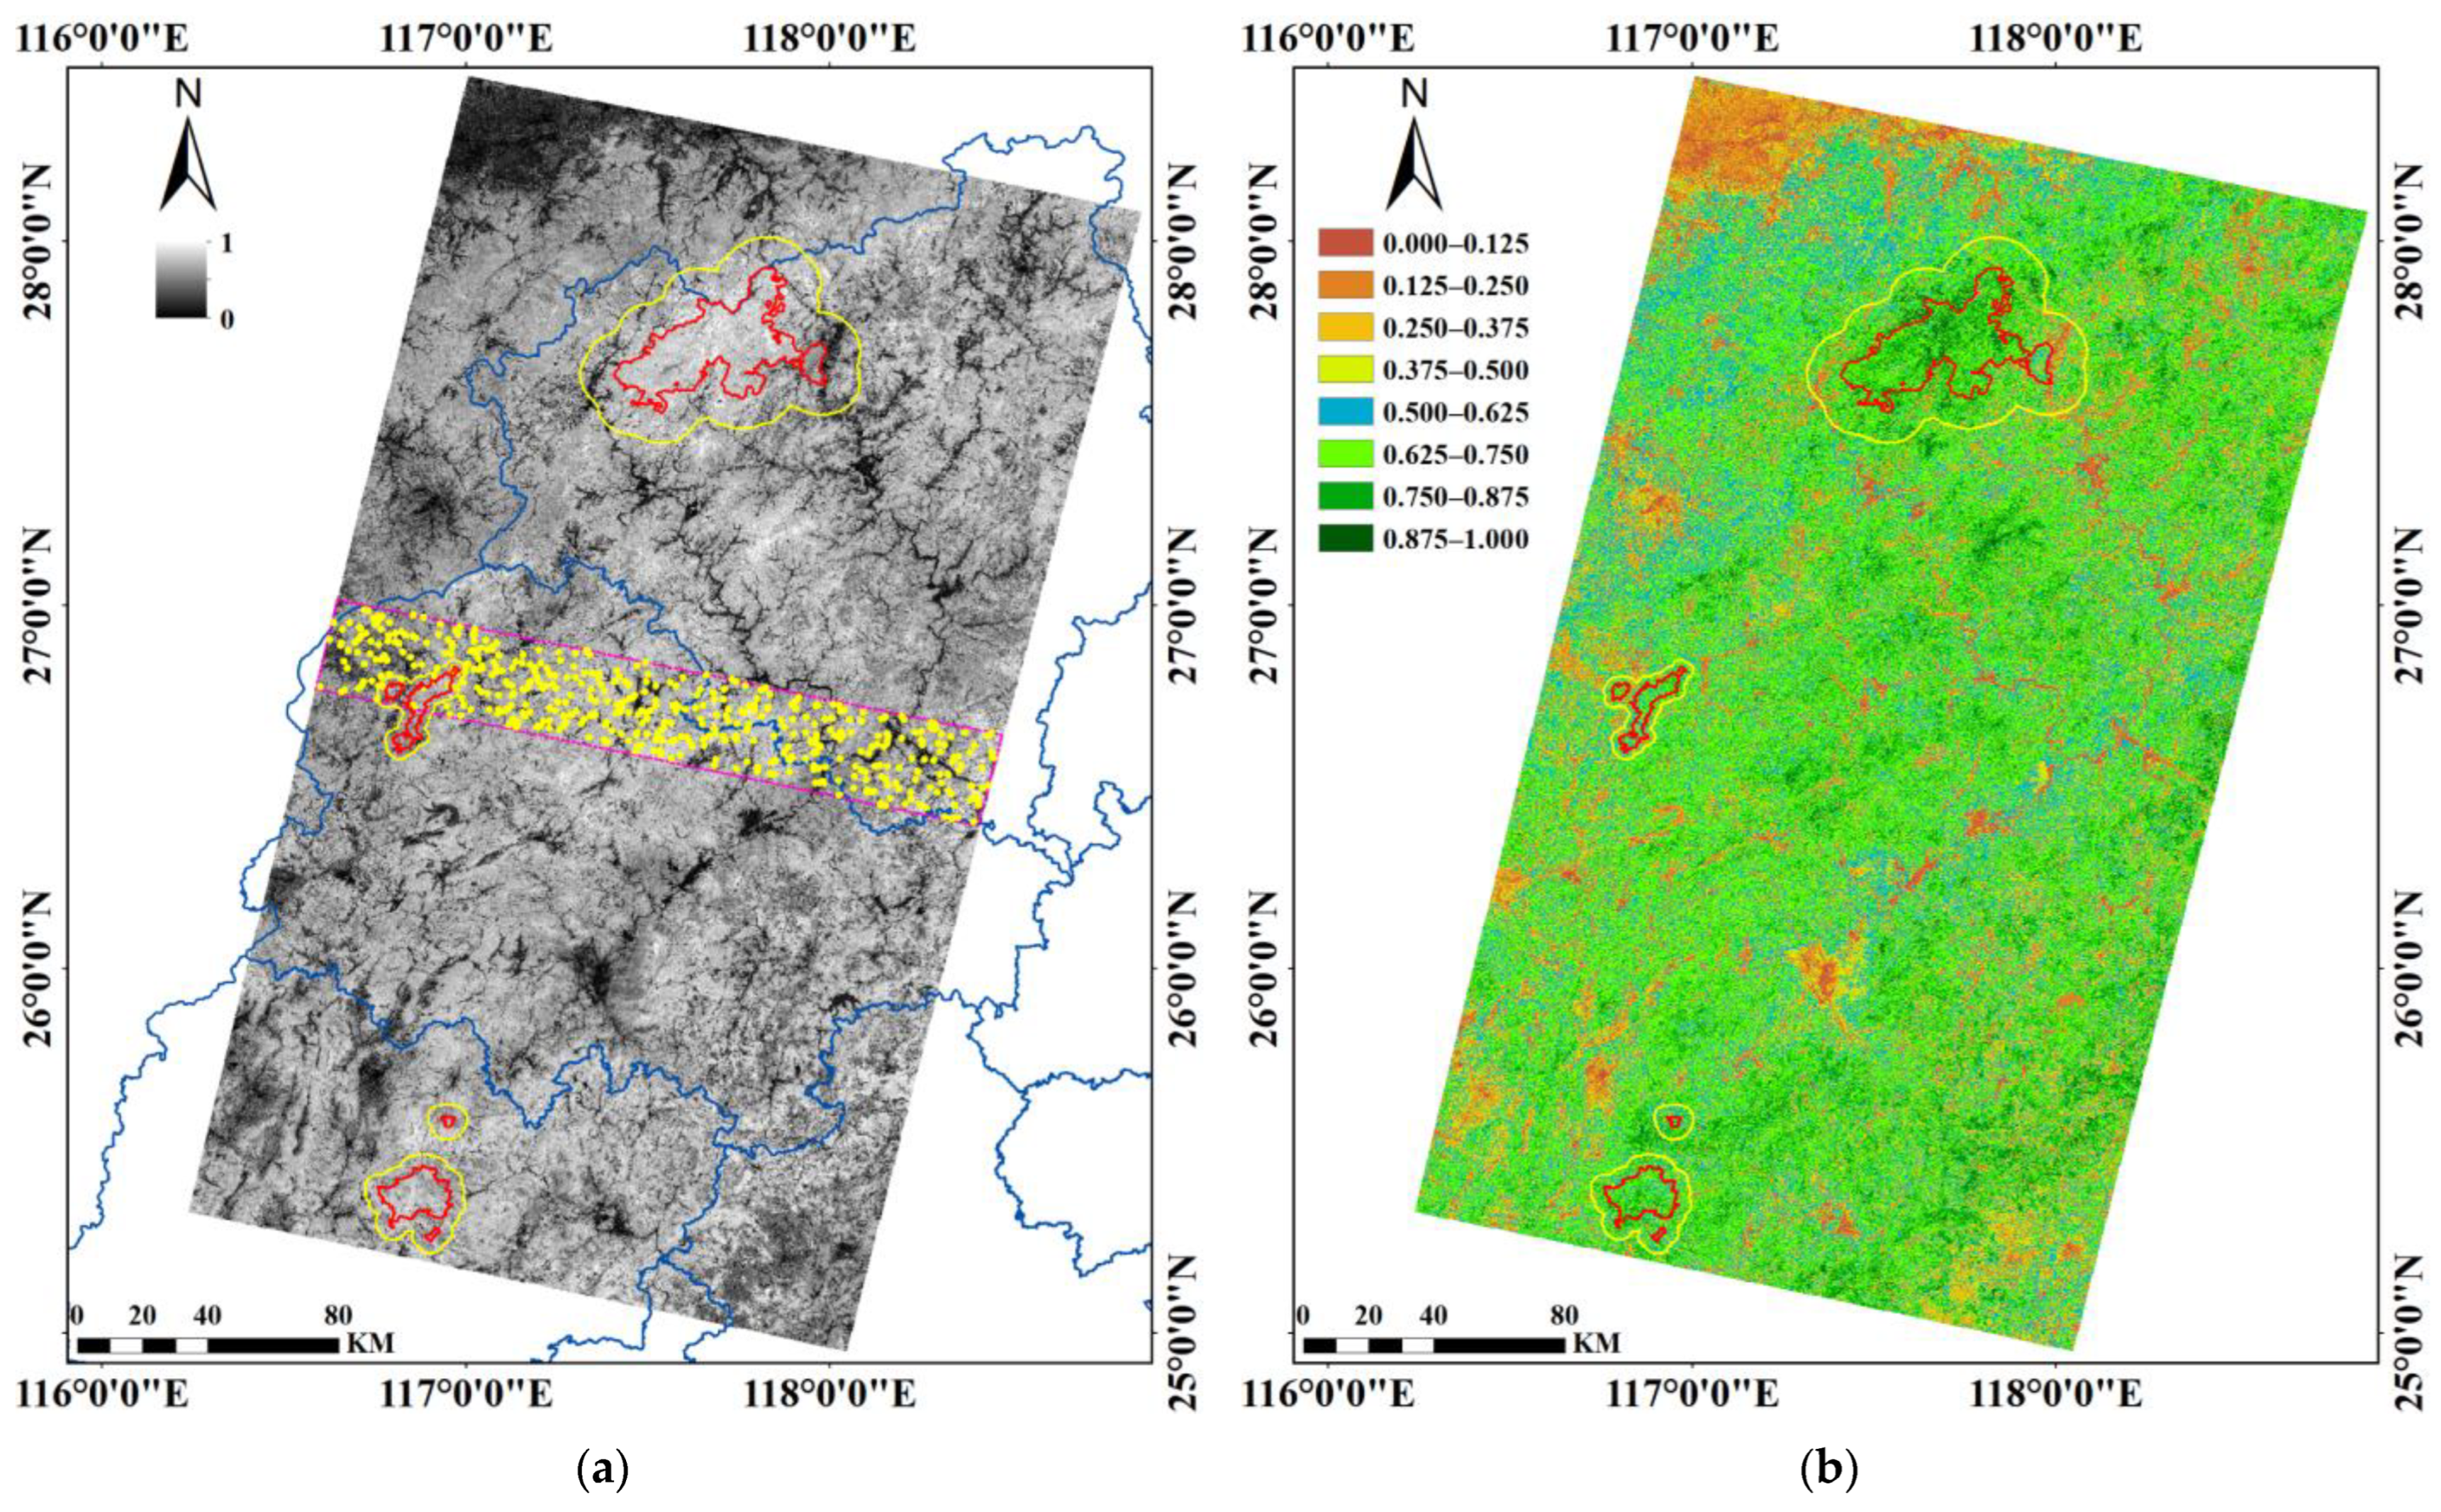
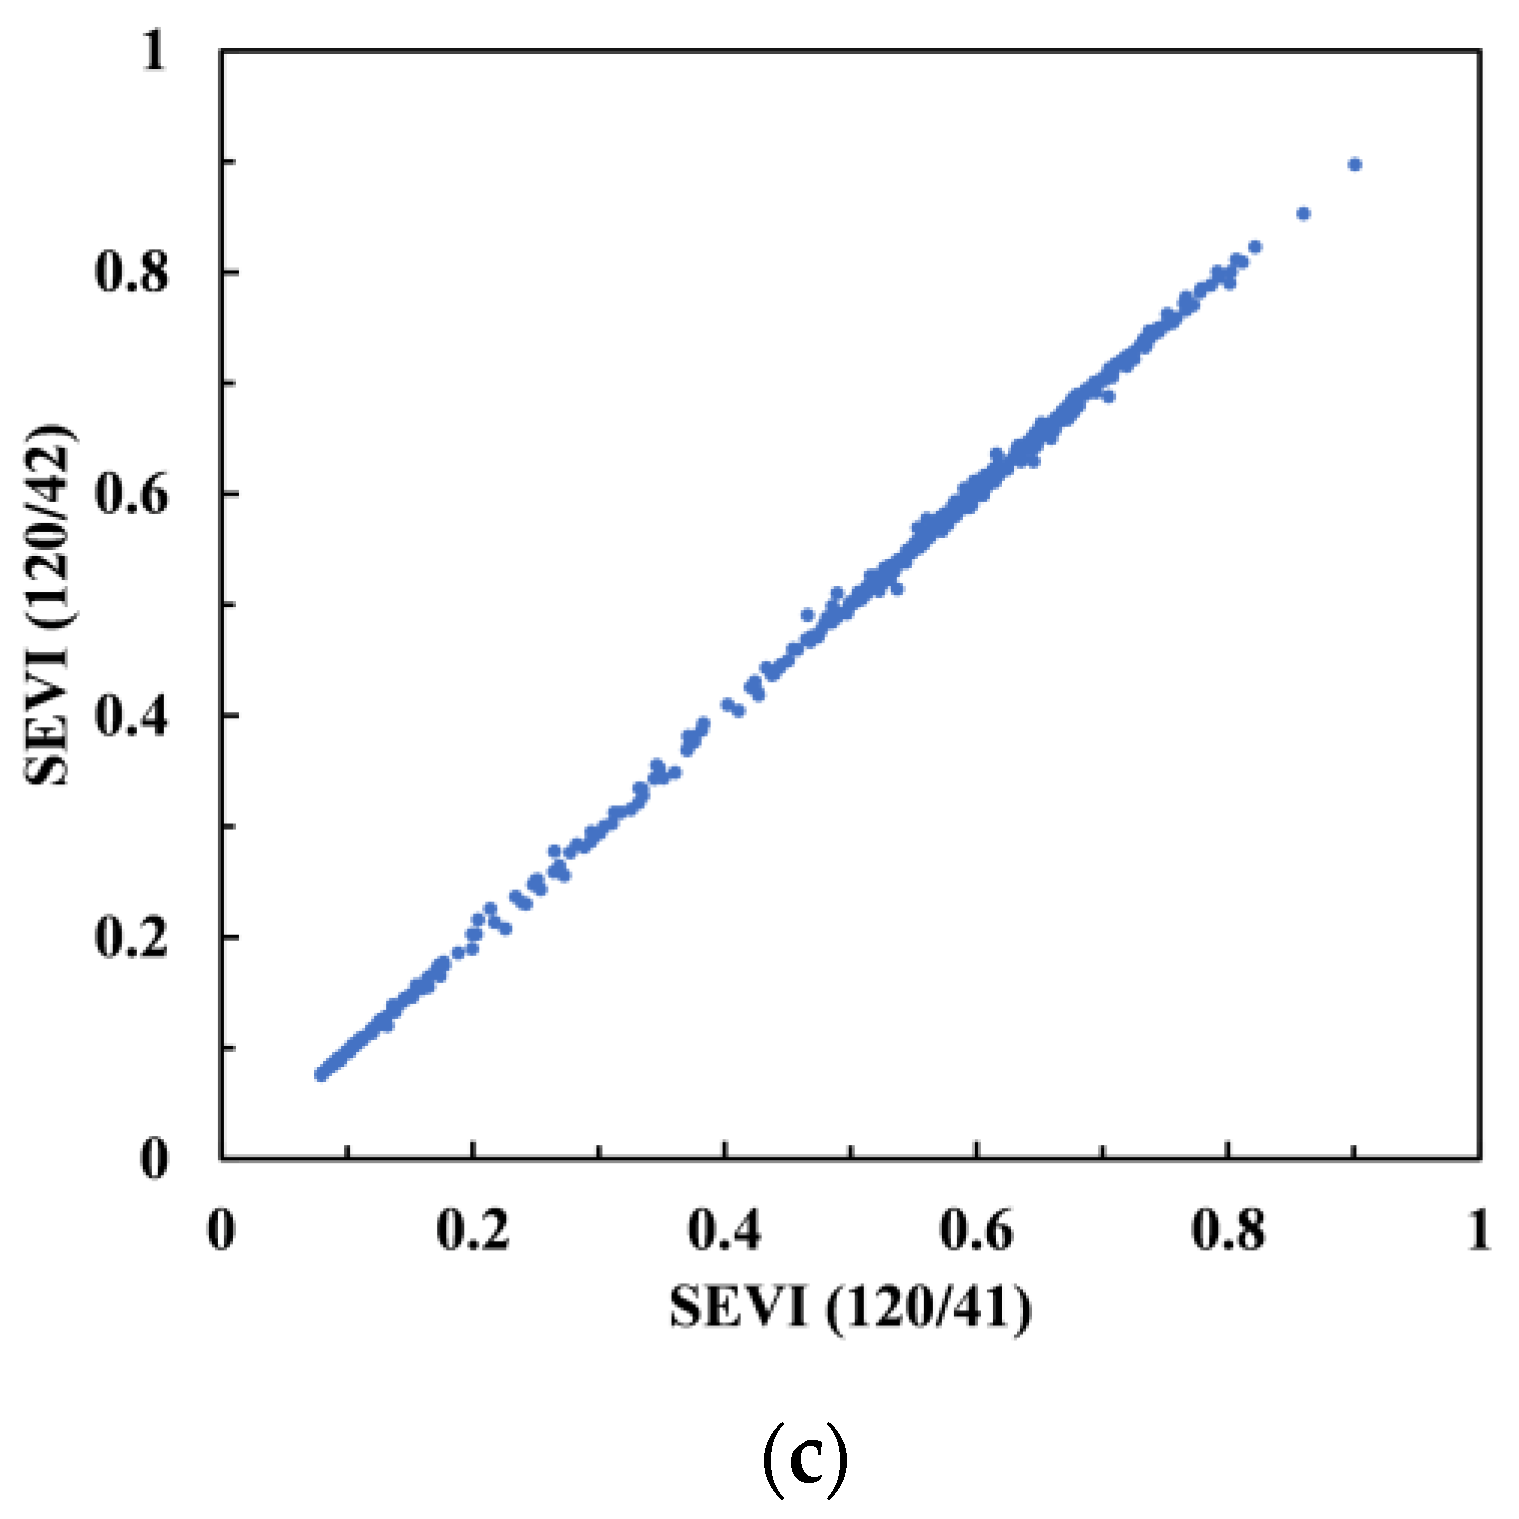
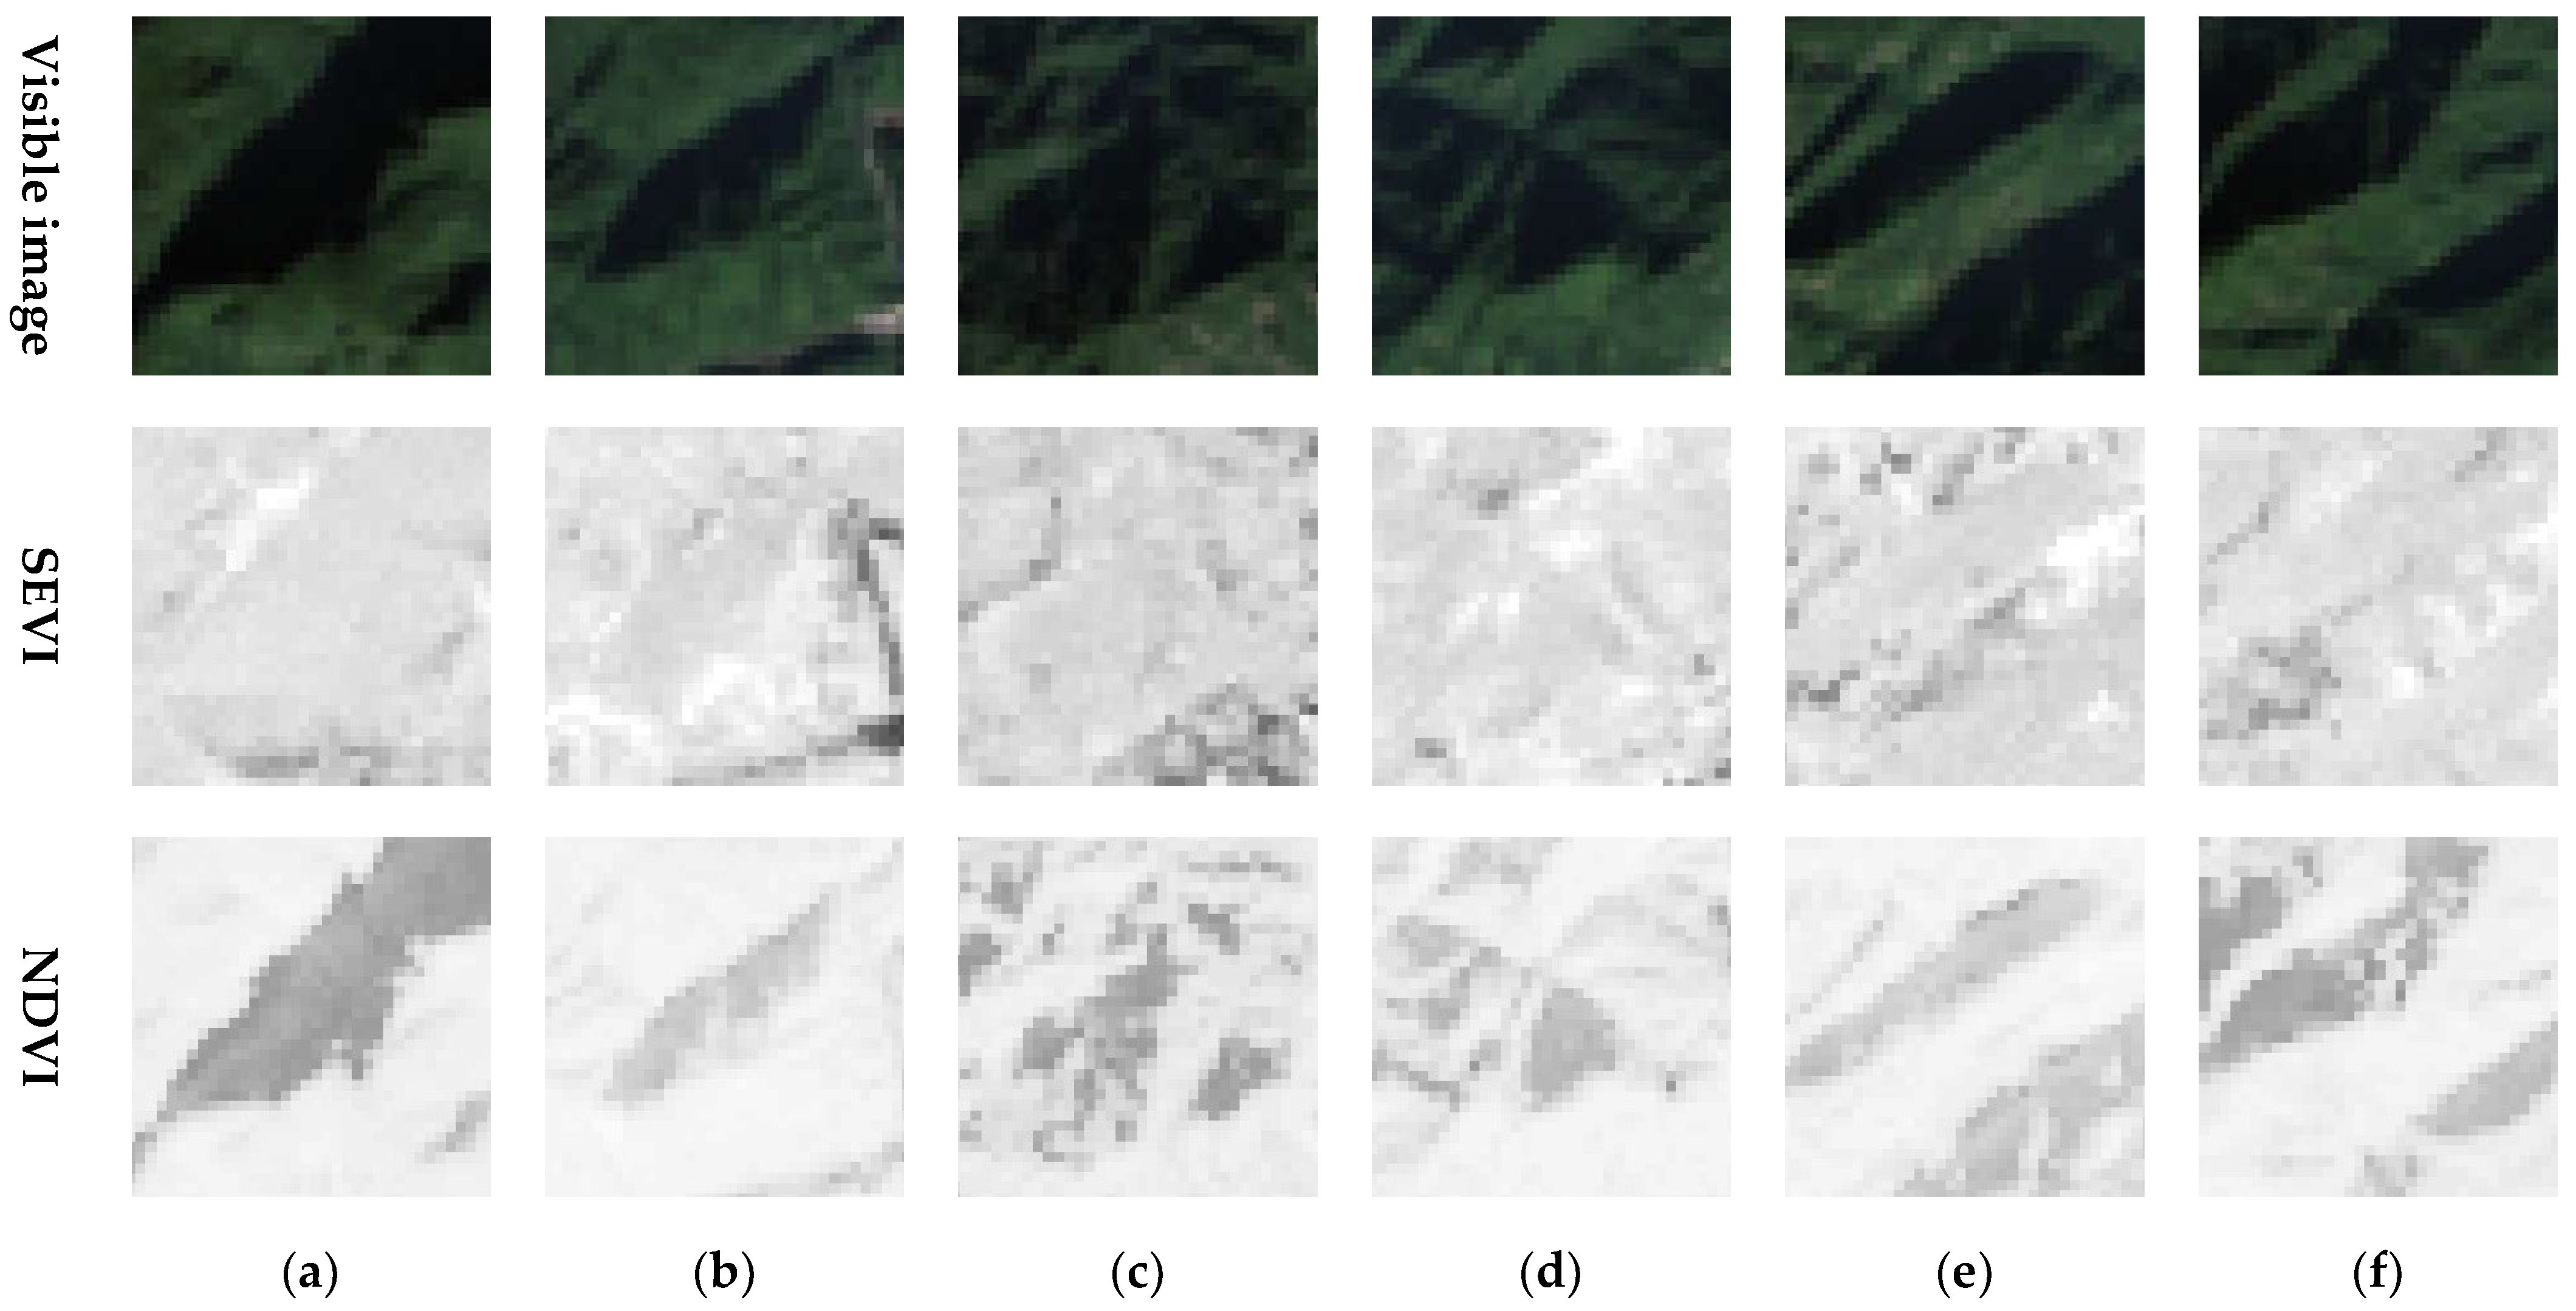
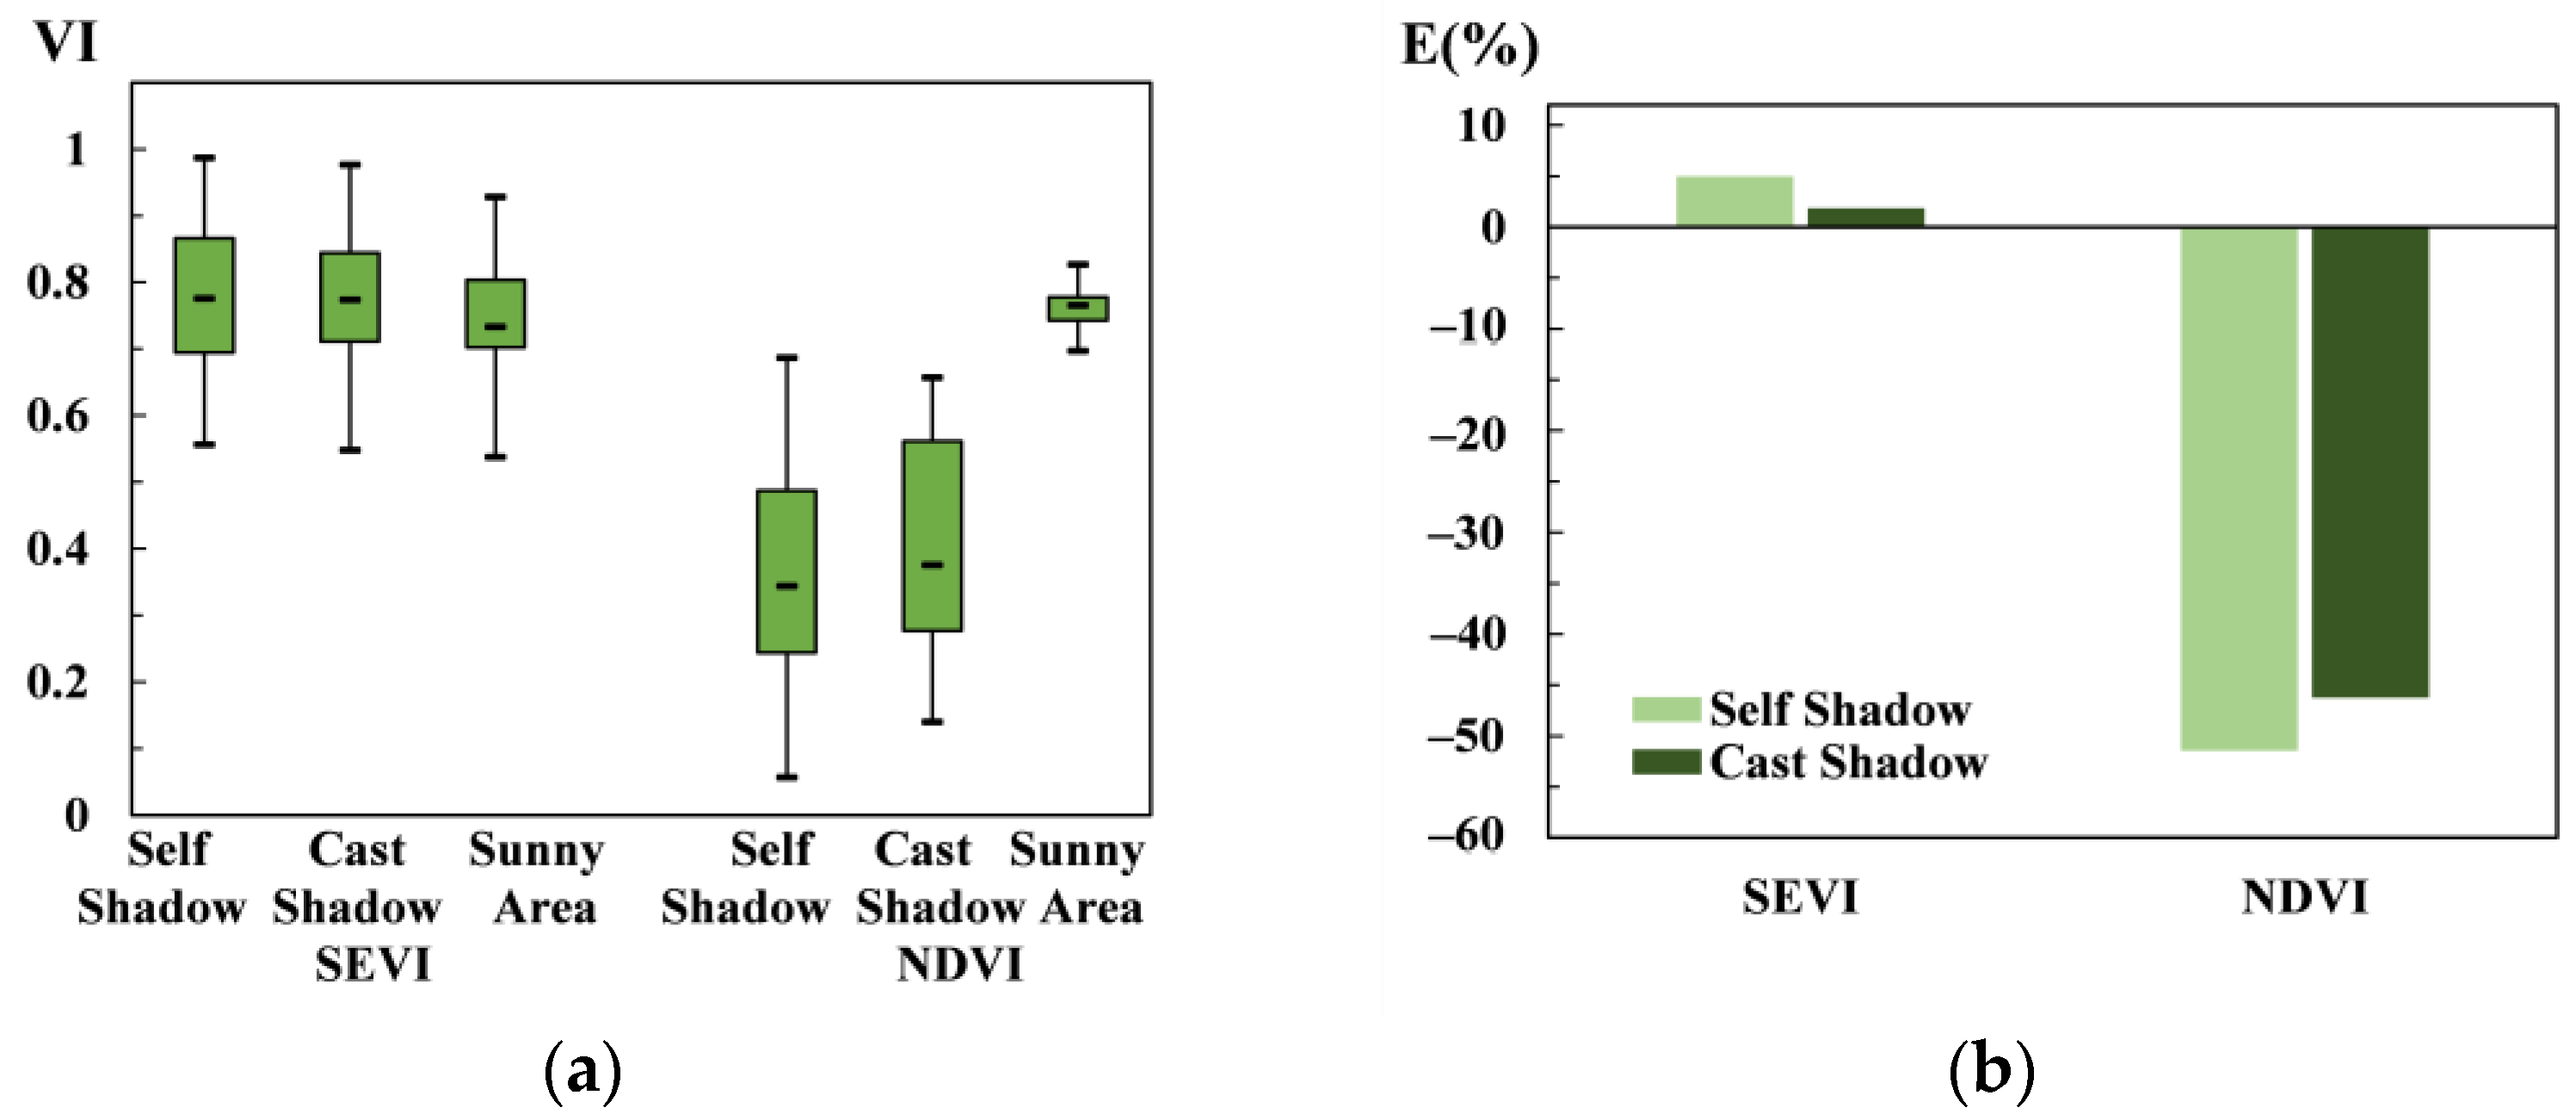
The two mosaicked scenes of the SEVI were obtained (Figure 4a), and 500 corresponding points were randomly selected from the intersected area (yellow points in Figure 4a). Linear regression of these points showed a high matching accuracy with an inclination of 0.9897 and a coefficient of determination (r2) of 0.9995 (Figure 4c). The six sample areas were randomly selected from the calculated improved SEVI results and clipped for zoom-in (red points in Figure 1 and images in Figure 5). The sample images of the red–green–blue (RGB) composite showed that the topographic effect was prominent with relief and topographic shadows before topographic correction. However, the SEVI sample images exhibited an overall flat feature, with relief impressions that were drastically removed. As for NDVI, the sample images still had a relief effect with fragmentized shadows. A box plot of the samples showed that the SEVI achieved balanced values among the three types of samples, sunny area, self-shadow, and cast shadow, and their SEVI means were 0.73, 0.77, and 0.75, respectively (Figure 6a). However, the NDVI of the shadows was less than that of the sunny area, and the NDVI mean of the sunny areas was 0.75, while those of the self-shadow and cast shadow were 0.36 and 0.40, respectively. The relative SEVI errors of self-shadow and cast shadow (vs. sunny area) were only 4.99% and 1.84%, respectively (Figure 6b). However, the NDVI relative errors of self-shadow and cast shadow were −51.44% and −46.26%, respectively. Scatter plots of the vegetation indices vs. cos i showed that the linear regression of SEVI vs. cos i was nearly horizontal, with an inclination of −0.0207 and an r2 of 0.0042 (Figure 7a). The points were distributed in a concentrated way, evenly on both sides of the regression line. However, the linear regression of NDVI vs. cos i had an inclination of 0.3484 and an r2 of 0.3104, and the points were dispersed (Figure 7b). The performance of the SEVI in the removal of the topographic effect in rugged mountain areas verified that the BIE-algorithm was effective in the calculation of an accurate SEVI.

4.3. Vegetation Distribution

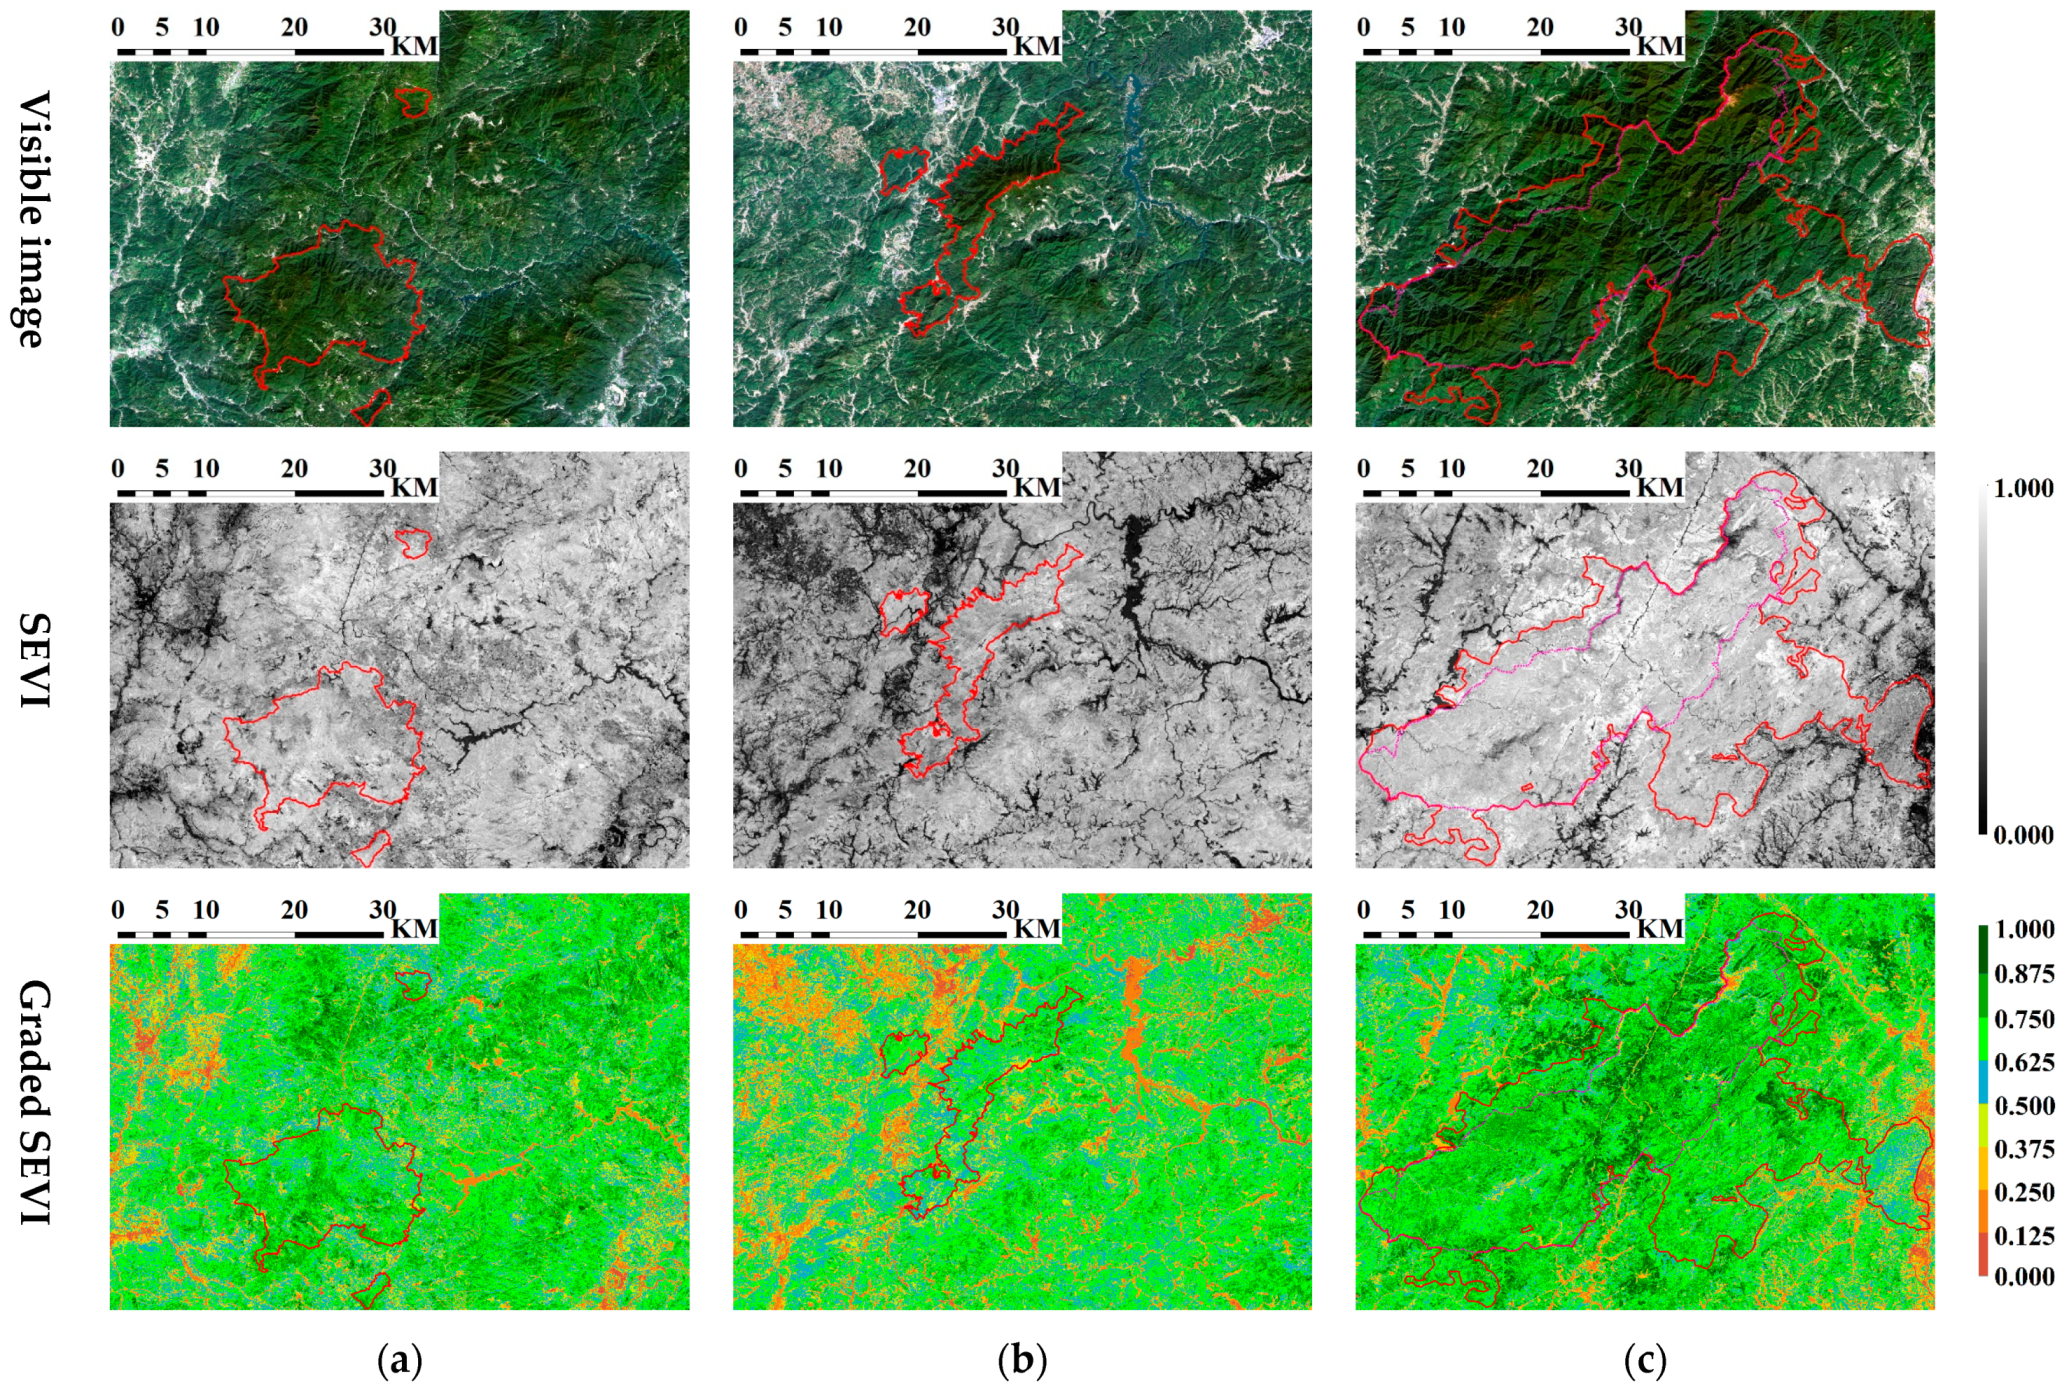
The regional vegetation in the form of the SEVI and graded SEVI is shown in Figure 4, in which the graded SEVI showed a better visualization of the vegetation distribution (Figure 4b). It was shown that the three protected areas had high SEVI, from about 0.625 to 1.000. The clipped visible image, SEVI, and graded SEVI of the three protected areas displayed vegetation distributions and characteristics in detail (Figure 8). The visible image of protected areas had a strong relief effect with prominent fragmentized shadows, specifically in the WYS image. However, the SEVI exhibited an overall flat feature with the impression of relief removed. The graded SEVI showed the green level sequence of three protected areas as WYS > MHS > MJY, with the dominant color changing from dark green to bright green and blue. Specifically, the east corner of WYS was located mainly due to its medium SEVI in blue, and MJY was surrounded by low SEVI in yellow and brown.
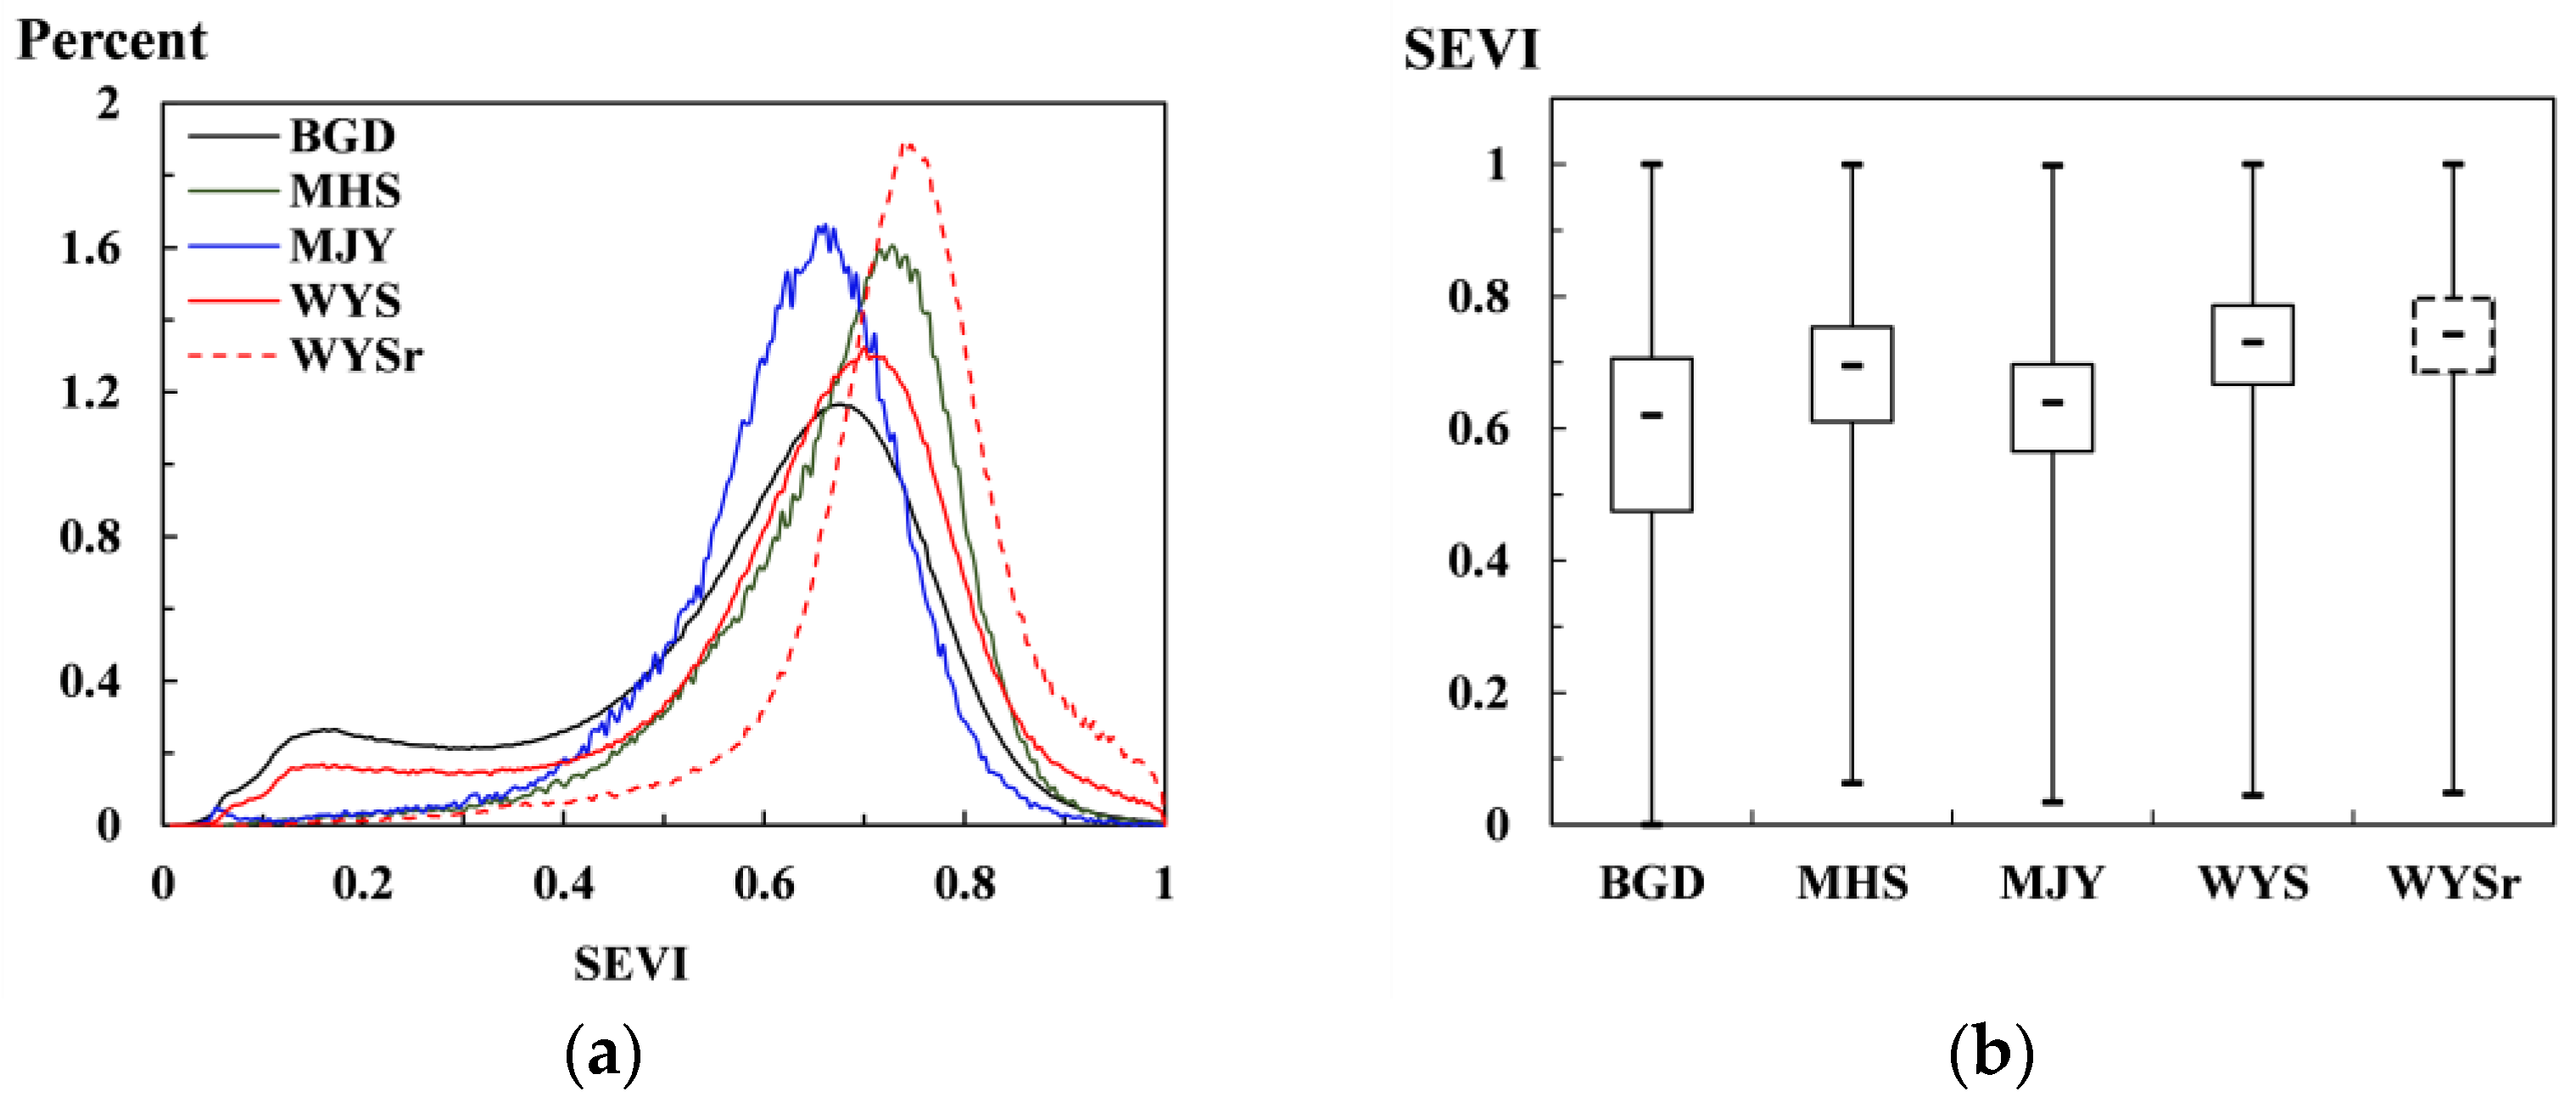
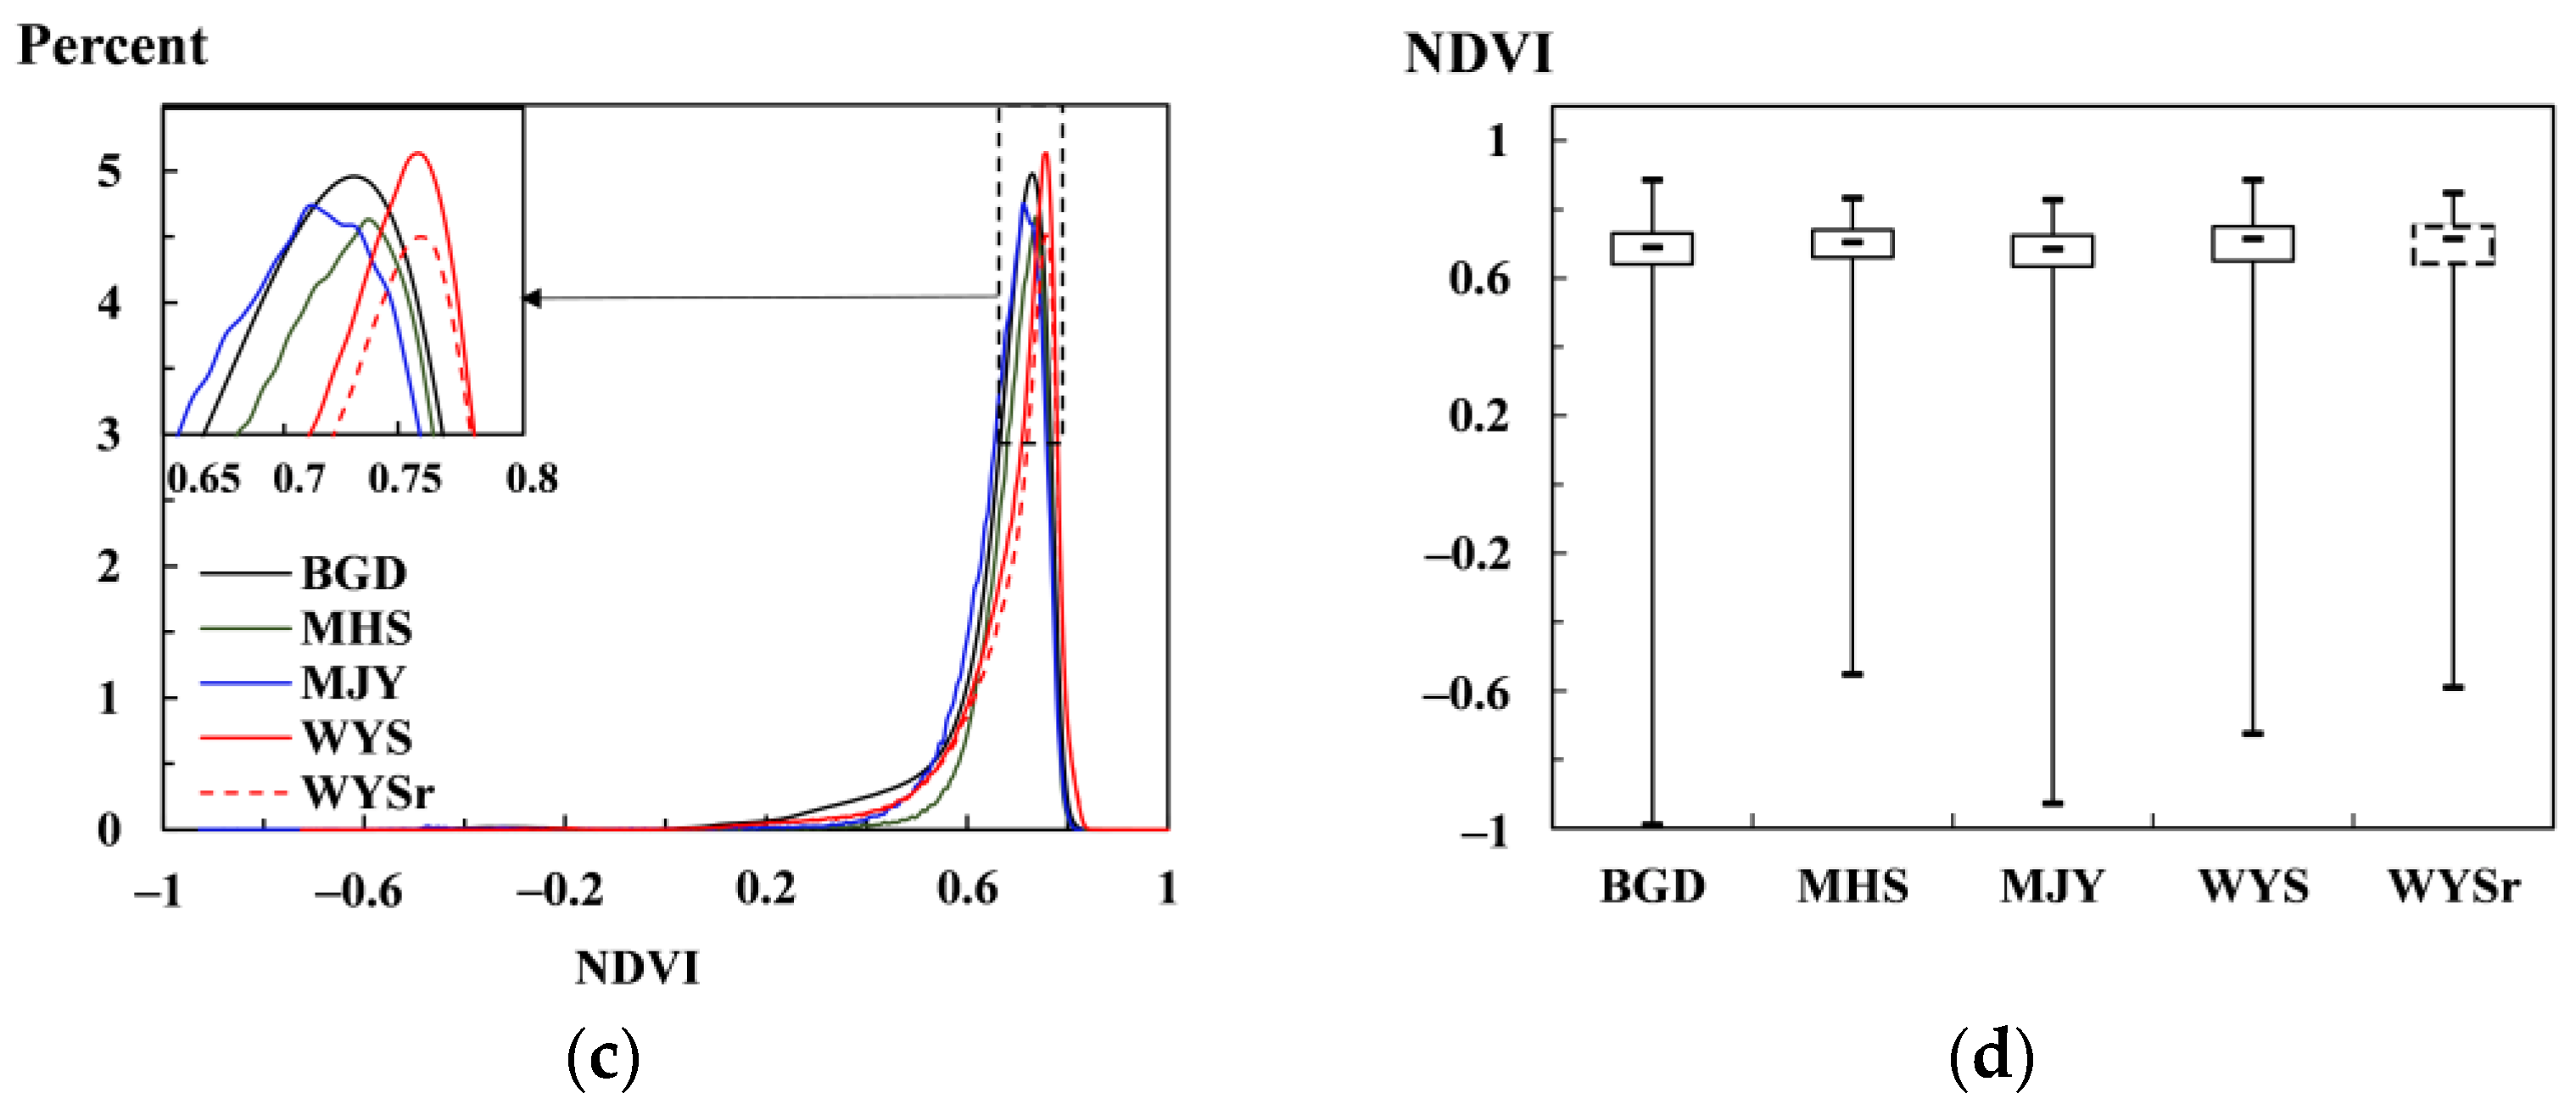
The histograms of the SEVI percentage showed that MJY and MHS had nearly normal distributions with one peak (blue and green lines in Figure 9a); however, WYS and BGD had two peaks (red and black lines in Figure 9a), i.e., a bimodal distribution. The SEVI means of the three protected areas and BGD showed a sequence of WYS (0.718) > MHS (0.672) > MJY (0.624) > BGD (0.572) (Table 2), which were in accordance with the green level sequence in Figure 8. Specifically, the SEVI histogram of the WYSr, as the precursor of the WYS, was also normally distributed with one peak (red dotted line in Figure 9a) and the SEVI mean reached 0.736. In addition, the box plot showed the same sequence of the SEVI medium, and the interval ranged from quarter 1 to quarter 3 (Figure 9b). These SEVI distribution characteristics indicated that the protected areas achieved a higher abundance and activity of green vegetation than the regional background, and three protected areas showed a sequence of WYS > MHS > MJY. In contrast, the histograms of the NDVI percentages of the three protected areas and BGD showed only one peak, and the means of NDVI showed an abnormal sequence of MHS (0.695) > WYS (0.686) > MJY (0.671) > BGD (0.658) (Figure 9c). Meanwhile, the histogram and box plot of NDVI were compressed, which decreased the discriminations among the three protected areas (Figure 9c,d).
The SEVI means of buffer zones (yellow shapes in Figure 4a,b) and years of establishment of protected areas showed the same sequence of the three protected areas, WYS > MHS > MJY (Table 2). Among the three protected areas, WYS achieved the highest SEVI means in the protected area and buffer zone, with 0.718 and 0.648, respectively, the steepest topographic slope with a mean of 26.8°, and the longest years of establishment at 39 years (from 1979 to 2018). As for MJY and MHS, their slope mean was approximate; however, the SEVI mean of the buffer zone and the years of establishment were different. Apparently, the vegetation growth in the protected areas was influenced by the establishment years of the protected area, the terrain slope, and the buffer zone.

5. Discussion

5.1. BIE-Algorithm

Considering the spectral features and topographic characteristics of rugged mountain areas, we developed the BIE-algorithm to improve the calculation of the best adjustment factor for SEVI. The BIE-algorithm was an improvement in locating a rugged subarea from manual selection to auto-detection by block searching. It did not need visual checking of the spectral features of rugged terrain by manual inspection, e.g., checking prominent terrain shadows. In addition, the block is fixed since the slope of the mountain is permanent unless intense mountain movement, such as an earthquake, occurs. A block size of 6 × 6 km2 is an empirical parameter, which is based on the conventional difference in the height and slope length from the top of the mountain to the base. This size of the block covers some sunny areas and shaded areas and helps to analyze the spectral feature of rugged terrain to obtain an optimized adjustment factor. The square shape of the block is a benefit to slope resampling at a high spatial resolution to a low resolution and for the clipping of remote sensing images with minimum noise or abnormal pixels, which is better for the subsequent calculation of vegetation indices and information entropy. The new calculation algorithm was also an improvement in the use of information entropy to evaluate SEVI of blocks and to obtain the best adjustment factor for an entire scene image. The information entropy provides a suitable and universal indicator to obtain the optimal adjustment factor for a block by judging the information entropy of SEVI, and to further select the best adjustment factor for a whole scene from the block that achieved the largest information entropy. However, the homogeneous distribution of vegetation in a block is a precondition for the BIE-algorithm, which is influenced by many factors, such as the actual vegetation types, block size, and shape. In the next step, the proposed BIE-algorithm is used to obtain the regional SEVI from multi-scenes images, e.g., the SEVI of South China.

5.2. SEVI Feature

The feature of SEVI in the removal of the topographic effect in rugged mountains is useful in monitoring vegetation distributions of protected areas in rugged terrains. In this study, the vegetation-level sequence of three national protected areas, Wuyishan National Park > Meihuashan National Nature Reserve > Minjiangyuan National Nature Reserve, was obtained using SEVI, rather than the abnormal sequence of Meihuashan National Nature Reserve > Wuyishan National Park > Minjiangyuan National Nature Reserve using the frequently applied NDVI. Since Wuyishan National Park has a steeper rugged terrain than the Meihuashan National Nature Reserve and the Minjiangyuan National Nature Reserve, e.g., the slope mean of Wuyishan National Park reaches nearly 27°, the under-illuminated effect of Wuyishan National Park is greater than that of the two other protected areas. The vegetation level monitored by NDVI was decreased due to the under-illuminated effect of the topographic shadow areas. The SEVI is able to remove the under-illuminated effect of topographic shadows, therefore it is more suitable for monitoring the vegetation distribution of protected areas in rugged mountains and obtaining the correct vegetation level sequence of protected areas. In addition, it is a significant precondition to acquiring remote-sensing images on the same day for contrast vegetation of the protected areas using transverse comparison methods, since phenology strongly influences the water, carbon, and energy fluxes of vegetation [56,57,58]. In this study, we downloaded 13 scenes of Landsat 8 OLI images that covered all protected areas in the Fujian Province of China; however, only two scenes acquired on the same day were finally used due to the phenology effect. Though the number of protected areas was decreased to three in these two scenes, the vegetation phenology and solar angles were kept consistent among the three protected areas. Therefore, we could use the transverse comparison method to discover the vegetation distribution characteristics of these three protected areas using the SEVI, when the conditions of the sensor, solar, atmospheric, and topographic effects were kept the same for the three protected areas. In the next step, we will study and compare more protected areas using data with the same conditions of the sensor, solar, phenology, atmosphere, and topography. Meanwhile, the normalization of SEVI from different solar conditions and/or sensors will be studied when multi-source remote-sensing images are used to monitor regional vegetation distribution and changes.

5.3. Vegetation of Protected Areas

It is significant to study the vegetation in protected areas where vegetation grows naturally with minimal eco-society environmental stress from human beings. In this study, vegetation in the form of SEVI showed that protected areas achieved a higher abundance and activity of green vegetation than the corresponding regional area. The regional SEVI of these two mosaicked scenes showed a bimodal histogram, since this region covers many areas with a low SEVI value in the second peak, e.g., water, rock, farmland, buildings, and roads, in addition to the predominant forest as a high SEVI value in the main peak. Farmland, buildings, and roads are the result of environmental stress from anthropogenic activities. Although the vegetation of Wuyishan National Park also showed a bimodal histogram SEVI, it achieved the highest SEVI mean among the three protected areas. The Wuyishan National Park expanded from the Wuyishan National Nature Reserve and included a traditional utilization area and ecological restoration area, which humans developed for tours and cash crops, such as the Wuyishan Scenery District, rock tea, buildings, and roads. However, the vegetation of the three national nature reserves of Wuyishan, Meihuashan, and Minjiangyuan showed a nearly normal distribution of the SEVI histogram, which indicated that a low SEVI of water, rock, farmland, buildings, and roads was scarce in these areas, i.e., they suffered minimal external human disturbances. Wuyishan National Park achieved the highest SEVI mean; however, the Minjiangyuan National Nature Reserve obtained the lowest SEVI mean among the three protected areas. These vegetation distribution characteristics were influenced by many interior and exterior factors, e.g., the rugged terrain and years of establishment of the protected areas, and the human activities in the surrounding buffer zones. Therefore, it is vital to establish protected areas in remote rugged mountains as early as possible, where vegetation grows naturally with minimal influence from anthropogenic activities. Considering the limited data used in the vegetation analysis in this study, in the next step, we will further study the vegetation in protected areas using time-series images and more parameters, e.g., classified vegetation categories [12], biophysical parameters, landscape indices, and carbon sink. Meanwhile, the data from exterior influence factors of meteorology [59,60], economy, and society will be discussed. In addition, new actions taken by the Wuyishan National Park, in terms of vegetation protection and regional eco-society sustainable development, will be compared to its precursor, the Wuyishan National Nature Reserve.

6. Conclusions

We developed a new calculation algorithm using block information entropy to auto-detect typical subareas of rugged terrain and achieve the best adjustment factor for the calculation of the shadow-eliminated vegetation index. A regional mosaicked SEVI computed from two scenes of Landsat 8 OLI images using the BIE-algorithm was verified as having a high performance in the removal of the topographic effect. Vegetation monitoring and analysis of the three protected areas using the improved SEVI showed that the vegetation-growth-level sequence was Wuyishan National Park > Meihuashan National Nature Reserve > Minjiangyuan National Nature Reserve > regional background. Vegetation growth and protection were influenced by rugged terrain and the years of establishment of the protected area and the surrounding buffer zone. It is important to establish protected areas in remote rugged mountains as early as possible for local vegetation growth and preservation. The improved SEVI with the BIE-algorithm is able to use vegetation assessment, classification, mapping, and biophysical parameters in retrieving large areas of rugged mountains. As the next step, we will consider developing a small program to facilitate our improved SEVI with the developed BIE-algorithm for future study and applications.

Author Contributions

Conceptualization, H.J.; methodology, H.J.; software, H.J. and J.G.; validation, H.J., M.Y. and Z.Z.; formal analysis, H.J. and W.W.; investigation, H.J. and Z.Z.; data curation, H.J. and M.Y.; writing—original draft preparation, H.J. and M.Y.; writing—review and editing, H.J., Z.Z. and Z.M.; visualization, H.J. and M.Y. All authors have read and agreed to the published version of the manuscript.

Funding

This research was funded by [the Science and Technology Plan Leading Project of Fujian Province, China] grant number [2021Y0005]. The APC was funded by [the Science and Technology Plan Leading Project of Fujian Province, China].

Acknowledgments

The authors thank the editors and anonymous reviewers for their constructive suggestions and valuable comments. We thank Chenghai Yang, Ailin Chen, Zhaohui Chi, Tong Ren and Neal Scogin for their valuable contributions.

Conflicts of Interest

The authors declare no conflict of interest.

References

  1. Pereira, H.M.; Leadley, P.W.; Proença, V.; Alkemade, R.; Scharlemann, J.P.W.; Fernandez-Manjarrés, J.F.; Araújo, M.B.; Balvanera, P.; Biggs, R.; Cheung, W.W.L.; et al. Scenarios for global biodiversity in the 21st century. Science 2010, 330, 1496–1501. [Google Scholar] [CrossRef] [PubMed] [Green Version]
  2. Bellassen, V.; Luyssaert, S. Carbon sequestration: Managing forests in uncertain times. Nature 2014, 506, 153–155. [Google Scholar] [CrossRef] [PubMed] [Green Version]
  3. Le Quéré, C.; Andrew, R.M.; Friedlingstein, P.; Sitch, S.; Hauck, J.; Pongratz, J.; Pickers, P.A.; Korsbakken, J.I.; Peters, G.P.; Canadell, J.G.; et al. Global carbon budget 2018. Earth Syst. Sci. Data 2018, 10, 2141–2194. [Google Scholar] [CrossRef] [Green Version]
  4. Di Marco, M.; Watson, J.E.M.; Currie, D.J.; Possingham, H.P.; Venter, O. The extent and predictability of the biodiversity-carbon correlation. Ecol. Lett. 2018, 21, 365–375. [Google Scholar] [CrossRef] [Green Version]
  5. Buřivalová, Z.; Hart, S.J.; Radeloff, V.C.; Srinivasan, U. Early warning sign of forest loss in protected areas. Curr. Biol. 2021, 31, 4620–4626. [Google Scholar] [CrossRef]
  6. Cao, M.; Peng, L.; Liu, S. Analysis of the network of protected areas in China based on a geographic perspective: Current status, issues and integration. Sustainability 2015, 7, 15617–15631. [Google Scholar] [CrossRef] [Green Version]
  7. Tang, J.; Lu, H.; Xue, Y.; Li, J.; Li, G.; Mao, Y.; Deng, C.; Li, D. Data-driven planning adjustments of the functional zoning of Houhe National Nature Reserve. Glob. Ecol. Conserv. 2021, 29, e01708. [Google Scholar] [CrossRef]
  8. Ding, Y.; Qiu, M. Research on establishing nature reserve system with national park as the main body: A case study of Potatso National Park system pilot area. Int. J. Geoherit. Parks 2020, 8, 239–243. [Google Scholar] [CrossRef]
  9. Fassnacht, F.E.; Latifi, H.; Koch, B. An angular vegetation index for imaging spectroscopy data—Preliminary results on forest damage detection in the Bavarian National Park, Germany. Int. J. Appl. Earth Obs. 2012, 19, 308–321. [Google Scholar] [CrossRef]
  10. Wang, G.; Wang, M.; Yuan, Y.; Lu, X.; Jiang, M. Effects of sediment load on the seed bank and vegetation of Calamagrostis angustifolia wetland community in the National Natural Wetland Reserve of Lake Xingkai, China. Ecol. Eng. 2014, 63, 27–33. [Google Scholar] [CrossRef]
  11. Powers, R.P.; Coops, N.C.; Nelson, T.; Wulder, M.A. Evaluating nature reserve design efficacy in the Canadian Boreal forest using time series AVHRR data. Can. J. Remote Sens. 2016, 42, 171–189. [Google Scholar] [CrossRef]
  12. Yu, B.; Chao, X.; Zhang, J.; Xu, W.; Ouyang, Z. Effectiveness of nature reserves for natural forests protection in tropical Hainan: A 20 year analysis. Chin. Geogr. Sci. 2016, 26, 208–215. [Google Scholar] [CrossRef] [Green Version]
  13. Hamadou, A.Z.; Hyacente, A.; Paul, K.; Danra, D.D.; Clautilde, M. Influence of anthropization on flora and the carbon stock of the corridor’s vegetation at the Benoue National Park of Cameroon. Environ. Chall. 2021, 5, 100345. [Google Scholar] [CrossRef]
  14. Mengist, W.; Soromessa, T.; Feyisa, G.L. Monitoring Afromontane forest cover loss and the associated socio-ecological drivers in Kaffa Biosphere Reserve, Ethiopia. Trees For. People 2021, 6, 100161. [Google Scholar] [CrossRef]
  15. Townshend, J.R.; Masek, J.G.; Huang, C.; Vermote, E.F.; Gao, F.; Channan, S.; Sexton, J.O.; Feng, M.; Narasimhan, R.; Kim, D.; et al. Global characterization and monitoring of forest cover using Landsat data: Opportunities and challenges. Int. J. Digit. Earth 2012, 5, 373–397. [Google Scholar] [CrossRef] [Green Version]
  16. Alphonse, K.; Alishir, K.; Felix, N.; Lamek, N.; Fidele, K.; Abdimijit, A.; Haiwen, L.; Osman, I. Monitoring forest cover change and fragmentation using remote sensing and landscape metrics in Nyungwe-Kibira park. J. Geosci. Environ. Prot. 2016, 4, 11–33. [Google Scholar]
  17. Da Ponte, E.; Mack, B.; Wohlfart, C.; Rodas, O.; Fleckenstein, M.; Oppelt, N.; Dech, S.; Kuenzer, C. Assessing forest cover dynamics and forest perception in the Atlantic forest of Paraguay, combining remote sensing and household level data. Forests 2017, 8, 389. [Google Scholar] [CrossRef] [Green Version]
  18. Garioud, A.; Valero, S.; Giordano, S.; Mallet, C. Recurrent-based regression of Sentinel time series for continuous vegetation monitoring. Remote Sens. Environ. 2021, 263, 112419. [Google Scholar] [CrossRef]
  19. Wulder, M.A.; Masek, J.G.; Cohen, W.B.; Loveland, T.R.; Woodcock, C.E. Opening the archive: How free data has enabled the science and monitoring promise of Landsat. Remote Sens. Environ. 2012, 122, 2–10. [Google Scholar] [CrossRef]
  20. Bai, Y. Analysis of vegetation dynamics in the Qinling-Daba Mountains region from MODIS time series data. Ecol. Indic. 2021, 129, 108029. [Google Scholar] [CrossRef]
  21. Hansen, M.C.; Potapov, P.V.; Moore, R.; Hancher, M.; Turubanova, S.A.; Tyukavina, A.; Thau, D.; Stehman, S.V.; Goetz, S.J.; Loveland, T.R.; et al. High-resolution global maps of 21st-century forest cover change. Science 2013, 342, 850–853. [Google Scholar] [CrossRef] [PubMed] [Green Version]
  22. Thapa, R.B.; Shimada, M.; Watanabe, M.; Motohka, T.; Shiraishi, T. The tropical forest in south east Asia: Monitoring and scenario modeling using synthetic aperture radar data. Appl. Geogr. 2013, 41, 168–178. [Google Scholar] [CrossRef]
  23. Silveira, E.M.O.; Radeloff, V.C.; Martinuzzi, S.; Pastur, G.J.M.; Rivera, L.O.; Politi, N.; Lizarraga, L.; Farwell, L.S.; Elsen, P.R.; Pidgeon, A.M. Spatio-temporal remotely sensed indices identify hotspots of biodiversity conservation concern. Remote Sens. Environ. 2021, 258, 112368. [Google Scholar] [CrossRef]
  24. Chance, C.M.; Hermosilla, T.; Coops, N.C.; Wulder, M.A.; White, J.C. Effect of topographic correction on forest change detection using spectral trend analysis of Landsat pixel-based composites. Int. J. Appl. Earth Obs. 2016, 44, 186–194. [Google Scholar] [CrossRef]
  25. Bishop, M.P.; Young, B.; Colby, J.; Furfaro, R.; Schiassi, E.; Chi, Z. Theoretical evaluation of anisotropic reflectance correction approaches for addressing multi-scale topographic effects on the radiation-transfer cascade in mountain environments. Remote Sens. 2019, 11, 2728. [Google Scholar] [CrossRef] [Green Version]
  26. Moreira, E.P.; Valeriano, M.M. Application and evaluation of topographic correction methods to improve land cover mapping using object-based classification. Int. J. Appl. Earth Obs. 2014, 32, 208–217. [Google Scholar] [CrossRef]
  27. Li, H.; Xu, L.; Shen, H.; Zhang, L. A general variational framework considering cast shadows for the topographic correction of remote sensing imagery. ISPRS Int. J. Geo-Inf. 2016, 117, 161–171. [Google Scholar] [CrossRef]
  28. Teillet, P.M.; Guindon, B.; Goodenough, D.G. On the slope-aspect correction of multispectral scanner data. Can. J. Remote Sens. 1982, 8, 84–106. [Google Scholar] [CrossRef] [Green Version]
  29. Civco, D.L. Topographic normalization of landsat thematic mapper digital imagery. Photogramm. Eng. Remote Sens. 1989, 55, 1303–1309. [Google Scholar]
  30. Meyer, P.; Itten, K.L.; Kellenberger, T.; Sandmeier, S.; Sandmeier, R. Radiometric corrections of topographically induced effects on Landsat TM data in an alpine environment. ISPRS J. Photogramm. Remote Sens. 1993, 48, 17–28. [Google Scholar] [CrossRef]
  31. Gu, D.; Gillespie, A. Topographic normalization of Landsat TM images of forest based on subpixel sun–canopy–sensor geometry. Remote Sens. Environ. 1998, 64, 166–175. [Google Scholar] [CrossRef]
  32. Riano, D.; Chuvieco, E.; Salas, J.; Aguado, I. Assessment of different topographic corrections in Landsat TM data for mapping vegetation types. IEEE Trans. Geosci. Remote Sens. 2003, 41, 1056–1061. [Google Scholar] [CrossRef] [Green Version]
  33. Soenen, S.A.; Peddle, D.R.; Coburn, C.A. SCS + C: A modified sun-canopy-sensor topographic correction in forested terrain. IEEE Trans. Geosci. Remote Sens. 2005, 43, 2148–2159. [Google Scholar] [CrossRef]
  34. Vázquez-Jiménez, R.; Romero-Calcerrada, R.; Ramos-Bernal, R.; Arrogante-Funes, P.; Novillo, C. Topographic correction to Landsat imagery through slope classification by applying the SCS + C Method in mountainous forest areas. ISPRS Int. J. Geo-Inf. 2017, 6, 287. [Google Scholar] [CrossRef]
  35. Smith, J.A.; Lin, T.L.; Ranson, K.J. The lambertian assumption and Landsat data. Photogramm. Eng. Remote Sens. 1980, 46, 1183–1189. [Google Scholar]
  36. Kane, V.; Gillespie, A.; McGaughey, R.; Lutz, J.; Ceder, K.; Franklin, J. Interpretation and topographic compensation of conifer canopy self-shadowing. Remote Sens. Environ. 2008, 112, 3820–3832. [Google Scholar] [CrossRef]
  37. Richter, R.; Kellenberger, T.; Kaufmann, H. Comparison of topographic correction methods. Remote Sens. 2009, 1, 184–196. [Google Scholar] [CrossRef] [Green Version]
  38. Sandmeier, S.; Itten, K.I. A physically-based model to correct atmospheric and illumination effects in optical satellite data of rugged terrain. IEEE Trans. Geosci. Remote Sens. 1997, 35, 708–717. [Google Scholar] [CrossRef] [Green Version]
  39. Santini, F.; Palombo, A. Physically based approach for combined atmospheric and topographic corrections. Remote Sens. 2019, 11, 1218. [Google Scholar] [CrossRef] [Green Version]
  40. Wen, J.; Liu, Q.; Liu, Q.; Xiao, Q.; Li, X. Parametrized BRDF for atmospheric and topographic correction and albedo estimation in Jiangxi rugged terrain, China. Int. J. Remote Sens. 2009, 30, 2875–2896. [Google Scholar] [CrossRef]
  41. Yin, G.; Li, A.; Wu, S.; Fan, W.; Zeng, Y.; Yan, K.; Xu, B.; Li, J.; Liu, Q. PLC: A simple and semi-physical topographic correction method for vegetation canopies based on path length correction. Remote Sens. Environ. 2018, 215, 184–198. [Google Scholar] [CrossRef]
  42. Chen, J.M.; Leblanc, S.G. A four-scale bidirectional reflectance model based on canopy architecture. IEEE Trans. Geosci. Remote Sens. 1997, 35, 1316–1337. [Google Scholar] [CrossRef]
  43. Fan, W.; Li, J.; Liu, Q.; Zhang, Q.; Yin, G.; Li, A.; Zeng, Y.; Xu, B.; Xu, X.; Zhou, G.; et al. Topographic correction of forest image data based on the canopy reflectance model for sloping terrains in multiple forward mode. Remote Sens. 2018, 10, 717. [Google Scholar] [CrossRef] [Green Version]
  44. Liao, Z.; He, B.; Quan, X. Modified enhanced vegetation index for reducing topographic effects. J. Appl. Remote Sens. 2015, 9, 096068. [Google Scholar] [CrossRef]
  45. Jiang, H.; Wang, S.; Cao, X.; Yang, C.; Zhang, Z.; Wang, X. A shadow-eliminated vegetation index (SEVI) for removal of self and cast shadow effects on vegetation in rugged terrains. Int. J. Digit. Earth 2019, 12, 1013–1029. [Google Scholar] [CrossRef] [Green Version]
  46. Shannon, C.E. A mathematical theory of communication. Bell Syst. Tech. J. 1948, 27, 379–423. [Google Scholar] [CrossRef] [Green Version]
  47. Harte, J.; Newman, E.A. Maximum information entropy: A foundation for ecological theory. Trends Ecol. Evol. 2014, 29, 384–389. [Google Scholar] [CrossRef]
  48. Parrott, L. Measuring ecological complexity. Ecol. Indic. 2010, 10, 1069–1076. [Google Scholar] [CrossRef]
  49. Rodríguez, R.A.; Herrera, A.M.; Quirós, Á.; Fernández-Rodríguez, M.J.; Delgado, J.D.; Jiménez-Rodríguez, A.; Fernández-Palacios, J.M.; Otto, R.; Escudero, C.G.; Luhrs, T.C.; et al. Exploring the spontaneous contribution of Claude, E. Shannon to eco-evolutionary theory. Ecol. Model. 2016, 327, 57–64. [Google Scholar] [CrossRef]
  50. Wang, C.; Zhao, H. Analysis of remote sensing time-series data to foster ecosystem sustainability: Use of temporal information entropy. Int. J. Remote Sens. 2019, 40, 2880–2894. [Google Scholar] [CrossRef]
  51. Liu, G.; Yang, Z.; Chen, B.; Zhang, L.; Zhang, Y.; Su, M. An ecological network perspective in improving reserve design and connectivity: A case study of Wuyishan Nature Reserve in China. Ecol. Model. 2015, 306, 185–194. [Google Scholar] [CrossRef]
  52. Gao, S.; Chen, B.; Yang, Z.; Huang, G. Network environ analysis of spatial arrangement for reserves in Wuyishan Nature Reserve, China. J. Environ. Inform. 2010, 15, 74–86. [Google Scholar] [CrossRef]
  53. He, S.; Gallagher, L.; Su, Y.; Wang, L.; Cheng, H. Identification and assessment of ecosystem services for protected area planning: A case in rural communities of Wuyishan National Park pilot. Ecosyst. Serv. 2018, 31, 169–180. [Google Scholar] [CrossRef]
  54. Hantson, S.; Chuvieco, E. Evaluation of different topographic correction methods for Landsat imagery. Int. J. Appl. Earth Obs. 2011, 13, 691–700. [Google Scholar] [CrossRef]
  55. Tobler, W.R. A computer movie simulating urban growth in the Detroit region. Econ. Geogr. 1970, 46, 234–240. [Google Scholar] [CrossRef]
  56. Moon, M.; Li, D.; Liao, W.; Rigden, A.J.; Friedl, M.A. Modification of surface energy balance during springtime: The relative importance of biophysical and meteorological changes. Agric. For. Meteorol. 2020, 284, 107905. [Google Scholar] [CrossRef]
  57. Richardson, A.D.; Keenan, T.F.; Migliavacca, M.; Ryu, Y.; Sonnentag, O.; Toomey, M. Climate change, phenology, and phenological control of vegetation feedbacks to the climate system. Agric. For. Meteorol. 2013, 169, 156–173. [Google Scholar] [CrossRef]
  58. Keenan, T.F.; Darby, B.; Felts, E.; Sonnentag, O.; Friedl, M.A.; Hufkens, K.; O’Keefe, J.; Klosterman, S.; Munger, J.W.; Toomey, M.; et al. Tracking forest phenology and seasonal physiology using digital repeat photography: A critical assessment. Ecol. Appl. 2014, 24, 1478–1489. [Google Scholar] [CrossRef] [Green Version]
  59. Duffield, S.J.; Le Bas, B.; Morecroft, M.D. Climate change vulnerability and the state of adaptation on England’s National Nature Reserves. Biol. Conserv. 2021, 254, 108938. [Google Scholar] [CrossRef]
  60. Gonzalez, P.; Wang, F.; Notaro, M.; Vimont, D.J.; Williams, J.W. Disproportionate magnitude of climate change in United States national parks. Environ. Res. Lett. 2018, 13, 104001. [Google Scholar] [CrossRef] [Green Version]
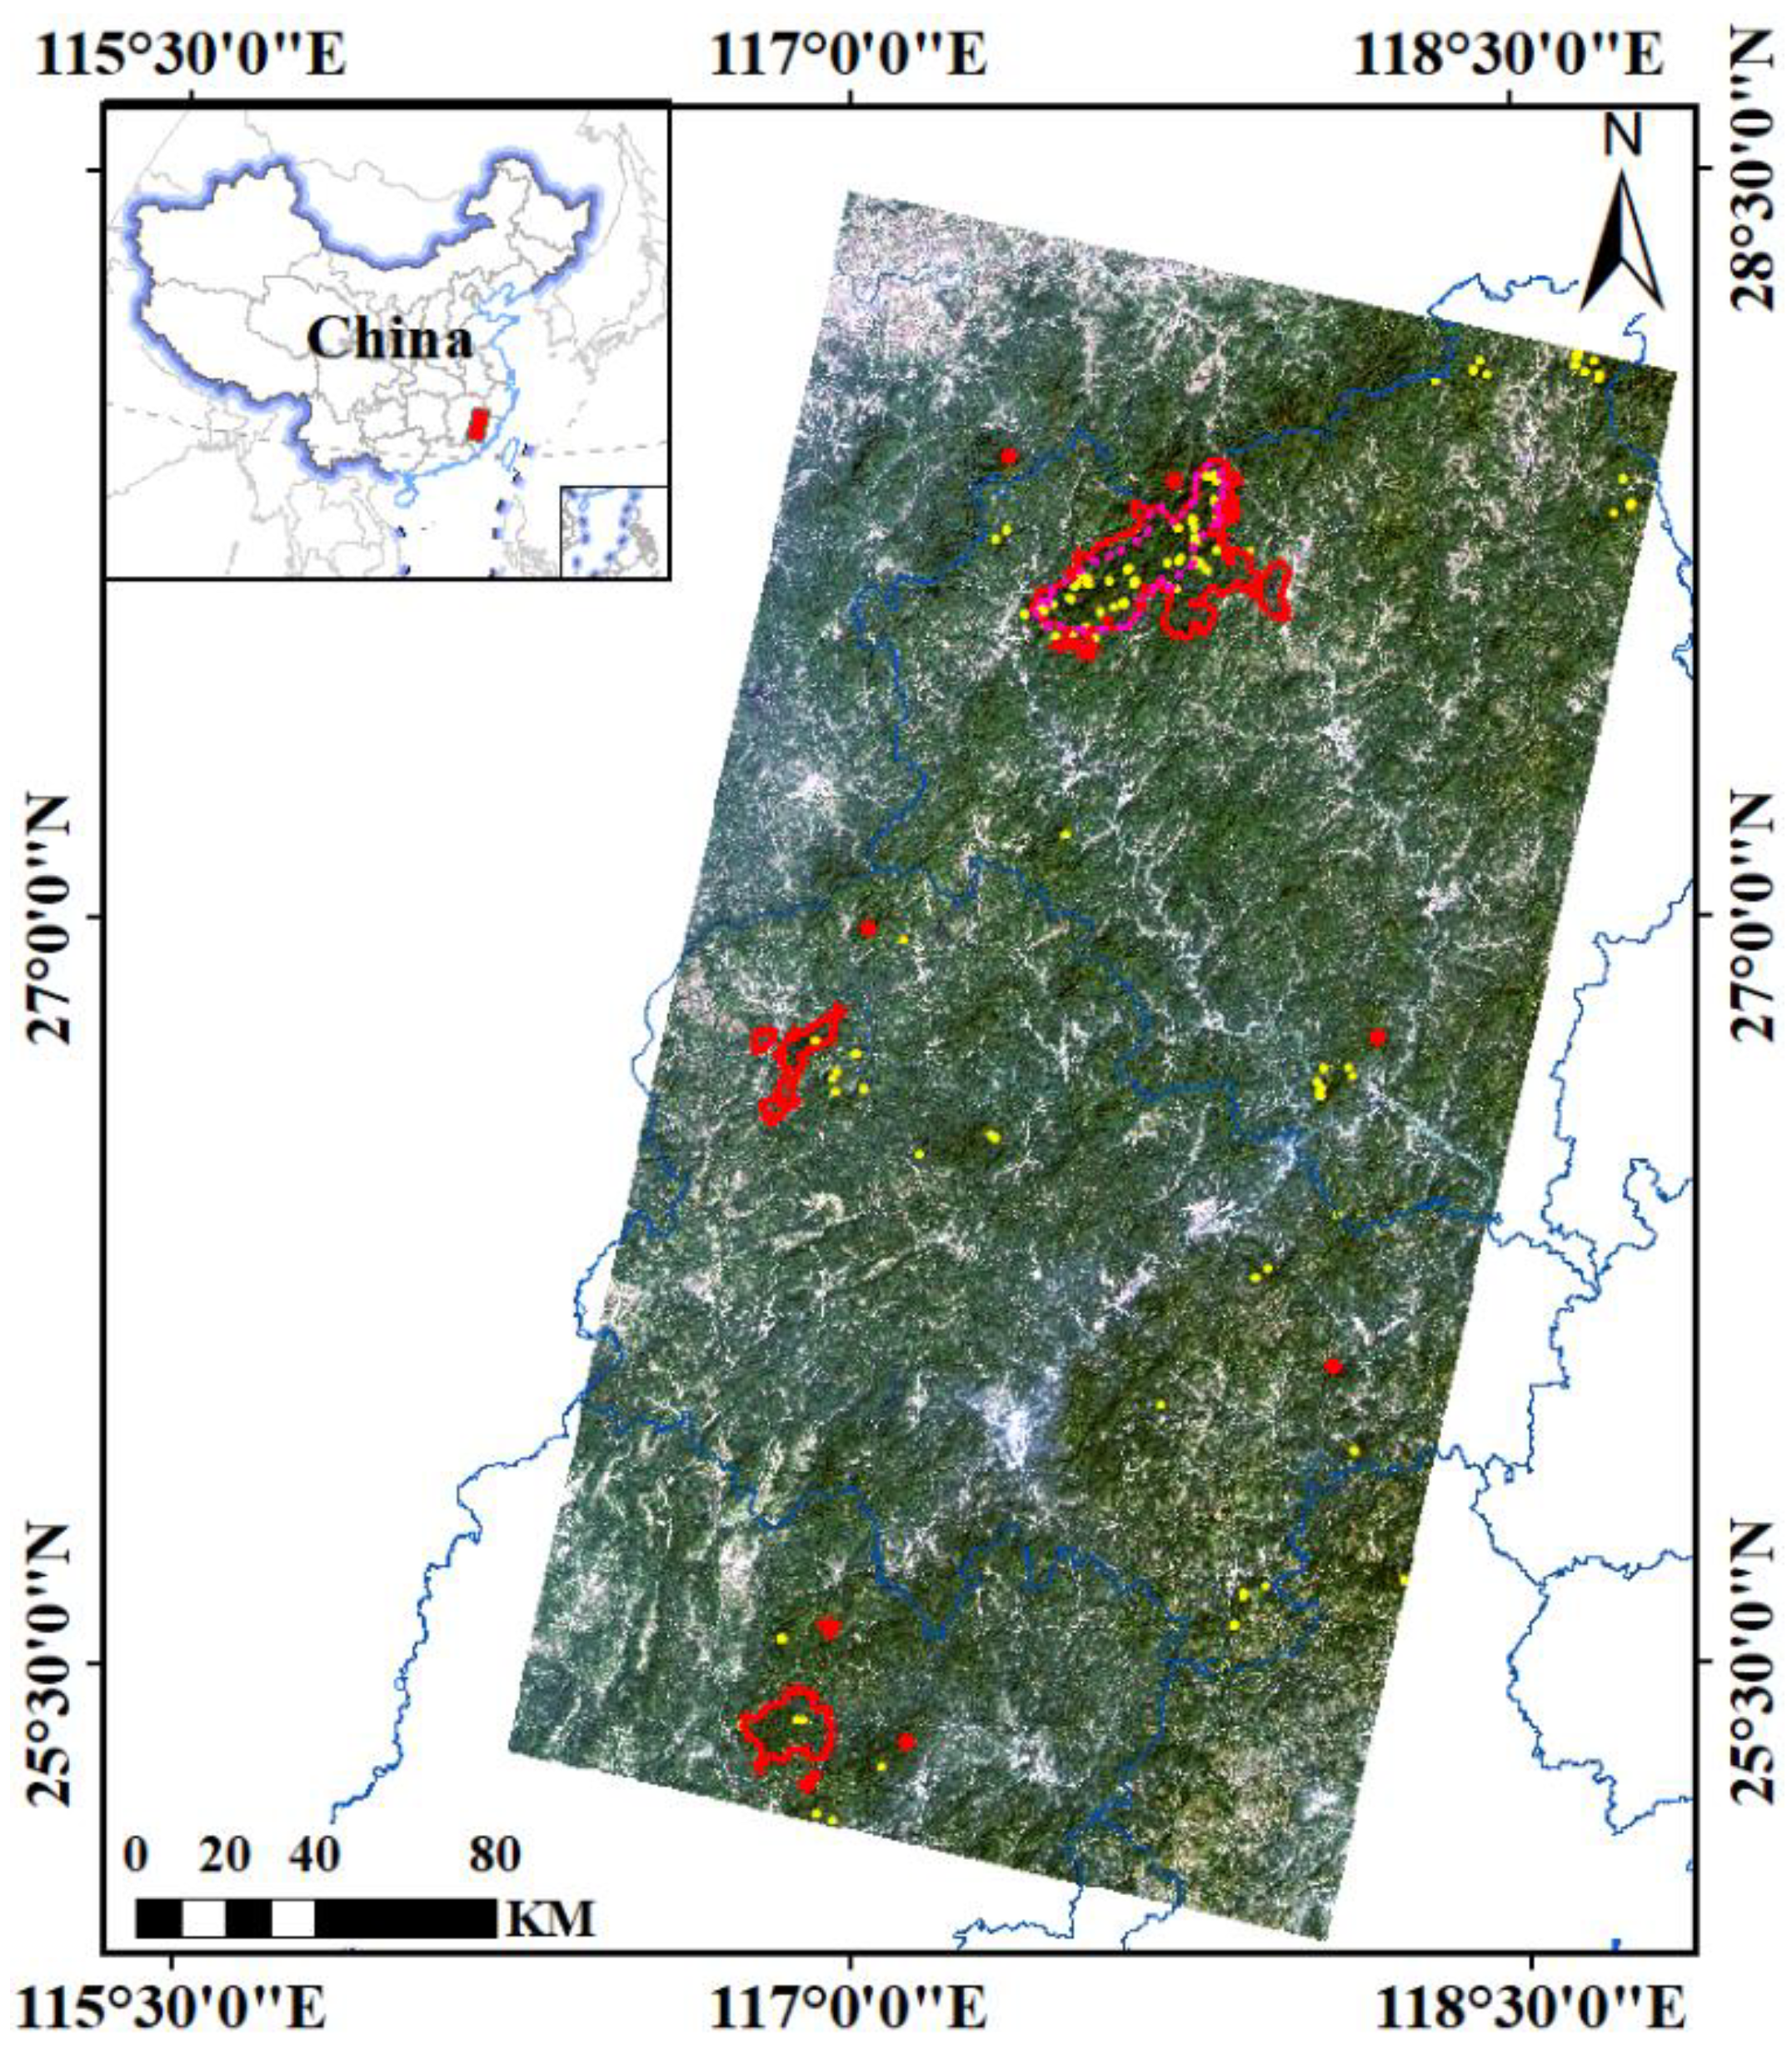
Figure 1. Location of the three protected areas: The Meihuashan National Nature Reserve (MHS), Minjiangyuan National Nature Reserve (MJY), and Wuyishan National Park (WYS) (red shapes), sample areas (red points), and samples (yellow points) in two scenes of Landsat 8 Operational Land Imager (OLI) images (Path/Row of 120/41 and 120/42, red–green–blue (RGB) composite).
Remotesensing 14 00882 g001
Figure 2. Flow chart of a new algorithm to calculate the improved SEVI using block information entropy (BIE-algorithm) and vegetation monitoring and analysis of protected areas.
Remotesensing 14 00882 g002
Figure 3. Blocks and adjustment factors: (a) Blocks (yellow pixels) in slope image with 6-km spatial resolution; (b) optimized adjustment factor for a block, marked in red circle; (c) best adjustment factors for two scenes of Landsat 8 OLI images, marked in red circles.
Remotesensing 14 00882 g003
Figure 4. Mosaicked SEVI and scatter plots: (a) SEVI and points in intersected area (yellow points); (b) graded SEVI; (c) scatter plots of SEVI points in intersected area.
Remotesensing 14 00882 g004aRemotesensing 14 00882 g004b
Figure 5. Visible image (RGB composite), shadow-eliminated vegetation index (SEVI), and normalized difference vegetation index (NDVI) of sample areas: (af) Six sample areas.
Remotesensing 14 00882 g005
Figure 6. Box plot of samples and histogram of relative error of shadows vs. sunny area: (a) Box plot; (b) histogram.
Remotesensing 14 00882 g006
Figure 7. Scatter plots of vegetation indices vs. the cosine of the solar incidence angle (cos i): (a) SEVI; (b) NDVI.
Remotesensing 14 00882 g007
Figure 8. The visible image, and the SEVI and graded SEVI of protected areas: (a) MHS; (b) MJY; (c) WYS (red shape for national park, pink shape for national nature reserve).
Remotesensing 14 00882 g008
Figure 9. Histogram and box plot of three protected areas (WYSr is Wuyishan National Nature Reserve) and regional background (BGD): (a) Histogram of SEVI; (b) box plot of SEVI; (c) histogram of NDVI; (d) box plot of NDVI.
Remotesensing 14 00882 g009aRemotesensing 14 00882 g009b
Table 1. Solar angles of Landsat 8 OLI images and topographic factors of the protected areas of MHS, MJY and WYS.
Path/RowSun Azimuth (°)Sun Elevation (°)Reserve LocatedElevation (m)Slope (°)
120/42152.5646.84MHS224~18420~71.3
MJY250~18580~73.0
120/41153.5745.66WYS138~21600~73.5
Table 2. SEVI mean of protected area and buffer zone (SEVIb), slope mean, and years of establishment of protected area.
Protected AreasSEVISEVIbSlope Mean (°)Years
MHS0.6720.64222.2520
MJY0.6240.57722.3512
WYS0.7180.64826.8039
Publisher’s Note: MDPI stays neutral with regard to jurisdictional claims in published maps and institutional affiliations.