Abstract
Geostationary satellites observe the earth surface and atmosphere with a short repeat time, thus, providing aerosol parameters with high temporal resolution, which contributes to the air quality monitoring. Due to the limited information content in satellite data, and the coupling between the signals received from the surface and the atmosphere, the accurate retrieval of multiple aerosol parameters over land is difficult. With the strategy of taking full advantage of satellite measurement information, here we propose a neural network AEROsol retrieval framework for geostationary satellite (NNAeroG), which can potentially be applied to different instruments to obtain various aerosol parameters. NNAeroG was applied to the Advanced Himawari Imager on Himawari-8 and the results were evaluated versus independent ground-based sun photometer reference data. The aerosol optical depth, Ångström exponent and fine mode fraction produced by the NNAeroG method are significantly better than the official JAXA aerosol products. With spectral bands selection, the use of thermal infrared bands is meaningful for aerosol retrieval.
1. Introduction
Atmospheric aerosols exert key influences on global climate and the environment [1]. Measurements using ground-based instruments can provide a multitude of aerosol parameters, which together characterize the aerosol microphysical and chemical properties in great detail and with high accuracy. Ground-based measurements, however, apply to local conditions with a limited spatial extend. In contrast, satellite measurements using radiometers can provide aerosol information over large spatial scales with global coverage [2], but for fewer parameters, with coarser resolution and lower accuracy. The use of space-borne radiometers to obtain aerosol information from the radiances or reflectances measured at the top of the atmosphere (TOA, i.e., the dividing line between the Earth’s atmosphere and space) [1,2] requires the development of retrieval methods based on radiative transfer models. To optimally use the sensor characteristics, such as multiple wavelengths, multiple views and polarization information, different types of algorithms have been developed. For sensors in a sun-synchronous orbit, algorithms such as Dark Target (DT) [2], Deep Blue (DB) [3], Multi-Angle Implementation of Atmospheric Correction (MAIAC) [4], AATSR dual-view (ADV) [5], MISR aerosol retrieval method [6], Generalized Retrieval of Aerosol and Surface Properties (GRASP) [7], etc., have been developed to retrieve aerosol properties from different sensors. Sensors in a sun-synchronous orbit may offer near-daily global coverage (e.g., MODIS, VIIRS, POLDER, MERIS) or in several days (MISR, AATSR, SLSTR), depending on their swath. Geostationary satellites view a specific part of the Earth but with high temporal resolution which can thus be used to track the dynamical change of aerosol properties [8]. Methods to retrieve aerosol properties from geostationary satellites have been developed, such as GOCI Yonsei Aerosol Retrieval (YAER) [9], for MSG/SEVIRI [10,11] and the Advanced Himawari Imager (AHI) on Himawari-8, which is the subject of this paper.
A number of aerosol retrieval methods were developed for Himawari-8/AHI. The official aerosol products of AHI, available from the Japan Aerospace Exploration Agency (JAXA), are retrieved by a DB-type method [12]. Ge et al. (2018) [13] proposed a DT method for Himawari-8/AHI aerosol retrieval by defining a new normalized difference vegetation index (NDVI) calculated from the 0.86 µm and 2.3 µm wavebands; the retrieved aerosol optical depth (AOD) possessed an R2 of 0.81 with ground-based network measurements. Yan et al. (2018) [14] proposed a minimum albedo aerosol retrieval method (MAARM) to retrieve AOD, Ångström exponent (AE) and fine mode fraction (FMF). However, the accuracies of AE and FMF were not high. Su et al. (2021) [15] proposed a high-precision aerosol retrieval algorithm (HiPARA) that employs a monthly spectral reflectance ratio library and aerosol type from Aerosol Robotic Network (AERONET) statistics to retrieve AOD. Gao et al. (2021) [16] improved the surface reflectance estimation of the DT method by taking into account the land cover, NDVI and scattering angle. The retrieved AOD in the study of Su et al. (2021) [15] and Gao et al. (2021) [16] was more accurate than the JAXA AOD. Huttunen et al. (2016) [17] compared 6 methods of AOD retrieval, including one radiative transfer modeling LUT (look up table) method, one non-linear regression method and four machine learning methods. Their research indicated that the LUT method assumed parameters such as single scattering albedo (SSA), which introduced more uncertainties into the aerosol products, whereas the machine learning methods did not use any assumptions; thus, their performance was better.
Machine learning has been used as a new technique to solve the complicated aerosol retrieval problems, with good results. Chen et al. (2020) [18] proposed a neural network AEROsol (NNAero) retrieval method for the use with MODerate resolution Imaging Spectroradiometer (MODIS) data, which could jointly retrieve AOD and FMF with a significant improvement of accuracy. For Himawari-8/AHI, She et al. (2020) [19] trained a deep neural network by AERONET observations to retrieve AOD using reflectances in 6 wavebands, and achieved better AOD accuracy than JAXA AOD.
In this paper, a neural network AEROsol retrieval algorithm for geostationary satellite (NNAeroG) is presented. In contrast to sun-synchronous satellites [18], a geostationary satellite such as Himawari-8 provides multiple observations over the same location, which can be used in time series algorithms [20]. Similar to aerosol retrieval algorithms mentioned above, Chen et al. (2020) [18] and She et al. (2020) [19] only used reflective spectral bands covering the visible and near infrared (VNIR) and the shortwave infrared (SWIR) parts of the solar spectrum. In fact, efforts to include thermal infrared (TIR) bands for aerosol retrieval have been made for aerosol type [21,22]. For the use of TIR wavelengths, only the radiance at TOA is needed, which circumvents problems associated with separation of the aerosol and surface contributions. The use of time series and TIR wavelengths constitutes a substantial improvement of NNAeroG as compared with NNAero. Moreover, in order to obtain more information to constrain the retrieval, temporal and spatial measurements were also used. For the neural network training and validation, the output data were extracted; they are available from sun photometers in the AERONET [23] and Sun–Sky Radiometer Observation Network (SONET) [24] networks. The study area was China. The importance of input features (spectral bands and geometric angles) was given using the extreme gradient boosting (XGBoost) model [25]. The multiple aerosol products retrieved by NNAeroG can be used in air quality monitoring and climate research.
2. Materials
2.1. Himawari-8/AHI Data
Himawari-8 is a Japanese weather satellite that was launched on 7 October 2014 in a geostationary orbit at a height of 35,793 km at 140.7°E, with a spatial coverage of 150° by 150°. The primary instrument onboard Himawari-8 is the Advanced Himawari Imager (AHI), which measures upwelling radiation at TOA in 16 spectral bands as listed in Table 1, with a spatial resolution down to 500 m every 10 min (fulldisk). AHI solar zenith angle, viewing zenith angle, relative azimuth angle (solar azimuth angle minus viewing azimuth angle), TOA reflectances in 6 VNIR and SWIR bands and brightness temperatures in 10 TIR bands were collected for each cloud-free pixel. Thus, in total, 19 features were available and some of them will be selected for retrieval by XGBoost. In this study, level 1 data and aerosol products data during the years of 2016–2019 were used.

Table 1.
Spectral Bands of Himawari-8/AHI.
The AHI data formatted in netCDF were downloaded from the JAXA “P-Tree” system (ftp://ftp.ptree.jaxa.jp, accessed on 19 December 2021). The AHI level 1 calibrated data are gridded in pixels of 0.02° (the spatial resolution is 2 km) and contain the Earth surface albedo measured at TOA in bands 1–6, and the brightness temperatures measured at TOA in bands 7–16. We calculated the reflectances from the Level 1 albedo in bands 1–6 using
where is the TOA reflectance at wavelength λ, is the TOA albedo, and is the solar zenith angle.
JAXA aerosol products of Himawari-8/AHI are also available from the “P-Tree” system. The JAXA aerosol product is gridded in pixels of 0.05° and contain AOD, AE and FMF. Cloud products available in P-Tree are used to select cloud-free pixels [26].
2.2. Ground-Based Data and Study Area
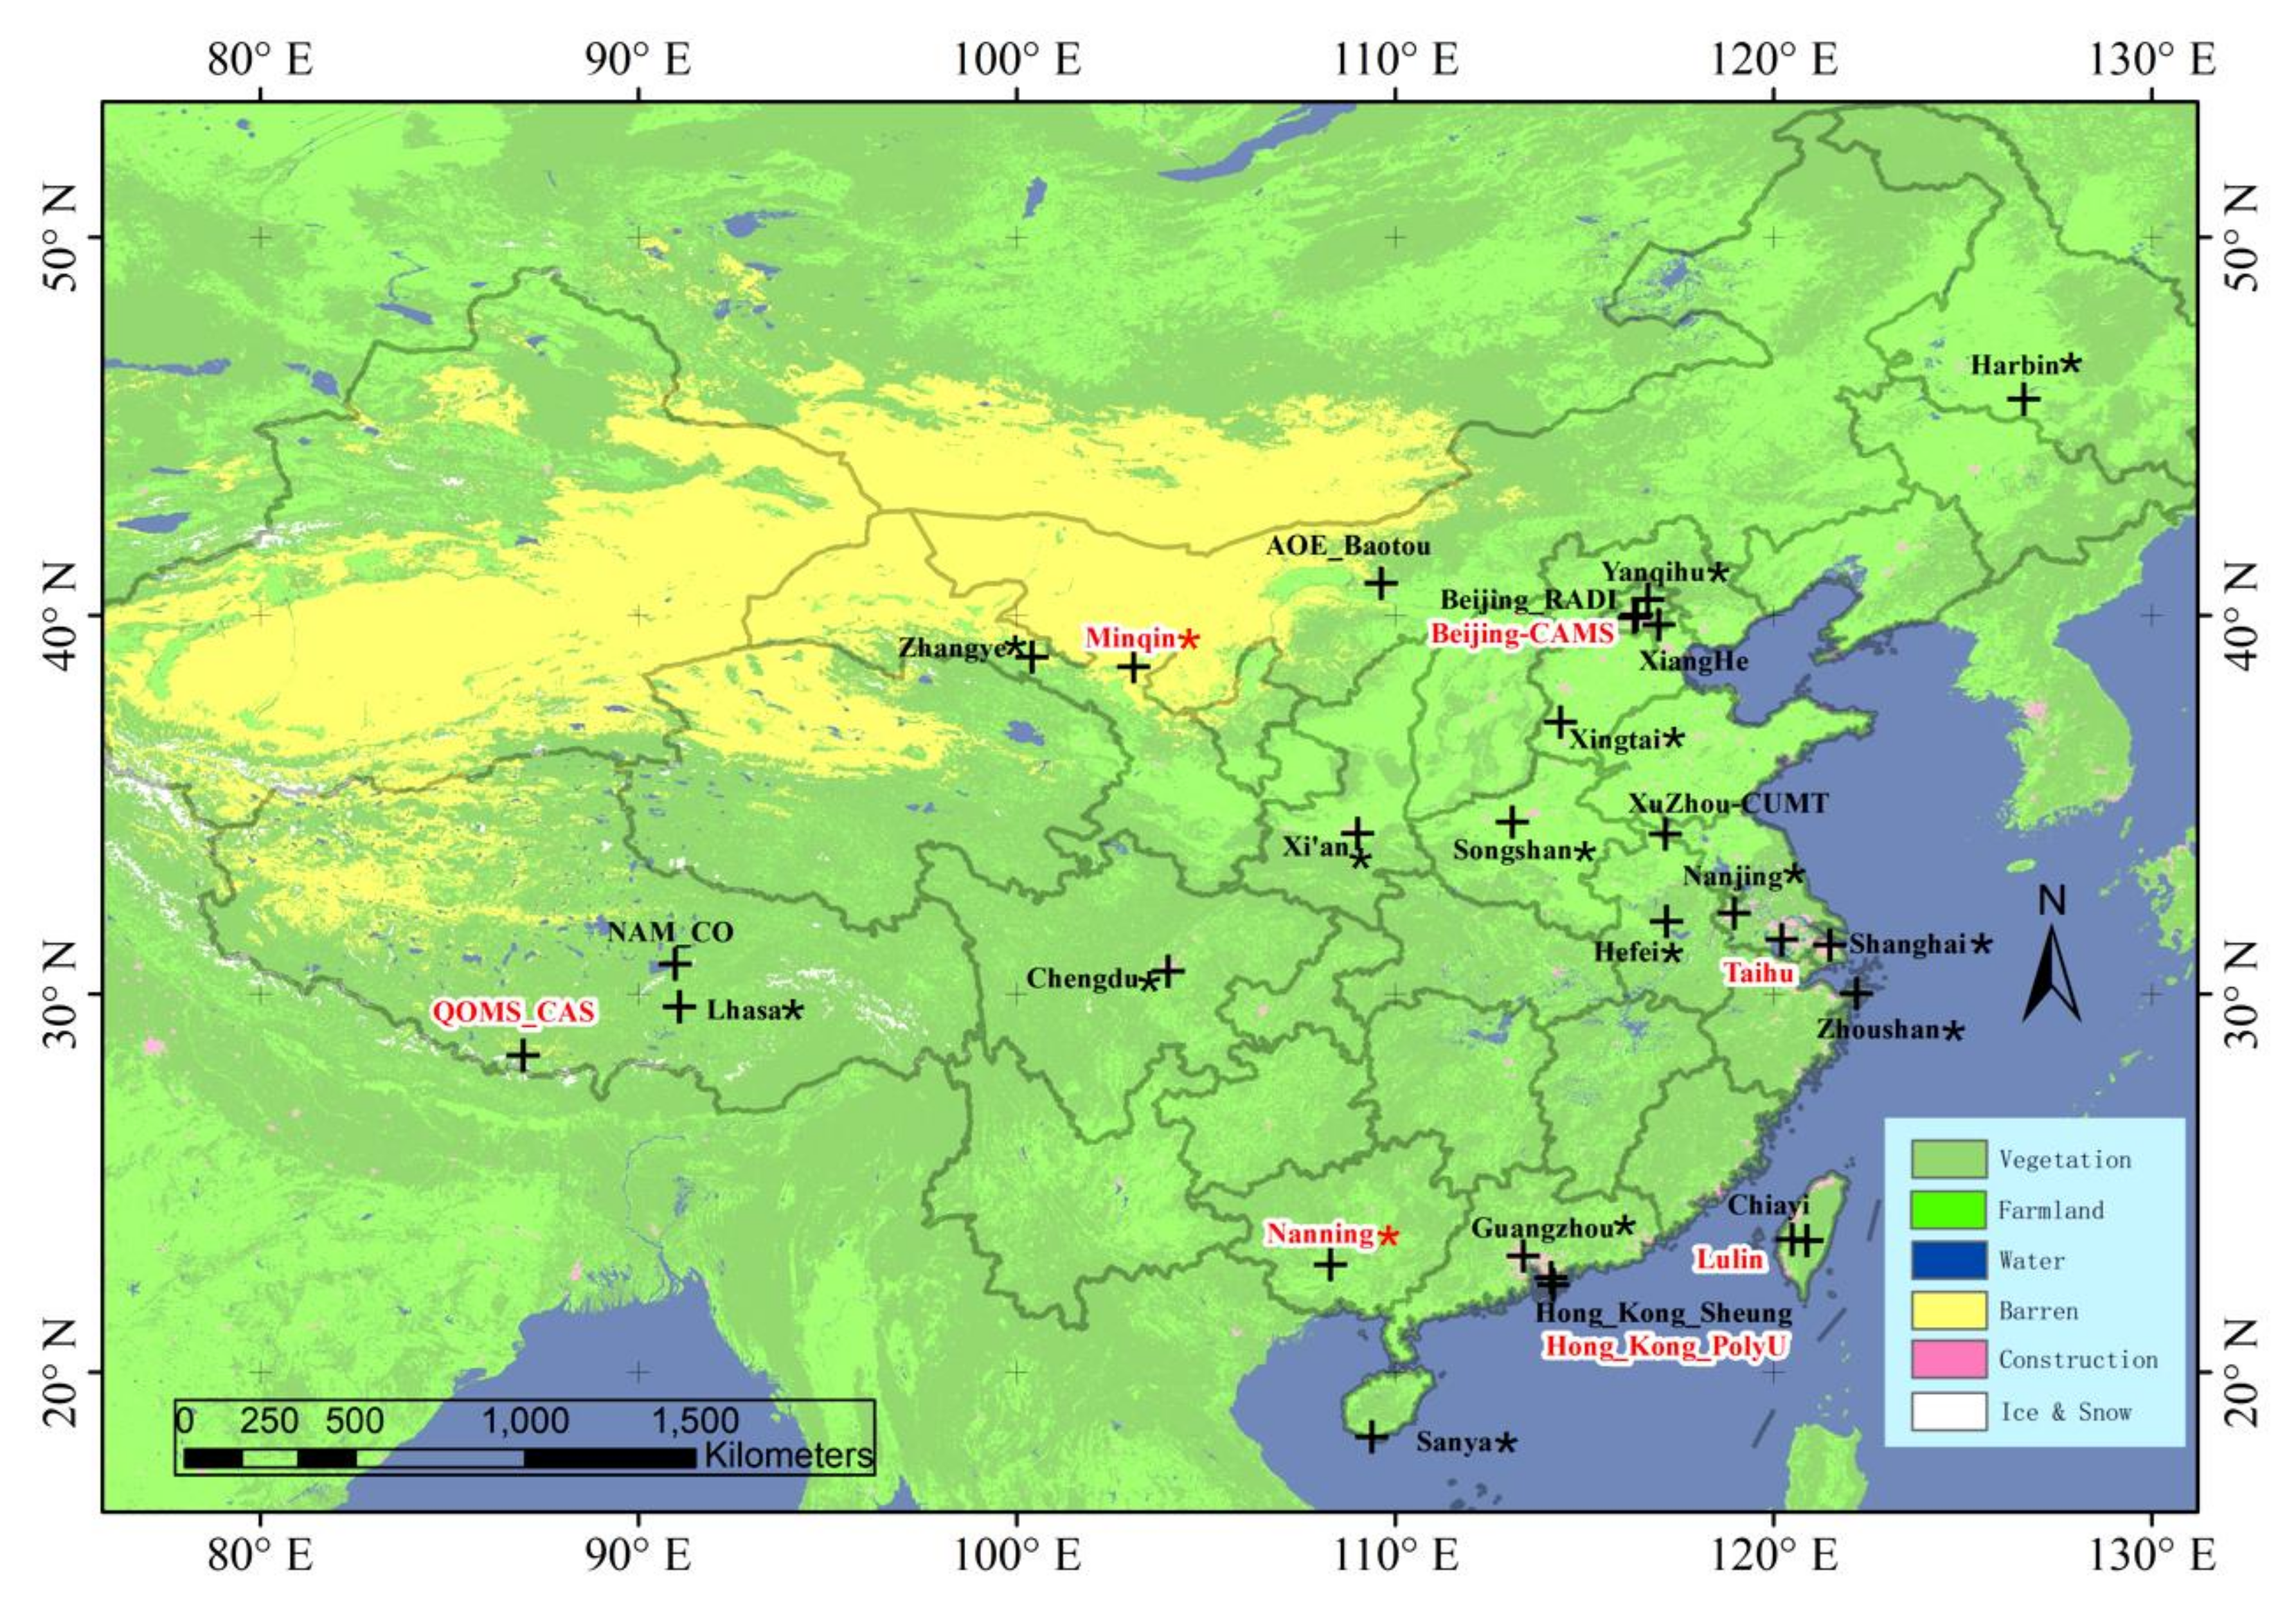
Reference aerosol products for the training of the NNAeroG, and the validation of the results, were obtained from two sun photometer networks in China, i.e., AERONET and SONET. The level 2.0 data of AERONET (Version 3.0) and SONET were used in this study. The mean values of AOD, AE, FMF over ± 30 min from the satellite imaging time were extracted to match the satellite data at the same location [2]. Data from 12 AERONET sites and 16 SONET sites (not common with the 12 AERONET sites) during the years of 2016~2019 were collected. All sites are indicated in Figure 1. The Himawari-8/AHI covers all of China, except for a small part west of 80°E. Only land surfaces in China covered by AHI were considered in this paper.

Figure 1.
Sun photometer data from 28 AERONET and SONET (with “*”) sites were used in this study. Data from the 7 sites with their name in red were reserved for independent validation, data from the other sites were used for training. Background is land cover [27], see legend for the interpretation of the color scale (6 types).
3. Algorithm Framework Development
3.1. Algorithm Framework Strategy
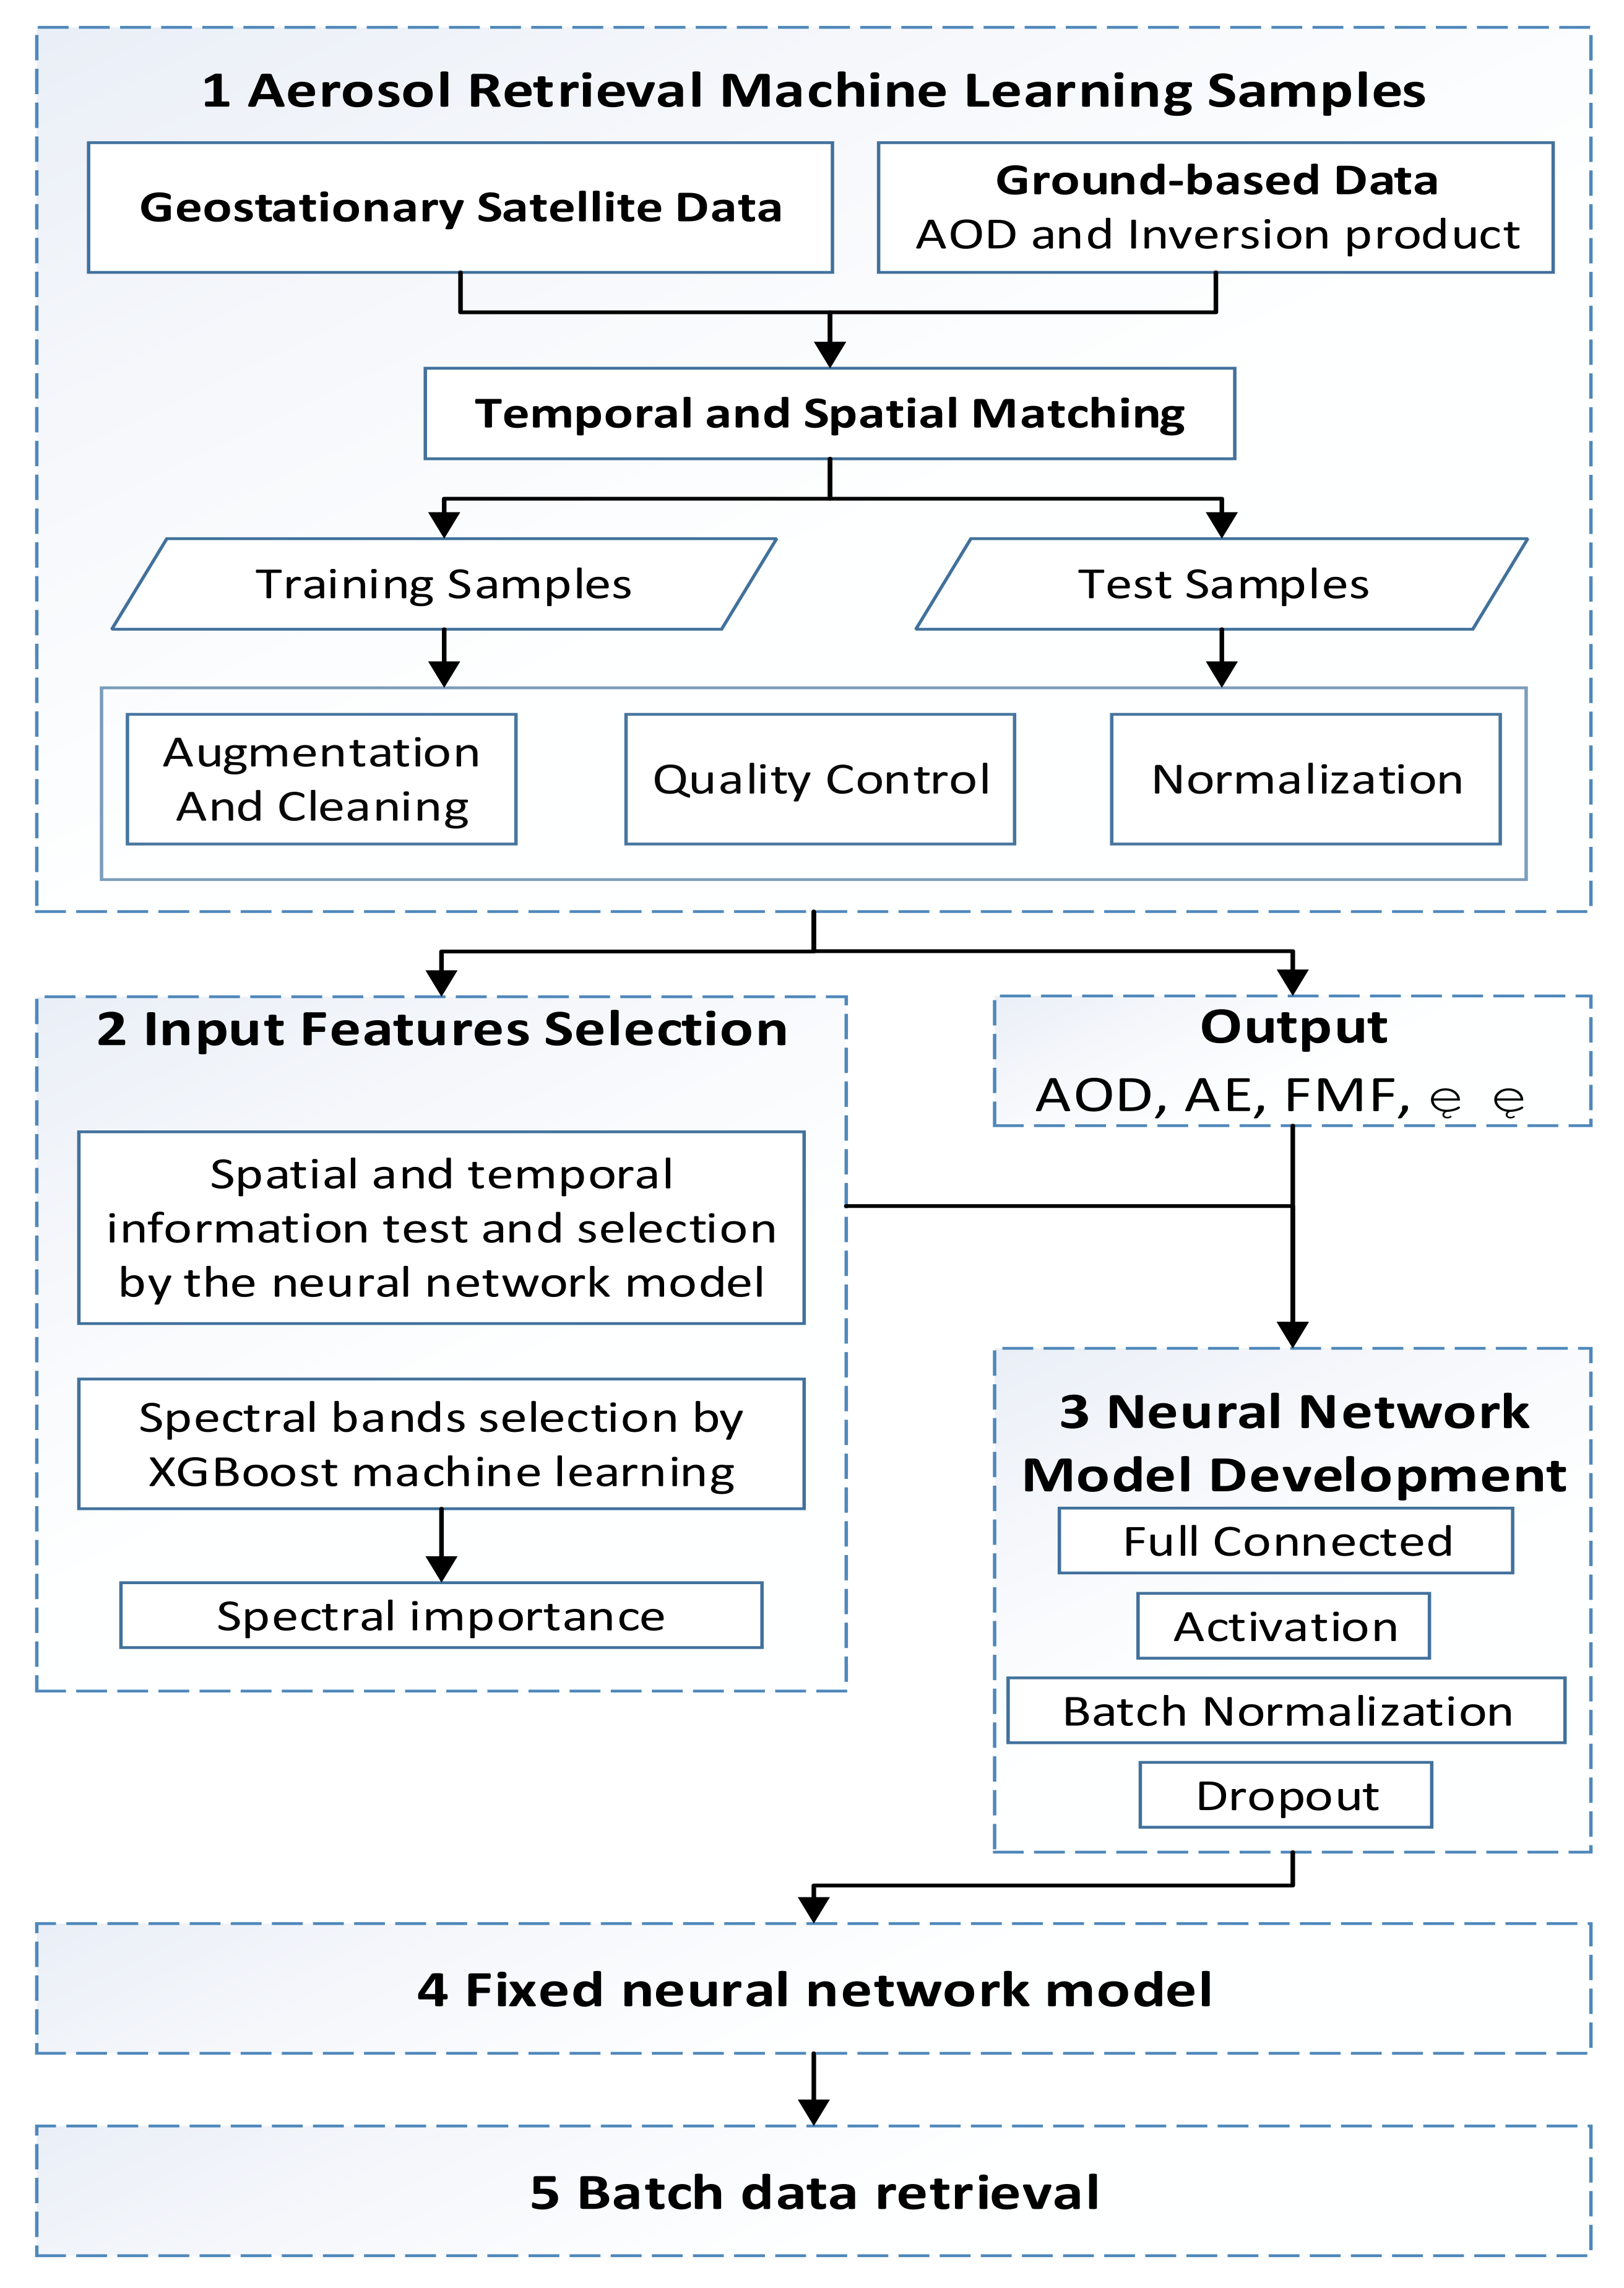
The geostationary satellite data contain three dimensions (spectral, spatial, and temporal information) that could be used to constrain aerosol retrieval. In Chen et al. [18], the retrieval of MODIS AOD and FMF were achieved using the spectral and spatial information. Here, we propose the NNAeroG with all three dimensions. The flowchart of the NNAeroG algorithm framework is shown in Figure 2.
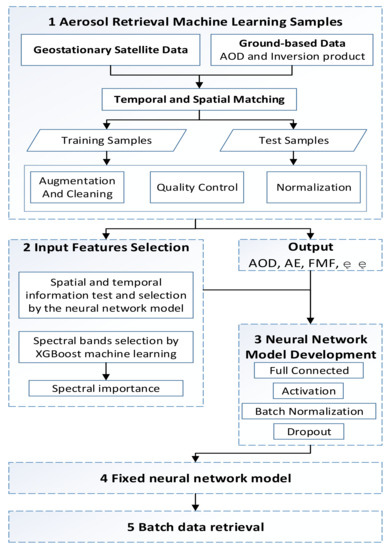
Figure 2.
Flowchart of NNAeroG algorithm.
In the first step, the machine learning samples were prepared for neural network model training and validation, including the geostationary satellite data as input and the ground-based data as output. After temporal and spatial matching, all samples were divided into two parts, training and validation, to ensure that the validation samples were independent of the training samples. As shown in Figure 1, sites with their names in red were selected for independent validation. Then, data augmentation produced more samples to create a uniform distribution. For example, there were fewer samples with FMF < 0.2, which would lead to a lack of learning for coarse aerosols; thus, we could copy these samples, with the addition of 2% Gaussian noise as augmentation. It is noted that quality control can filter unsuitable data such as cloud-contaminated pixels. Every input value would be transferred in [0, 1] to obtain good-fitting results of neural network.
In the second step, one sample included multi-spectral, multi-temporal and multi-pixels (sub-image centered on the site) geostationary data, which is the important feature for the aerosol retrieval. Radiative transfer theory and previous aerosol retrieval algorithms can provide optional preferences. At the same time, the decision tree-based XGBoost machine learning method can provide the importance value of each input feature.
In the third step, to establish a machine learning model, the neural network is recommended for its excellent non-linear fitting ability [19,28]. More importantly, XGBoost, which is based on the decision tree with thresholds, possesses a potential capability to select what the important feature is for retrieval from spectral bands. The NNM was developed with full connected, activation, batch normalization and dropout layers.
In the fourth step, the NNM was trained, tested and fixed. Temporal and spatial information were selected according to the NNM test results. The number of input features N were defined by:
where Spix is the side length of the pixels square in the satellite image centered over each ground-based site, here, Spix ≤ 7 with the assumption that aerosol is homogeneous over an area of less than 14 km × 14 km. RDark is the ratio of dark to total clear sky pixels in each area of Spix × Spix pixels. The darkness order of pixels is given by the TOA reflectance at 2.3 μm, which is used to enhance the number of pixels with a relatively large atmospheric contribution to the TOA signal by selecting pixels with the darkest surface. NSB (≤19) is the number of features selected by XGBoost from the 19 angles, spectral reflectances and brightness temperatures, in the second step. T is the number of temporal satellite data, here T = 1 or 3. The NNM was trained by the selected spectral, spatial and temporal input features. With the independent test (also validation), the architecture and its parameters of NNM were fixed.
Finally, the fixed NNM could be used to predict (or retrieve) aerosol with a large amount of remote sensing data.
3.2. Neural Network Model
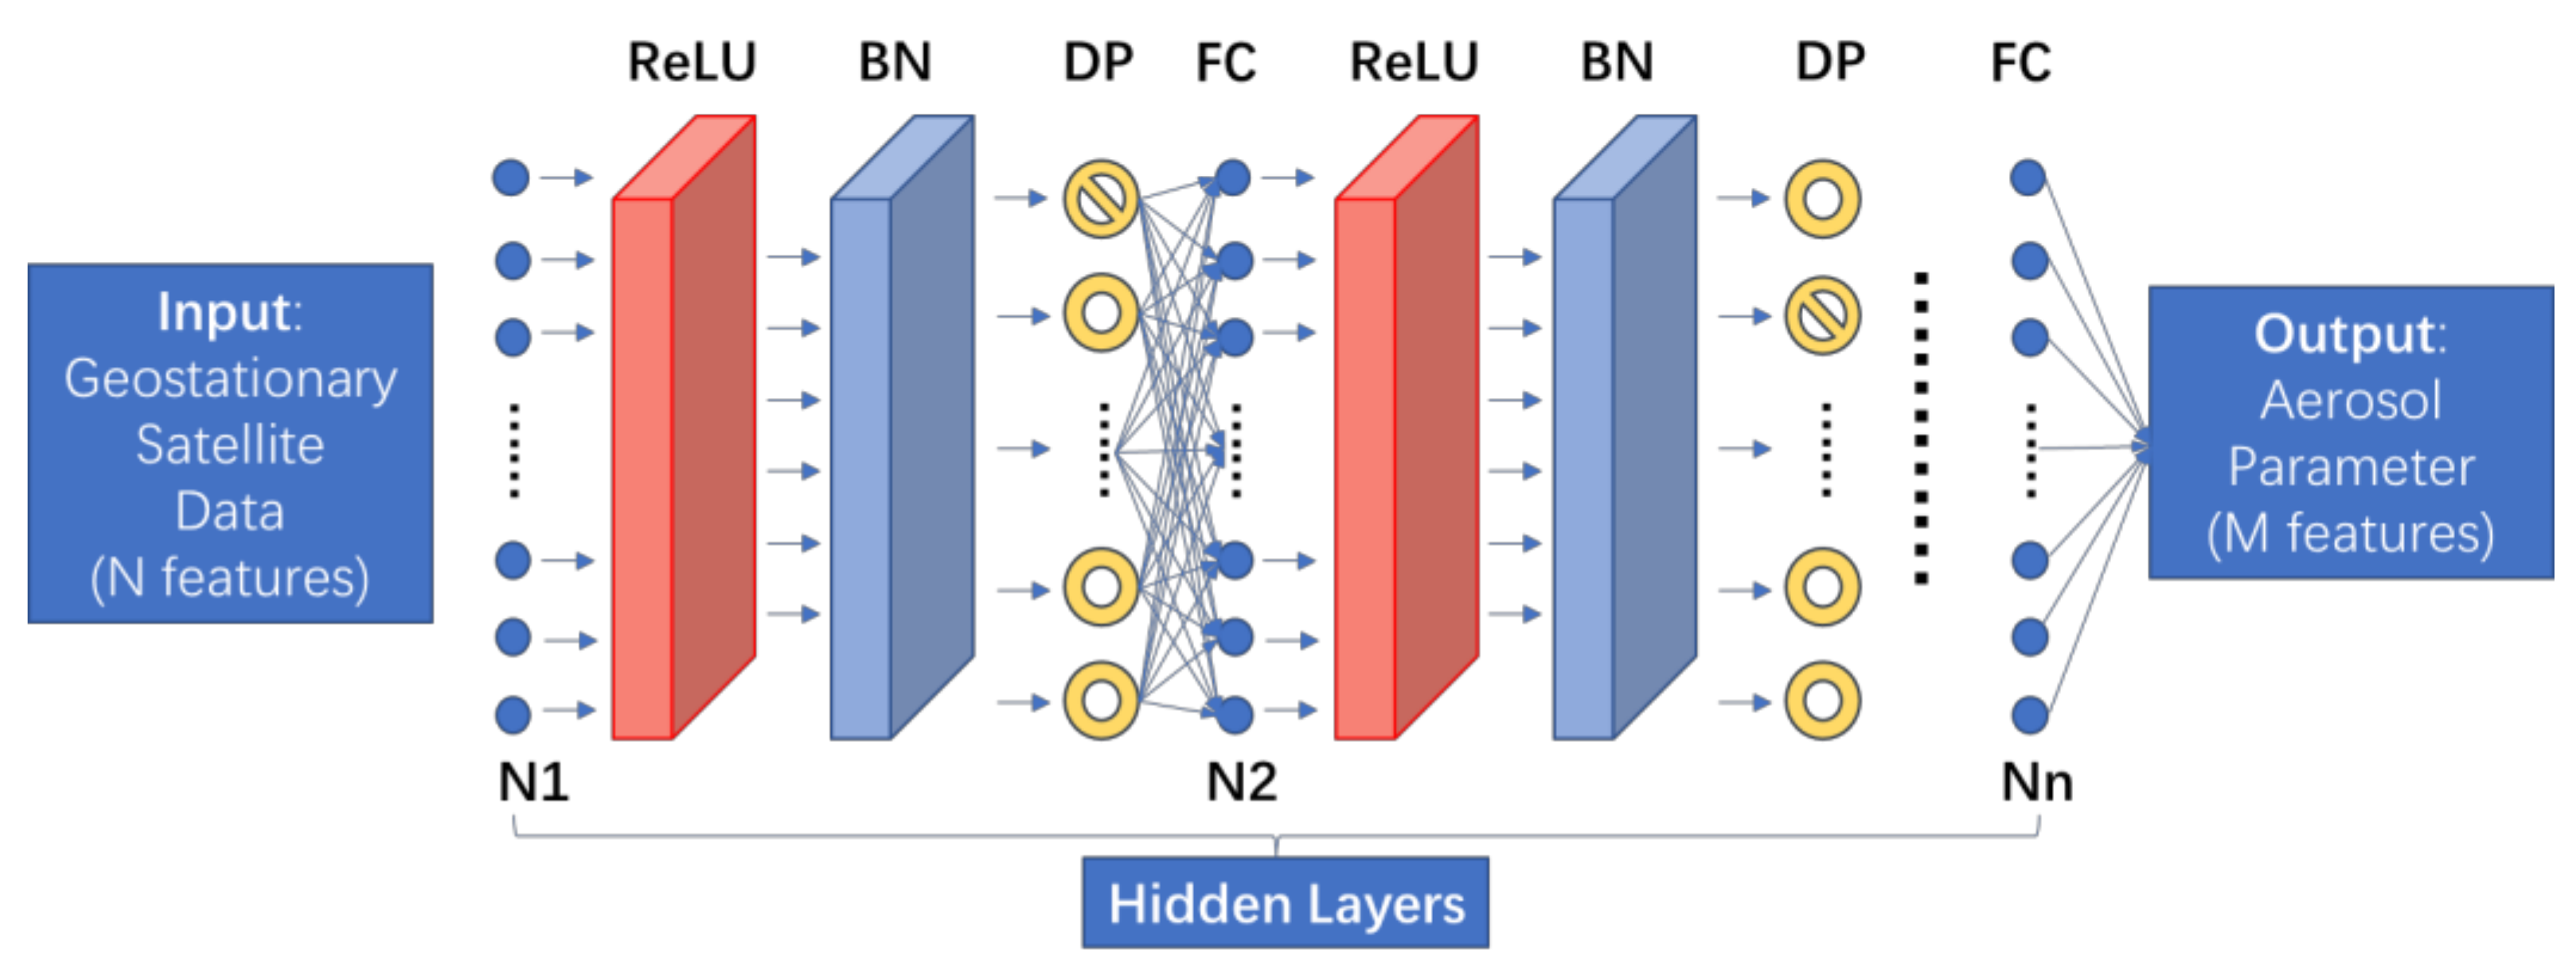
A neural network shows better performance for nonlinear regression than other machine learning methods, such as XGBoost and RF (random forest) [28]. We also tested different machine learning methods; at last, the neural network was selected for NNAeroG because of the best performance. For the TOA, measurements are organized as a vector, not as an image; for every pixel, the full connected neural network (FCNN) could meet the input format. The FCNN architecture for NNAeroG was designed as shown in Figure 3.

Figure 3.
Architecture of the neural network for NNAeroG. ReLU is the activation layer. BN is a batch normalization layer. DP is the dropout layer. FC is the full connected layer. The input vector possessed N features, and the number of output features M could be 1, 2, or 3. For Himawari-8/AHI aerosol retrieval, the M is 1 which, means that every aerosol parameter possessed a special NNM. Nn is the neutron number of every FC layer, which could be different.
In the full connected layer (FC), the basic unit is neuron (blue circle in Figure 3), which is a weighted summation of its inputs. The output of a neuron is expressed as
where is the weighting coefficient for the input . The training process is performed to obtain the best to achieve the best prediction accuracy. In Figure 3, the NNM is composed of three parts: input, hidden layers and output. In the hidden layers, the ReLU activation layer was used to add nonlinearity in neural networks, because almost all real-world relationships can be explained with a non-linear function; dropout layer was used to reduce overfitting by randomly and temporarily deleting neurons in the hidden layer during the training with a given probability; BN layer was adopted to perform the standardizing and normalizing operations on the input of a layer coming from a previous layer, by bringing the numerical data to a common scale.
4. Result and Discussion
4.1. Selection of Input Features
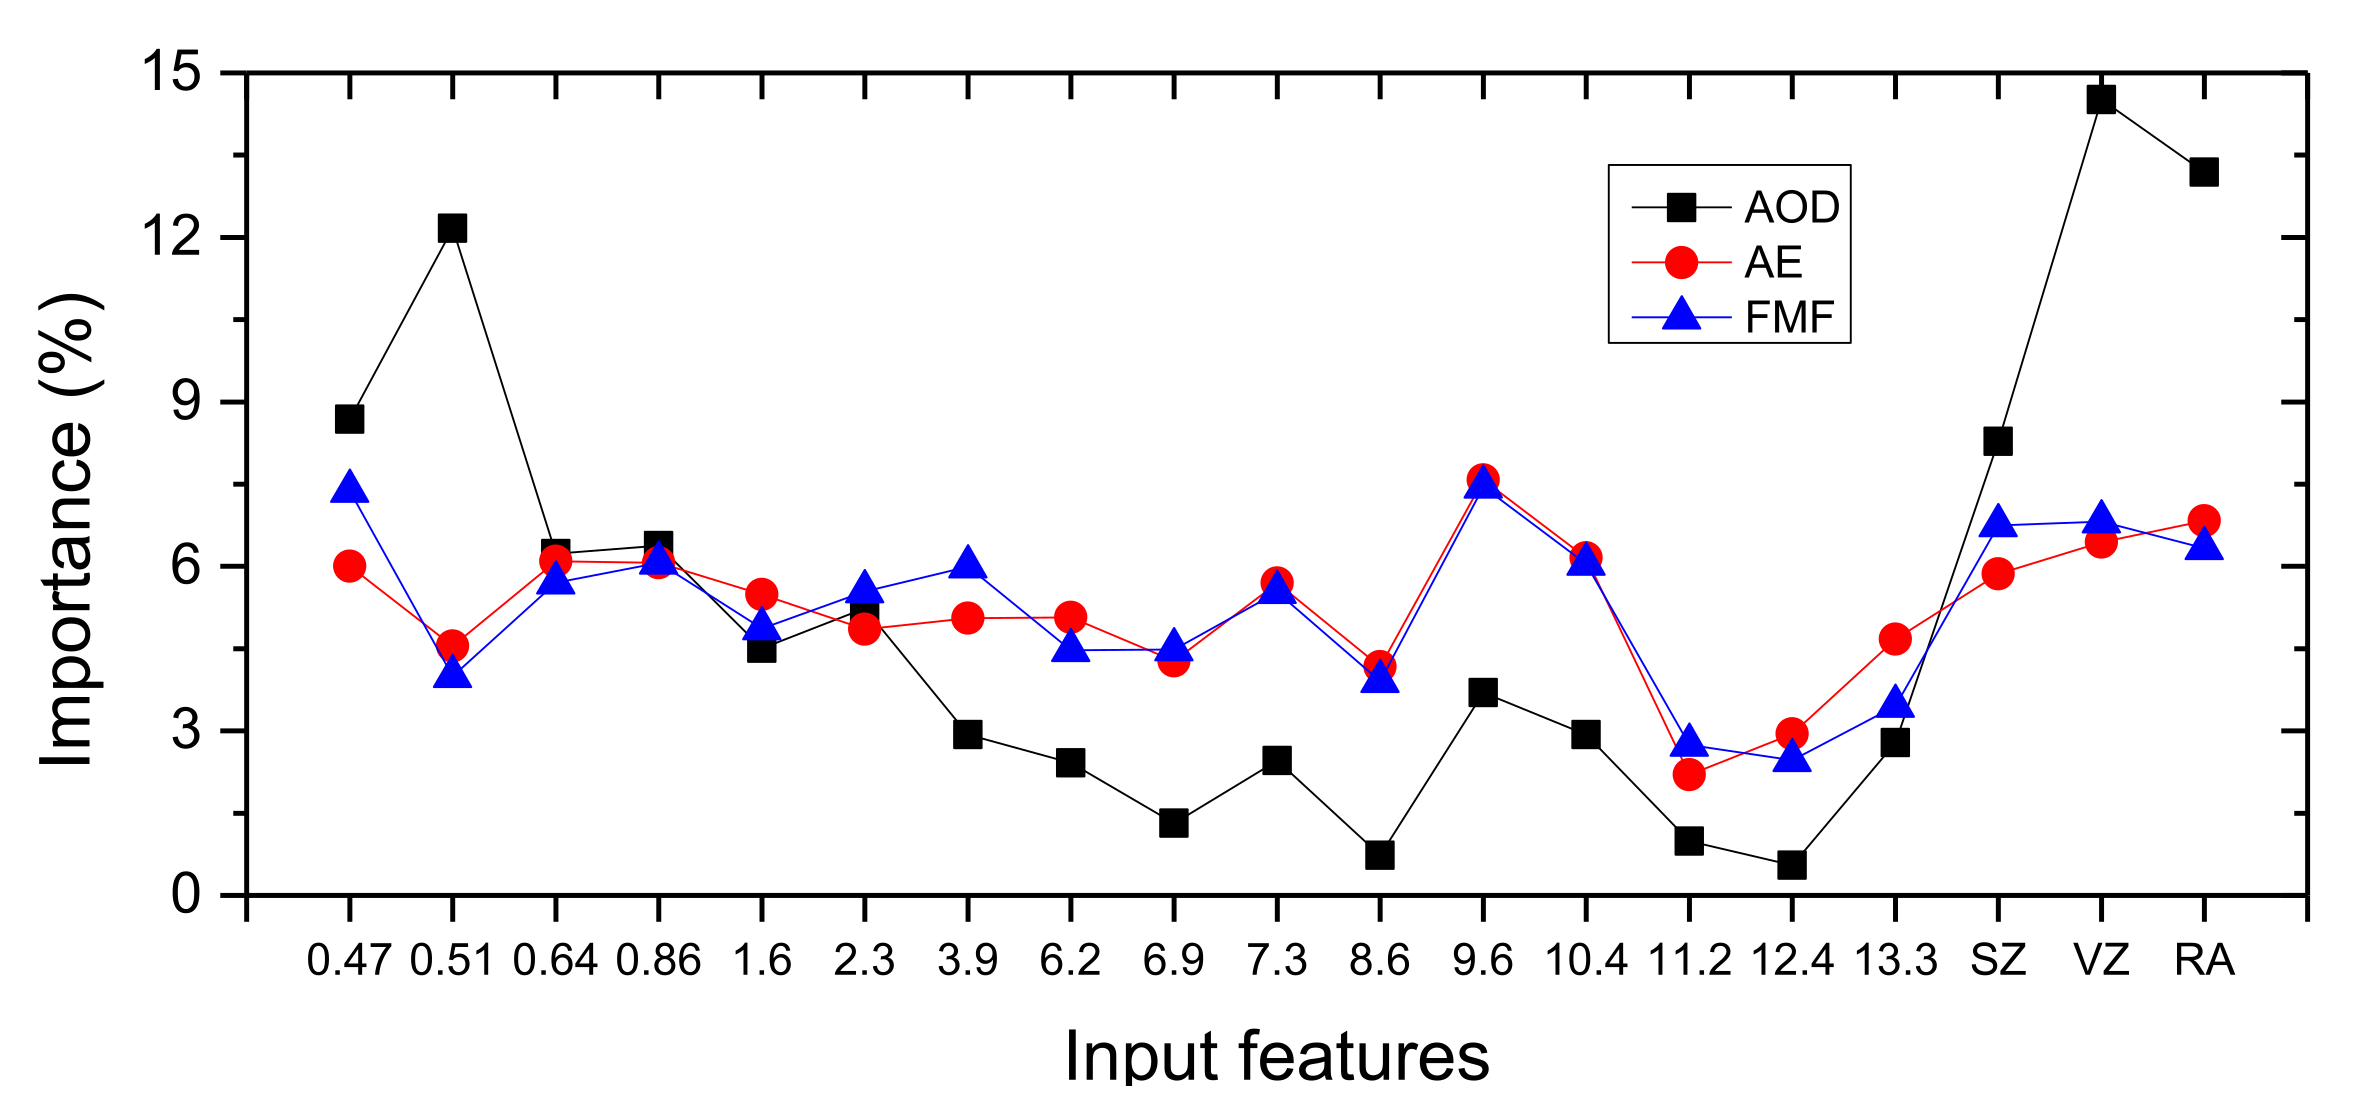
The importance of each of the AHI input features was analyzed by XGBoost. The results of this analysis are presented in Figure 4, which shows that, for the retrieval of AOD with the NNM, the 6.2 μM, 6.9 μM, 8.6 μM, 11.2 μM, 12.4 μM wavelength bands possessed the lowest importance; therefore, these bands were not used as input. For the retrieval of AE and FMF, there is no significant difference between the input features, which were thus all retained.

Figure 4.
Aerosol retrieval importance of Himawari-8/AHI input features. The numbers on the horizontal axis are spectral bands in μm. SZ, VZ and RA are solar zenith angle, viewing zenith angle and relative azimuth angle respectively.
According to Equation (2), the spatial (Spix, RDark) and temporal information (T) was tested by NNMs for AOD, AE and FMF. Assuming that AE and FMF do not change during 20 min, 3 AHI images (±10 min around the sun photometer measurement) were used together as input in the retrieval. The settings are shown in Table 2.
Table 2.
The spectral, spatial and temporal parameters setting according to Equation (2).
4.2. Validation
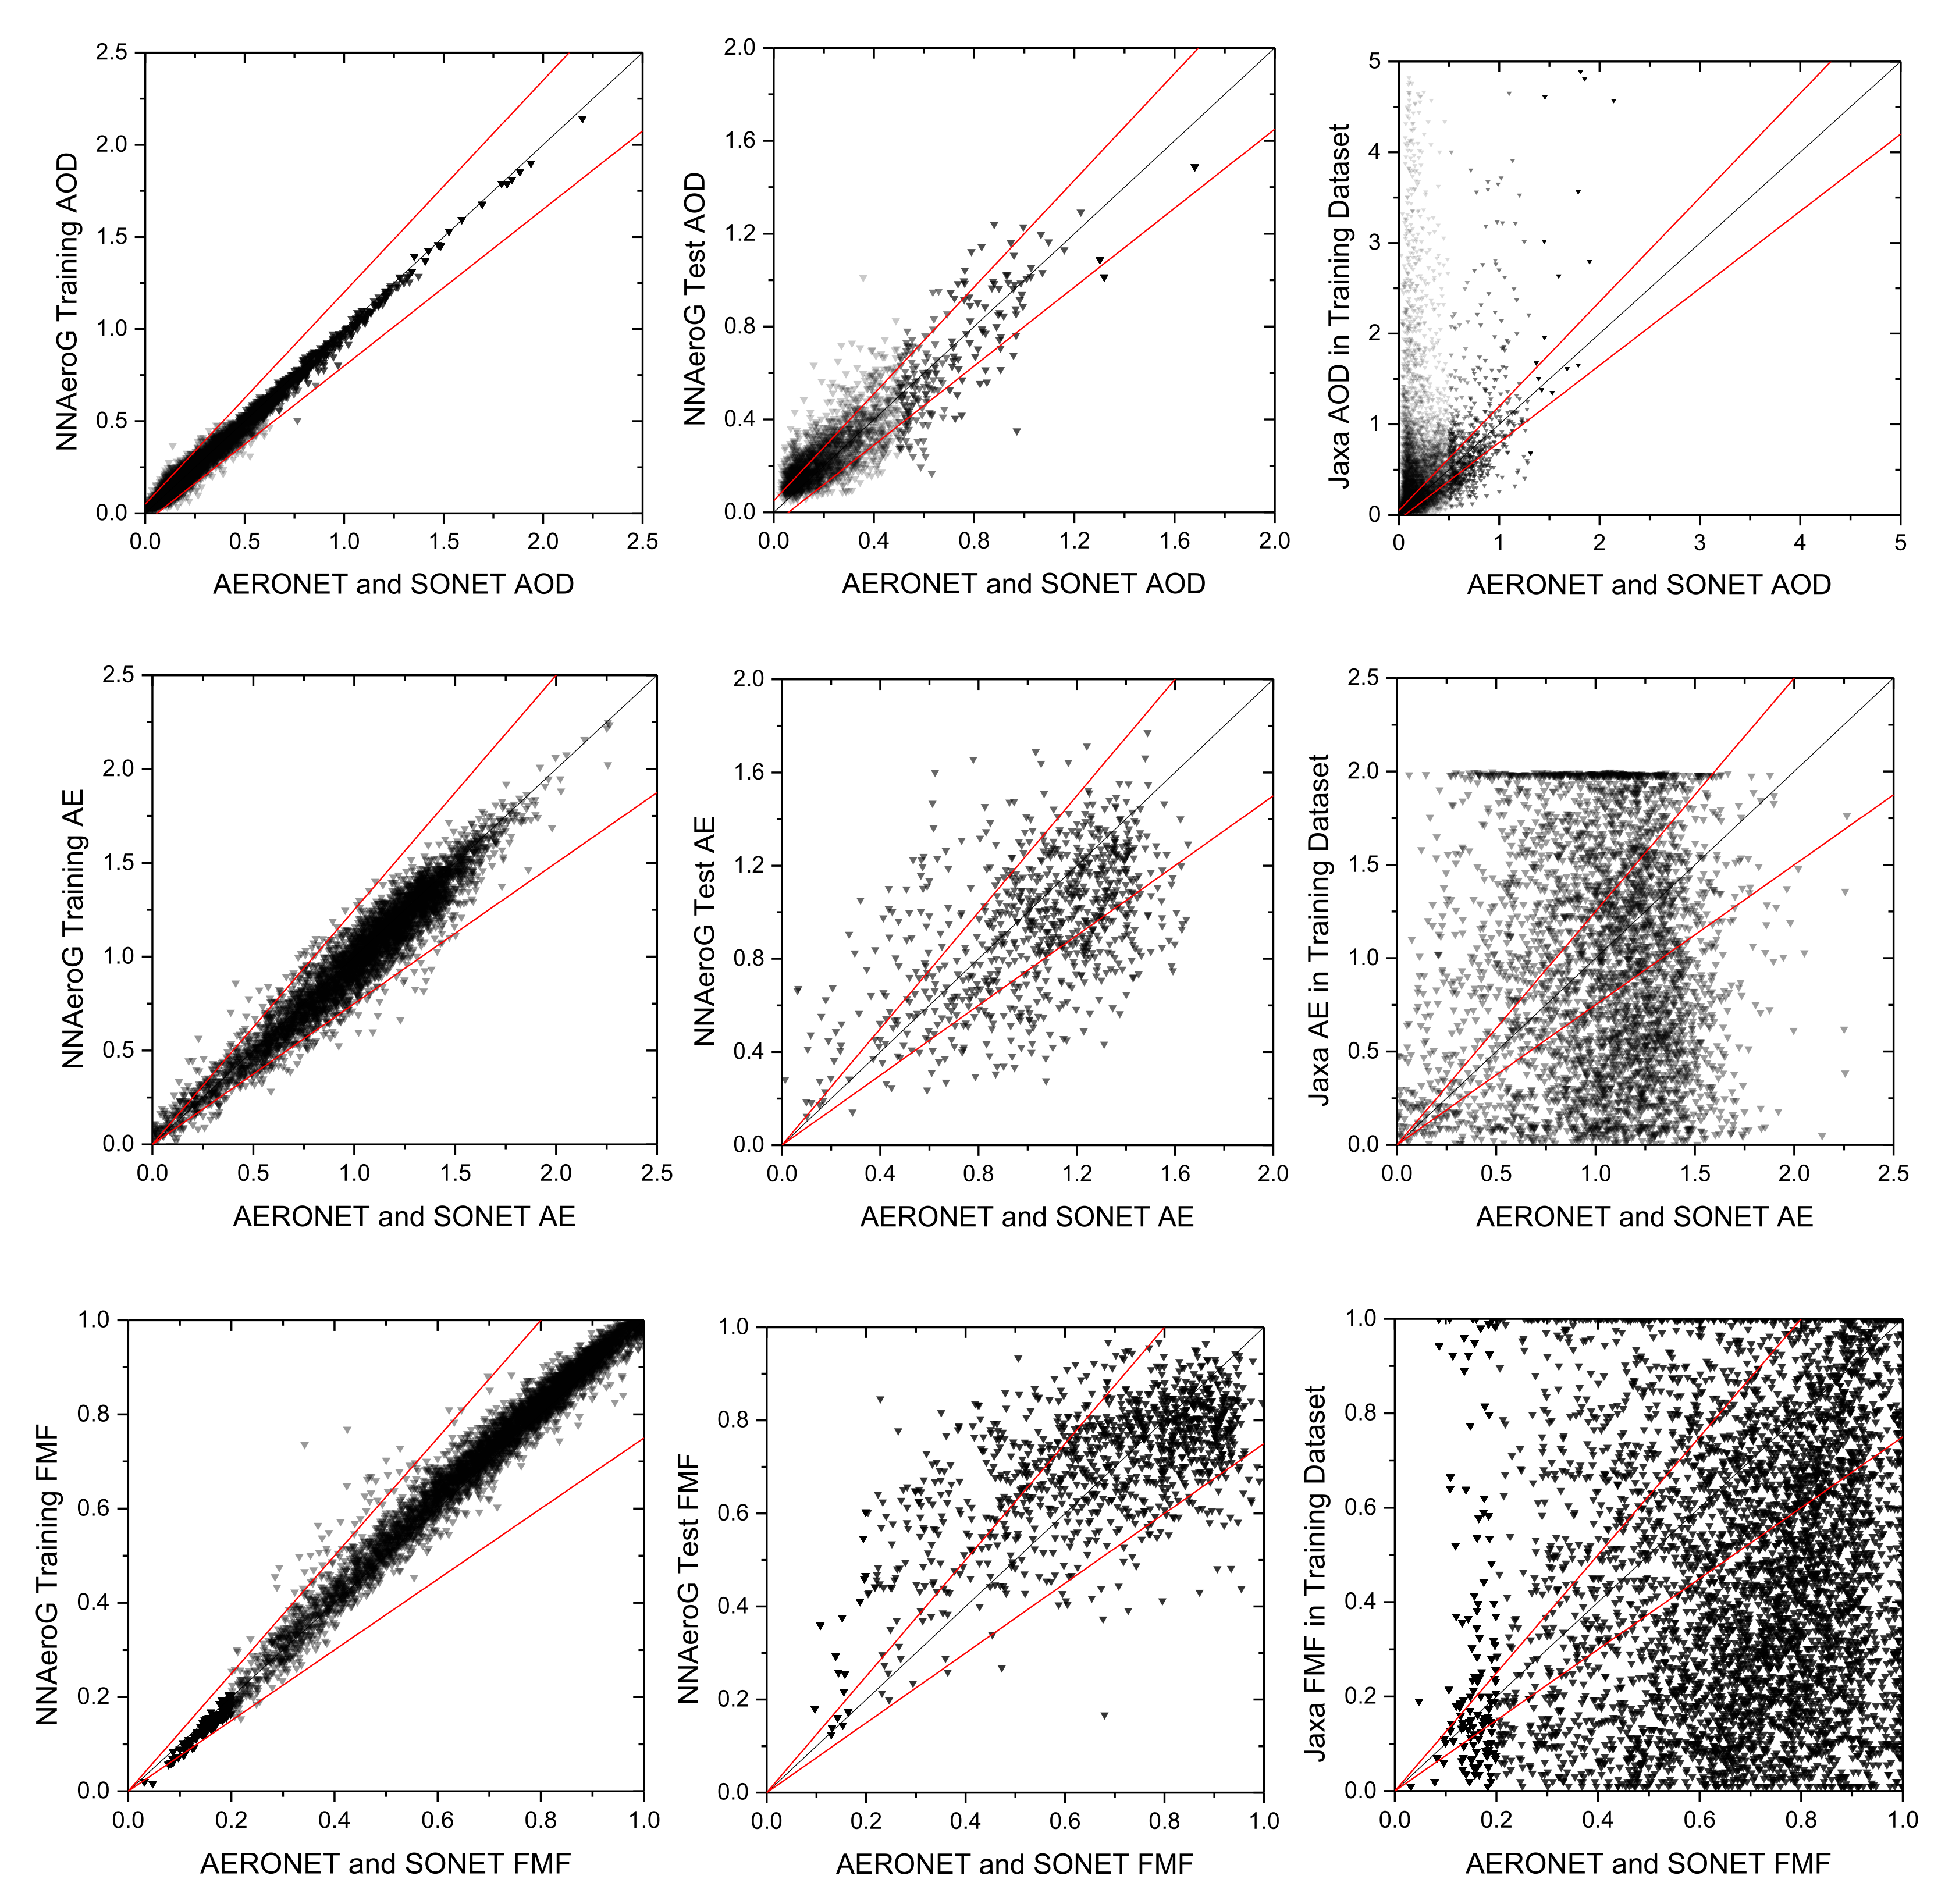
For strictly independent validation, the test dataset needs to include only samples from the ground-based sites, which were not used in the NNM training [18,19]. Scatterplots of the AOD, AE and FMF retrieved using NNAeroG versus AERONET and SONET reference data are presented in Figure 5, for both the training data set and the independent validation data set. In shown are similar plots for the JAXA operational data. It is noted that, in Figure 5, the spatial resolution for the JAXA products is 5 km and for the NNAeroG-retrieved data it is 2 km. The coefficient of determination (R2), the correlation coefficient (R), the mean absolute error (MAE), the root mean square error (RMSE) and the expected error (EE) [2,3] were used to evaluate the accuracies.
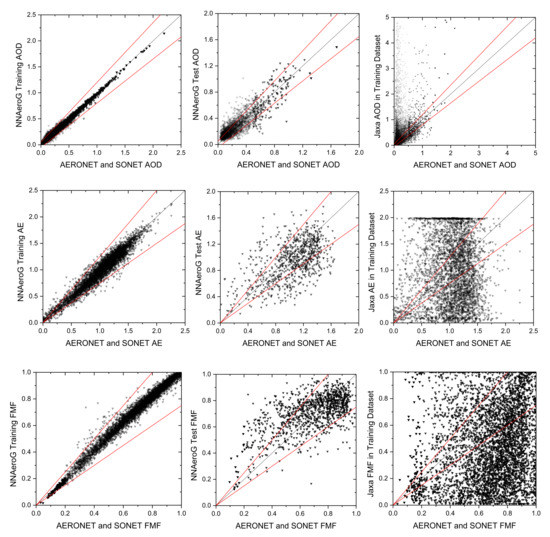
Figure 5.
Scatterplots of Himawari-8/AHI retrieved AOD, AE and FMF versus AERONET and SONET reference data. The left column shows scatterplots for NNAeroG products over the training sites, i.e., versus the same data that were used for training the NNM. The middle column shows scatterplots for NNAeroG products over sites that were not used in the NNM training. Scatterplots for the JAXA products are presented in the right column. The red lines are the EE envelopes for AOD, AE and FMF of ± (0.05 + 15%), ± 25% and ± 25%, respectively.
The scatterplots in Figure 5, middle column, show that for the NNAeroG retrievals over the validation sites, 63.7% of the AOD data are within the EE envelope of ± (0.05 + 15%), 60.9% of the AE and 65.6% of the FMF are within the EE of ± 25%. The data in Figure 5 and the statistical metrics for the comparison of the NNAeroG and JAXA products in Table 3 show the significant improvement of the retrieval accuracy of the NNAeroG AOD, AE and FMF products over those from the JAXA algorithm. Note however, that NNAeroG overestimated the AOD and FMF, and underestimated the AE. The values of RMSE, MAE, R2 and R indicate the better accuracy for AOD than for than AE and FMF.
Table 3.
Statistical metrics of the evaluation of the aerosol parameters retrieved using NNAeroG algorithm and the JAXA operational data versus AERONET and SONET reference data.
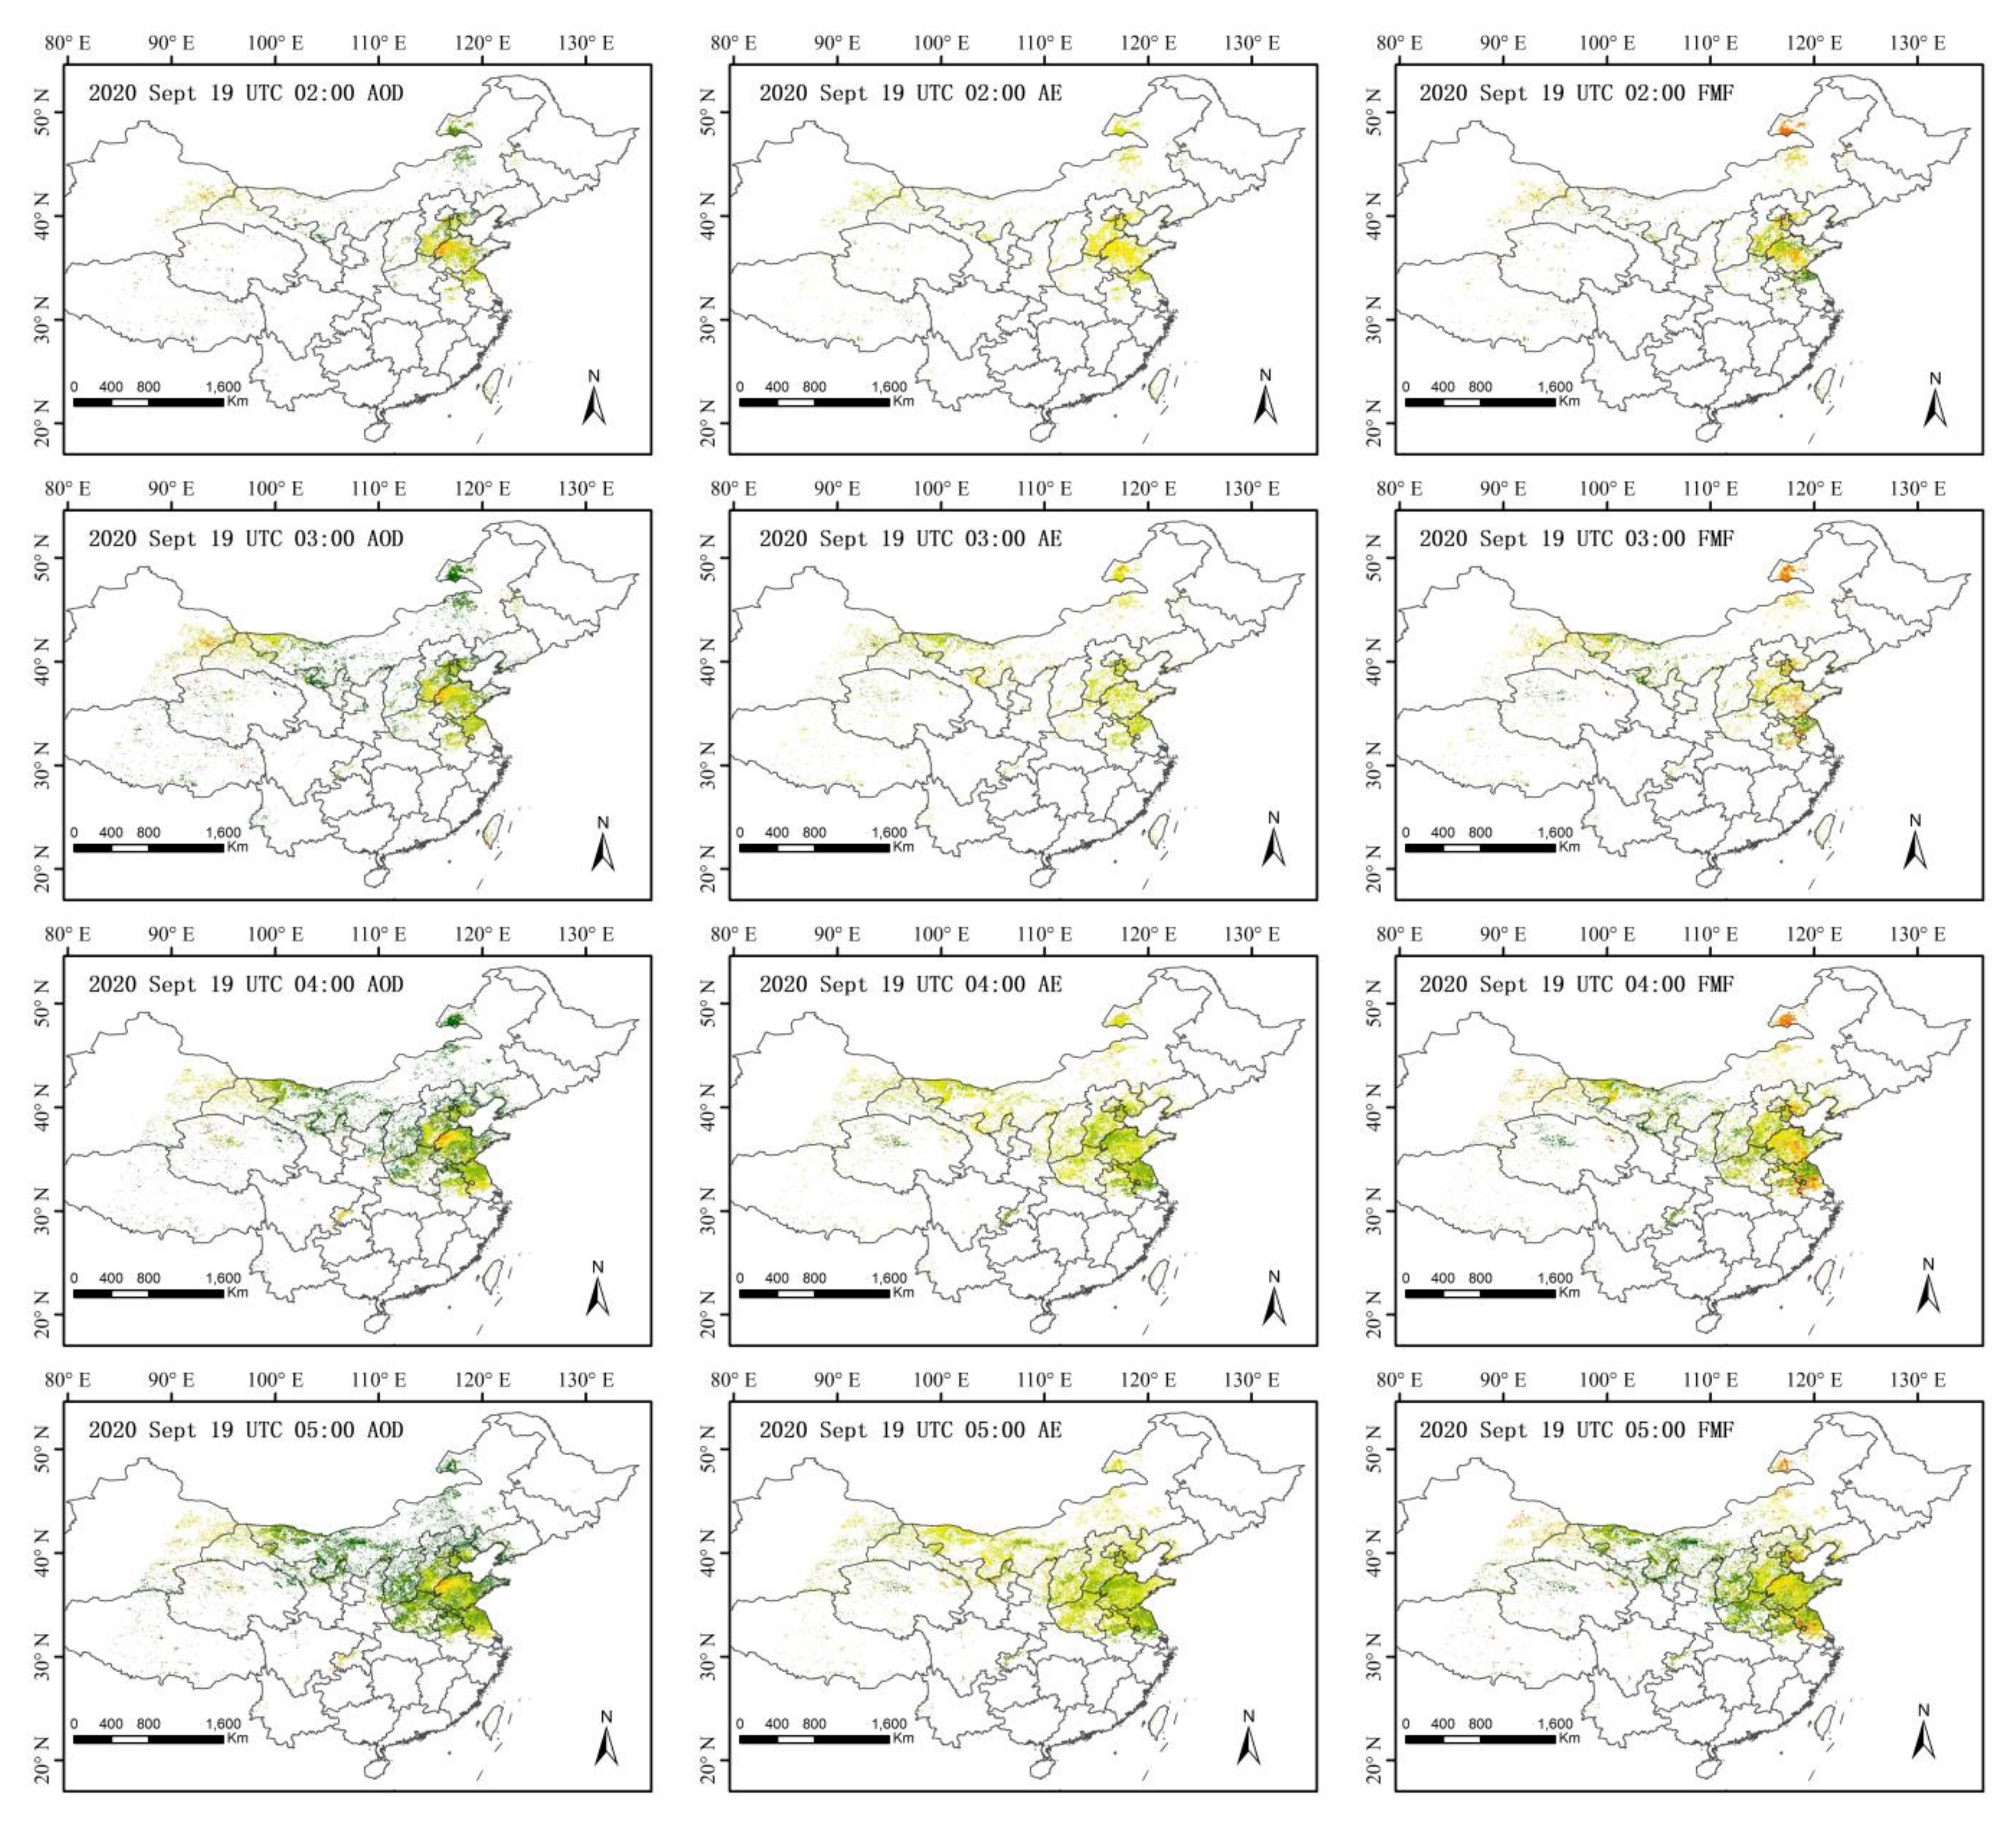
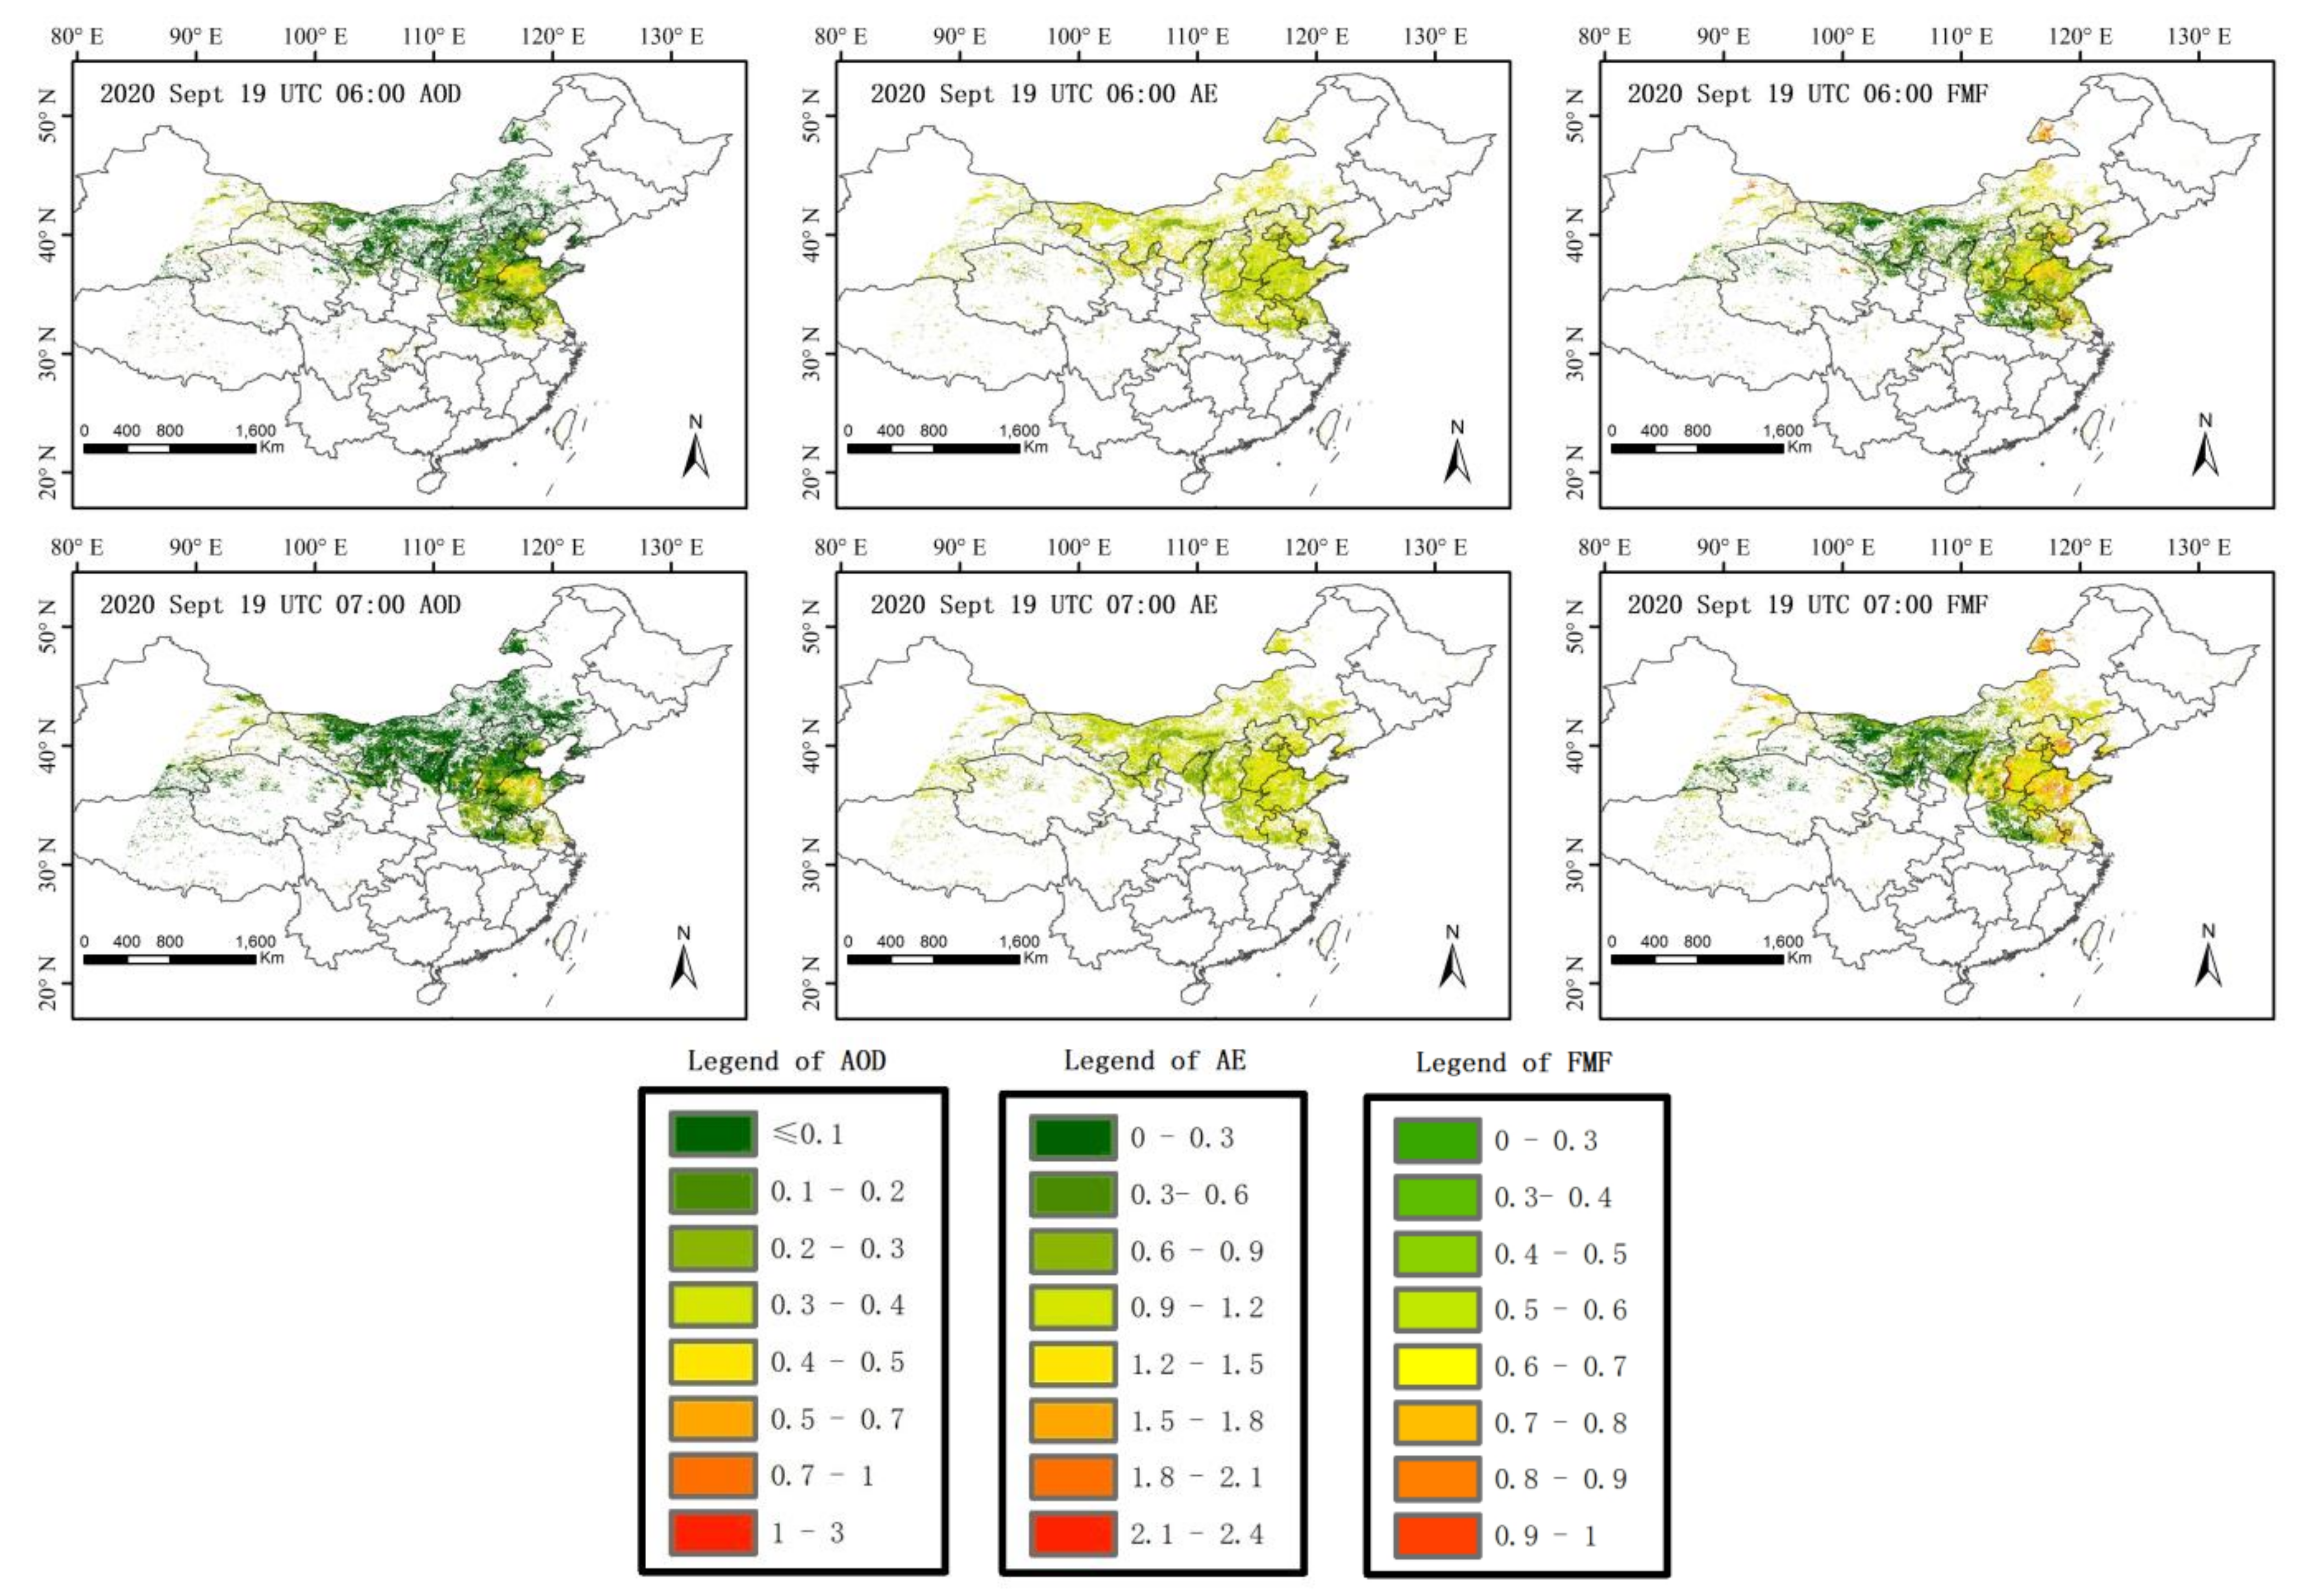
4.3. High Temporal Resolution Products
Using the trained NNMs of NNAeroG, time series of aerosol parameters can be retrieved. Hourly high temporal resolution aerosol products (AOD, AE, and FMF) for September 19, 2020, from 02:00 to 07:00 UTC, are presented in Figure 6, which shows that the high spatial and temporal resolution of the NNAeroG retrievals provide detailed information on the spatial distribution of the aerosol properties and their temporal evolution.
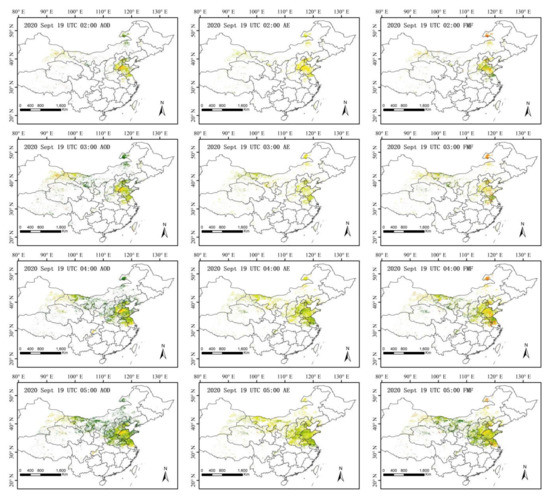
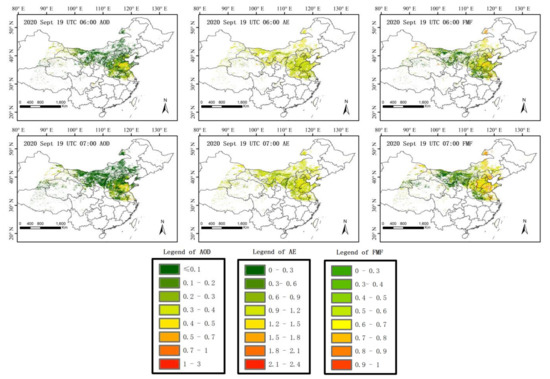
Figure 6.
The NNAeroG retrieved hourly AOD, AE and FMF using Himawri-8/AHI data from 02:00 to 07:00 (UTC) on 19 September 2020 over land in China. The left column is AOD; the middle column is AE, and the right column is FMF.
In the spatial dimension, the AOD and FMF with 2 km resolution shew high value over the densely populated and industrialized regions such as the North China Plain (NCP), which reflected the close relationship between regional air quality and human activities. In the temporal dimension, from UTC 02:00 to 07:00, the AOD decreased over the NCP and the area toward the Mongolia border, whereas the coverage increased. At the same time, the FMF over the NCP and to the north of the NCP increased, indicating stronger domination of fine mode particles. The data in Figure 6 show that the high spatial and temporal resolution is helpful for monitoring the evolution of regional air quality.
5. Conclusions
The NNAeroG algorithm framework is proposed for aerosol retrieval using data from geostationary satellites. In the development of the framework, the satellite spectral, spatial and temporal information were selected using the decision tree machine learning method, which can help to filter the important input features. The spectral information is the most important input for AOD retrieval using the machine learning method. Because more observations are needed to constrain AE and FMF retrievals, more spatial pixels, 3 consecutive observations within 20 min, and all spectral bands, including TIR bands, are jointly used as input. Then, the neural network model for each aerosol parameter retrieval was developed and trained by using both geostationary satellite- and ground-based data.
After training was completed, the NNAeroG was applied to Himawari-8/AHI data to produce AOD, AE and FMF retrievals with 2 km spatial resolution and 10 min temporal resolution. The results were validated against independent reference data from the AERONET and SONET sun photometer networks. The validation results show that the accuracy of the NNAeroG aerosol products is significantly better than that of the JAXA version 2.1 aerosol products. The NNAeroG results indicate that the geostationary satellite data can be used to retrieve aerosol with higher accuracy not only for AOD, but also for other parameters. The proposed NNAeroG provides a generic aerosol retrieval framework, which also showed a potential for application to other geostationary satellites, such as FengYun-4. More aerosol parameters can be retrieved to support monitoring and modeling for air quality over China.
Author Contributions
Conceptualization, X.C. and L.L.; methodology, X.C., L.L. and G.d.L.; software, X.C., F.Z., J.L. and L.L.; validation, K.Z., S.L. and D.L.; formal analysis, L.Z., F.Z., J.L. and G.d.L.; investigation, X.C.; resources, L.Z., S.L. and D.L.; data curation, L.Z. and K.Z.; writing—original draft preparation, X.C.; writing—review and editing, H.D. and G.d.L.; visualization, H.D.; supervision, G.d.L. All authors have read and agreed to the published version of the manuscript.
Funding
This research was funded by the National Natural Science Foundation of China (Grant No. 42171342 and Grant No. 61761021) and National Key Research and Development Program of China (Grant No. 2019YFE0126600).
Institutional Review Board Statement
Not applicable.
Informed Consent Statement
Not applicable.
Data Availability Statement
Data used in the reported studies were obtained from websites as indicated in the text.
Acknowledgments
The authors acknowledge Himawari-8/AHI data system (P-Tree), SONET and AERONET groups for the satellite and ground-based data. We would like to appreciate the constuctive comments and suggestions by the three anonymous reviewers.
Conflicts of Interest
The authors declare no conflict of interest. The funders had no role in the design of the study; in the collection, analyses, or interpretation of data; in the writing of the manuscript, or in the decision to publish the results.
References
- Kaufman, Y.J.; Tanre, D.; Boucher, O.A. satellite view of aerosols in the climate system. Nature 2002, 419, 215–223. [Google Scholar] [CrossRef] [PubMed]
- Levy, R.C.; Mattoo, S.; Munchak, L.A.; Remer, L.A.; Sayer, A.M.; Patadia, F.; Hsu, N.C. The collection 6 MODIS aerosol products over land and ocean. Atmos. Meas. Tech. 2013, 6, 2989–3034. [Google Scholar] [CrossRef] [Green Version]
- Hsu, N.C.; Tsay, S.C.; King, M.D.; Herman, J.R. Deep blue retrievals of Asian aerosol properties during ACE-Asia. IEEE Trans. Geosci. Remote Sens. 2006, 44, 3180–3195. [Google Scholar] [CrossRef]
- Lyapustin, A.; Wang, Y.; Laszlo, I.; Kahn, R.; Korkin, S.; Remer, L.; Levy, R.; Reid, J.S. Multiangle implementation of atmospheric correction (MAIAC): 2. Aerosol algorithm. J. Geophys. Res. Atmos. 2011, 116, D03211. [Google Scholar] [CrossRef]
- Kolmonen, P.; Sogacheva, L.; Virtanen, T.H.; de Leeuw, G.; Kulmala, M. The ADV/ASV AATSR aerosol retrieval algorithm: Current status and presentation of a full-mission AOD data set. Int. J. Digit. Earth. 2016, 9, 545–561. [Google Scholar] [CrossRef]
- Kahn, R.A.; Gaitley, B.J. An analysis of global aerosol type as retrieved by MISR. J. Geophys. Res. Atmos. 2015, 120, 4248–4281. [Google Scholar] [CrossRef]
- Dubovik, O.; Herman, M.; Holdak, A.; Lapyonok, T.; Tanré, D.; Deuzé, J.L.; Ducos, F.; Sinyuk, A.; Lopatin, A. Statistically optimized inversion algorithm for enhanced retrieval of aerosol properties from spectral multi-angle polarimetric satellite observations. Atmos. Meas. Tech. 2011, 4, 975–1018. [Google Scholar] [CrossRef] [Green Version]
- Sowden, M.; Mueller, U.; Blake, D. What temporal resolution is required for remote sensing of regional aerosol concentrations using the Himawari-8 geostationary satellite. Atmos. Environ. 2019, 216, 116914. [Google Scholar] [CrossRef]
- Choi, M.; Kim, J.; Lee, J.; Kim, M.; Park, Y.J.; Jeong, U.; Kim, W.; Hong, H.; Holben, B.; Eck, T.F.; et al. GOCI Yonsei Aerosol retrieval (YAER) algorithm and validation during the DRAGON-NE Asia 2012 campaign. Atmos. Meas. Tech. 2016, 9, 1377–1398. [Google Scholar] [CrossRef] [Green Version]
- Bennouna, Y.S.; de Leeuw, G.; Piazzola, J.; Kusmierczyk-Michulec, J. Aerosol remote sensing over the ocean using MSG-SEVIRI visible images. J. Geophys. Res. Atmos. 2009, 114, D23203. [Google Scholar] [CrossRef] [Green Version]
- Govaerts, Y.; Luffarelli, M. Joint retrieval of surface reflectance and aerosol properties with continuous variation of the state variables in the solution space—Part 1: Theoretical concept. Atmos. Meas. Tech. 2018, 11, 6589–6603. [Google Scholar] [CrossRef]
- Yoshida, M.; Kikuchi, M.; Nagao, T.M.; Murakami, H.; Nomaki, T.; Higurashi, A. Common Retrieval of Aerosol Properties for Imaging Satellite Sensors. J. Meteorol. Soc. Jpn. 2018, 96B, 193–209. [Google Scholar] [CrossRef] [Green Version]
- Ge, B.; Li, Z.; Liu, L.; Yang, L.; Chen, X.; Hou, W.; Qie, L. A dark target method for Himawari-8/AHI aerosol retrieval: Application and validation. IEEE Trans. Geosci. Remote Sens. 2018, 57, 381–394. [Google Scholar] [CrossRef]
- Yan, X.; Li, Z.; Luo, N.; Shi, W.; Zhao, W.; Yang, X.; Jin, J. A minimum albedo aerosol retrieval method for the new-generation geostationary meteorological satellite Himawari-8. Atmos. Res. 2018, 207, 14–27. [Google Scholar] [CrossRef]
- Xin, S.; Lunche, W.; Ming, Z.; Wenmin, Q.; Muhammad, B. A High-Precision Aerosol Retrieval Algorithm (HiPARA) for Advanced Himawari Imager (AHI) data: Development and verification. Remote Sens. Environ. 2021, 253, 112221. [Google Scholar]
- Gao, L.; Chen, L.; Li, J.; Li, C.; Zhu, L. An improved dark target method for aerosol optical depth retrieval over China from Himawari-8. Atmos. Res. 2021, 250, 105399. [Google Scholar] [CrossRef]
- Huttunen, J.; Kokkola, H.; Mielonen, T.; Mononen, M.E.J.; Lipponen, A.; Reunanen, J.; Lindfors, A.V.; Mikkonen, S.; Lehtinen, K.E.J.; Kouremeti, N.; et al. Retrieval of aerosol optical depth from surface solar radiation measurements using machine learning algorithms, non-linear regression and a radiative transfer-based look-up table. Atmos. Chem. Phys. 2016, 16, 8181–8191. [Google Scholar] [CrossRef] [Green Version]
- Chen, X.; de Leeuw, G.; Arola, A.; Liu, S.; Liu, Y.; Li, Z.; Zhang, K. Joint retrieval of the aerosol fine mode fraction and optical depth using MODIS spectral reflectance over northern and eastern China: Artificial neural network method. Remote Sens. Environ. 2020, 249, 112006. [Google Scholar] [CrossRef]
- She, L.; Zhang, H.K.; Li, Z.; de Leeuw, G.; Huang, B. Himawari-8 aerosol optical depth (AOD retrieval using a deep neural network trained using AERONET observations. Remote Sens. 2020, 12, 4125. [Google Scholar] [CrossRef]
- Li, D.; Qin, K.; Wu, L.; Mei, L.; Li, Y. Himawari-8-Derived Aerosol Optical Depth Using an Improved Time Series Algorithm Over Eastern China. Remote Sens. 2020, 12, 978. [Google Scholar] [CrossRef]
- Clarisse, L.; Coheur, P.F.; Prata, F.; Hadji-Lazaro, J.; Hurtmans, D.; Clerbaux, C. A unified approach to infrared aerosol remote sensing and type specification. Atmos. Chem. Phys. 2013, 13, 2195–2221. [Google Scholar] [CrossRef] [Green Version]
- Sowden, M.; Blake, D. Which dual-band infrared indices are optimum for identifying aerosol compositional change using Himawari-8 data? Atmos. Environ. 2020, 241, 117620. [Google Scholar] [CrossRef]
- Holben, B.N.; Eck, T.F.; Slutsker, I.; Tanre, D.; Buis, J.P.; Setzer, A.; Vermote, E.; Reagan, J.A.; Kaufman, Y.J.; Nakajima, T.; et al. AERONET—A federated instrument network and data archive for aerosol characterization. Remote Sens. Environ. 1998, 66, 1–16. [Google Scholar] [CrossRef]
- Li, Z.Q.; Xu, H.; Li, K.T.; Li, D.H.; Xie, Y.S.; Li, L.; Zhang, Y.; Gu, X.F.; Zhao, W.; Tian, Q.J.; et al. Comprehensive study of optical, physical, chemical, and radiative properties of total columnar atmospheric aerosols over China: An overview of sun–sky radiometer observation network (SONET) measurements. Bull. Am. Meteorol. Soc. 2018, 99, 739–755. [Google Scholar] [CrossRef]
- Gui, K.; Che, H.; Zeng, Z.; Wang, Y.; Zhai, S.; Wang, Z.; Luo, M.; Zhang, L.; Liao, T.; Zhao, H.; et al. Construction of a virtual PM2.5 observation network in China based on high-density surface meteorological observations using the Extreme Gradient Boosting model. Environ. Int. 2020, 141, 105801. [Google Scholar] [CrossRef]
- Shang, H.; Chen, L.; Letu, H.; Zhao, M.; Li, S.; Bao, S. Development of a daytime cloud and haze detection algorithm for Himawari-8 satellite measurements over central and eastern China. J. Geophys. Res. Atmos. 2017, 122, D025659. [Google Scholar] [CrossRef]
- Kobayashi, T.; Tateishi, R.; Alsaaideh, B.; Sharma, R.C.; Wakaizumi, T.; Miyamoto, D.; Bai, X.; Long, B.D.; Gegentana, G.; Maitiniyazi, A.; et al. Production of global land cover data—GLCNMO2013. J. Geogr. Geol. 2017, 9, 1–15. [Google Scholar] [CrossRef] [Green Version]
- Yan, X.; Liang, C.; Jiang, Y.; Luo, N.; Zang, Z.; Li, Z. A deep learning approach to improve the retrieval of temperature and humidity profiles from a ground-based microwave radiometer. IEEE Trans. Geosci. Remote Sens. 2020, 58, 842–8437. [Google Scholar] [CrossRef]
Publisher’s Note: MDPI stays neutral with regard to jurisdictional claims in published maps and institutional affiliations. |
© 2022 by the authors. Licensee MDPI, Basel, Switzerland. This article is an open access article distributed under the terms and conditions of the Creative Commons Attribution (CC BY) license (https://creativecommons.org/licenses/by/4.0/).