Article

Assessing the Environmental Suitability for Transhumance in Support of Conflict Prevention in the Sahel

1
Remote Sensing Solutions GmbH, Dingolfinger Str. 9, 81673 Munich, Germany
2
Department of Biology, Ludwig-Maximilians-University Munich, Großhaderner Str. 2, 82152 Planegg-Martinsried, Germany
3
International Centre of Insect Physiology and Ecology (ICIPE), Nairobi P.O. Box 30772-00100, Kenya
4
Displacement Tracking Matrix, International Organization for Migration, Route de Morillons 17, CH-1218 Geneva, Switzerland
5
German Aerospace Center (DLR), Space Agency, Koenigswinterer Str. 522-524, 53227 Bonn, Germany
*
Author to whom correspondence should be addressed.
Remote Sens. 2022, 14(5), 1109; https://doi.org/10.3390/rs14051109
Submission received: 14 January 2022 / Revised: 17 February 2022 / Accepted: 22 February 2022 / Published: 24 February 2022

Abstract

:
Increasing conflicts between farmers and pastoralists continue to be a major challenge in the Sahel. Political and social factors are in tandem important underlying determinants for conflicts in the region, which are amplified by the variability and scarcity of natural resources, often as a result of climate variability and climate change. This study aimed at holistically assessing the main environmental parameters that influence the patterns of seasonal migratory movements (transhumance) in a transboundary area in the southern Republic of Chad and northern Central African Republic through a broad set of Earth observation (EO) data and data from the Transhumance Tracking Tool. A spatial model was applied to the datasets to determine the spatiotemporal dynamics of environmental suitability that reflects suitable areas and corridors for pastoralists. A clear difference in environmental suitability between the origin and destination areas of herders was found in the dry season, proving the main reason for pastoralists’ movements, i.e., the search for grazing areas and water. Potential conflict risk areas could be identified, especially along an agricultural belt, which was proven by conflict location data. The results demonstrate the potential and innovation of EO-derived environmental information to support the planning of transhumance corridors and conflict prevention in the Sahel. In the future, a combination of real-time tracking of herders and EO-derived information can eventually lead to the development of an early warning system for conflicts along transhumance corridors in the Sahel.

1. Introduction

Conflicts between farmers and semi-nomadic livestock herders (transhumance) have increased over the past two decades [1], and continue to be a major challenge in sub-Saharan Africa [2,3]. In particular, farmer–herder conflicts concerning drought and water tensions have become widespread in the Sahel and eastern Africa [4,5]. Livestock farming strongly contributes to the regional states’ gross domestic product (GDP) in the Sahel, with up to 15% of the total GDP coming from this sector. In some countries (e.g., Burkina Faso, Mali and Niger), products originating from pastoral farming represent the third largest export product [6]. Complex ecological, climatic, anthropogenic and underlying socio-political factors affect agro-ecological production systems in the Sahelian countries [7]. In particular, subsistence farmers and pastoralists, who traditionally complement one another in how agro-ecological systems are used, are increasingly competing for the same natural resources, such as water and grazing land [8]. Conflicts concerning natural resources and herd mobility have increased in both number and severity. In particular, increases in herd sizes, cropland expansion and extreme weather events have exacerbated these conflicts [6,7]. The complementarity between farmers and herders has also been disrupted by mismanagement due to poor governance, misguided land tenure policies such as large-scale conversions of dry season pastures to rice fields [9], or extending cropland areas for subsistence farming [10]. Currently, there is limited information on spatio-temporal migratory movements, grazing locations, overlay areas, home ranges and nomadic herding practices adopted by pastoralists. This inevitably limits our understanding of the drivers of transhumance patterns and possible sources and locations of conflicts and with that forced population displacement [11].
The reasons behind farmer–herder conflicts have been analyzed from different perspectives, leading to a general assumption that infrastructural, socio-economic and political factors act in tandem with environmental factors and that environmental stressors are only partly predictive of conflict events [1,12,13,14]. Other studies on conflict resolution have also been conducted, stating the need for addressing climate change-related impacts and the root causes of risks for food security [8] or identifying policy options to address challenges in drought-prone regions [15]. Mbih [16] recently used surveys to collect expert and indigenous agro-ecological knowledge to derive solutions for alternative farmer–herder conflict management and sustainable development. Other studies focused on supporting herders with environmental information. The French Agricultural Research Centre for International Development (CIRAD) therefore developed the “système d’information sur le pastoralisme au Sahel” (SIPSA) in 2012. On a regional level, a certain number of biophysical indicators relating to rangeland productivity, the state of the vegetation, and the extent of surface water and of burned areas were developed using satellite images and subsequently tested and validated by AGRHYMET [7]. Since then, new satellite technology has evolved fast and has not yet been exploited in the context of conflict prevention and mitigation. A participatory mapping study with pastoralists was conducted, where the pastoralists’ rankings of suitable grazing areas matched the vegetation assessment results of the same area [17]. This leads to the assumption that information tools for herders based on environmental information can point out alternative grazing areas and thus could minimize conflicts. Mertz et al. [18] stated that improved weather and natural resource information as well as multiple options for herd movements, if communicated to herders, may reduce the level of conflict.
The present study focuses on (1) developing a geospatial tool to improve the understanding and planning of transhumance migratory movements and corridors and (2) on identifying potential risk areas for conflicts by using a wide range of Earth observation (EO) data to derive various environmental parameters relevant for transhumance. A spatial model was developed that compiles the EO-derived information products into environmental suitability maps for transhumance. Data from the Armed Conflict Location and Events Data (ACLED) set and data from the Transhumance Tracking Tool (TTT) provided by the International Organization for Migration (IOM) were analyzed together with the suitability maps to identify potential risk areas. This study aimed at developing a new conceptual EO framework in direct support of the conflict prevention activities of the International Organization for Migration’s (IOM) in the Sahel.

2. Materials and Methods
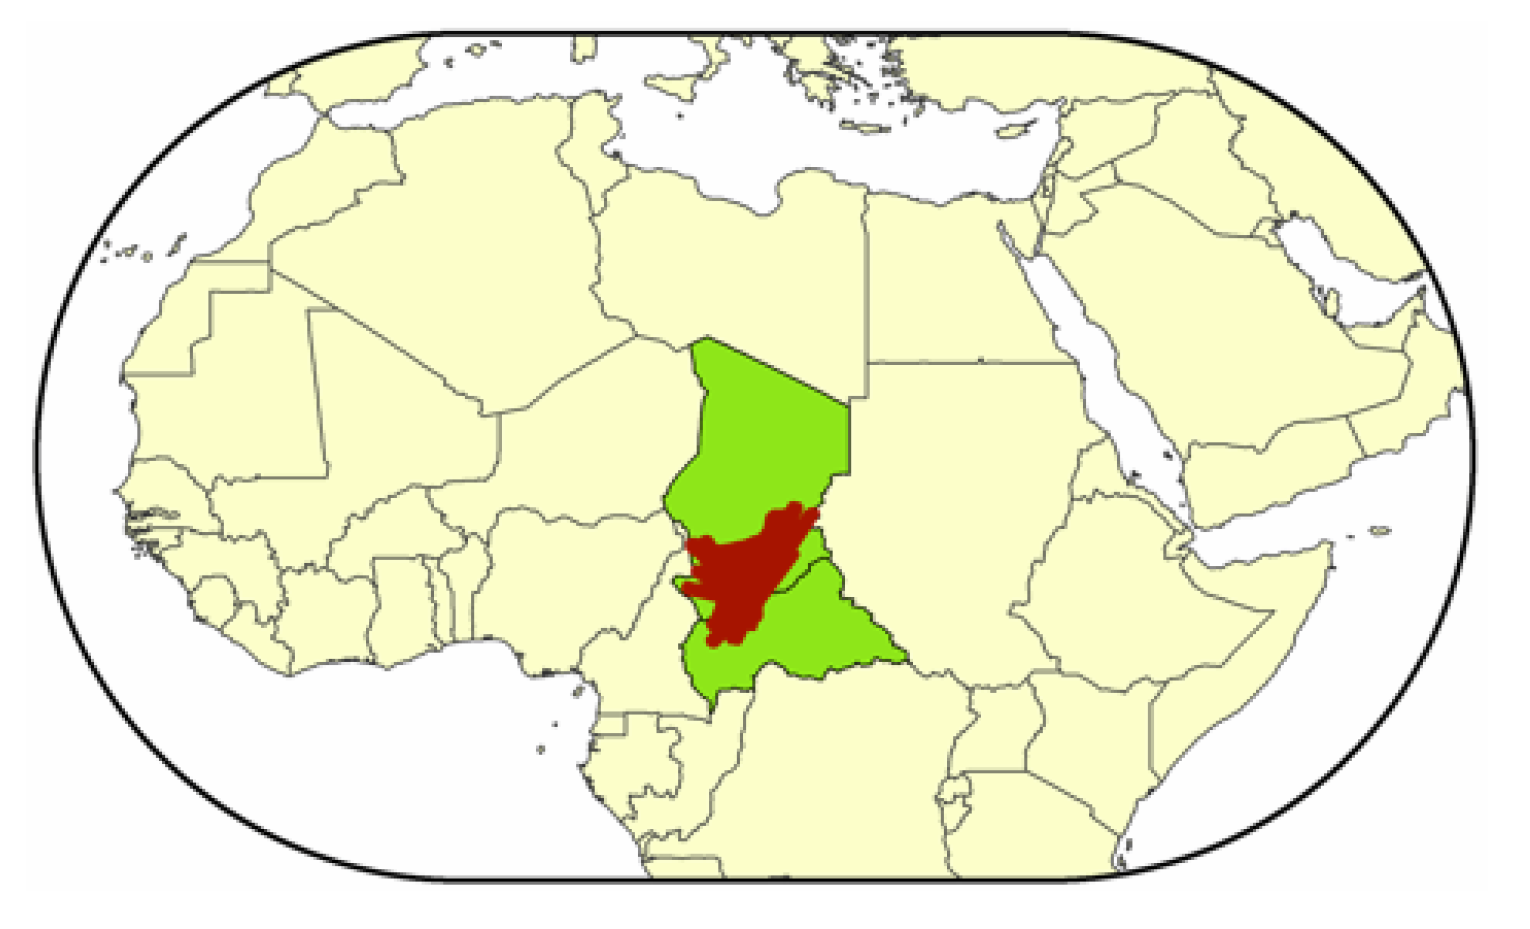
2.1. Study Area

The study area (Figure 1), with a total size of 268,193 km2, is located in the border area between the Republic of Chad and the Central African Republic (CAR). The climate zone and vegetation differ between the northern and southern parts. While the northern area is located in the semiarid Sahelian zone, dominated by bare areas and sparse grassland vegetation, the southern part is located in the humid tropical zone, dominated by denser vegetation and tropical forests. The north–south gradient in climate and vegetation seasonality (stronger in the north of the study area) is the main reason for seasonal transhumance migratory movements from north to south during the dry season.
In this area (Figure 1), pastoral livestock farming, or transhumance, plays a key economic role in food and nutritional security. In Chad, around 80% of the national herd, which holds a total of 94 million heads of cattle, comprises the livelihood of ~40% of the population and accounts for 30% of exports [19]. Pastoral livestock farming is closely dependent on environmental conditions resulting in a typical north–south movement at the onset of the dry season and vice versa at the onset of the rainy season. Over the last few decades, these movements have stretched further south, even leading to cross-border movements between Chad and the Central African Republic. Competitions with other groups, especially crop farmers, add to the already existing environmental challenges for pastoralists during their movements [7].

2.2. Data

The data analysis for this study was exemplarily performed for the year 2019. Already existing and freely available geodata such as those from the Copernicus Land Monitoring Service [20] were used as much as possible. For environmental parameters that did not exist in the required coverage and frequency, Sentinel-1 and Sentinel-2 data from the Copernicus programme (Copernicus Sentinel data 2019) were processed to produce the relevant geoinformation products (Table 1). These open satellite data with high temporal resolutions allow large-scale studies and open up new possibilities for systematic monitoring. These data were used to derive dynamic environmental parameters that are important determinants for transhumance migratory movements such as farming systems, rangeland productivity, vegetation cover, burned areas and surface water occurrence. The input data were complemented by geospatial data on urban settlements, spatial data for protected areas [21] and survey data for transhumance movement patterns provided by IOM through the Transhumance Tracking Tool (TTT) [22] and from the ACLED conflict location and event database [23]. The ACLED conflict database contains information about the exact reported location and date of “battle events”, transfers of military control, headquarter establishment, violence against civilians along with riots [23].
The geospatial information products used are listed in Table 1. Accordingly, various map layers were derived from these products as inputs to the spatial modelling of environmental suitability for transhumance (Table 2).
IOM, through its Displacement Tracking Matrix (DTM), works with the Bilital Maroobe Network (RBM) and its branches of pastoralist organizations to map the movements of transhumance herders along main transhumance corridors in West and Central Africa in order to better understand the dynamics and characteristics of internal and cross-border movements. In brief, data collection is conducted in key seasonal transhumant movements locations (such as cattle markets and water points). This tool aims to quantify these movements through direct observations and head counts the cattle and pastoralists. The Transhumance Tracking Tool (TTT) is a set of data collection modalities intended to provide the information needed for the implementation of support programs for populations involved in transhumance. It is composed of an early warning system tool, a mapping tool and flow counting tool that may be implemented in parallel or separately depending on the data needs. The data used for this document were extracted from the Flow Counting tool that quantified the movements and directions of herders and their cattle along main transhumance corridors.

2.3. Methods

2.3.1. Generation of Earth Observation Products

(1) Surface water occurrence
Level-1 ground range detection data from Sentinel-1 in VV polarization from the descending orbit over three years from 2017 to 2019 were used as input data. Both the presence and variability of water are very useful parameters to identify potential watering areas for the livestock as important points of interest for herders. Sentinel-1 satellite data are often used in inundation mapping, because of their sensitivity to water. The data were preprocessed into calibrated, topographically normalized backscatter images. The preprocessed images were classified into binary water body maps by using a threshold identified through zonal statistics over permanent water bodies and defining a 3% percentile as a variable threshold for each scene. From the individually classified images, a surface water occurrence map was produced, which represents the pixel-wise number of surface water occurrences relative to the number of valid image acquisitions in the observation period of 2017 to 2019 in percent. The product represents a measure for the changing spatial extent of water bodies (permanent vs. seasonal water bodies) and has a spatial pixel resolution of 10 m. The method followed Steinbach et al. [24]. False-positive water detection can occur especially over sparse sandy or bare areas. To remove these false positives, an additional spectral unmixing of multispectral Sentinel-2 data from June 2019 to September 2019 was performed for the endmember‘s vegetation, soil and water. This period was used in order to cover the maximum extent of the water during the wet season. Pixels that were not covered by water according to the spectral unmixing during the rainy season were eliminated as false positives.
(2) Farming systems
The extent and type of cropland constitute important information in regard to transhumance patterns, since areas occupied by crop production limit the space for migratory movements of herds and also pose a potential risk for conflicts. Agricultural farming systems, i.e., irrigated and rainfed cropland, were differentiated by the use of Sentinel-2 data from 2017 to 2019. The agricultural farming systems were mapped using the methodology developed by Landmann et al. [25], which was modified to Sentinel-2 data. Postprocessing was used to generalize the farming systems by eliminating very small areas (single separated pixels) using a majority filter. For limits of this remote sensing-based classification and the accuracy of the method, see Landmann et al. [25].
(3) Vegetation cover and condition
The spectral properties of vegetation with decreasing water content or senescence are well-known and can be observed using remote sensing [26,27]. Spectral mixture analysis (SMA) holds great potential for estimating biomass condition and moisture content at a subpixel level [28,29], also representing the rangeland productivity (green vegetation cover and abundance). In contrast to vegetation indices, spectral mixture analyses make use of all vegetation-relevant spectral bands and are suitable to assess the fractional green photosynthetic vegetation (GV) versus per pixel non-photosynthetic vegetation (NPV), and bare substrate (soil) abundances from satellite data [30,31,32]. Sentinel-2 data were used to derive a spectrally unmixed dataset with cover fractions for “green vegetation”, “dry vegetation” and “bare soil”. Green vegetation abundance was used directly as an indicator for rangeland productivity, while the bare soil fraction was subtracted from 1 to indicate the total vegetation cover (green vegetation + dry vegetation). The product was generated on a monthly basis from January 2019 to December 2019 to account for temporal changes in grazing land and vegetation conditions.
(4) Burned areas
Wildfires are common in the study area, and the majority of the fires occur in the dry season (November–March). Since recently burned areas are not suitable for herders and their cattle, due to the unavailability of fodder, burned areas are considered in this analysis as areas temporarily less suitable for transhumance. Burned areas were mapped for each month using all available Sentinel-2 images in the dry season. For every month, a best pixel composite was produced, whereby the composite for the previous month was used as a pre-fire image and the composite of the current month was used as the post-fire image. For each Sentinel-2 scene of the current month as well as for the monthly composites, the normalized burn ratio (NBR) was calculated. Each NBR image was then subtracted from the NBR of the composite of the previous month (pre-fire) to calculate the difference normalized burn ratio (dNBR) following [33]. Every scene was classified using the two highest burn severity levels with a threshold of <440 (scaled by 10³) according to [34]. To generate monthly burned area composites for the dry season from November to March, all burned areas were cumulated per month.

2.3.2. Model Input Layers

Using the geospatial products described above, two types of input data for the environmental suitability modelling were generated, i.e., binary mask layers with zero suitability assigned (0,1) and environmental suitability layers with scaled values (between 0 and 1).
Mask layers were generated for all areas that represent non-suitable/non-accessible areas for herders, such as inner urban areas, permanent water bodies, and cropland as well as protected areas with access restrictions. To differentiate forests suitable for transhumance (open forests) and forests less suitable (dense forests), all land cover classes that are related to forests were aggregated to “closed forest” and “open forest” according to their legend description [35].
Distance to permanent water (as derived from the surface water dynamics product) was calculated by using the Euclidean distance. The same approach was used for the distance to urban areas, where the class urban was extracted from the land cover data. While urban areas are points of interest for the herders (e.g., livestock markets, veterinary stations, health centers, wells, etc.), which is reflected through the distance to urban areas in the model, the inner urban areas are considered as non-suitable areas for transhumance corridors (applied through zero suitability masking as described above). While the above-described layers were considered as static for the observation year 2019, more dynamic environmental parameters such as the rangeland productivity, vegetation cover and burned areas were generated on a monthly basis for 2019.
Each environmental suitability input layer was standardized to a range from 0 to 1, where 1 indicates the highest suitability for the respective environmental variable. The layers rangeland productivity and vegetation cover are represented in percent and were simply divided by 100. The forest type layer was classified by assigning the value 0.2 to all pixels covering “closed forest” and 0.7 for “open forest”, since herders prefer rather open areas. For both distance layers, local expert knowledge from IOM was incorporated for scaling. Thereby, a maximum distance of two walking days (50 km) was considered as a maximum suitable distance to water bodies and to urban areas. Distances greater than 50 km were set to zero suitability values, while all distances between 0 and 50 km were scaled to a range between 0 and 1. The monthly burned areas were marked with the value 0 (zero suitability).

2.3.3. Spatial Modelling of Environmental Suitability for Transhumance

Figure 2 shows the schematic workflow diagram of the spatial modelling procedure. For each month in 2019, a set of static as well as dynamic environmental variables were used to calculate the environmental suitability maps for transhumance migratory movements. The monthly maps (TS) were calculated using an unweighted mean in the statistical software R as follows:
TS = (D. water + D. urban + Veg. cover + Veg. green. + Forest type + BA)/ND
where TS is the transhumance suitability score, D. refers to “distance to” and BA represents the burned areas. ND is the per pixel denominator, indicating the number of valid input parameters. Since Sentinel-2 data were used to derive vegetation cover and rangeland productivity, persistent clouds in some months led to data gaps in these products, which have to be considered in ND, where 6 indicates that all layers would have valid observations. In this case, the assumption was made that all these parameters can influence the transhumance movement at the same magnitude. To differentiate the magnitude of influence of the different parameters, more detailed research would be needed, as all parameters also act in tandem. This approach was also discussed with experts by IOM and was found the most feasible at this stage of research. However, the model allowed us to change the weights of the input layers, in case adjustments to specific regional conditions were required (e.g., by incorporating local expert knowledge). The resulting TS score ranged from 0 to 1, where 1 reflects highly suitable areas for migratory movements and 0 unsuitable areas. The TS score was then masked by using the following equation:
TS final = TS ∗ urban mask ∗ water mask ∗ cropland mask ∗ protected areas mask.

2.3.4. Combining Suitability Maps with Transhumance Tracking Tool and Conflict Data

Additional data of conflict events (ACLED) and data from the transhumance tracking tool (TTT) were used together with the environmental suitability for transhumance maps to interpret the results. The locations for the origin areas of herders, TTT survey locations and destination areas of herders as indicated in the TTT data were mainly analyzed to assess the seasonal mean environmental suitability scores at origin and destination locations (663 data points per location). A radius of 1 km around each origin and destination location was considered. Points with a north–south movement from origin to destination during the dry season were used to compare the situation at origin and destination locations monthly, in order to get a better understanding of the environmental conditions during transhumance movement and to check the plausibility of the suitability values.
A few example points (40 per each origin and destination) were also used to calculate least-cost paths as the theoretical optimal path through areas with the highest suitability values. The input environmental suitability values were average suitability maps for the two periods of movement—from the origin to the TTT survey locations and from the TTT survey to the destination locations. The mean suitability maps were resampled to a spatial resolution of 100 m to provide faster and easier data processing. The TTT data were then analyzed regarding the number of people in each area per month to determine the two movement timespans. The mean suitability for the journey from an origin to a destination was then calculated from June to October (movement timespan one) and from November until January (movement timespan two) for the routes from the survey location to the destination. The environmental suitability raster layers were converted into graphs connecting each cell centers with each other, which then become nodes. The Moore neighborhood approach—comprising eight orthogonal and diagonal nearest neighbors—was used. The nodes were mostly weighted with calculations using cost, frictions, resistance values or with probabilities of transition. These graphs represent the ‘transition matrix’ [36]. In this analysis, the transition matrix was calculated using the maximum suitability values between connected cells to follow the highest environmental suitability. A geo-correction was needed to correct geometric distortions of distances, through dividing each conductance matrix value by the distance results in the corrected values [36]. The corrected transition matrix was then used to determine the shortest path along the highest suitability values between the two points of origin and destination (least-cost path) [36]. The results represent the theoretical optimum transhumance paths along the highest environmental suitability values. Alongside these results, the ACLED conflict data are displayed on the environmental suitability maps as additional information to identify potential high-risk areas for conflicts. The ACLED data were filtered for farmer and herder-related conflicts from 2011 to 2019.

3. Results

The used Earth observation products (input for the environmental suitability maps), namely farming systems, rangeland productivity, surface water dynamics, vegetation cover, burned areas and the Copernicus land cover, are displayed exemplarily for a small subset of the study area in Figure 3a–e. Cropland was distinguished between rainfed and irrigated cropland within the product framing systems (Figure 3a). This information is important for transhumance movements, since rainfed cropland may be available as grazing land for herders during the dry season, in contrast to irrigated cropland. Water availability plays a crucial role for humans and animals in general, and was herein described by surface water dynamics (Figure 3c), where low to mid-percentages indicate seasonal water bodies mainly available in the wet season. For the environmental suitability maps, distance to water was calculated from the surface water dynamics for all permanent or near-permanent water bodies. Other seasonal varying factors include vegetation availability and vegetation greenness as an indicator for rangeland productivity (Figure 3b,d). Dry vegetation is an additional factor that was included in the analysis and is incorporated in the vegetation cover layer. Dry and green vegetation abundance varies significantly during the season, as shown in Figure 4a–d, where rangeland productivity (green vegetation cover and abundance) is displayed for four months as an example. The availability of green vegetation shifts southwards during the dry season (January and April) and northwards in the wet season (July and October). This example demonstrates the importance of the rangeland productivity for the monthly assessment of transhumance suitability. Additionally, burned areas were included in the analysis with a low suitability score to represent the absence of grazing land due to recent fire activities (Figure 3d). Burned areas were also analyzed on a monthly basis, but only during the dry season (fire season). The Copernicus land cover data (Figure 3e) were used as a static input product in this analysis, where urban areas were extracted and all forest classes were aggregated to open and closed forest.
Figure 5a–d demonstrates that the environmental suitability for transhumance is mainly driven by seasonality over most parts of the study area; red colors indicate high suitability scores, while blue colors indicate low environmental suitability for transhumance. While the northern part of the study area is dominated by an arid to semi-arid climate with very distinct wet and dry seasons, the southern part has a humid climatic regime. This directly translates into continuous changes in environmental suitability for transhumance in the northern part, with decreasing resources for the herds in the dry season, which is the main reason for the north to south movement in this period. High suitability remains in only a few northern parts, mainly where water availability in wetlands and along rivers favors vegetation. In the central and southern parts, an agricultural belt extends westwards and eastwards through the study area, indicated by zero suitability scores. This agricultural belt only leaves a few narrow corridors for north–south migrating pastoralists, indicating a high-risk area for farmer–herder conflicts.
To analyze the environmental suitability in the context of transhumance-related conflicts, the maps were combined with the ACLED conflict data that were filtered for farmer–herder conflicts. Since the farmer–herder conflicts suffer from poor reporting [10], many conflicts may not be covered in the spatial analysis. Figure 6 shows an example for December 2019 (middle of the dry season), when many conflicts occurred in the agricultural belt and close to agricultural areas in the very northeastern part of the study area. Most conflicts occurred in areas with high environmental suitability for transhumance, reflecting the fact that farmers and herders are competing for the same natural resources. Protected areas can also lead to conflicts [37], but must be differentiated regarding their relevance for transhumance. Enclosed protected areas can be seen as “no-go” areas in this context, while protected areas, in general, can still be accessed as grazing land by migratory herders depending on their protection status. During the dry season, the national parks are subject to significant pressure due to the presence of pastoralists, where strong tensions and violent conflicts can also occur between safari operators and pastoralists [37].
The comparison of the environmental suitability between the 663 origin and destination locations of herders in 2019 is displayed in Figure 7, alongside longterm mean precipitation data from 1991 to 2020. While the environmental suitability in the destination areas was higher throughout the year, a drop in suitability scores can be seen from the end of the wet season (October) in both the origin and destination areas (Figure 7). The higher suitability scores during the dry season in the destination areas, with the widest difference between March and May, lead to southward movements of pastoralists.
The results of the least-cost path analysis show theoretical optimal paths for transhumant herders exemplarily displayed for December 2019 (Figure 8). Long distances have to be covered by herders during their southward movements in order to reach their destination areas with enough grazing land in the dry season. These theoretical paths also highlight the need for passing through the agricultural belt to reach the destination areas in the southern part of the study area, or even within the agricultural areas. The dense agricultural belt only allows for narrow corridors accessible to the herders. Here, the challenges with regard to the competition for natural resources lead to a high conflict potential in these areas, as seen in Figure 6.

4. Discussion

The monthly Earth observation-based environmental suitability maps developed in this study indicate areas favorable for transhumance as well as high-risk areas for conflicts with local subsistence farmers. These can help to understand and potentially manage seasonal movement patterns of pastoralists as they move southwards in the dry season to find enough resources for their livestock. The spatial model is flexible to incorporate additional information layers that might be of interest in some regions, such as distance to wells (additional watering locations) or other fenced areas with access restrictions. In addition, the weighing of the information layers can be adjusted in accordance with expert knowledge. For example, ‘distance to water’ and ‘distance to urban’ was set to a maximum of two walking days through expert knowledge, since this distance is in a range that could influence the routes of pastoralists. This assumption can be changed by manipulating the input layer.
The environmental suitability maps for transhumance do not allow the determination of exact migration routes and locations of herders, as there are many other social, economic and political factors working in tandem with environmental suitability that influence transhumance patterns and also trigger conflicts [9]. However, they may be a good tool to be used in negotiations of transhumance routes and corridors with local, regional and national authorities. Additional research is needed to directly link the environmental suitability maps with the actual or specific routes and migration velocity of pastoralists. To achieve this, location data must be collected along the migratory routes, for example via GPS collars attached to livestock. GPS collars have enhanced research in livestock grazing behavior over the past 20 years while becoming more accurate and cost-effective [39], with no long-term effects on animal activity or behavior [40]. The main limiting factors of GPS collars remain logging frequency, the precision of travel distances and battery lifetime [41], while still providing important information on seasonal variations in movement patterns with seasonal water shortage and feed availability as key factors [42].
Additional research is also needed to analyze the temporal variability of environmental suitability, since this study only focuses on 2019. Additionally, movement paths could either change per year or season or follow traditional routes that may not be favorable in certain years. Laying out this research over multiple years could not only provide a better understanding of the connection between migration routes and temporally varying environmental conditions, but also give more information about varying numbers and locations of conflicts between farmers and herders.
The missing tracking information about the actual movement also hinders the direct quantitative validation of the results. A comparison of the environmental suitability at the different locations from the TTT data allowed a plausibility check of the study results. When calculating mean suitability values for origin and destination areas (Figure 7), the differences in the suitability scores explain the north–south movement patterns at the onset of the dry season and thus prove the plausibility of the values. The extracted environmental suitability values at origin and destination locations may have some uncertainty, since the 663 locations were located via location names in the TTT database. In the future, various plausibility checks could be set as part of the IOM TTT activities to detail missing information about the exact routes used by herders. Local participatory mapping activities conducted along the main transhumance corridors could support a more precise identification of main routes used by herders and cattle. This could be conducted with GPS walk-through activities to draw existing routes using GPS trackers. Similar activities would have to be conducted along each locality of a transhumance corridor to be complete. Focus group discussions with herders in key transit along transhumance routes could also provide detailed maps of transhumance corridors. Finally, during the transhumance season, regular phone checks with herders could also be an option to draw more precise maps of transhumance routes.
While many studies focus on explaining the farmer–herder conflicts by local case studies [9] or use field studies to provide conflict-management strategies [16], few studies addressed spatial tools to improve the understanding of migration movements. In contrast to research on policy options to resolve conflicts [8,15], the present study aimed at providing a range of environmental geospatial information that can help to plan transhumance corridors and passing times and mitigate conflicts with local farmers. However, it must be stated that environmental factors are only partly predictive of conflicts [1]. A study by Mertz et al. [18] showed that weather and resource information can prevent but also increase the level of conflict. A survey of key stakeholders led to the assumption that the communication of information must also include different options for herd movements as well as potential conflict areas [18]. By combining environmental suitability for transhumance with up-to-date conflict data and, e.g., agricultural areas, an early warning system could be established. The benefits of this spatially explicit and large-scale analysis of environmental suitability help to provide information on multiple options for migration routes.
To do so, these additional datasets—ACLED conflict data, TTT data, farming systems, urban areas and protected areas—were considered in the present study to provide a broader context. These data, however, come with some limitations, as the ACLED conflict data are gained through national and international media. Besides only covering incidents that make it to the news, ACLED still provides the largest database on conflicts in Africa [10]. Conflicts may not be covered in the ACLED dataset due to the fact that violence against pastoralists suffers from poor reporting [10]. Overall, the conflict data still help to understand the spatial patterns of conflicts. Comparing the environmental suitability for transhumance and the ACLED conflict data for the year 2019, a relationship between high environmental suitability, the presence of agriculture and conflicts was found. This conforms with all of the research findings on the presence of farmer–herder conflicts in the Sahel zone [9], showing the information gain of the spatial combination of environmental suitability for herders and the layers for farming systems and conflict data at a high spatial resolution.
The results of the least-cost path analysis can indicate possible transhumance corridors with enough natural resources for herders. These potential movement corridors can help to identify areas with a lower conflict potential, but also determine corridors where limited environmental conditions could occur that cannot hold a large number of moving livestock.
Combining all these datasets can help to provide a possible planning tool together with local experts to not only better plan and manage transhumance, but also to plan agricultural expansion that leaves corridors for seasonal movements, with the overall goal to mitigate conflicts. It was found that traditional transhumance corridors have changed in the last decade, due to changing climatic conditions [3]. With such a spatial tool as that developed in the present study, areas that provide enough natural resources for livestock can be identified to also improve the efficiency of livestock farming along the migratory routes, which increases the productivity of this agricultural production system, and in turn directly contributes to food security. Providing this information regularly to the herders could pilot transhumance through low-risk areas with a high abundance of the main natural resources required. Since transhumance can flexibly and quickly adapt to major seasonal and interannual variations in resources [6], the tool can provide new options for herders to find optimal routes as an alternative for traditional routes. This would help transhumance to adapt to climate change and security issues. Secured and easier transhumance paths might help herders to continue their activity, since more and more herders are choosing to settle down.

5. Conclusions

This study presents an Earth observation data-driven monitoring system of environmental conditions for transhumance, in direct support of IOM’s activities in the Sahel. Through the combination of the suitability maps with data from the Transhumance Tracking Tool and conflict data from ACLED, a new concept for a spatial decision support and future early warning system is demonstrated in direct support of farmer–herder conflict prevention. With the apparent challenges of climate change regarding the fight for natural resources, such a tool can support the planning and managing of transhumance by local stakeholders. The Earth observation data that indicate the environmental suitability for transhumance can thus not only help to mitigate conflicts, but also to increase the productivity of this important agricultural production system in the region and thus promote food security. By using only cost-free datasets with a global coverage, this methodology can be easily transferred to other areas. The flexibility of the spatial model also allows it to be adopted to specific conditions in other regions. Future research is suggested to investigate real-time tracking data of migrating herds which would further promote the development of an early warning system for conflicts with the long-term perspective of a peaceful coexistence between local subsistence farmers and seasonally migrating pastoralists.

Author Contributions

Conceptualization, J.F., T.L., J.D. and D.J.; methodology, J.F. and M.S.; software, M.S.; validation, E.Z. and D.J.; formal analysis, F.S., D.J., E.Z. and M.S.; writing—original draft preparation, M.S.; writing—review and editing, J.F., T.L., F.S., D.J., J.D. and E.Z.; visualization, M.S.; supervision, J.F. and F.S.; project administration, J.F.; funding acquisition, J.F. All authors have read and agreed to the published version of the manuscript.

Funding

This research was funded by the German Space Agency at DLR, via grants from the German Federal Ministry for Economic Affairs and Climate Action (BMWK) under the grant number 50EE1902 and the project title “CoExist—Monitoring environmental-related transhumance patterns and assessing the risk for population displacement”.

Data Availability Statement

The data from the Transhumance Tracking Tool were provided through the IOM. All other datasets used in this study are publicly available as listed in the text: Sentinel-1 and Sentinel-2 imagery is available from http://scihub.copernicus.eu/ (accessed between September 2019 and December 2020), the Copernicus landcover is available from https://land.copernicus.eu/global/products/lc (accessed in June 2020), the World database on protected areas (WDPA) is available from https://www.protectedplanet.net/en (accessed in February 2021), and the ACLED conflict database is available from https://acleddata.com/#/dashboard (accessed in February 2021).

Conflicts of Interest

The authors declare no conflict of interest.

References

  1. Ayana, E.K.; Ceccato, P.; Fisher, J.; DeFries, R. Examining the relationship between environmental factors and conflict in pastoralist areas of East Africa. Sci. Total Environ. 2016, 557–558, 601–611. [Google Scholar] [CrossRef] [PubMed]
  2. Brottem, L.V. Environmental Change and Farmer-Herder Conflict in Agro-Pastoral West Africa. Hum. Ecol. 2016, 44, 547–563. [Google Scholar] [CrossRef]
  3. Puig Cepero, O.; Desmidt, S.; Detges, A.; Tondel, F.; van Ackern, P.; Foong, A.; Volkholz, J. Climate Change, Development and Security in the Central Sahel. Available online: https://www.cascades.eu/wp-content/uploads/2021/06/Climate-Change-Development-and-Security-in-the-Central-Sahel.pdf (accessed on 19 November 2021).
  4. Benjaminsen, T.A.; Maganga, F.P.; Abdallah, J.M. The Kilosa Killings: Political Ecology of a Farmer–Herder Conflict in Tanzania. Dev. Chang. 2009, 40, 423–445. [Google Scholar] [CrossRef]
  5. Cabot, C. Climate Change and Farmer–Herder Conflicts in West Africa. In Climate Change, Security Risks and Conflict Reduction in Africa; Springer: Berlin/Heidelberg, Germany, 2016; pp. 11–44. [Google Scholar] [CrossRef]
  6. Inter-Resaux. Pastoral Livestock Farmin in Sahel and West Africa: 5 Preconceptions Put to the Test. Available online: https://www.inter-reseaux.org/wp-content/uploads/int-17-broch-pastoralismeuk-bd.pdf (accessed on 9 June 2021).
  7. Touré, I.; Ickowicz, A.; Wane, A.; Garba, I.; Gerber, P.; Atte, I.; Cesaro, J.-D.; Diop, A.T.; Djibo, S.; Ham, F.; et al. Atlas des Évolutions des Systèmes Pastoraux au Sahel: 1970–2012; United Nations Food and Agriculture Organization of the United Nations (FAO)-Centre for International Cooperation in Agricultural Research for Development (CIRAD): Rome, Italy, 2012; ISBN 978-92-5-107152-6. [Google Scholar]
  8. Ikhuoso, O.A.; Adegbeye, M.; Elghandour, M.; Mellado, M.; Al-Dobaib, S.; Salem, A. Climate change and agriculture: The competition for limited resources amidst crop farmers-livestock herding conflict in Nigeria—A review. J. Clean. Prod. 2020, 272, 123104. [Google Scholar] [CrossRef]
  9. Benjaminsen, T.A.; Ba, B. Farmer-herder conflicts, pastoral marginalisation and corruption: A case study from the inland Niger delta of Mali. Geogr. J. 2009, 175, 71–81. [Google Scholar] [CrossRef]
  10. Krätli, S.; Toulmin, C. Farmer-Herder Conflict in Sub-Saharan Africa? International Institute for Environment and Development (IIED): London, UK, 2020. [Google Scholar]
  11. Motta, P.; Porphyre, T.; Hamman, S.M.; Morgan, K.L.; Ngwa, V.N.; Tanya, V.N.; Raizman, E.; Handel, I.G.; Bronsvoort, B.M. Cattle transhumance and agropastoral nomadic herding practices in Central Cameroon. BMC Veter. Res. 2018, 14, 214. [Google Scholar] [CrossRef] [Green Version]
  12. Detges, A. Local conditions of drought-related violence in sub-Saharan Africa. J. Peace Res. 2016, 53, 696–710. [Google Scholar] [CrossRef]
  13. Shettima, A.G.; Tar, U.A. Farmer-Pastoralist Conflict in West Africa: Exploring the Causes and Consequences. Inf. Soc. Justice 2008, 1, 163–184. [Google Scholar] [CrossRef]
  14. Scheffran, J.; Link, P.M.; Schilling, J. Climate and Conflict in Africa. In Oxford Research Encyclopedia of Climate Science; Scheffran, J., Link, P.M., Schilling, J., Eds.; Oxford University Press: London, UK, 2019; ISBN 9780190228620. [Google Scholar]
  15. Adaawen, S.; Rademacher-Schulz, C.; Schraven, B.; Segadlo, N. Drought, migration, and conflict in sub-Saharan Africa: What are the links and policy options? Curr. Dir. Water Scarcity Res. 2019, 2, 15–31. [Google Scholar]
  16. Mbih, R.A. The politics of farmer–herder conflicts and alternative conflict management in Northwest Cameroon. Afr. Geogr. Rev. 2020, 39, 324–344. [Google Scholar] [CrossRef]
  17. Wario, H.T.; Roba, H.G.; Kaufmann, B. Shaping the Herders’ “Mental Maps”: Participatory Mapping with Pastoralists’ to Understand Their Grazing Area Differentiation and Characterization. Environ. Manag. 2015, 56, 721–737. [Google Scholar] [CrossRef]
  18. Mertz, O.; Rasmussen, K.; Rasmussen, L.V. Weather and resource information as tools for dealing with farmer–pastoralist conflicts in the Sahel. Earth Syst. Dyn. 2016, 7, 969–976. [Google Scholar] [CrossRef] [Green Version]
  19. Guinde, M.; Mahamat, O.; Abdallah, M. The importance of pastoralism in Chad. Bull. de l’OIE 2018, 2018, 1–5. [Google Scholar] [CrossRef]
  20. Buchhorn, M.; Smets, B.; Bertels, L.; Roo, B.D.; Lesiv, M.; Tsendbazar, N.-E.; Herold, M.; Fritz, S. Copernicus Global Land Service: Land Cover 100m: Collection 3: Epoch 2018: Globe. Available online: https://library.wur.nl/WebQuery/wurpubs/580265 (accessed on 21 February 2022).
  21. UNEP-WCMC; IUCN. Protected Planet: The World Database on Protected Areas (WDPA) and World Database on Other Effective Area-based Conservation Measures (WD-OECM). Available online: www.protectedplanet.net (accessed on 16 June 2021).
  22. International Organization for Migration. Displacement Tracking Matrix Transhumance Tracking Tool; International Organization for Migration: Geneva, Switzerland, 2021. [Google Scholar]
  23. Raleigh, C.; Linke, A.; Hegre, H.; Karlsen, J. Introducing ACLED: An Armed Conflict Location and Event Dataset. J. Peace Res. 2010, 47, 651–660. [Google Scholar] [CrossRef]
  24. Steinbach, S.; Cornish, N.; Franke, J.; Hentze, K.; Strauch, A.; Thonfeld, F.; Zwart, S.J.; Nelson, A. A New Conceptual Framework for Integrating Earth Observation in Large-scale Wetland Management in East Africa. Wetlands 2021, 41, 93. [Google Scholar] [CrossRef]
  25. Landmann, T.; Eidmann, D.; Cornish, N.; Franke, J.; Siebert, S. Optimizing harmonics from Landsat time series data: The case of mapping rainfed and irrigated agriculture in Zimbabwe. Remote Sens. Lett. 2019, 10, 1038–1046. [Google Scholar] [CrossRef]
  26. Knipling, E.B. Physical and physiological basis for the reflectance of visible and near-infrared radiation from vegetation. Remote Sens. Environ. 1970, 1, 155–159. [Google Scholar] [CrossRef]
  27. Qi, Y.; Dennison, P.E.; Jolly, W.M.; Kropp, R.C.; Brewer, S.C. Spectroscopic analysis of seasonal changes in live fuel moisture content and leaf dry mass. Remote Sens. Environ. 2014, 150, 198–206. [Google Scholar] [CrossRef] [Green Version]
  28. Roberts, D.; Dennison, P.; Gardner, M.; Hetzel, Y.; Ustin, S.; Lee, C. Evaluation of the potential of hyperion for fire danger assessment by comparison to the airborne visible/infrared imaging spectrometer. IEEE Trans. Geosci. Remote Sens. 2003, 41, 1297–1310. [Google Scholar] [CrossRef]
  29. Yebra, M.; Dennison, P.E.; Chuvieco, E.; Riaño, D.; Zylstra, P.M.; Hunt, E.R., Jr.; Danson, F.M.; Qi, Y.; Jurdao, S. A global review of remote sensing of live fuel moisture content for fire danger assessment: Moving towards operational products. Remote Sens. Environ. 2013, 136, 455–468. [Google Scholar] [CrossRef]
  30. Asner, G.P.; Knapp, D.E.; Cooper, A.N.; Bustamante, M.M.C.; Olander, L.P. Ecosystem Structure throughout the Brazilian Amazon from Landsat Observations and Automated Spectral Unmixing. Earth Interact. 2005, 9, 1–31. [Google Scholar] [CrossRef] [Green Version]
  31. Roberts, D.; Smith, M.; Adams, J. Green vegetation, nonphotosynthetic vegetation, and soils in AVIRIS data. Remote Sens. Environ. 1993, 44, 255–269. [Google Scholar] [CrossRef]
  32. Franke, J.; Barradas, A.C.; Borges, M.A.; Costa, M.M.; Dias, P.A.; Hoffmann, A.A.; Filho, J.C.O.; Melchiori, A.E.; Siegert, F. Fuel load mapping in the Brazilian Cerrado in support of integrated fire management. Remote Sens. Environ. 2018, 217, 221–232. [Google Scholar] [CrossRef]
  33. Delcourt, C.; Combee, A.; Izbicki, B.; Mack, M.; Maximov, T.; Petrov, R.; Rogers, B.; Scholten, R.; Shestakova, T.; van Wees, D.; et al. Evaluating the Differenced Normalized Burn Ratio for Assessing Fire Severity Using Sentinel-2 Imagery in Northeast Siberian Larch Forests. Remote Sens. 2021, 13, 2311. [Google Scholar] [CrossRef]
  34. Lutes, D.C.; Keane, R.E.; Caratti, J.F.; Key, C.H.; Benson, N.C.; Sutherland, S.; Gangi, L.J. FIREMON: Fire Effects Monitoring and Inventory System; General Technical Report RMRS-GTR-164-CD; US Department of Agriculture, Forest Service, Rocky Mountain Research Station: Fort Collins, CO, USA, 2006.
  35. Buchhorn, M.; Smets, B.; Bertels, L.; Roo, B.D.; Lesiv, M.; Tsendbazar, N.-E.; Li, L.; Tarko, A. Copernicus Global Land Service: Land Cover 100m: Version 3 Globe 2015–2019: Product User Manual. Available online: https://land.copernicus.eu/global/products/lc (accessed on 21 February 2022).
  36. Van Etten, J. RPackage gdistance: Distances and Routes on Geographical Grids. Available online: https://cran.microsoft.com/snapshot/2014-12-09/web/packages/gdistance/vignettes/gdistance.pdf (accessed on 7 October 2021).
  37. UICN/PACO. Evaluation de L’efficacité de la Gestion des Aires Protégées: Aires Protégées du Tchad. 2008. Available online: https://www.iucn.org/fr/content/evaluation-de-lefficacite-de-la-gestion-des-aires-protegees-parcs-et-reserves-du-tchad (accessed on 21 February 2022).
  38. World Bank Group. Climate Change Knowledge Portal (CCKP): Current Climate: Climatology: Precipitation data. Available online: https://climateknowledgeportal.worldbank.org/country/chad/climate-data-historical (accessed on 19 November 2021).
  39. Bailey, D.W.; Trotter, M.G.; Knight, C.W.; Thomas, M.G. Use of GPS tracking collars and accelerometers for rangeland livestock production research1. Transl. Anim. Sci. 2018, 2, 81–88. [Google Scholar] [CrossRef] [PubMed]
  40. Stabach, J.A.; Cunningham, S.A.; Connette, G.; Mota, J.L.; Reed, D.; Byron, M.; Songer, M.; Wacher, T.; Mertes, K.; Brown, J.L.; et al. Short-term effects of GPS collars on the activity, behavior, and adrenal response of scimitar-horned oryx (Oryx dammah). PLoS ONE 2020, 15, e0221843. [Google Scholar] [CrossRef] [Green Version]
  41. McGranahan, D.A.; Geaumont, B.; Spiess, J.W. Assessment of a livestock GPS collar based on an open-source datalogger informs best practices for logging intensity. Ecol. Evol. 2018, 8, 5649–5660. [Google Scholar] [CrossRef]
  42. Feldt, T.; Schlecht, E. Analysis of GPS trajectories to assess spatio-temporal differences in grazing patterns and land use preferences of domestic livestock in southwestern Madagascar. Pastoralism 2016, 6, 5. [Google Scholar] [CrossRef] [Green Version]
Figure 1. Regional map of the study area (red) between Chad and the Central African Republic (green). Source: ESRI Basemaps.
Remotesensing 14 01109 g001
Figure 2. Workflow diagram.
Remotesensing 14 01109 g002
Figure 3. Examples of the different earth observation products for December 2019 for a subset of the study area. (a) Farming systems, (b) rangeland productivity (masked with urban areas, water, and farming systems), (c) surface water dynamics, (d) vegetation cover and burned areas (masked with urban areas, water, and farming systems), and (e) Copernicus land cover.
Remotesensing 14 01109 g003
Figure 4. Rangeland productivity displayed for four months in 2019 for the study area: (a) January 2019, (b) April 2019, (c) July 2019, (d) October 2019. Water, urban areas and farming systems are masked out. Some no-data artefacts occur during the wet season due to persistent cloud cover. (Sources: Derived from Copernicus Sentinel data (2019); Background: ESRI Basemaps).
Remotesensing 14 01109 g004
Figure 5. Environmental suitability for transhumance displayed for four timesteps in 2019 for the study area: (a) January 2019, (b) April 2019, (c) July 2019, (d) October 2019. One indicates the highest environmental suitability scores, and zero indicates a low suitability score—the layer for farming systems was assigned the value 0 (sources: derived from Copernicus Sentinel data (2019); background: ESRI Basemaps).
Remotesensing 14 01109 g005
Figure 6. Environmental suitability for transhumance (December 2019) with overlayed ACLED conflict data from 2019, farming systems, urban areas, and protected areas (sources: derived from Copernicus Sentinel data (2019); background: ESRI Basemaps).
Remotesensing 14 01109 g006
Figure 7. Monthly mean environmental suitability for transhumance for all origin and destination locations within a 1 km radius of the TTT data (663 observations). Only points with a north–south movement were considered for this analysis. Data source: Precipitation data from the Climate Change Knowledge Portal (CCKP) [38].
Remotesensing 14 01109 g007
Figure 8. Environmental suitability for December 2019 overlayed with point data from the transhumance tracking tool, potential movement corridors, protected areas, farming systems and urban areas. One represents a high and zero a low suitability score.
Remotesensing 14 01109 g008
Table 1. Overview of the EO products and its data sources.
Geospatial ProductsTime PeriodData Type/Source
Surface water occurrence2017–2019Sentinel-1
Farming systemsStatic 2019Sentinel-2
Vegetation greennessMonthly for 2019Sentinel-2
Vegetation coverMonthly for 2019 Sentinel-2
Burned areasMonthly for 2019Sentinel-2
Urban areasStatic for 2019Copernicus Land Monitoring Service
Forest typeStatic for 2019Copernicus Land Monitoring Service
Protected areas with access restrictionsStatic for 2019World Database on Protected Areas (WDPA)
Table 2. Input data used for the calculation of the environmental suitability maps for transhumance. The four datasets below the line were used as “mask” areas in which a suitability of 0 was assigned.
Input Layer NameSpatial ResolutionFrom Geospatial Product
Distance to water body10 mSurface water occurrence
Distance to urban areas10 mUrban areas
Monthly rangeland productivity10 mVegetation greenness
Monthly vegetation cover10 mVegetation cover
Monthly burned areas10 mBurned areas
Forest type30 mForest type
Agricultural fields10 mFarming systems
Water10 mSurface water dynamics
Urban areas30 mUrban areas
Protected areas with access restrictions Protected areas with access restrictions
Publisher’s Note: MDPI stays neutral with regard to jurisdictional claims in published maps and institutional affiliations.

