Article

The Current Crustal Vertical Deformation Features of the Sichuan–Yunnan Region Constrained by Fusing the Leveling Data with the GNSS Data

1
School of Geodesy and Geomatics, Wuhan University, Wuhan 430079, China
2
China Earthquake Administration, Beijing 100036, China
3
The First Monitoring and Application Center, China Earthquake Administration, Tianjin 300180, China
*
Author to whom correspondence should be addressed.
Remote Sens. 2022, 14(5), 1139; https://doi.org/10.3390/rs14051139
Submission received: 23 January 2022 / Revised: 22 February 2022 / Accepted: 23 February 2022 / Published: 25 February 2022
(This article belongs to the Special Issue Geodetic Monitoring for Land Deformation)

Abstract

:
This study uses the least squares collocation method to fuse the leveling vertical deformation velocity in the Sichuan–Yunnan region with the GNSS observations of this region from 320 stations in the China Crustal Movement Observation Network (CMONOC) and the China Continental Tectonic Environment Monitoring Network (CMTEMN) from 1999 to 2017. Such fusion is to improve the accuracy of the vertical deformation rates in large spatial scales. The fused vertical deformation results show that: (1) the fused deformation field has a uniform spatial distribution, and shows detailed change characteristics of key regions; (2) the current vertical crustal motion in this region is featured by the contemporaneous occurrence of crustal compression, shortening and uplift and basin extensional subsidence; (3) most areas in this region experience uplifts, as the lateral push of the Qinghai–Tibet Plateau was blocked by the Sichuan Basin. The areas on the northwest side of the Longmenshan fault and the Lijiang-Xiaojinhe fault are dominated by uplifts, with the velocity of 1.5 mm/a–5.5 mm/a, and the region on the southeast side has slight uplifts, with the velocity of 1.0 mm/a–1.5 mm/a; (4) many areas have high gradient vertical deformation, especially the region close to the Wenshan fault and on the two sides of the Yarlung Zangbo fault that has the value of 3.0–4.0 × 10⁻⁸/a, deserving further attention to be paid to the long-term earthquake hazards.

1. Introduction

The Sichuan–Yunnan region (SYR) is located on the southeastern margin of the Qinghai–Tibet Plateau (QTP) in southwestern China, and is the edge of the area bearing the interaction between the Eurasian plate and the Indian plate. The northward subduction of the Indian plate underneath the Eurasian continent resulted in the northeastward extrusion of the QTP and pushed the plateau materials flow to the east, which, however, was blocked by the hard South China block. As the main channel of the lateral extrusion in the middle QTP, the SYR experienced particularly strong crustal motions, so this region has great topographic fluctuation and frequent seismic activity. There are many large-scale faults with great slip rates [1,2,3,4,5,6,7]. The material extrusion from the middle QTP together with the soft lower crust cause the strong compression of the Longmenshan area in the southeast of the Bayankala block, forming an active compression fault system consisting of the Longmenshan fault and the Minjiang fault, etc. Inside the SYR, the faults are characterized by the extrusion caused by strike-slip. From these faults, a high-speed left-lateral strike-slip fault system has developed, consisting of the Ganzi–Yushu fault, the Xianshuihe fault, the Anning River fault, and the Zemuhe fault, Daliangshan fault, Xiaojiang fault, Litang fault, Lijiang-Xiaojinhe fault, and East Kunlun fault (eastern segment). A corresponding right-lateral strike-slip fault system has also developed, consisting of the Zhongdian fault, the Red River fault, the Qujiang fault zone, the Nujiang fault zone, and the Jinsha River fault. The left-lateral strike-slip of the SYR together with the right-lateral strike-slip of the other blocks contribute to the conjugate strike-slip of the southern and western Yunnan areas. The faults experiencing left-lateral strike-slip are the Wanding fault, the Nanting River fault, the Daluo fault, the Jinghong fault, the Dien Bien Phu fault, and that experiencing the right-lateral strike-slip is the Longling-Lancang fault. Since the last century,122 earthquakes of magnitude 6.0–6.9 and 23 earthquakes of magnitude 7.0–7.9 have occurred in the region, and the largest recorded earthquakes in the SYR are the 1833 Songming M 8.0 earthquake and the 2008 Wenchuan Mw8.0 earthquake.
Accommodating the strongest crustal deformation and seismic activity in the QTP, the SYR has been a focus for studying the present-day crustal deformation model and tectonic evolution of the QTP. GPS observations show a large-scale southeastward lateral movement on the southeastern margin of the QTP [8,9]. The “rigid block extrusion mode” [10,11] and the “lower crustal flow mode” [12,13,14,15] were developed to constrain the internal deformation and lateral extrusion of the QTP, respectively. The “lower crustal flow model” believes that the middle and lower crusts of the QTP are weak, where the crust thickening and shortening on the eastern margin of the plateau are most likely to occur [14,16,17]. This model has been widely accepted as it can well explain the crustal deformation characteristics observed on the surface. Furthermore, seismologic observations [18,19,20,21,22,23,24] and magnetotelluric studies [25,26,27,28,29] have reported low-velocity and high-conductivity/low-resistivity layers in the middle and lower crusts, which confirm the existence of the middle and lower crust flow.
Although the “lower crustal flow model” can explain the deformation characteristics of the eastern margin of the QTP well, whether the lower crustal flow in the eastern QTP has entered the SYR and how it distributes are still debated in the geosciences field. Some scholars have suggested that the lower crust of the eastern margin of the QTP is unlikely to have large-scale ductile flows due to the constraints of faults and tectonic boundaries. There may be flows along two arc-shaped channels, which may have passed through the Jinsha River–Red River fault to southern Yunnan [29]. Some scholars believed that the lower crustal flow from the eastern QTP was blocked by the Lijiang-Xiaojinhe fault and stopped at the northern Yunnan [30]. Studying the crustal movements and the deep driving mechanism in the SYR helps to understand the dynamic process of the southeastern boundary of the QTP, and also helps to estimate the future seismic risks of the key structure in China.
The vertical crustal deformation is important to the study of regional subsidence, crustal evolution and fault motion. The research on seismic activity trends based on vertical deformation provides essential information for estimating the regional strong earthquake trends and detecting dangerous areas. The SYR is a seismically active zone, where several strong earthquakes occurred in the past two decades, including the 2008 Wenchuan Mw 8.0 earthquake, 2013 Lushan Mw 7.0 earthquake and 2017 Jiuzhaigou Mw 7.0 earthquake. These earthquakes brought great damages. Therefore, it is of great significance to analyze the vertical movement characteristics of the major structural faults in the region, and to further explore their correlation with strong earthquakes. The National Leveling Network, Earthquake Leveling Monitoring Network, China Crustal Movement Observation Network (CMONOC) and China Continental Tectonic Environment Monitoring Network (CMTEMN) form a relatively complete deformation observation network for the SYR. The rich archive leveling and GNSS observations can be used for studying the crustal vertical deformation characteristics.
The traditional precision leveling and GNSS were separately used to study the vertical crustal deformation [31,32,33], but their advantages cannot be fully explored. As shown in Figure 1, the leveling route in SYR was generally arranged along the main structural belt, resulting in some observation gaps in the middle part of the secondary blocks. The GNSS stations were uniformly distributed, covering the observation gaps in the leveling route. The two observations are spatially complementary, so combining them can solve the problem of lacking velocity reference when using only leveling observations, and slow down the error transferring and accumulation. It also can constrain the deformed surface, so as to obtain a regional vertical motion field with higher spatial resolution and reasonability. Here, we use the least squares collocation method to obtain the vertical subsidence rate of the SYR, combining high-precision leveling data [31,34] with the observation of 320 GNSS stations in the CMONOC and the CMTEMN from 1999 to 2017. On this basis, we analyze the vertical motion characteristics and dynamic mechanism of this region.

2. Data and Processing

2.1. Leveling Data

The leveling data are from Hao et al. [31], containing the leveling vertical velocities of 3386 measuring points from 1977 to 2011. In addition, the velocities of 98 measuring points from 1990 to 2015 provided by Su et al. [34] are used as supplement. Therefore, the leveling data of 3484 measuring points in total during 1970s–2010s are used for this study. All leveling routes have the data accumulation of more than 2 periods to ensure the reliability of the results. A leveling network of several thousand kilometers usually takes many years to complete the first observation. To solve the time inconsistency, we use the linear dynamic adjustment method to obtain the average vertical deformation rates in a long period. For the rank deficiency of the normal equation, we adopt the rate of a small number of GNSS observation stations as the a priori constraint. The GNSS vertical velocity values (vertical motion velocity under ITRF2005) are from Wang [26]. Hao et al. [31] provided the data of eight GNSS sites, including CHDU, XIAG, KUNM, XNIN, JB08, JB09, JB27, JB35 and JB40, and Su et al. [34] provide the data of 4 GNSS sites, which are XIAG, KUNM, JB40 and SCJL. Theoretically, after the constrained adjustment, the benchmarks for the two datasets are the same. On the basis of Hao’s results, this study uses the flux isostasy theory [35,36,37] to obtain the leveling results under the unified benchmark of the two datasets. The velocity uncertainty is estimated by the dynamic leveling adjustment. On this basis, we remove the gross errors and obtain the vertical motion vectors from the remaining 3278 measuring points (Figure 2a).

2.2. GNSS Data

This study collects the observations of 320 GNSS stations in the CMONOC and CMTEMN for the SYR from 1999 to 2017 and adopts unified models to process the global International GNSS Service (IGS) station data and the GNSS data by using the GAMIT /GLOBK10.61 software [38,39]. The steps are as follows: ① simultaneously solve the satellite orbits, earth orientation parameters, station coordinates, tropospheric delay and horizontal gradient parameters. Use loosely constrained algorithms for the station positions (5 cm for IGS core stations and 10 cm for other stations); ② fix the ambiguity; ③ set the satellite masking angle as 10°; ④ set the sampling interval as 30 s, and reweight the observations according to the post-test phase residuals [40]; ⑤ calculate the earth tide correction, ocean tide correction and pole tide correction. The ocean tide load model adopts FES2004 [41]; ⑥ adopt GMF as the tropospheric mapping function [42]. The atmospheric tide load correction and non-tidal atmospheric load correction are not considered; ⑦ adopt the absolute antenna phase center correction model; ⑧ use GLOBK for benchmark transformation to obtain the station coordinate time series with respect to ITRF2014 [43]. During the transformation, 7 parameters, including the benchmark transformation estimates, translation, rotation and scale factor, are used to reduce the datum distortion caused by the unmodeled non-tidal atmospheric pressure load; ⑨ select 77 IGS stations distributed evenly around the world as the frame sites to achieve the self-consistency of the results from the multiphase observations. Finally, the epochs of the stations with the error bigger than 5 mm north, 5 mm east and 20 mm up are removed to obtain the precise coordinate sequence of the GNSS station.
The coseismic deformation and post-seismic deformation of large earthquakes are useful for understanding the long-term tectonic deformation. From 94 continuous GNSS stations in the SYR, we obtain the tectonic velocity by the following principles: for the observations from the stations in the near field of some large earthquakes, such as the 2008 Wenchuan M8.0 earthquake, only the pre-earthquake data are used to avoid the influence of post-earthquake deformation; a small number of stations with no pre-earthquake observations or only with the first-phase observation data are discarded; the data from the stations in the far field are corrected by the estimated coseismic displacement. We analyze the GNSS deformation time series to obtain reliable vertical velocity, during which only the coseismic deformation and unexplained step effects are considered. The vertical velocity is obtained by Formula (1).
y ( t i ) = a + b t i + c sin ( 2 π t i ) + d cos ( 2 π t i ) + e sin ( 4 π t i ) + f cos ( 4 π t i ) + j = 1 n g g j h ( t i t g j )
where a is the initial position, b is the rate of linear motion, c and d are the annual term coefficients, e and f are the semi-annual term coefficients, g is the magnitude of jth step caused by the replacement of equipment or the coseismic displacement and h is the Heaviside step function.
In order to ensure the reliability of the vertical velocity from the GNSS station, we use time series analysis to evaluate the observations in terms of observation time span, number of observation periods and station stability, etc. The selected GNSS stations should satisfy the following requirements: the weighted root mean square (WRMS) of the coordinate is less than 3.3 mm horizontally and 10 mm vertically; the observation time is longer than 7 years; the station has at least 4 observation periods. Finally, 226 GNSS stations with low observation noise and little interference from annual motion are selected. The linear motion rate is estimated without considering the annual motion. Figure 3 and Figure 4 shows the time series and fitting results of the coordinates of some campaign and continuous stations, respectively. The residuals after fitting are small, with the horizontal WRMS smaller than 3 mm and the vertical WRMS smaller than 8.0 mm. These results demonstrate that the above processing scheme can obtain reliable horizontal and vertical movement trends of the stations.
In addition, in order to increase the spatial resolution of GNSS stations, we adopt the vertical velocity of 441 GNSS stations from 1998 to 2013 from Liang et al. [44]. Following the regional flux isostasy theory, we superimpose the calculated data on Liang’s velocity field to obtain the GNSS vertical velocity in the SYR from 1990s to 2010s. Then, the gross error is removed to obtain the GNSS vertical motion vector (Figure 2b).

2.3. Fusion of the Leveling Results and the GNSS Results

The 1970s–2010s leveling vertical velocity obtained by the linear dynamic adjustment method and the 1990s–2010s GNSS vertical velocity obtained using the time series analysis model are the annual average velocity of the long-time vertical motion and can reflect the background characteristics of the current vertical crustal movement in the SYR. In order to increase the spatial resolution of the deformation velocity by exploring the advantage of the above two results, we develop the least squares collocation method from the method of Vestol [45], which is based on multiquadric function [46,47,48,49,50,51,52].
The error equations for the two types of data are as follows
V i = i = 1 m C i Q i ( x , y ) + S i l i V j = i = 1 m C j Q j ( x , y ) + S j l j } V 1 = A 1 X + B 1 S L 1 V 2 = A 2 X + B 2 S L 2 } V = A X + B S L
where Q i ( x , y ) = ( ( x x i ) 2 + ( y y i ) 2 ) 1.5 2 + 1 . V i is the error equation for the leveling results. It is obtained by Helmert iterative adjustment, and the corresponding weight matrix is P 1 ; V j is the error equation for the GNSS results, and the weight matrix is P 2 . l is the observation, C is the kernel function coefficient, Q ( x , y ) is the kernel function, S is the random signal, A is the design matrix, X is the unknown parameter, B is the coefficient matrix and L is the observation Vector, V = A X + B S L is the overall error equation, with the weight matrix p.
From Formula (2), we obtain
{ X ^ = ( A T C X X 1 A ) 1 A T C X X 1 L S ^ = C S S B T C X X 1 ( I A X ^ )
where C X X = C Δ Δ + B C S S B T , with C Δ Δ and C S S denoting the covariance matrix of the observed value and of the random signal, respectively.
The mean square error of the unit weight is
[ σ ^ Δ 2 ( i ) σ ^ S 2 ( i ) ] = [ n 2 t r ( N 1 N Δ ) + t r ( N 1 N Δ ) 2 t r ( N 1 N Δ N 1 N S ) t r ( N 1 N Δ N 1 N S ) n 2 t r ( N 1 N S ) + t r ( N 1 N S ) 2 ] [ V T P Δ V S ^ T P S S ^ ]
where
N = [ A T P Δ ( i ) A A T P Δ ( i ) B B T P Δ ( i ) A B T P Δ ( i ) B + P S ( i ) ]   N Δ = [ A T P Δ ( i ) A A T P Δ ( i ) B B T P Δ ( i ) A B T P Δ ( i ) B ]     N S = [ 0 0 0 P S ( i ) ]
The adaptive factor is
α ( i ) = σ ^ S 2 ( i ) / σ ^ Δ 2 ( i )
The two types of observations are divided into two groups, and we apply iterative calculation to each group using the adaptive least squares collocation method [53,54]. The specific process is as follows: ① solve the least squares collocation configuration by formulas (2) and (3); ② solve the posterior unit weight error σ ^ Δ ( i ) , σ ^ S ( i ) and adaptive factor α ( i ) by formulas (4) and (5); ③ determine whether |α(i) − 1| < ε works, where ε is a small constant, which is 0.001 in this paper. If the conditions are satisfied, the iteration stops; if the conditions are not satisfied, let P Δ ( i + 1 ) = α ( i ) P Δ ( i ) , modify the weight of the observed value and repeat steps ①–③.

3. Results and Discussion

3.1. The Current Vertical Crustal Deformation in the SYR

The leveling vertical velocity ranges from −2.3 to 6.5 mm/a, and the error ranges from ±0.5 to ±2.1 mm/a, with an average error of ±1.2 mm/a (Figure 2a). The GNSS vertical velocity ranges from −3.6 mm/a to 4.9 mm/a, and the error ranges from ±0.1 mm/a to ±2.4 mm/a, with an average error of ±0.9 mm/a (Figure 2b). As Figure 2 shows, the two results are complementary in space. After fusion, the leveling observation increases the spatial density of the GNSS observation across the faults, and the GNSS observation makes the spatial distribution of the leveling observation more even. The vertical deformation velocity derived from these two datasets in the eastern margin of the QTP and its surrounding areas are consistent. Generally, the deformation in the SYR is dominated by uplifts. The uplift rates are large in eastern Tibet and the northern part of the rhombus block. Some regions have subsidence, including the Sichuan Basin and its periphery, the Jinghong–Pu’er–Jiangcheng area in southern Yunnan, and the Yunlong–Baoshan–Changning area.
In this paper, the least squares collocation method based on the multiquadric function is adopted to fuse the results of the two datasets with the adaptive Helmert iterative weighting. During the fusion, the two results constrain each other to ensure the comparability. The velocity after fusion ranges from −3.1 mm/a to 6.3 mm/a (Figure 2c). We generate the contour and gradient maps from the fused vertical motion rates by the least squares collocation method (Figure 5). On the whole, most areas in the SYR show vertical deformation patterns dominated by uplifts. Specifically, the eastern Tibet and the northern part of the rhombus block in the SYR have rapid uplift, but the Sichuan Basin and its periphery, the Jinghong–Pu’er–Jiangcheng area in southern Yunnan and the Yunlong–Baoshan–Changning area show subsidence.
We combine the reported horizontal crustal movement features in the SYR [55] with our vertical deformation velocities to analyze the crustal movement features in the SYR: the vertical uplift is very obvious in the areas with strong horizontal crustal compression; the subsidence appears in the areas with extensive horizontal tension; the horizontal and vertical crustal movements are spatially coincided. These features reflect that the SYR was pushed and rotated by the QTP and blocked and squeezed by the South China block. In such an environment, the vertical crustal movement presents the contemporaneous occurrence of crustal compression, shortening and uplift and basin extensional subsidence. The detailed characteristics of the vertical deformation are as follows:
(1)
The vertical velocity of the eastern Longmenshan fault is −2 mm/a~−1 mm/a, and that of the subblocks from the western Longmenshan fault to the southeastern Longriba fault is 1 mm/a~3 mm/a, showing rapid uplifts. The results are consistent with those of Hao [31] and Du et al. [56]. The two sides of the Longmenshan fault show very obvious vertical motion. The northwestern part, in which the 2008 Wenchuan M8.0 earthquake occurred, is also in a high gradient area of vertical velocity (2.0~3.0 × 10⁻⁸/a).
(2)
The average deformation velocity is 2 mm/a in the areas to the north of the eastern section of the East Kunlun fault, from the eastern section of the Ganzi–Yushu fault to the Xianshuihe fault and the Kangding–Yajiang–Litang–Batang area. The maximum velocity, 4 mm/a, is observed at the eastern section of the Ganzi–Yushu fault, but it rapidly drops to about 2 mm/a at the junction with the Xianshuihe fault, and then gradually rises to 3 mm/a~4 mm/a along the Xianshuihe fault, showing a segmentation feature. The results of the Gongga Mountain area, a part of the southeastern section of the Xianshuihe fault, are consistent with those of Wang [26] (1.8 mm/a~3.6 mm/a) and Wang et al. [57] (about 4 mm/a), but are smaller than those of Su et al. [34] (5 mm/a~6 mm/a) and Wang et al. [58] (7.4 mm/a). The overall uplift also confirms that during the plastic flow, the material under the QTP crust was compressed near the boundary due to the blockage of the hard Sichuan Basin and exerted great upward fluid pressure on the elastic upper crust [26,59].
(3)
The uplift rate is 1.5 mm/a~2.0 mm/a for the Anning River fault, the Zemuhe fault and the area surrounded by the Daliangshan fault, smaller than the 2.5 mm/a~3.0 mm/a of Wang et al. [57].
(4)
The interior area of the rhombus block is dominated by uplift, with a rate ranging from 0.5 mm/a to 2.0 mm/a. The rates vary greatly between the north and south parts. The velocity of the block boundary is smaller than the internal part, which is 0.5 mm/a~1.5 mm/a. The vertical deformation velocity on the west side is smaller than that on the east side. The whole rhombus block presents an E-shaped (with the opening to the north) uplift.
(5)
The whole Western Sichuan Plateau has rapid uplifts. The uplift velocity gradually increases from the west (1 mm/a) to the east (4 mm/a), and that of the north block is 3 mm/a.
(6)
The Longmenshan fault and the junction between the Chengdu Plain and the western mountains, namely the Jiangyou–Beichuan–Dujiangyan–Mabian–Zhaotong area, have a subsidence velocity of 2 mm/a; the Longling-Lancang River fault and the area near the Daluo fault has a subsidence velocity of 3 mm/a; the average subsidence rate in the east of the Lancang River fault and the Jinghong–Pu’er–Jiangcheng area is 1.5 mm/a; on the west side of the northern section of the Red River fault, namely the area surrounded by Dali–Yunlong–Tengchong–Lincang, the subsidence rate is smaller than 1 mm/a; in the area on the east of the Jinsha River fault zone, that is, from Xiangcheng to Zhongdian, the subsidence rate is smaller than 1 mm/a.
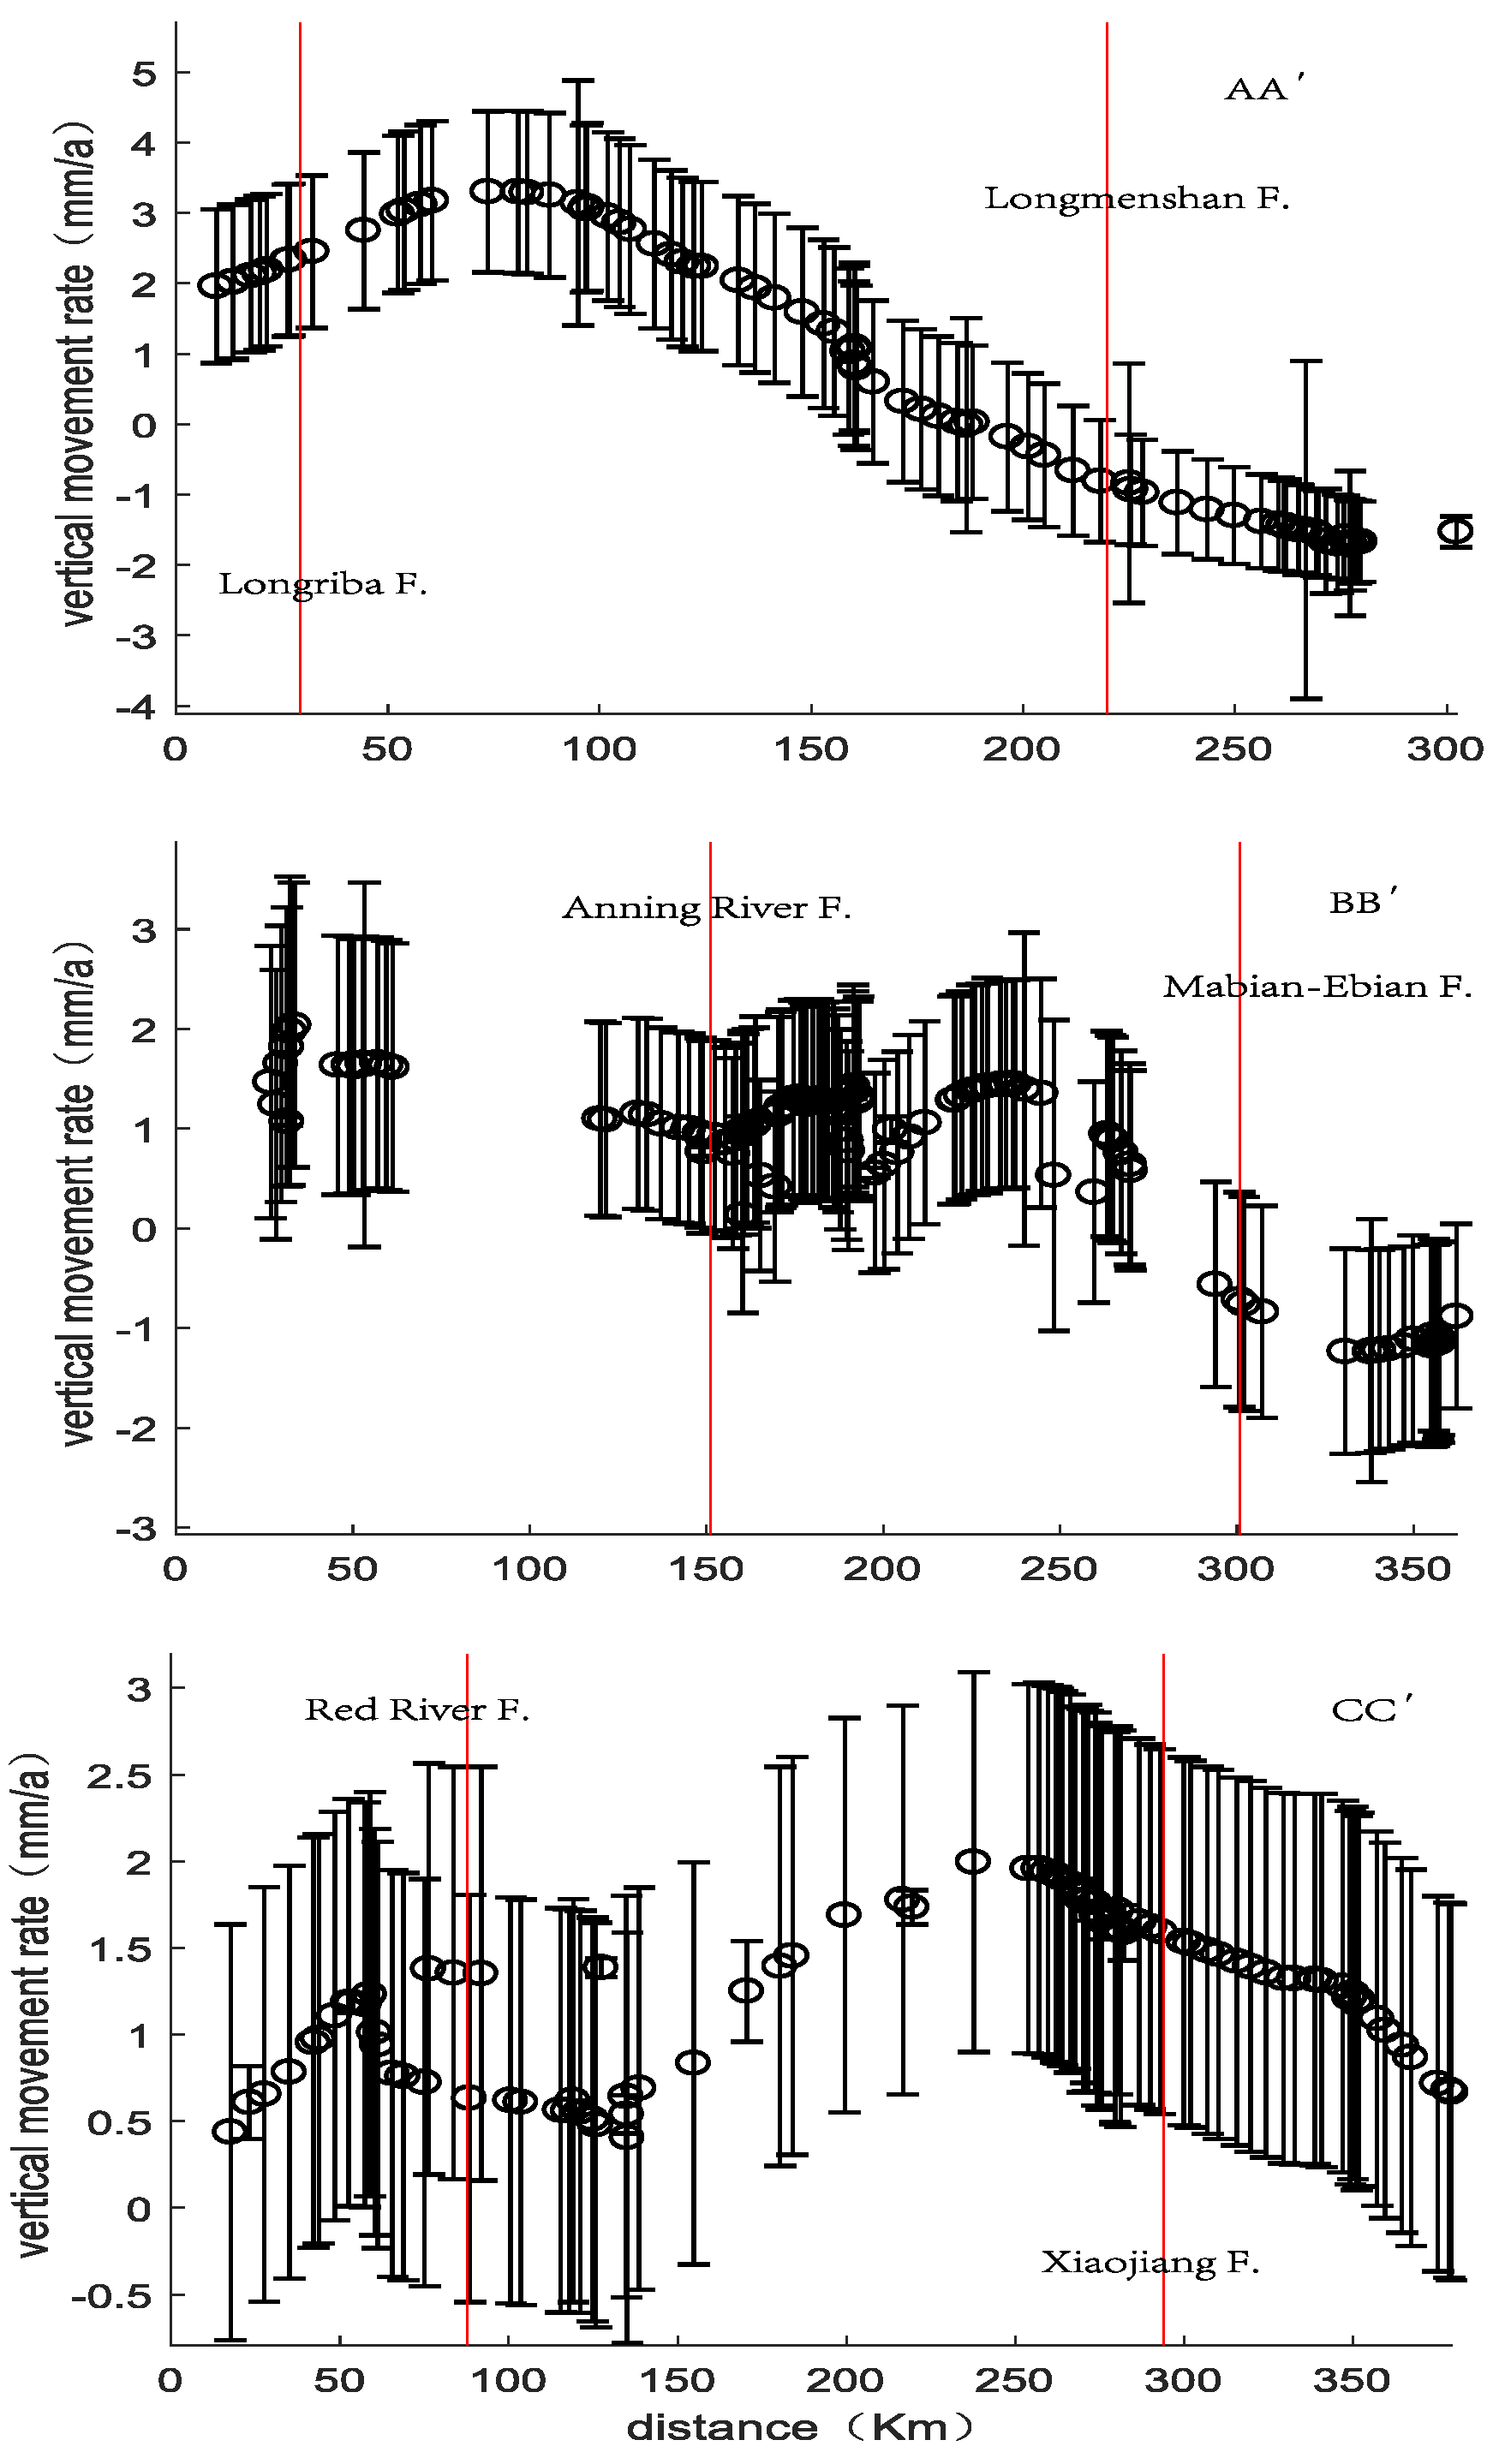
To further explore the vertical deformation features of some important sections in the SYR, we extract three profiles, AA′, BB′ and CC′, in the eastern Bayankala block, the eastern part of the Sichuan–Yunnan border and the southern Yunnan area, respectively (Figure 1). Vertical motions along these three profiles are shown in Figure 6. Profile AA′ starts from the Aba area of Sichuan and trends NW–SE to Chengdu, with a total length of about 300 km, crossing the Longriba and Longmenshan faults. Profile BB′ starts from Yanyuan and trends NE–SW to Yuexi, with a total length of about 370 km, crossing the Anning River and the Mabian-Ebian fault. Profile CC’ starts from Mojiang and trends NE–SW to Qujing, with a total length of about 380 km, crossing the Red River and Xiaojiang faults. The vertical deformation characteristics reflected by the profiles are as follows:
(1)
Profile AA’ shows that the two sides of the Longmenshan fault have opposite vertical motions, with the east side subsiding (−2 mm/a~−1 mm/a) and the west side uplifting (1 mm/a~3 mm/a). The two sides of the Longriba fault also have opposite vertical motions, but the rate difference is smaller, as the uplifting rate on the west side is 2 mm/a~2.5 mm/a, and the subsiding rate on the east side is 2.5 mm/a~3 mm/a. In general, the area on the west of the Longmenshan fault has rapid uplift, especially the area near the Longriba fault with a rate of 2 mm/a~3 mm/a. The area with the maximum uplift rate area is located 100 km east of the Longriba fault. This suggests the contemporaneous occurrence of crustal compression, shortening and uplift and basin extensional subsidence, as the Bayankala block’s eastward motion was blocked by the South China block. The rapid material and energy accumulation are favorable for the occurrence of strong earthquakes.
(2)
Profile BB′ shows that the vertical velocity of the east side of the Mabian-Ebian fault is −2 mm/a~−1 mm/a, and that of the west side is 0.5 mm/a~1.5 mm/a. The two sides show significant vertical motion difference. On the two sides of the Anning River fault, the vertical movement difference is not significant, both showing uplifts with a rate of about 1 mm/a. This suggests that the series of thrust faults on the border of Sichuan and Yunnan experienced compression and rising caused by the eastward movement of the northwestern Sichuan block. There may be risks of regional strong earthquakes.
(3)
Profile CC′ shows that the vertical movement rate of the east side of the Xiaojiang fault is 0.5 mm/a~1.5 mm/a, and that of the west side is 0.5 mm/a~2.0 mm/a, which are not significantly different. The vertical movement rate on the south side of the Red River fault zone is 0.5 mm/a~1.5 mm/a, and the vertical difference between the two sides is not significant.

3.2. Kinetic Mechanism

The SYR is located on the southeastern margin of the QTP, where the lateral extrusion of the QTP caused by the northward push of the Indian plate was blocked by the stable South China block, resulting in the plateau eastern margin continuously uplifting [31,44]. Such a movement pattern has seen no great changes since the Pliocene [17,60]. The collision between the Indian plate and the QTP plate not only caused the crust vertical movement, but also controlled the fault motion mode and the horizontal movement of each block. Most of the material from the QTP moved southward. The rheological strength of the middle and lower crust in the SYR is weaker than that of other crusts. The crust thickness in the region is 20~30 km less than that of the Sichuan Basin and South China block, and the elevation difference is about 3000 m, causing lateral pressure difference. Under this pressure difference, the weak rheological layer in the middle and lower crust flowed, which enhanced the clockwise rotation of the lithosphere in the southeastern QTP around the eastern Himalayan tectonic junction. Such rotation caused the deformation of the upper brittle crust and the movement of the faults, which finally showed as a huge left-lateral strike-slip arc fault structure [61].
The material from the eastern margin of the QTP flowed to three directions. Some moved northeastward and interacted strongly with the Ordos Basin. Some moved to western Sichuan and strongly coupled with the Longmenshan fault, and the other moved to Yunnan after a sharp turn. In the Longmenshan area north to the Xianshuihe fault, the material accumulated in the middle and lower crust after being blocked by the hard crust of the Sichuan Basin, resulting in sharp crust thickening and strong surface uplifts, forming the towering Longmenshan Mountains [14,16,62,63,64]. In the SYR south to the Xianshuihe fault, the crust was relatively soft and the material flow channels in the middle and lower crusts were open. Affected by the drag of this pipeline flow, the SYR had a clockwise rotation, and the crust gradually thickened on a scale of thousands of kilometers. A large-scale of ground surface had uplifted, forming the broad southeastern margin of the QTP, featured by similar geomorphology and blurred boundary [14,16,17,63,64].

3.3. Distribution of Lower Crustal Flows

Deep geophysical exploration revealed that the middle and lower crusts on the eastern margin of the QTP have seismic low-velocity [21,23,28], high Poisson’s ratio [19,27] and high conductivity/low resistivity [25,27,28]. These conditions favor partial melting, especially if there are salt-bearing fluids. Partial melting reduces the strength of the middle and lower crusts and promotes laminar flow [61].
In this study, the finite difference method was adopted to calculate the effective elastic thickness of the lithosphere in the SYR from the EIGEN6C4 Bouguer gravity anomaly and SIO V15.1 topographic data (Figure 7). The effective elastic thickness of the lithosphere reflects the relation between the mechanical strength of the lithosphere [65,66] in the geological time scale (>1 Ma) and the composition of crust–mantle matter, thermal state, and the crust–mantle coupling extent [67,68]. Combined with the reported results in seismology and magnetotelluric fields, we infer that the extruded material from the QTP was blocked by the Sichuan Basin, and accumulated in the Litang–Daocheng–Lijiang area, which showed as prominent surface uplifts and large-scale internal crustal deposits with low velocity and high conductivity/low resistivity. A small part of the material may have moved northward through the Kangding–Daofu area in the Xianshuihe fault, but most of the material moved southward. After being blocked by the southern Yunnan block, a part of the material flowed to Tengchong in the southwest and the rest flowed southeast to the Panzhihua–Dongchuan area.
The vertical crustal movement features in the SYR (Figure 2) suggest that the southeastern margin of the QTP was blocked by the Sichuan Basin, so most of the material flowed southward along the arc-shaped channel into southern Yunnan, some of which was blocked by the Lijiang-Xiaojinhe fault. The rest continued to move southward, but was blocked by the southern Yunnan block. Some crossed the Red River fault and flowed to Pu’er in the southwest, and the rest crossed the Xiaojiang fault and flowed to Liupanshui in the southeast. In the SYR, due to the blockage of the Lijiang-Xiaojinhe fault, the material crossed the Jinsha River–Red River fault and the Xiaojiang fault in the southwest and southeast directions, respectively.

4. Conclusions

Fusing the precise leveling data of the 1970s–2010s and the GNSS data of the 1990s–2010s by the least squares collocation method, we obtain the background field of the vertical crustal movements in the SYR, which reflects the features of the current crustal vertical movements in this region. These features coincided with the neotectonic movement background that the plateau and mountains uplifted and basins subsided. We come to the following conclusions:
(1)
Calculating the vertical deformation field of the regional crust by fusing leveling data and GNSS data can use the advantages of the two data. The obtained deformation has more uniform spatial distribution, and shows more detailed change characteristics of the key regions, than the results obtained from either data. Furthermore, it takes into account the vertical deformation characteristics of the whole region and some important areas and sections, to obtain more comprehensive and detailed vertical deformation.
(2)
Under the combined contribution of the pushing and rotation of the QTP and the blocking and compression of the South China block, the current vertical crustal movement in the SYR presents the contemporaneous occurrence of crustal compression, shortening and uplift and basin extensional subsidence.
(3)
In the study area, the current vertical crustal movements have two different trends on the two sides of the boundary formed by the Longmenshan fault and the Lijiang-Xiaojinhe fault. The region on the northwest side is dominated by rapid uplift, and the uplift rate gradually increases from 1.5 mm/a on the west side of the Western Sichuan Plateau to 5.5 mm/a on the east side. The material from the QTP crust flowed southeastward, and was blocked by the South China block in the east. It exerted great upward fluid pressure on the elastic upper crust, and led to the uplift of the whole region. However, the west side of this region bore smaller blockages and formed smaller upward fluid pressure than that on the east side. The region on the southeast side of the boundary, namely the central Yunnan and South China blocks, had slight uplifts, with a rate of 1.0 mm/a~1.5 mm/a. The surrounding areas had dominating subsidence, especially the Longling-Lancang fault and the Daluo fault, with the subsidence rate of 0.5 mm/a~2.0 mm/a. The reason is that the material under the QTP crust was divided into two branches in this area, and flowed in the southwest and southeast directions separately. This bifurcation released the upward fluid pressure and caused the subsidence of the elastic upper crust.
(4)
This region has many areas with high gradient vertical deformation, including that on the northwest side of the Longmenshan fault (2.0~3.0 × 10⁻⁸/a), and the intersection of the Xianshuihe, Longmenshan and Anning River faults (2.0~3.0 × 10⁻⁸/a), the area near the Wenshan fault (3.0~4.0 × 10⁻⁸/a), the area near Jinggu fault (2.0~4.0 × 10⁻⁸/a), west side of the Jinsha River fault (2.0~5.0 × 10⁻⁸/a) and both sides of the Yarlung Zangbo fault (3.0~4.0 × 10⁻⁸/a).
(5)
The vertical movements in the SYR suggest that the material from the QTP was blocked by the Sichuan Basin and caused the uplift of the southeastern margin of the QTP. The material that flowed to the south was blocked by the southern Yunnan block. One branch passed through the Red River fault and flowed to Pu’er in the southwest. The other branch passed through the Xiaojiang fault and flowed to the Liupanshui fault in the southeast. The surface deformation confirms the “crustal flow model”, but whether these low-velocity areas are connected to each other and where they are from remain unclear. These issues may be solved by simultaneous detection and comprehensive constraints using methods such as comprehensive geophysical profile detection and dense array detection.

Author Contributions

Conceptualization, Y.Z. and C.X.; methodology, Y.Z. and Z.Z.; software, Z.Z., H.L. and S.Z.; validation, Y.Z. and Z.Z.; formal analysis, Y.Z.; writing—original draft preparation, Y.Z. and C.X.; writing—review and editing, Y.Z., C.X. and Z.Z. All authors have read and agreed to the published version of the manuscript.

Funding

This work is supported by the National Natural Science Foundation of China under Grants No. 41721003 and No. 42074007.

Institutional Review Board Statement

Not applicable.

Informed Consent Statement

Not applicable.

Data Availability Statement

All data used in this manuscript can be archived at the Figshare website (https://doi.org/10.6084/m9.figshare.18871442.v1, last accessed on 1 February 2022) for free public access.

Acknowledgments

We appreciate the GPS observations from the Crustal Movement Observation Network of China and the China Continental Tectonic Environment Monitoring Network. We thank Ming Hao at the Second Monitoring Center, China Earthquake Administration, for providing the leveling data. All figures were constructed using Generic Mapping Tools (GMT) version 4.5.1 [69].

Conflicts of Interest

The authors declare no conflict of interest.

References

  1. Li, P. Xianshuihe-Xiaojiang Fault Zone; Earthquake Press: Beijing, China, 1993. (In Chinese) [Google Scholar]
  2. Lacassin, R.; Replumaz, A.; Leloup, P. Hairpin river loops and slip-sense inversion on southeast Asian strike-slip faults. Geology 1998, 26, 703–706. [Google Scholar] [CrossRef]
  3. Xu, X.; Wen, X.; Zheng, R.; Ma, W.; Song, F. The latest tectonic changes of active blocks in the Sichuan-Yunnan region and their dynamic sources. Sci. China (Ser. D) 2003, 33, 151–162. [Google Scholar]
  4. Xu, X.; Wen, X.; Yu, G.; Zheng, R.; Luo, H.; Zheng, B. Average slip rate, seismic rupture segmentation and recurrence characteristics of the Litang fault zone in western Sichuan. Sci. China (Ser. D) 2005, 48, 1183–1196. [Google Scholar]
  5. Xu, X.; Zhang, P.; Wen, X.; Qing, Z.; Chen, G.; Zhu, A. Basic characteristics of active structures in western Sichuan and its adjacent areas and strong earthquake recurrence model. Earthq. Geol. 2005, 27, 446–461. (In Chinese) [Google Scholar]
  6. Wen, X.; Xu, X.; Zheng, R.; Xie, Y.; Wan, C. The average slip rate of the Ganzi-Yushu fault and the rupture of modern earthquakes. Chin. Sci. (Ser. D) 2003, 33, 276–288. [Google Scholar]
  7. Lei, J.; Zhao, D. Structural heterogeneity of the Longmenshan fault zone and the mechanism of the 2008 Wenchuan earthquake (Ms 8.0). Geochem. Geophys. Geosyst. 2009, 10, 1–17. [Google Scholar] [CrossRef]
  8. Wang, Q.; Zhang, P.-Z.; Freymueller, J.T.; Bilham, R.; Larson, K.M.; Lai, X.; You, X.; Niu, Z.; Wu, J.; Li, Y.; et al. Present-Day Crustal Deformation in China Constrained by Global Positioning System Measurements. Science 2001, 294, 574–577. [Google Scholar] [CrossRef] [Green Version]
  9. Gan, W.; Zhang, P.; Shen, Z.-K.; Niu, Z.; Wang, M.; Wan, Y.; Zhou, D.; Cheng, J. Present-day crustal motion within the Tibetan Plateau inferred from GPS measurements. J. Geophys. Res. Earth Surf. 2007, 112, D17301. [Google Scholar] [CrossRef] [Green Version]
  10. Tapponnier, P.; Molnar, P. Active faulting and tectonics in China. J. Geophys. Res. Earth Surf. 1977, 82, 2905–2930. [Google Scholar] [CrossRef]
  11. Avouac, J.-P.; Tapponnier, P. Kinematic model of active deformation in central Asia. Geophys. Res. Lett. 1993, 20, 895–898. [Google Scholar] [CrossRef] [Green Version]
  12. Royden, L. Coupling and decoupling of crust and mantle in convergent orogens: Implications for strain partitioning in the crust. J. Geophys. Res. Earth Surf. 1996, 101, 17679–17705. [Google Scholar] [CrossRef]
  13. England, P.; Molnar, P. Active Deformation of Asia: From Kinematics to Dynamics. Science 1997, 278, 647–650. [Google Scholar] [CrossRef] [Green Version]
  14. Clark, M.; Royden, L. Topographic ooze: Building the eastern margin of Tibet by lower crustal flow. Geology 2000, 28, 703–706. [Google Scholar] [CrossRef]
  15. Klemperer, S. Crustal flow in Tibet: Geophysical evidence for the physical state of Tibetan lithosphere, and inferred patterns of active flow. Geol. Soc. Lond. Spec. Publ. 2006, 268, 39–70. [Google Scholar] [CrossRef] [Green Version]
  16. Clark, M.; Bush, J.; Royden, L. Dynamic topography produced by lower crustal flow against rheological strength hetero-geneities bordering the Tibetan Plateau. Geophys. J. Int. 2005, 162, 575–590. [Google Scholar] [CrossRef] [Green Version]
  17. Schoenbohm, L.; Burchfiel, B.C.; Liangzhong, C. Propagation of surface uplift, lower crustal flow, and Cenozoic tectonics of the southeast margin of the Tibetan Plateau. Geology 2006, 34, 813–816. [Google Scholar] [CrossRef] [Green Version]
  18. Wang, C.; Wu, J.; Lou, H.; Zhou, M.; Bai, Z. Crustal P-wave velocity structure in western Sichuan-eastern Tibet. Sci. China Ser. D Earth Sci. 2003, 33, 181–189. (In Chinese) [Google Scholar]
  19. Wang, C.; Lou, H.; Lv, Z.; Wu, J.; Chang, L.; Dai, S.; You, H.; Tang, F.; Zhu, L.; Silver, P. S-wave velocity structure of the crust and upper mantle in the eastern Qinghai-Tibet Plateau: The deep environment of the lower crustal flow. Sci. China Ser. D Earth Sci. 2008, 38, 22–32. [Google Scholar]
  20. Wang, C.; Yang, W.; Wu, J.; Ding, Z. Research on the lithospheric structure and earthquakes in the north-south tectonic belt. Chin. J. Geophys. 2015, 58, 3867–3901. (In Chinese) [Google Scholar]
  21. Yao, H.; Van Der Hilst, R.D.; Montagner, J.-P. Heterogeneity and anisotropy of the lithosphere of SE Tibet from surface wave array tomography. J. Geophys. Res. Earth Surf. 2010, 115, B12307. [Google Scholar] [CrossRef]
  22. Bao, X.; Sun, X.; Xu, M.; Eaton, D.W.; Song, X.; Wang, L.; Ding, Z.; Mi, N.; Li, H.; Yu, D.; et al. Two crustal low-velocity channels beneath SE Tibet revealed by joint inversion of Rayleigh wave dispersion and receiver functions. Earth Planet. Sci. Lett. 2015, 415, 16–24. [Google Scholar] [CrossRef]
  23. Liu, Q.; Van, D.; Li, Y.; Yao, H.; Chen, J.; Guo, B. Eastward expansion of the Tibetan Plateau by crustal flow and strain par-titioning across faults. Nat. Geosci. 2014, 7, 361–365. [Google Scholar] [CrossRef]
  24. Wang, S.; Xu, X.; Hu, J. A review of research on crustal structure and dynamical models on the southeastern margin of the Qinghai-Tibet Plateau. Chin. J. Geophys. 2015, 58, 4235–4253. (In Chinese) [Google Scholar]
  25. Sun, J.; Jin, G.; Bai, D.; Wang, L. The detection of the electrical structure of the crust and upper mantle on the eastern margin of the Qinghai-Tibet Plateau and its tectonic significance. Sci. China Ser. D Earth Sci. 2003, 33, 173–180. (In Chinese) [Google Scholar]
  26. Wang, M. Refinement Analysis of GPS Observation Results and Research on Present-Day Crustal Deformation Field in Mainland China. Ph.D. Thesis, Institute of Geology, China Earthquake Administration, Beijing, China, 2009. (In Chinese). [Google Scholar]
  27. Xu, L.; Rondenay, S.; van der Hilst, R.D. Structure of the crust beneath the southeastern Tibetan Plateau from teleseismic receiver functions. Phys. Earth Planet. Inter. 2007, 165, 176–193. [Google Scholar] [CrossRef]
  28. Zhao, G.; Chen, X.; Wang, L.; Wang, J.; Tang, J.; Wan, Z.; Zhang, J.; Zhan, Y.; Xiao, Q. Evidence from electromagnetic de-tection of the crustal “tubular flow” layer on the eastern margin of the Qinghai-Tibet Plateau. Sci. Bull. 2008, 53, 345–350. [Google Scholar] [CrossRef] [Green Version]
  29. Bai, D.; Unsworth, M.; Meju, M.A.; Ma, X.; Teng, J.; Kong, X.; Sun, Y.; Sun, J.; Wang, L.; Jiang, C.; et al. Crustal deformation of the eastern Tibetan plateau revealed by magnetotelluric imaging. Nat. Geosci. 2010, 3, 358–362. [Google Scholar] [CrossRef]
  30. Chen, Y.; Zhang, Z.; Sun, C.; Badal, J. Crustal anisotropy from Moho converted Ps wave splitting analysis and geodynamic implications beneath the eastern margin of Tibet and surrounding regions. Gondwana Res. 2013, 24, 946–957. [Google Scholar] [CrossRef]
  31. Hao, M. Studying the present vertical movement of the crust in the eastern margin of the Qinghai-Tibet Plateau using precise leveling data. In Proceedings of the 28th Annual Meeting of Chinese Geophysical Society, Beijing, China, 17–20 October 2012. (In Chinese). [Google Scholar]
  32. Zhao, B.; Nie, Z.; Huang, Y.; Wang, W.; Zhang, C.; Tan, K.; Du, R. Present-day vertical motion in North China revealed by large-scale GPS. Geod. Geodyn. 2014, 34, 35–39. (In Chinese) [Google Scholar]
  33. Qin, S.; Wang, W.; Song, S. Comparative study on vertical deformation based on GPS and leveling data. Geod. Geodyn. 2018, 9, 11–16. (In Chinese) [Google Scholar] [CrossRef]
  34. Su, G.; Tian, X.; Sun, Q.; Deng, D.; Chang, L.; Wang, S. Research on vertical deformation and main fault activity in Si-chuan-Yunnan region. Geod. Geodyn. 2017, 37, 686–691. (In Chinese) [Google Scholar]
  35. Yang, G. Application of field theory method in data processing of vertical crustal deformation. Crustal Deform. Earthq. 1991, 11, 61–67. (In Chinese) [Google Scholar]
  36. Zhang, Q.; Fan, Y. Equilibrium Theory and Analysis Model of Vertical Crustal Movement. J. Surv. Map-Ping 2001, 30, 233–237. (In Chinese) [Google Scholar]
  37. Zhang, Q.; Fan, Y.; Zhao, C. Analysis model of crustal vertical deformation field based on flux equilibrium datum. J. Wuhan Univ. (Inf. Sci. Ed.) 2004, 29, 231–234. (In Chinese) [Google Scholar]
  38. Herring, T.; King, R.; Floyd, M.; McClusky, S. GAMIT Reference Manual GPS Analysis at MIT(Release 10.6); Department of Earth, Atmosphere, and Planetary Sciences Massachusetts Institute Technology: Cambridge, UK, 2015. [Google Scholar]
  39. Herring, T.; King, R.; McClusky, S. GLOBK Reference Manual. Global Kalman filter VLBI and GPS Analysis Program (Release 10.6); Department of Earth, Atmosphere, and Planetary Sciences Massachusetts Institute Technology: Cambridge, UK, 2015. [Google Scholar]
  40. Tregoning, P.; Watson, C. Atmospheric effects and spurious signals in GPS analyses. J. Geophys. Res. Earth Surf. 2009, 114. [Google Scholar] [CrossRef] [Green Version]
  41. Lyard, F.; Lefevre, F.; Letellier, T.; Francis, O. Modelling the global ocean tides: Modern insights from FES2004. Ocean Dyn. 2006, 56, 394–415. [Google Scholar] [CrossRef]
  42. Boehm, J.; Niell, A.; Tregoning, P.; Schuh, H. Global Mapping Function (GMF): A new empirical mapping function based on numerical weather model data. Geophys. Res. Lett. 2006, 33, L07304. [Google Scholar] [CrossRef] [Green Version]
  43. Altamimi, Z.; Rebischung, P.; Métivier, L.; Collilieux, X. ITRF2014: A new release of the International Terrestrial Reference Frame modeling nonlinear station motions. J. Geophys. Res. Solid Earth 2016, 121, 6109–6131. [Google Scholar] [CrossRef] [Green Version]
  44. Liang, S.; Gan, W.; Shen, C.; Xiao, G.; Liu, J.; Chen, W.; Ding, X.; Zhou, D. Three-dimensional velocity field of present-day crustal motion of the Tibetan Plateau derived from GPS measurements. J. Geophys. Res. Solid Earth 2013, 118, 5722–5732. [Google Scholar] [CrossRef]
  45. Vestol, O. Determination of Postglacial Land Uplift in Fennoscandia from Leveling, Tide-gauges and Continuous GPS Sta-tions using Least Squares Collocation. J. Geod. 2006, 80, 248–258. [Google Scholar] [CrossRef]
  46. Hardy, R. Multi quadratic equations of topography and other irregular surfaces. J. Geophys. 1971, 76, 1905–1915. [Google Scholar] [CrossRef]
  47. Hardy, R. Geodetic Applications of Multiquadric Equations; ERI. Project 10705; American (NTIS PB 255296); Iowa State University: Ames, IA, USA, 1976. [Google Scholar]
  48. Hardy, R. The Application of Multi-Quadric Equations and Point Mass Anomaly Models to Crustal Movement Studies; NOAA Technical Report NOS 76, NGS 11; NOAA: Washington, DC, USA, 1978. [Google Scholar]
  49. Yang, G.; Huang, L. Preliminary Numerical Study on Several Properties of Multifaceted Functions in Rate Surface Fitting Method. Crustal Deform. Earthq. 1990, 10, 70–82. (In Chinese) [Google Scholar]
  50. Huang, L.; Tao, B.; Zhao, C. The application of polyhedral function fitting in the study of vertical crustal motion. J. Surv. Mapp. 1993, 22, 25–32. (In Chinese) [Google Scholar]
  51. Tao, B.; Du, F. Study on the vertical movement of the present crust in the Xianshuihe area by the multi-faceted function method. J. Wuhan Univ. Surv. Mapp. 1991, 10, 12–21. (In Chinese) [Google Scholar]
  52. Tao, B.; Yao, Y. Parameter estimation based on multifaceted kernel function configuration model. J. Wuhan Univ. (Inf. Sci. Ed.) 2003, 28, 547–550. (In Chinese) [Google Scholar]
  53. Yang, Y.; Zeng, A.; Zhang, J. Adaptive collocation with application in height system transformation. J. Geod. 2009, 83, 403–410. [Google Scholar] [CrossRef]
  54. Guo, C.; Nie, J.; Wang, B.; Jiang, G. Fitting of GPS level and gravitational geoid using adaptive least squares configuration. J. Wuhan Univ. (Inf. Sci. Ed.) 2013, 38, 44–47. (In Chinese) [Google Scholar]
  55. Wang, M.; Shen, Z.-K. Present-Day Crustal Deformation of Continental China Derived From GPS and Its Tectonic Implications. J. Geophys. Res. Solid Earth 2020, 125, e2019JB018774. [Google Scholar] [CrossRef] [Green Version]
  56. Du, F.; Wen, X.; Zhang, P.; Wang, Q. Interseismic deformation across the Longmenshan fault zone before the 2008 Wen-chuan M8.0 earthquake. Chin. J. Geophys. 2009, 52, 2729–2738. (In Chinese) [Google Scholar]
  57. Wang, S.; Jiang, F.; Hao, M.; Zhu, L. Study on the present three-dimensional crustal movement characteristics of the eastern margin of the Qinghai-Tibet Plateau. Chin. J. Geophys. 2013, 56, 3334–3345. (In Chinese) [Google Scholar]
  58. Wang, Q.; Cui, D.; Wang, W.; Zhang, S.; Liu, W.; Shi, Q. Research on present-day vertical crustal movement in western Sichuan. Sci. China Ser. D 2008, 038, 598–610. [Google Scholar]
  59. Burchfiel, B.; Royden, L.; Van Der Hilst, R.; Hager, B.; Chen, Z.; King, R.; Li, C.; Lu, J.; Yao, H.; Kirby, E. A geological and geophysical context for the Wenchuan earthquake of 12 May 2008, Sichuan, People’s Republic of China. GSA Today 2008, 18, 4. [Google Scholar] [CrossRef]
  60. Wang, E.; Burchfiel, B.C. Late Cenozoic to Holocene deformation in southwestern Sichuan and adjacent Yunnan, China, and its role in formation of the southeastern part of the Tibetan Plateau. GSA Bull. 2000, 112, 413–423. [Google Scholar] [CrossRef]
  61. Zhang, P. Present tectonic deformation, strain distribution and deep dynamic process in the eastern margin of the Qing-hai-Tibet Plateau and western Sichuan. Sci. China Earth Sci. 2008, 38, 1041–1056. [Google Scholar]
  62. Royden, L.H.; Burchfiel, B.C.; King, R.W.; Wang, E.; Chen, Z.; Shen, F.; Liu, Y. Surface Deformation and Lower Crustal Flow in Eastern Tibet. Science 1997, 276, 788–790. [Google Scholar] [CrossRef]
  63. Clark, M.K.; Schoenbohm, L.; Royden, L.H.; Whipple, K.X.; Burchfiel, B.C.; Zhang, X.; Tang, W.; Wang, E.; Chen, L. Surface uplift, tectonics, and erosion of eastern Tibet from large-scale drainage patterns. Tectonics 2004, 23, 1–21. [Google Scholar] [CrossRef] [Green Version]
  64. Kirby, E.; Reiners, P.; Kro, M.; Whipple, K.; Hodges, K.; Farley, K.; Tang, W.; Chen, Z. Late Cenozoic evolution of the eastern margin of the Tibetan Plateau: Inferences from 40Ar/39Ar and (U-Th)/He thermochronology. Tectonics 2002, 21, 1–20. [Google Scholar] [CrossRef] [Green Version]
  65. Forsyth, D.W. Subsurface loading and estimates of the flexural rigidity of continental lithosphere. J. Geophys. Res. Earth Surf. 1985, 90, 12623–12632. [Google Scholar] [CrossRef]
  66. Jiao, S.; Jin, Z. Study on effective elastic thickness of continental lithosphere and its dynamic significance. Geol. Sci. Technol. Inf. 1996, 15, 8–12. (In Chinese) [Google Scholar]
  67. Burov, E.B.; Diament, M. The effective elastic thickness (Te) of continental lithosphere: What does it really mean? J. Geophys. Res. Earth Surf. 1995, 100, 3905–3927. [Google Scholar] [CrossRef] [Green Version]
  68. An, M.; Shi, Y. Study on the thickness distribution of the lithosphere in mainland China. Geosci. Front. 2006, 13, 23–30. (In Chinese) [Google Scholar]
  69. Wessel, P.; Smith, W.H.F.; Scharroo, R.; Luis, J.; Wobbe, F. Generic Mapping Tools: Improved Version Released. EOS Trans. Am. Geophys. Union 2013, 94, 409–410. [Google Scholar] [CrossRef] [Green Version]
Figure 1. The tectonic setting of the Sichuan–Yunnan region (SYR). Triangles and squares denote GNSS stations and leveling points, respectively. Red dots denote the M ≥ 7.0 earthquakes occurred in this region since 1900. Profiles AA′, BB′ and CC′ will be discussed in Section 3.1. Inset shows the location of the study area in China.
Remotesensing 14 01139 g001
Figure 2. The vertical motion vectors of the SYR obtained (a) from the leveling data, (b) from the GNSS data, and (c) by fusing the leveling and GNSS results.
Remotesensing 14 01139 g002
Figure 3. Time series and errors of the north (left), east (middle) and vertical (right) components of three GNSS campaign sites. The first two rows are for station G352, the third and fourth rows are for station GB01, and the fifth and sixth rows are for station H337. The red lines indicate the estimated velocities. The WRMS of every component are shown at the left up corner of error panels.
Remotesensing 14 01139 g003
Figure 4. Time series and errors of three GNSS continuous sites: SCML (first two rows), YNDC (third and fourth rows), SCTQ (fifth and sixth rows). Others are the same as Figure 3.
Remotesensing 14 01139 g004
Figure 5. (a) Contour and (b) gradient map of the vertical motion velocity in the eastern margin of the Qinghai–Tibet Plateau and its surrounding areas. Solid black lines indicate the contours of vertical motion velocities in (a) and gradients in (b). The blue and red arrows are the vertical velocity after fusing the GNSS and the leveling data, respectively.
Remotesensing 14 01139 g005
Figure 6. Three profiles, AA′, BB′ and CC′, showing the vertical motions in the SYR. Profile locations are shown in Figure 1.
Remotesensing 14 01139 g006
Figure 7. The effective elastic thickness of the lithosphere in the SYR, calculated from the EIGEN6C4 Bouguer gravity anomaly and SIO V15.1 topographic data.
Remotesensing 14 01139 g007
Publisher’s Note: MDPI stays neutral with regard to jurisdictional claims in published maps and institutional affiliations.

