Article

Study on the Classification and Change Detection Methods of Drylands in Arid and Semi-Arid Regions

1
Aerospace Information Research Institute, Chinese Academy of Sciences, Beijing 100093, China
2
University of Chinese Academy of Sciences, Beijing 100093, China
*
Author to whom correspondence should be addressed.
Remote Sens. 2022, 14(5), 1256; https://doi.org/10.3390/rs14051256
Submission received: 31 December 2021 / Revised: 20 February 2022 / Accepted: 25 February 2022 / Published: 4 March 2022

Abstract

:
The aim of this study was to clarify the distribution of irrigated drylands in arid and semi-arid areas, where complex terrain, diverse crops and staggered cultivated lands exist. This paper studied the classification methods of irrigated drylands based on temperature, precipitation, Normalized Difference Vegetation Index (NDVI) and Normalized Difference Water Index (NDWI) from Landsat data in the one-harvest area of the northern Loess Plateau of China by using the Google Earth Engine (GEE) platform. An extraction method was proposed for irrigated drylands in arid and semi-arid regions of northwest China. In addition, the change types of irrigated and rainfed drylands in the two periods were classified, and a method was also put forward to directly classify the change types by using the image differences between the two periods combined with the classification results of each period. It was found that combining the ratio of NDVI and NDWI with the accumulated values of temperature and precipitation of the 30 days before imaging could effectively improve the classification accuracy. Moreover, directly classifying the gaps of remote sensing factors in the time dimension before combining spatial clustering information could yield a more accurate type of change, because the accumulation of errors in the change maps obtained from the overlay analysis of distribution maps of the two periods could be avoided. The accuracy of classification could be improved by introducing the dynamic information of time dimension into the classification of historical periods. This study complements the extraction method for this type of irrigated dryland, and the classification results can improve the accuracy of existing products in terms of spatial resolution, which can fill the shortage of detailed distribution data for irrigated and rainfed drylands in this region.

1. Introduction

Irrigated cropland, which accounts for 18% of the world’s arable land, produces about 40% of the world’s total grain output, and the grain yield per unit area of irrigated cropland is more than twice that of dry croplands [1,2,3]. This gap is particularly dramatic in arid and semi-arid regions. Irrigation allows more crop selectivity in this region, so that more profitable crops are usually grown. According to surveys, in normal harvest years, the yield of naked oats can reach 750−1500 kg per hectare, while that of corn can reach 15,000 kg after irrigation. In the vast arid and semi-arid regions of northwest China, irrigated farmland is the main source of grain production [4,5]. Therefore, developing irrigated cropland not only has a huge impact on agricultural production and product types, but also has a special impact on the economic benefits of farmers and the rural economy. Due to different crop types and crop management, the effects of irrigated and rainfed croplands on the ecological environment are quite different. Agricultural irrigation in arid and semi-arid regions consumes more than 50% of the total water supply [2,6] which exacerbates local water shortages, leads to a reduction in groundwater, and even affects the climate and ecological systems. In addition, the average amount of fertilizer applied to irrigated farmlands is about six times that of rainfed farmlands. The large amount of fertilizer applied with irrigation water increases the risk of agricultural non-point source pollution. Irrigation, especially flood and overirrigation, further aggravates the soil erosion of cultivated land [7,8]. Due to the difference in yields between irrigated and rainfed croplands, irrigation facilities have been widely built in this region to increase crop yields and thus improve the living standards of farmers. However, the region is water scarce and its Standardized Precipitation Evapotranspiration Index (SPEI) ranges between −2 and 0 [9,10,11]. Desertification and land degradation have been exacerbated by the fragile ecology because of the decline in groundwater level caused by excessive water use. The contradictions between increasing farmers’ income and lack of water resources, and between economic development and ecological environment, have caused great concern worldwide. Clarifying the quantity and spatial pattern of irrigated and rainfed croplands can provide data to balance the contradictions.
In addition to the sophisticated hydrothermal and soil conditions, the northern part of the Loess Plateau of China has a unique spatial pattern of agriculture. Irrigated drylands are found both on contiguous plains and on scattered terraces and slopes. A wide variety of crops are grown, including some intercropping types. Due to the small-scale farmer economy with the family as the basic unit and flexible crop cultivation practices, the spatial pattern of agriculture in the research area is variable rather than fixed. Therefore, the rapid and timely identification of changes in the irrigated drylands in the study area is considered as a great challenge and of great practical value for improving crop yields and protecting the environment. Previous studies include irrigated cropland distribution purely derived from remote sensing data, or by fusing remote sensing data and statistical data. The earliest large-scale distribution map of irrigated cropland was generated by spatialized statistical data. Such data always lacked real-time information and accurate spatial information. Some studies aimed to synthesize various data to obtain more accurate datasets [12,13,14], which showed higher consistency in large irrigated areas and lower consistency in small irrigated fields.
In recent years, supervised classification methods using machine learning techniques, such as random forest and decision tree, have been used to extract irrigated and rainfed croplands. Many of these studies have been conducted at a large scale and low spatial resolution. For example, GRIPC (global rainfed, irrigated, and paddy croplands) [15] used MODIS (Moderate Resolution Imaging Spectroradiometer) data with a spatial resolution of 500 m, the global database of Nagaraj et al. with a resolution of 9 km [16], and GMIA (Global Map of Irrigation Areas) with a resolution of 5 arcmin [17,18]. In addition, most of these researchers focused on irrigated croplands, including paddy fields, rather than irrigated drylands (not including paddy fields). Paddy fields are usually distributed in areas with sufficient water resources (southeast China). Irrigation poses relatively less threat to water resources, while irrigated drylands, especially in arid areas, pose a greater threat to the environment. Therefore, research on irrigated drylands has received more and more attention. Samasse et al. extracted irrigated croplands and rainfed croplands in parts of Africa at a resolution of 30 m [19]. Liu Liangyun developed a global land-use database with a resolution of 30 m, including irrigated croplands and non-irrigated croplands [20]. Although these studies have a higher spatial resolution than before, the samples were mainly selected from representative agricultural areas around the world. With a small number of samples of irrigated drylands, there were not enough studies on the irrigated and rainfed drylands in arid and semi-arid regions. It was also noted that Facundo Rojas [21] studied the spatial-temporal changes of irrigated drylands, but most of his study area was irrigated drylands. Moreover, there was no staggered distribution with rainfed drylands.
The above characteristics also appear in studies in China. They focus on the extraction of large-scale irrigated areas, rather than small irrigated fields. For example, Xiufang Zhu obtained the distribution accuracy of irrigated croplands in China in 2000, but the resolution was only 10 km and 1 km [22]. Afterwards, Dong Tingting, Liu Yizhu and Kunlun Xiang did this work using MODIS, and increased the resolution to 250 m, which was still insufficient [1,23,24]. In Kunlun Xiang’s research on irrigated farmlands in northeast China, irrigation was determined by comparing the surface humidity between farmlands and the surrounding forest. However, this study also focused on paddy fields. Irrigated drylands do not have such distinct characteristics, and there are not enough forests in the northwest for comparison [25]. There are some data regarding the distribution of irrigated croplands in existing studies, but they cannot achieve high agreement, especially in west China [13]. It was difficult to obtain data with high accuracy and reliability in west China, because current research generally focuses on typical irrigated areas, such as the North China Plain and Sichuan Basin. Although they are nationwide studies, less attention is paid to the arid and semi-arid regions. As a result, these regions lack reliable and detailed data. Irrigated drylands have received attention in some parts of China, but they always have limitations. Some scholars have studied extraction methods using relatively high value durations of NDVI and NDWI and spatial-temporal changes of irrigated and rainfed drylands in Zhangjiakou, but the method had limitations and cannot be directly used elsewhere because it only considered the local environment [26].
For the studies of land cover and changes, the overlay analysis of multi-period status quo is mostly adopted. This method is simple and easy to use, but it may accumulate errors in the status quo extracted from two periods. Due to the infeasibility of sampling in the field and inaccurate memory in questionnaires, the lack of samples can lead to more errors in historical years. For arid and semi-arid regions in northwest China, the classification accuracies of irrigated and rainfed drylands are not as high as those in large irrigated areas. The fragmentation and staggered distribution of irrigated and rainfed drylands increased the difficulty of classification. Moreover, the characteristics of remote sensing factors of irrigated drylands are not as obvious as those of paddy fields. Therefore, the overlay analysis of two periods would bring more errors. So, the change types of irrigated and rainfed drylands need to be studied further, including lands with no change, non-cultivated lands converted to irrigated drylands, non-cultivated lands converted to rainfed drylands, irrigated drylands converted to rainfed drylands, rainfed drylands converted to non-cultivated lands, irrigated drylands converted to non-cultivated lands and rainfed drylands converted to irrigated drylands.
There is no specific research on the distribution of irrigated and rainfed drylands in the arid and semi-arid regions of northwest China. At present, existing databases including this region always fail to extract small patches of irrigated dryland effectively. However, there are lots of irrigated drylands of a small size because of the terrain and small-scale family farming, resulting in irrigated drylands being reflected insufficiently on maps [15]. Moreover, there are few targeted studies on the spatial-temporal changes of irrigated drylands in this area. However, irrigated drylands and their changes cannot be ignored for the local food production and ecological environment. This paper aims to study a classification method and a change detection method for irrigated and rainfed drylands suitable for arid and semi-arid regions. The one-harvest area in the northern part of the Loess Plateau was selected as the study area, and the GEE platform was used to implement the research. Irrigated drylands were separated from rainfed drylands in 2015 by using the multi–Temporal data of Landsat with a resolution of 30 meters, combined with precipitation and temperature data during the growing season. Based on the differences between the data of 2005 and 2015, and combined with the classifications in 2005 and 2015, change types can be classified regarding temporal and spatial differences. This paper can provide inspiration for the classification and change detection of irrigated and rainfed drylands in similar areas. The distribution pattern and changes of irrigated drylands in the one-harvest area of the northern Loess Plateau of China are provided, which can support irrigation policies, water conservancy projects and agricultural policies in this region.

2. Study Area and Data

2.1. Study Area

In this paper, the northern part of the Loess Plateau of China was selected as the study area (Figure 1), including the south of Bayannur and Baotou, Hohhot and Ordos in Inner Mongolia, Shuozhou, Xinzhou, Luliang and Taiyuan in Shanxi Province, and Yulin in Shaanxi Province. Located in the transition zone from farming to grazing and from semi-arid to arid, this area presents a rich variety of land cover types (e.g., grassland, desert, farmland, forest and bare soil) [27]. The topography of the northern Loess Plateau is also quite complex, with the elevations ranging from 800 to 1200 m. In particular, the mountains (e.g., Taihang Mountains, Yin Mountains and Lvliang Mountains), rivers (e.g., Fen River, Hutuo River, Sanggan River and Heihe River) and basins (e.g., Taiyuan Basin, Xinding Basin and Datong Basin) synergize to form a unique spatial pattern of agriculture. The growing season starts in mid-April and ends in mid-October, with only one harvest [28]. A variety of crops are grown, including corn, wheat, potatoes, naked oats, flax, millet, sorghum, buckwheat, rice, various beans and forage grass. Moreover, there are some intercropping types such as apricot trees, other fruit trees, walnuts or jujubes mixed with food or vegetable crops. There is a relatively low annual precipitation of 150–500 mm on average. In response to the lack of water resources, irrigation has become one of the vital auxiliary means for farming. The irrigated drylands in this region are distributed over continuous plains and scattered terraces and slopes. Spatially, the northwest of the study area generally has lower precipitation compared to the southeast, and is therefore accompanied by more irrigated drylands due to the greater need for water replenishment [29,30,31]. Along with the population growth and economic development in the study area in recent years, the issue of increasing food production and security here has attracted widespread attention. In addition to natural rivers and lakes, the groundwater has also been inevitably pumped away for irrigating crops, which leads to the over-exploitation of groundwater, and seriously threatens the local ecological balance. Subsequently, the conflict between supply and demand of water resources has further intensified. In addition, the soil structure of the Loess Plateau is too loose to resist frequent irrigation. Therefore, soil erosion is becoming a potential crisis in the study area [32].

2.2. Data Introduction

The Google Earth Engine (GEE) platform was used in this study because of its rich data, diverse algorithms and strong calculation capacity. With long time series and mid- to high-resolution data available on GEE, its fast calculation capacity can help us obtain results in a short time frame.
Landsat imagery is the primary dataset used in this study. In the arid and semi-arid region of northwest China, irrigated and rainfed drylands are interlaced. Considering the growth rate of local crops and small plots of cultivated land in irrigated drylands, Landsat images with a temporal resolution of half a month and a geographical resolution of 30 m were selected as the major datasets. Landsat 8-Day NDVI Composite (LC8_L1T_8DAY_NDVI of GEE) and Landsat 8-Day NDWI Composite (LC8_L1T_8DAY_NDWI of GEE) were used [33]. In this paper, these data were synthesized into a semimonthly period. The first half of a month was marked as –1 and the second half of a month was marked as −2, e.g., 5−2 means the second half of May. In order to reduce the effect of data quality (cloud occlusion, etc.), the data of 2015 were synthesized by the same phase images of 2014, 2015 and 2016 according to cloud amount. The data of 2005 were synthesized from images of 2004, 2005 and 2006 of Landsat 5 TM 8-Day NDVI Composite (LT5_L1T_8DAY_NDVI of GEE) and NDWI Composite (LT5_L1T_8DAY_NDWI of GEE) by using the same method of 2015. These databases have been calibrated radiometrically, and they can provide comparable NDVI and NDWI [33]. Finally, the semi-monthly NDVI and NDWI data of the growing season (May–September) were formed.
The formulas of NDVI and NDWI are as follows [34,35]:
NDVI = ϱ N I R ϱ R E D / ϱ N I R + ϱ R E D
NDWI = ϱ N I R ϱ S W I R / ϱ N I R + ϱ S W I R .  
where ϱ N I R is the surface reflectance of near infrared band; ϱ R E D is the surface reflectance of red band; and ϱ S W I R is the surface reflectance of short-wave infrared band.
The MYD11A1 V6 product was used. It provides the daily land surface temperature (LST) within the kilometer grid. The temperature value was derived from the MOD11_L2 swath product [36]. The PERSIANN-CDR was used too [37,38]. It is a daily quasi-global precipitation product that spans the period from 1 January 1983, to the present. The data have good temporal resolution and high space resolution sufficient to represent the spatial differences in temperature [36] and precipitation [37,38].
Land cover data were the basis of this study, and irrigated and rainfed drylands were further extracted from the farmland category. The land cover data were extracted from the national land-use/cover database of China (hereinafter referred to as NLUD-C) at 1:100,000 scale that contains Chinese land-use/cover data of six periods (the 1980s, 1995, 2000, 2005, 2010 and 2015). It was visually interpreted from Landsat data by Chinese Academy of Sciences, and the accuracy was above 95% [39].
The proportions of irrigated and rainfed drylands in each region (county and city) were calculated by using the area of cultivated land, irrigated dryland, rainfed dryland, paddy field and the area of effective irrigated cropland (the area of effective irrigated cropland is the sum of the area of paddy field and irrigated dryland) in the statistical yearbook of each region [40,41,42,43,44,45,46,47,48,49]. These data were used to help select samples and verify the classification results.
Samples (Figure 1) in 2015 were obtained through field surveys, questionnaires, and visual interpretations using Google Earth images. The questionnaire survey included locations, proportion of irrigated drylands and frequency of irrigation. The texture features and location distribution of samples from field and questionnaire surveys were analyzed to help obtain more samples through visual interpretation from Google Images. Other samples were selected according to the proportion of irrigated or rainfed drylands in the statistical data. For example, if irrigated or rainfed drylands accounted for more than 95% in an administrative unit, characteristics of the main cropland in the region were determined as irrigated or rainfed drylands combined with Google Images.
In order to improve the evaluation of methods and avoid imbalances in the number of category validations, the number of validation samples was increased, especially in irrigated drylands. In 2015, a total of 77 irrigated drylands and 212 rainfed drylands samples were obtained for training, and 180 irrigated drylands and 278 rainfed drylands samples were obtained for verification. However, the sample of 2005 could not be obtained from the field survey and questionnaire survey, and only a small number of historical images are available on Google Earth. Therefore, it was largely be obtained through statistical data from areas with relatively homogeneous types of cultivated land. In 2005, 91 irrigated drylands and 128 rainfed drylands were selected as training samples. The validation samples included 109 irrigated drylands and 103 rainfed drylands. Among them, 44 and 67 samples of irrigated drylands and rainfed drylands did not change, respectively, which were mainly used to determine the floating range of NDVI and NDWI from 2005 to 2015, and 113 samples with changes were used to verify the accuracy of the classification of change types.

3. Methodology

In this study, irrigated and rainfed drylands were further extracted from the farmlands. Dryland areas were clipped from land cover data in 2015 and 2005, respectively.

3.1. Classification Method of Status

3.1.1. Feature Selection

The diverse environments within the study area had a great impact on the effectiveness of irrigation. For example, water available for vegetation growth of irrigated drylands in arid areas may not be better than rainfed drylands in relatively humid areas. In warmer areas, vegetation may not grow well because of intensified drought. In various studies, remote sensing factors and environmental factors are used to differentiate between irrigated and rainfed farmlands. Salmon et al. used remote sensing, climate and agricultural data to generate global maps of irrigation, rainfed and paddy fields through supervised classification. [15]. Nagaraj et al. [16] applied artificial intelligence methods to produce global irrigated areas using remote sensing and monthly climate data from 2001 to 2015. Although the study area in this paper was not as large as the above study, this study also combined the remote sensing and environmental factors as classification features because of the complexity of terrain, diversity of environment, and variety of irrigated dryland types.

Features by Remote Sensing

Because water is the greatest restraint for the growth of crops in the arid and semi-arid regions of Northwest China, the difference in soil water content is largely reflected by the growth of vegetation [50]. Therefore, vegetation growth rather than soil moisture (which is blocked by vegetation and changes too quickly to be captured by remote sensing) was chosen to differentiate irrigation. NDVI is regarded as the most common and stable index of vegetation growth, and NDWI is the water index that best reflects vegetation water content [34]. When the vegetation canopy is under water stress, NDWI can respond in time, which is of great significance in drought monitoring [35,51]. Therefore, these two factors were used as remote sensing factors.

Environmental Factors
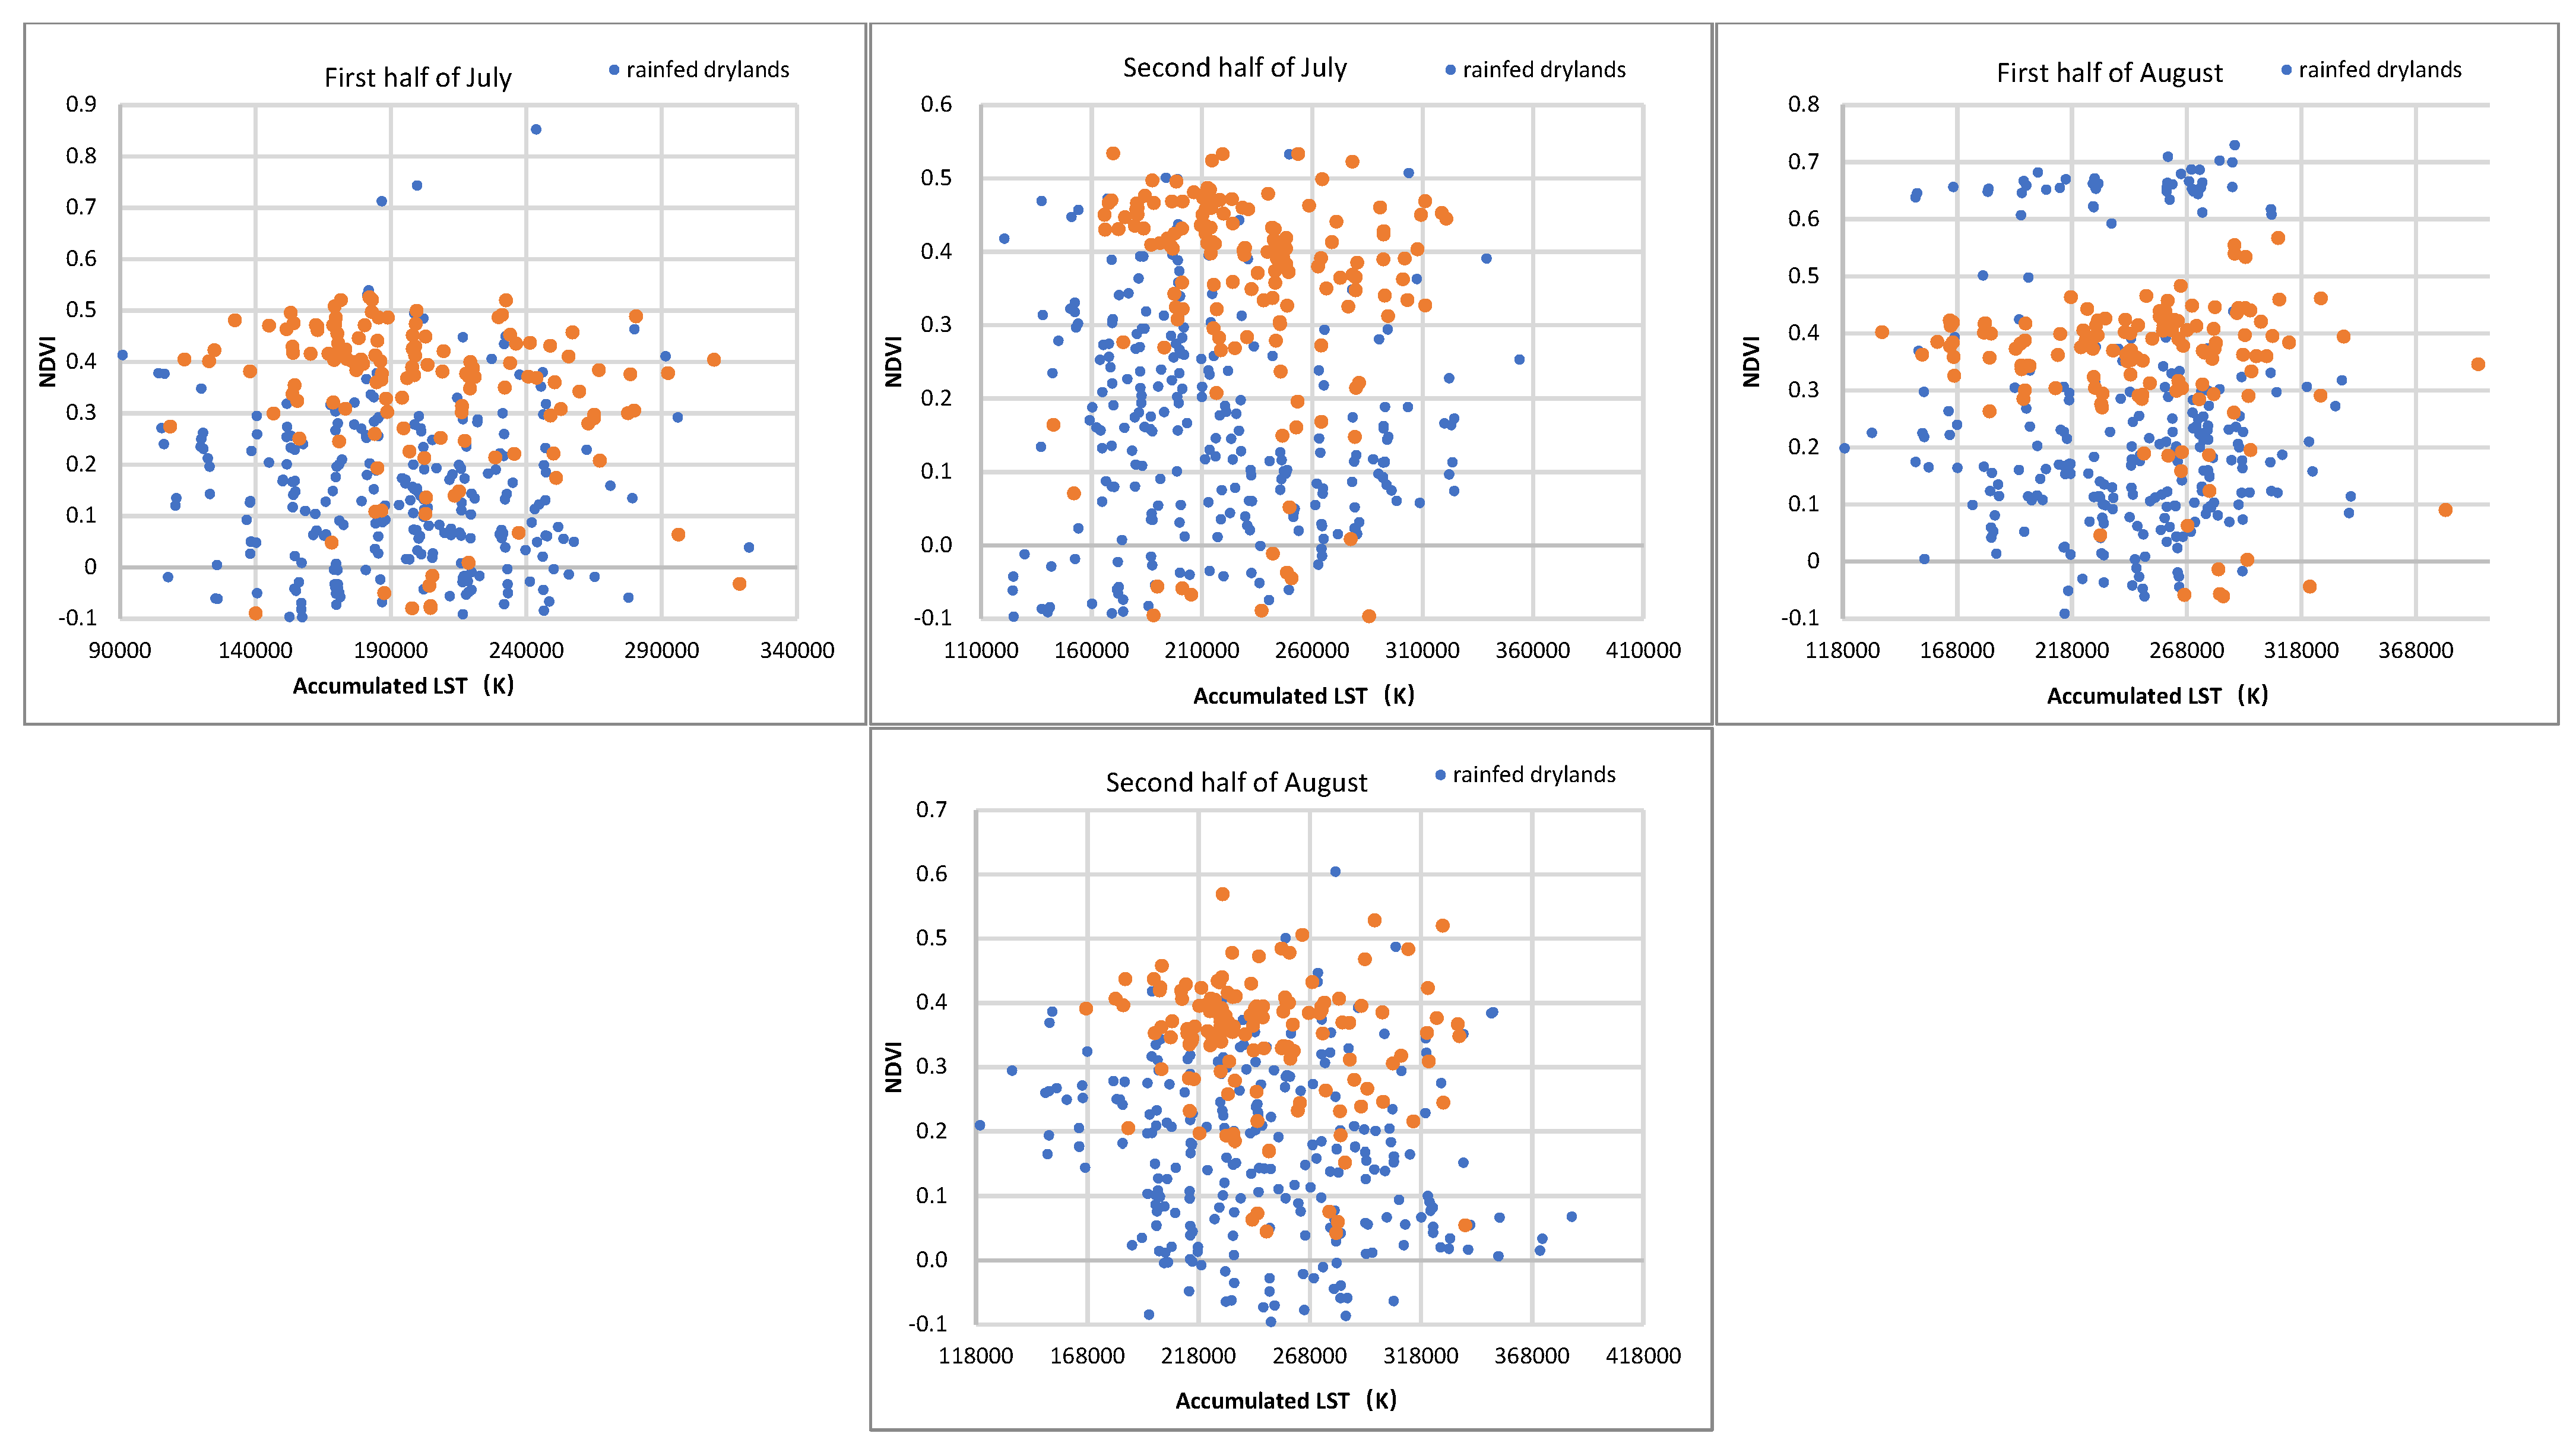
NDVI and NDWI can reflect the moisture status of vegetation, but cannot identify the contribution from precipitation or irrigation, especially in areas with large differences in precipitation. Therefore, precipitation is used as a classification factor to reduce the error caused by different precipitation. NDVI and NDWI of rainfed drylands may be positively correlated with precipitation because they are fully dependent on precipitation. However, this relationship is not obvious for irrigated drylands. Case studies have shown that EVI anomalies, which can be obtained from two steps—first, subtracting the seasonal cycle and then the long-term trend from the raw time series of EVI [52]—are significantly correlated with drought anomalies in arid and semi-arid rainfed drylands. Irrigation can well alleviate the adverse impact of drought on irrigated drylands [52,53]. The contribution of unit precipitation to NDVI is reflected by the ratio of NDVI and NDWI to precipitation. On the one hand, the NDVI of rainfed drylands is relatively low due to the stress of water scarcity, so the ratio of NDVI to precipitation is lower. On the other hand, according to the existing studies, irrigated drylands have higher utilization efficiency of precipitation than rainfed drylands, because irrigated drylands are largely more intensively cultivated and more fertilized. Therefore, the soil comprehensive situation of water, fertilizer, and dissolved oxygen and heat in irrigated drylands is better than that of rainfed drylands [54,55]. Dengke et al (2015) [56] conducted a detailed study on the water-use efficiency (WUE) of crops in rainfed drylands in north China. The results showed that intensive tillage could significantly improve crop growth and WUE, and the crop yield and WUE were significantly improved after irrigation compared with no irrigation [56]. Therefore, the ratio of NDVI and NDWI to precipitation can distinguish irrigated drylands from rainfed drylands.
Similarly, the higher the temperature, the stronger the evaporation, and the water content of soil and vegetation will be affected [57]. Under drought stress in rainfed drylands, the higher the temperature, the lower the water content, and the worse the vegetation growth [58]. In contrast, in irrigated drylands without drought stress, this relationship is not obvious, and generally in this area the higher the temperature the better the growth, due to better heat. Therefore, NDVI and NDWI may be negatively correlated with temperature, and the ratio of NDVI and NDWI to temperature is used to differentiate irrigated drylands with rainfed drylands. In total, the scatter plots of NDVI, NDWI, temperature and precipitation were analyzed. For precipitation and temperature, we used four pieces of data, including the cumulant of 15 days before imaging, the cumulant of the 30 days before imaging, the cumulant of 60 days before imaging, and the cumulant from 15 April (sowing time) to the imaging day, for classification.
The analysis showed that the NDVI and NDWI of irrigated drylands and rainfed drylands have a different relationship with precipitation and temperature. In addition, the scatter strongly confirmed the positive correlation between precipitation and NDVI and NDWI. The slope of each linear equation represented in a scatterplot regarding precipitation was positive. In contrast, temperature was negatively correlated with NDVI and NDWI, and the slope of each linear equation represented in the scatterplot regarding precipitation was negative.

Critical Phases

In July and August, the heat conditions are the best and the crops grow fastest. Most crops reach maturity and peak NDVI in August. In July and August, prolonged drought stress has a concentrated effect on the vegetation growth and water content. Some crops enter the harvest stage in September, and the NDVI and NDWI of crops exhibit downward trends at that point. Moreover, according to the scatterplots (Figure 2), irrigated drylands and rainfed drylands have a good distinction from the second half of June to the second half of August, while the relationship is not obvious in other periods. In order to select the critical classification phases, the data combinations of different phases were classified and compared. For comparative analysis, they were classified and validated using the same samples and methods.

3.1.2. Classifier

We used random forest as classifier, which is a type of machine learning. Machine learning is a very common and effective classification method, and random forest is widely used in land cover classification and irrigated cropland identification [59]. Random forest is a combination of tree-like predictors. Each tree depends on the value of a random vector sampled independently, and all trees in the forest have the same distribution [60]. Random forest can improve the prediction accuracy without significantly increasing the computation time. The results are robust to missing and unbalanced data, and can well predict the effects of many explanatory variables [60]. Random forest can explain the contribution of each classification factor, which also helps us to refine the feature factors and optimize classification methods. We chose the ee.Classifier.SmileRandomForest algorithm of the GEE platform and set the parameter to 10 trees according to the experiments in this study, because it shows that 10, 20 and 30 trees have a similar effect on the results, respectively.
In the Importance of Features Table (Table 1) from the explanation of the classifier, each feature had periods of relatively high importance. Moreover, each period had features of relatively high importance. There was no obvious characteristic or rule. Therefore, it is considered that the features and phases selected in classification were all important.

3.2. Change Types Detection Method

The normal approach to obtain the spatiotemporal dynamics of land-use types is to perform overlay analysis. However, errors of the classification results of different years would be accumulated inevitably, resulting in large errors in the dynamics. In order to reduce such errors, the changes of NDVI and NDWI were classified firstly, and then the classification results of 2015 and 2005 were combined to obtain different types of change, containing no change, non-cultivated lands to irrigated drylands, non-cultivated lands to rainfed drylands, irrigated drylands to rainfed drylands, rainfed drylands to non-cultivated lands, irrigated drylands to non-cultivated lands and rainfed drylands to irrigated drylands. Specific steps are as follows.
Step 1. The classification of 2015 was used as the benchmark. The period of 2015 was considered the best, because the data were the most complete and the sample number was the largest;
Step 2. The mean values of NDVI and NDWI for each half month in 2015 were subtracted from those in 2005 to obtain the gaps between the two periods;
Step 3. The floating range of NDVI and NDWI in the unchanged area was obtained by the statistical analysis of the unchanged samples;
Step 4. The types of change were classified according to the gaps between the two periods.
The cumulative percentage of 10% (−0.1506302761, −0.08358755315) and 90% (0.1307265038, 0.06453476669) of NDVI and NDWI were taken as confidence regions and taken as normal floating regions, respectively (Figure 3), while the gaps of the two indexes between 2005 and 2015 in the confidence regions were considered unchanged.
The rest were classified as follows:
If the gaps of the two indicators were both positive, it was considered that the moisture situation had become better. Therefore, if the pixels were rainfed drylands in 2015, the year 2005 must be rainfed drylands. If the pixels were irrigated drylands in 2015, they would be judged by the classification of 2005.
If the gaps of the two indicators were both negative, it was considered that the moisture situation had become worse. Therefore, if the pixels were irrigated drylands in 2015, then they must be irrigated drylands in the year 2005. If the pixels were rainfed drylands in 2015, they would be judged by the classification of 2005.
If the gaps of the NDVI and NDWI were one positive and one negative, this could not be identified from the time axis. Then, they would be judged by the classification of 2005.

3.3. Verification Method

In this study, three methods were used to verify the precision of the extracted irrigated drylands. Firstly, the results were verified by using a confusion matrix of the verification samples. Secondly, they were verified by statistical data. We used the proportion of the area of the county-level irrigated drylands to compare with the results. They were also evaluated by STDEV (standard deviation), R2 (coefficient of determination) and RMSE (root mean squared error). Thirdly, they were compared with existing research results.

4. Results

The random forest classification experiments of 10 trees were carried out by combining the following remote sensing data, environmental data and phases. Confusion matrix verification, statistical data comparison and comparison with existing results were used for validation.

4.1. Verification of Status Classification Results

4.1.1. Confusion Matrix Verification

Table 2 shows that a good result could be obtained by using only NDVI and NDWI of the whole growing season (10 periods) in the above classification. The overall accuracy and Kappa coefficient were 0.824 and 0.632, respectively. When temperature and precipitation were added, the accuracy reached 0.857 and 0.697, respectively. The best results appeared in the cumulative values of temperature and LST of the 30 days before imaging. Therefore, this parameter will be used in next experiments. In the classification of each critical period, experiments were conducted mainly for the characteristic period from June to August selected in Figure 2. The overall accuracy was 0.847 and the Kappa coefficient was 0.684, which was close to the classification accuracy of the whole growing season. Then, data of June, July and August were used for classification separately. It can be seen that July and August had higher accuracy and were the most discriminative characteristic periods. Therefore, the overall accuracy and Kappa coefficient were higher using data from four periods in July and August and data of 7–2 and 8–1 (two periods), reaching 0.851, 0.687 and 0.860, 0.710, respectively.
In comparison, all the classification methods with temperature and precipitation were more accurate than those without temperature and precipitation. The overall accuracy was increased by 4.03% on average, while the Kappa coefficient was increased by 8.54% on average, indicating that the classification accuracy of irrigated drylands was improved after adding environmental factors. Moreover, the accuracies of irrigated drylands and rainfed drylands also led to a significant increase in Kappa coefficient.
In general, the three classification methods using the ratio of NDVI and NDWI to temperature and precipitation from 6–2 to 8–1, 7–1 to 8–2 (4 phases) and 7–2 to 8–1 (2 phases) were better, and the classification accuracies were close to that of the whole growing season. The classification accuracies of using only NDVI and NDWI in critical phases were worse than that of the whole growing season. It can be seen that adding precipitation and temperature can be used for several phases and still maintain a good classification result.

4.1.2. Comparison of Classification Results and Statistical Data

The results of 6, 8 and 16 classifications with high accuracy in the confusion matrix were compared with the statistical results in Figure 4. The proportions of irrigated drylands in non-paddy fields in the counties of Bayannaoer in Inner Mongolia, Xinzhou in Shanxi Province, and Yulin in Shaanxi Province were selected for comparison. Bayannur, located in the northwest of the study area, is a typical Yellow River irrigation area, of which more than 97% is irrigated drylands. Xinzhou, located in the eastern part of the study area, has both small inter-mountain basins with irrigated drylands and rainfed drylands on the surrounding upland. Yulin, located in the southwest, has typical irrigated drylands developed on wind–sand beaches. The sources of statistical data were the Inner Mongolia Statistical Yearbook 2016, Yulin Statistical Yearbook 2017, and the third agricultural census (Shanxi Province) [40,41,45,46,47]. The year of data survey was 2015 or 2016.
From the perspective of districts and counties (Figure 4), the classifications of all three methods maintained high consistency with the statistical data, with the fitted R2 reaching 0.9 and the RMSE around 0.1. The proportion of misclassification compared with statistical data were mostly kept within 10%. However, it was noticed that a large gap of 30% occurred in Wutai and Yuyang.
For this reason, these two areas were specially analyzed. According to the classification results, the irrigated drylands in Wutai County are mainly distributed in Dongye Town, Taicheng Town and Doucun Town. There are low and flat river valleys areas, which are rare in Wutai County. Furthermore, it is confirmed by several documents that there are several irrigation projects in these small river valleys, including Xiaoyin River and Lvsi River irrigation areas [61,62,63,64]. In Yuyang District Statistical Yearbook (2017) [40], the area of arable land was 69, 540 hectares at the beginning of the year, and 85, 314 hectares at the end of the year. The gap reached 22.68%. Therefore, the results of these two counties were not considered for evaluation.
From the scale of prefecture-level cities, the misclassified area was 14.93% at most, which was Ordos City. On the whole, mountainous and desert areas are prone to misclassification, for example, Wutai County, located in the Wutai Mountains, and Ordos and Yulin located in Mu Us Desert. The complex topography of the mountainous areas and the more fragmented plots of cropland result in more mixed pixels. These cropland pixels mixed with forest or grassland are more difficult to identify. Here, the probability of misclassifying rainfed drylands as irrigated drylands is slightly higher. It is also partly due to the orchards. At the edge of the desert, on the one hand, irrigated drylands may be classified as rainfed drylands due to insufficient and unstable irrigation water sources, while some statistics classify the unguaranteed fields as irrigated drylands; on the other hand, changes in croplands are very common in the region, and some statistical data and literature data also vary greatly. Due to the inconsistency of the statistical standard, it is normal to have some discrepancies with statistical data. In general, the distribution trend of irrigated and rainfed drylands was consistent with the statistical data.

4.2. Verification of Change Classification

Firstly, 113 samples of change types and 109 samples of unchanged types were selected by reviewing literature information and interpreting change types with Google historical images. The accuracy rate of change types reached 77%, and that of unchanged types was 98.68%. The change types of 81 samples were correctly validated by direct superposition of the classification results, with an accuracy rate of 72% and 97.50%, respectively, for the change types and unchanged types. Secondly, the distribution of 2005 was directly classified, with an overall accuracy of 0.919 and Kappa coefficient of 0.817. The samples in 2005 could only be obtained from administrative units of relatively single types, and there was a lack of samples in areas with mixed distribution, so the validation accuracy obtained was higher than that of 2015. Then, according to the classification results in 2015 (Figure 5) and changes distribution map (Figure 6), the distribution map of irrigated and rainfed drylands in 2005 was deduced (Figure 7). The overall accuracy and Kappa coefficient of the derived results were 0.976 and 0.952, respectively. The accuracy and significance of change classification were verified by the accuracy difference. Obviously, the transfer information obtained through classifying the changes directly by combining the time and space difference was more accurate and could help to correct the classification of a single period.

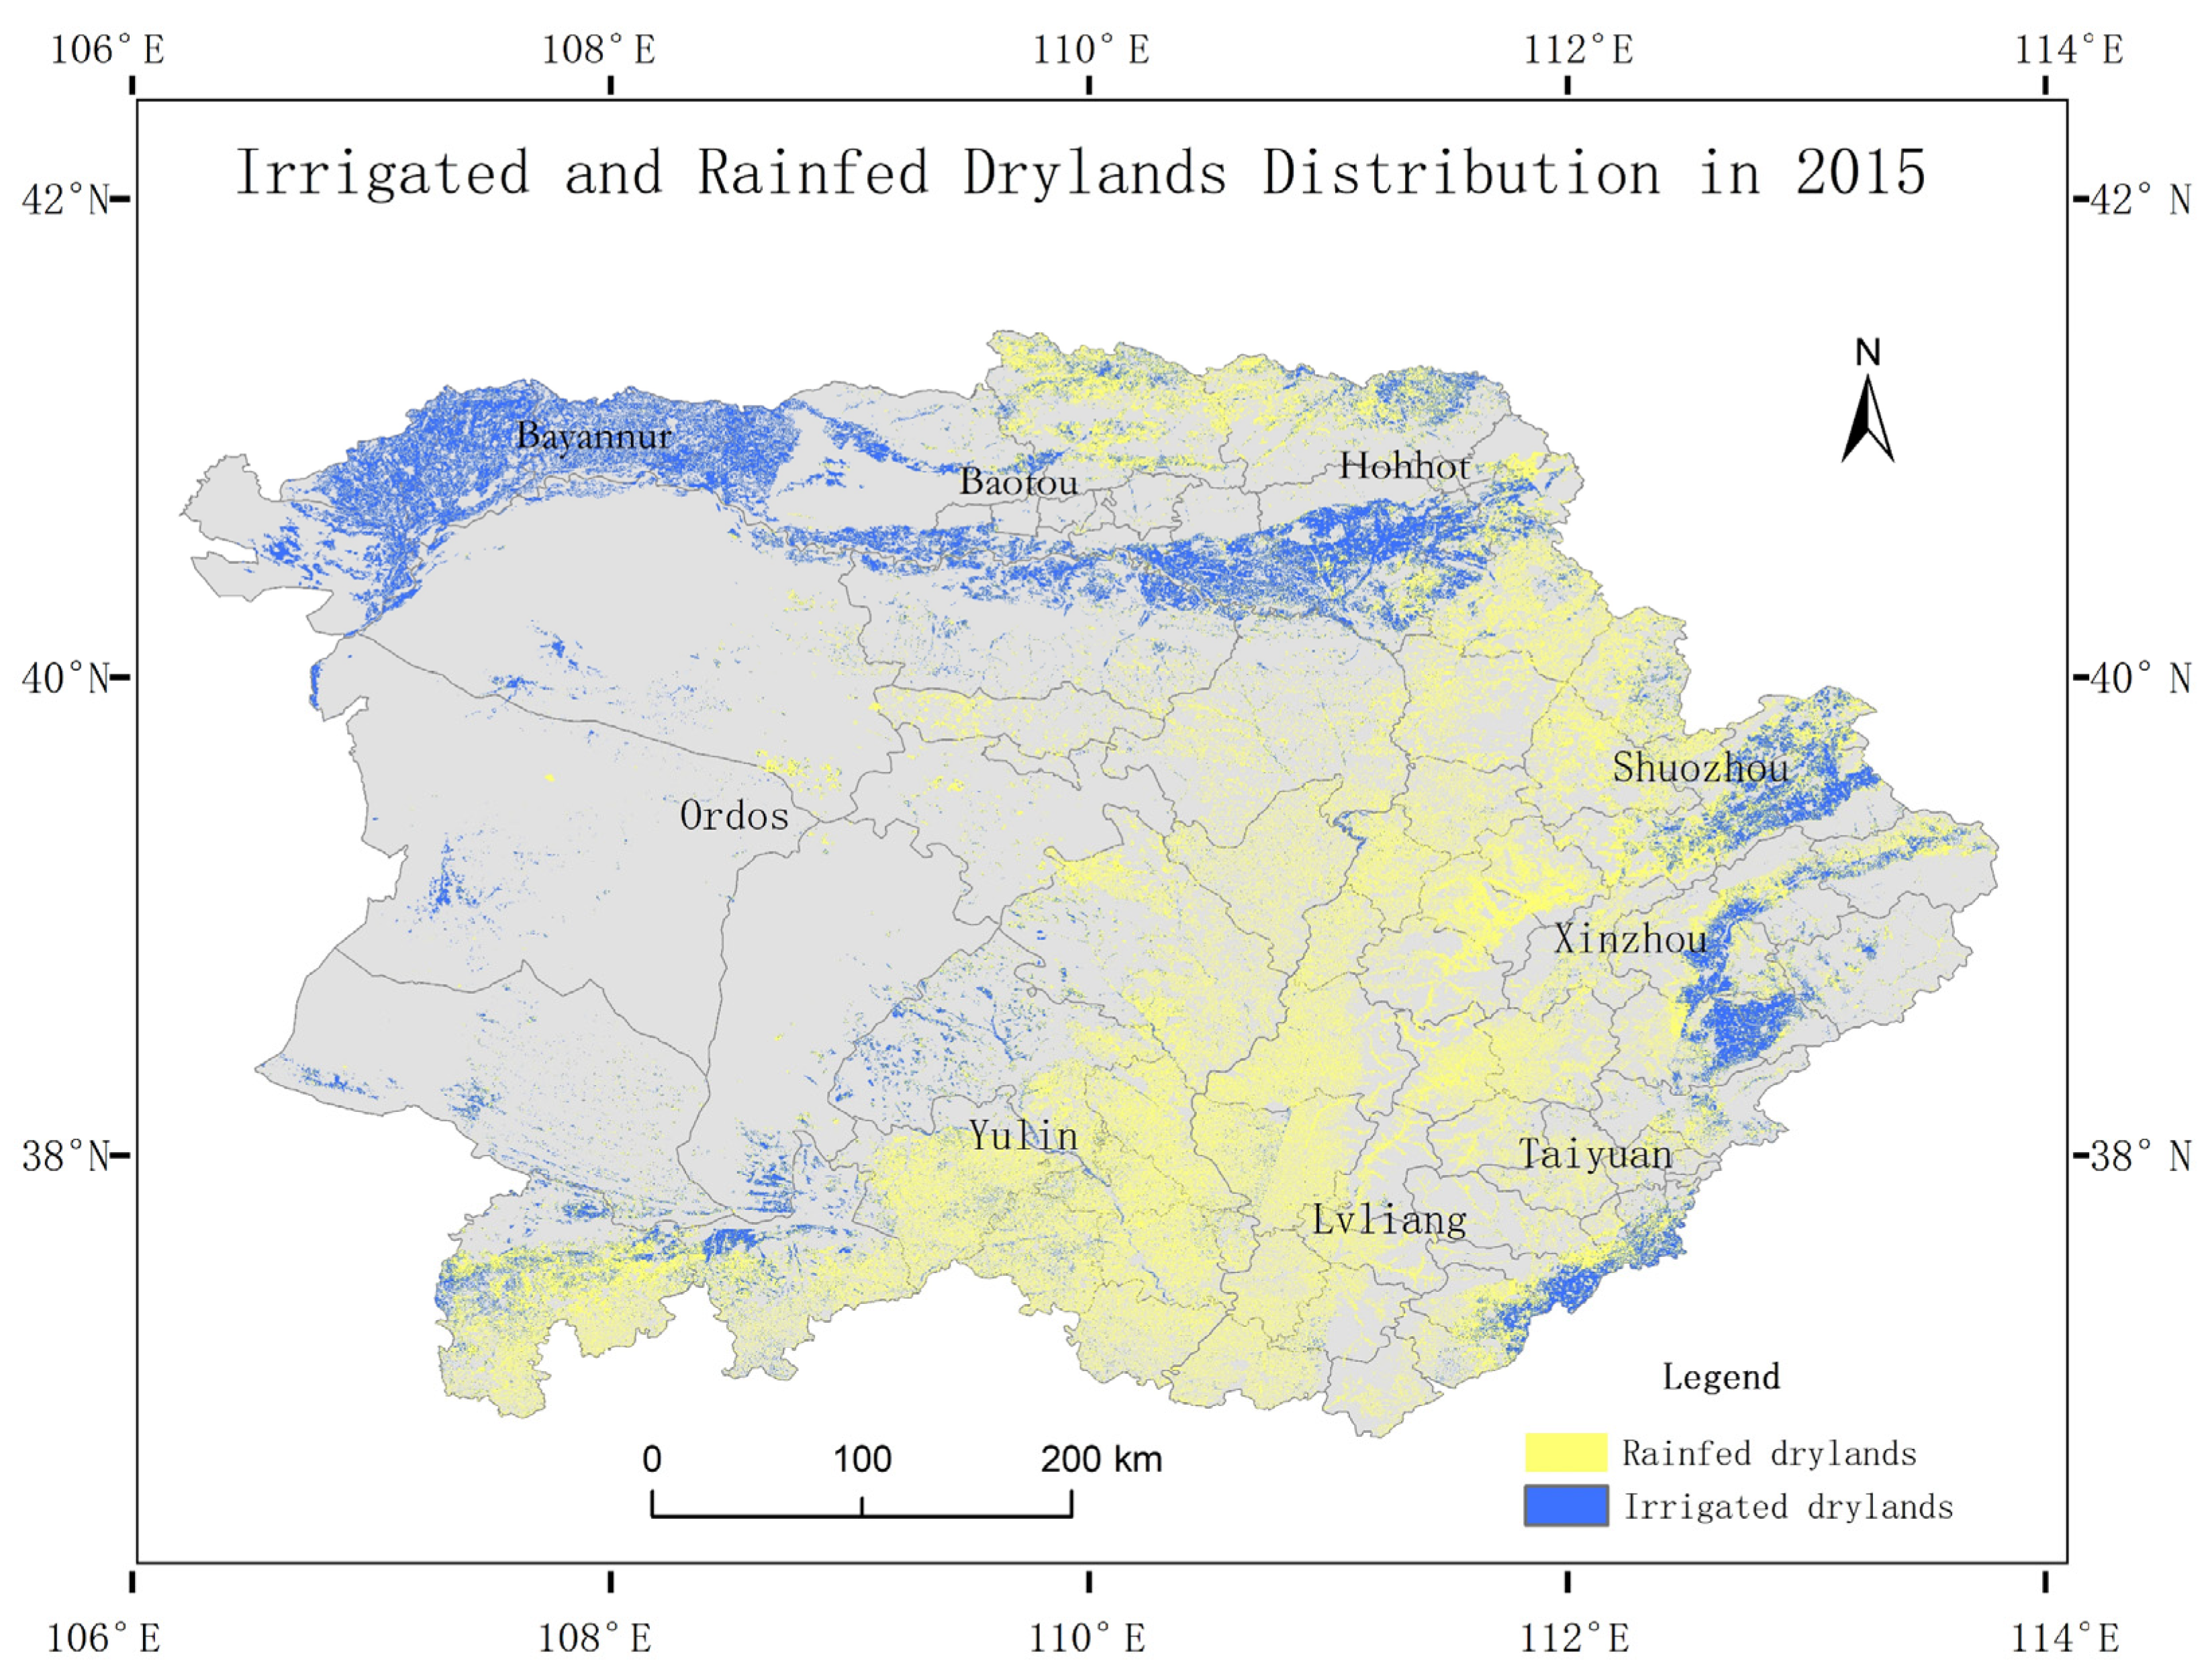
4.3. Distribution and Comparison with Existing Data

Compared with GMIA [18], the overall distribution trend of irrigated drylands was consistent. As can be seen from Figure 8 and Figure 5, irrigated drylands in the study area were mainly distributed in small plains with lower elevations, including Hetao Plain in the northwest, Tumochuan Plain in the north, as well as Datong Basin, Xinding Basin and Taiyuan Basin in the east. In the southern edge of Mu Us Desert in the west and south, there are less cultivated lands, but they are mainly irrigated drylands. The Loess hilly area in the middle is dominated by rainfed drylands, with only a small number of irrigated drylands found in valleys near rivers.
GMIA has few irrigated drylands in the southwest, few cultivated lands in some areas in the south, and a small number of irrigated drylands in the central and southern Lvliang Mountains. This is inconsistent with the results of this study. According to the results of this study, there is a small number of cultivated lands in the southern edge of the Mu Us Desert in the west and south, but irrigated drylands are dominant, with a small portion of rainfed drylands. The central Loess hilly region is dominated by rainfed drylands, with only a few irrigated drylands in river valleys, and a large number of cultivated lands in the mountainous areas of the southern Loess Plateau. However, because the cultivated lands in these areas are relatively fragmented, they cannot be reflected in the classification map with low spatial ratio.

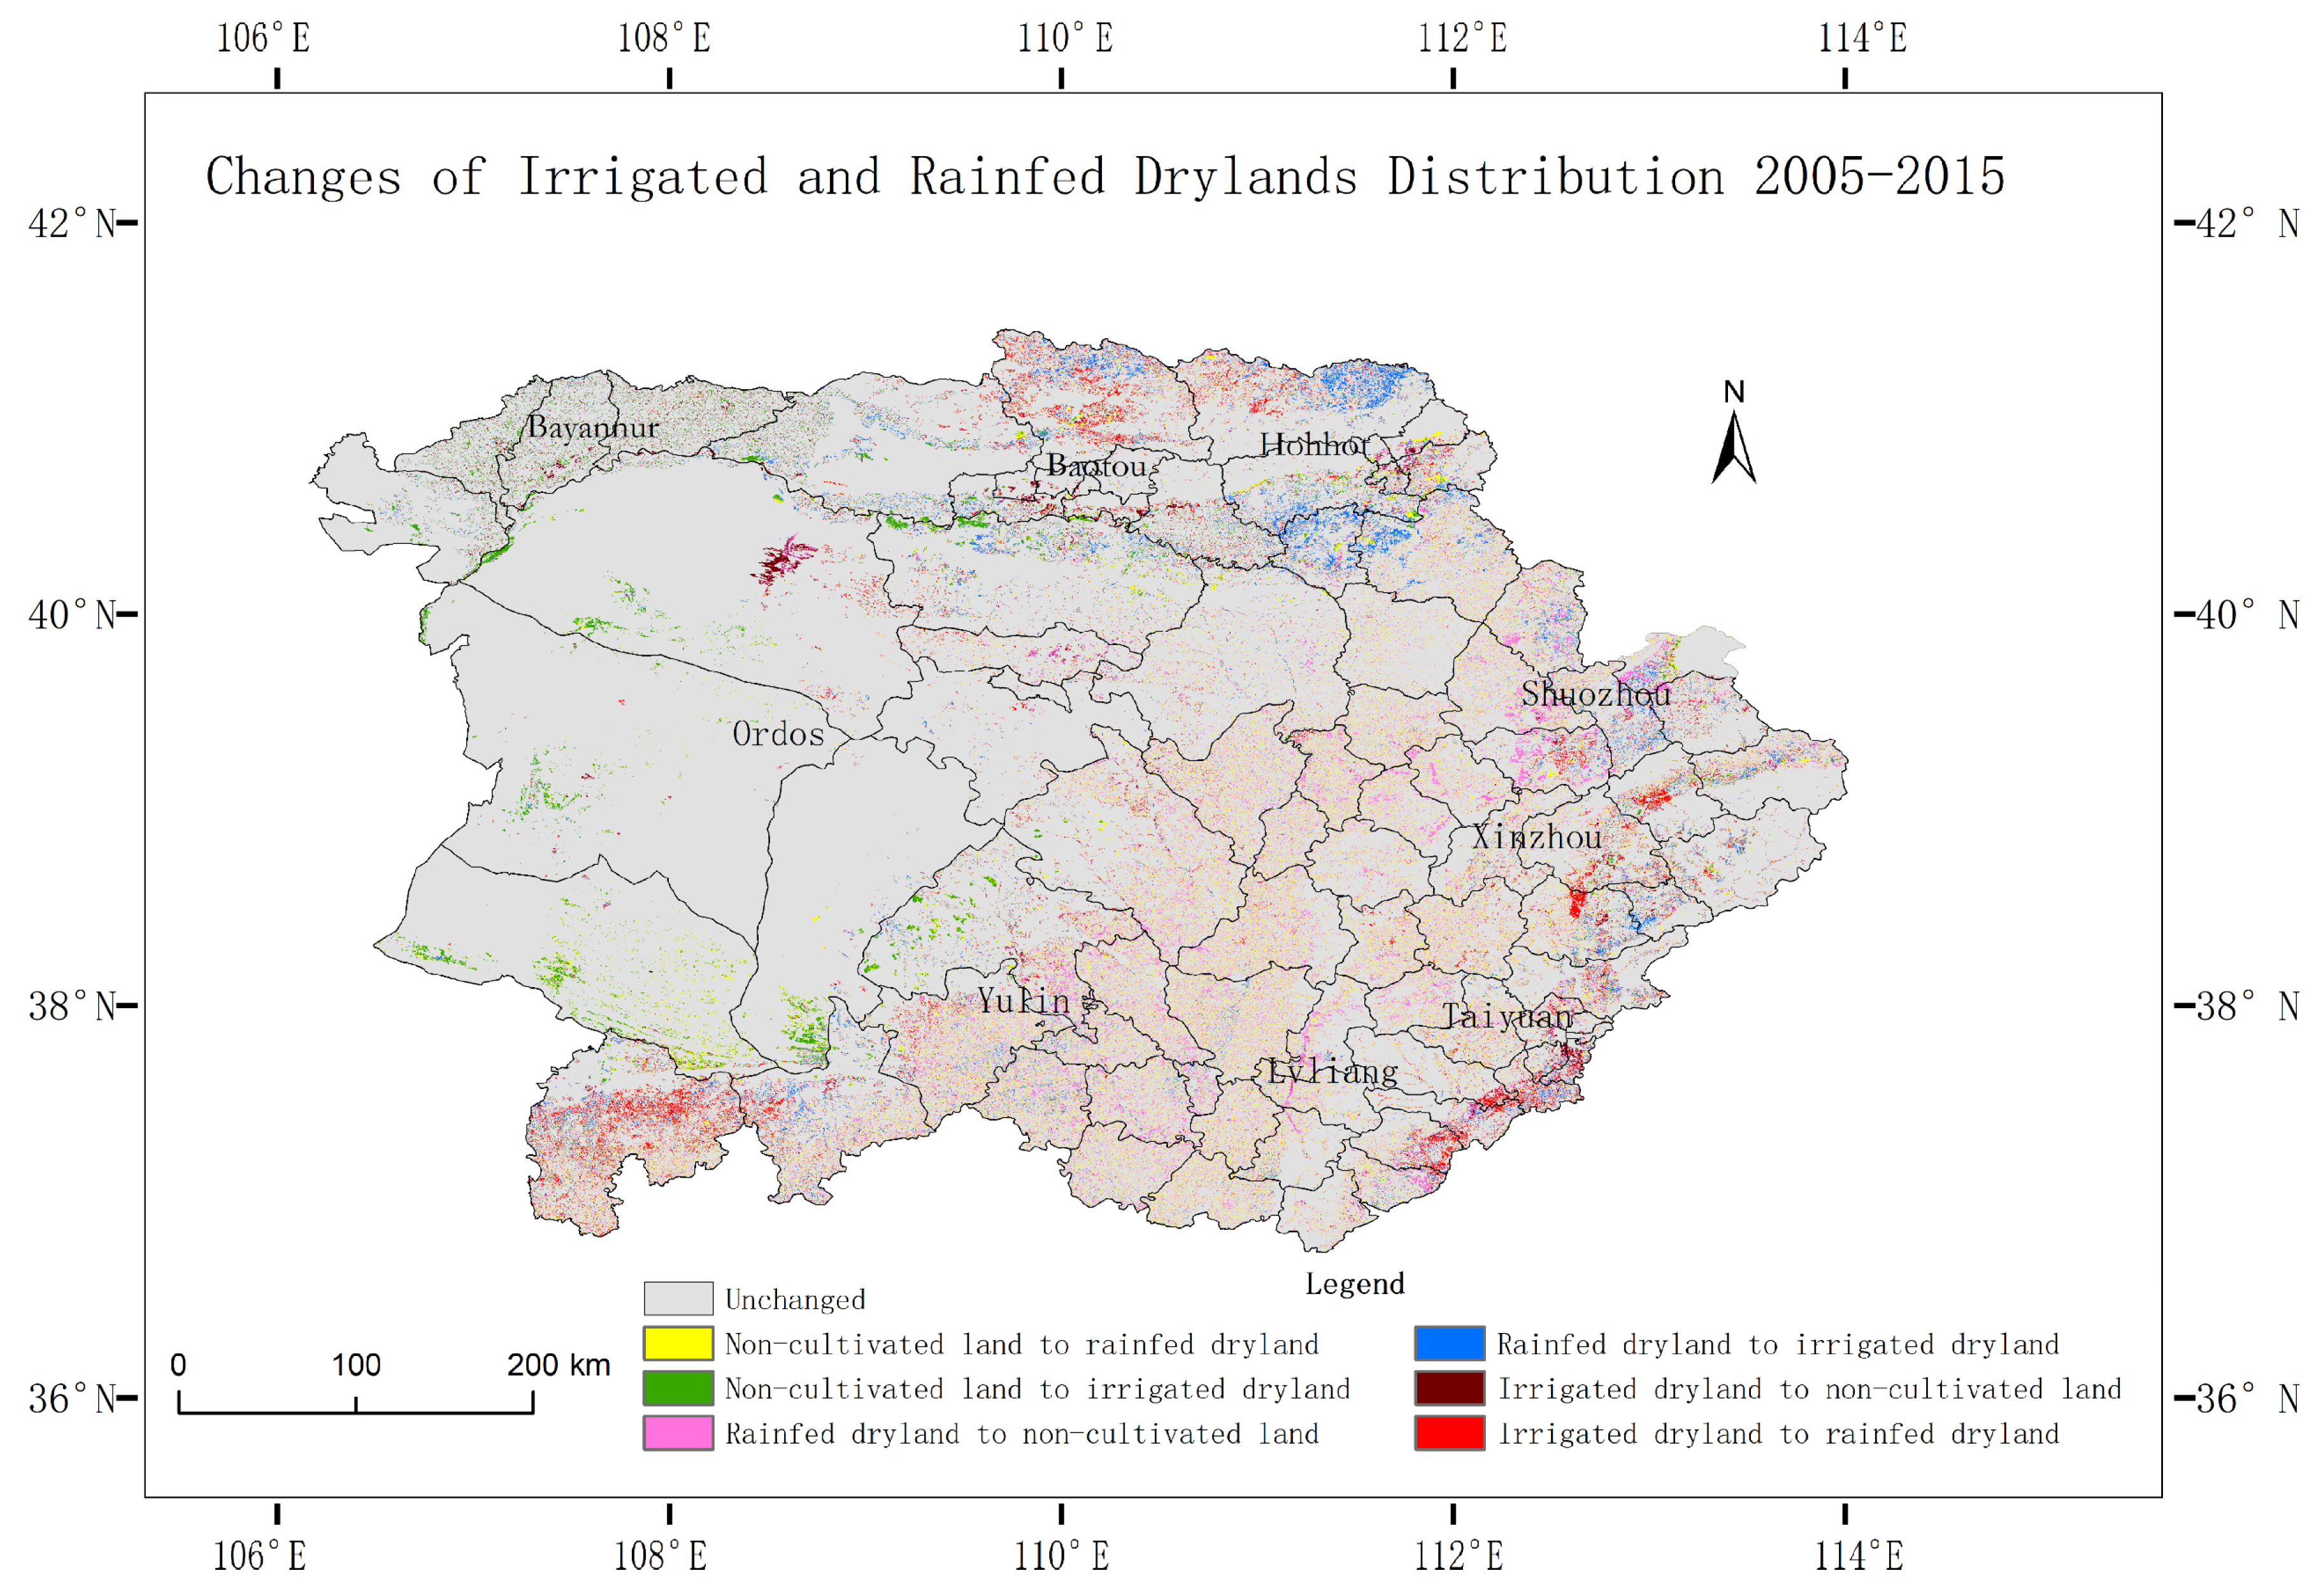
4.4. Changes Distribution of Irrigated and Rainfed Drylands

As Table 3 and Figure 7 show, the transformation of large areas of cultivated land into irrigated drylands occurs mainly in the west and northwest, such asOrdos (11,425.43 km2), and Bayannaoer (6127.62 km2), where some arable lands are reclaimed following the development of irrigation facilities. The transformation of irrigated drylands into non-arable lands is very rare, and is mainly concentrated in the northwest of the sandy beach, where arable lands have been abandoned because water sources cannot be guaranteed. The mutual transformation between rainfed drylands and non-arable lands occurs mainly in the mountainous areas in the central and southern parts of the study area, such as Yulin (29,332.19 km2) and Lvliang (15,607.43 km2), where farming is difficult and less profitable. Farmland is often abandoned, but not perpetually. When farmers are able to cultivate the lands or have no other source of income (e.g., go out to work in cities), they will cultivate them again. The transformation from irrigated into rainfed drylands occurs mainly in the east and southwest, such as in Yulin (11,748.95 km2) and Xinzhou (5032.12 km2). Some irrigated drylands can no longer be effectively irrigated due to the disrepair of the engineering facilities in the old irrigated areas, coupled with groundwater recession and increasing irrigation costs.

5. Discussion

5.1. Classification Method of Irrigated and Rainfed Drylands

This paper holds that NDWI and NDVI can reflect vegetation growth and vegetation moisture content intensively, and it is unnecessary to use other visible bands of Landsat images. Many of other studies have selected dozens of classification factors, including but not limited to various vegetation indices, such as EVI SVI, etc., [15] and visible bands. Samasse et al. [19] used six bands of surface reflectance and four vegetation indices. The inclusion of environmental factors can reduce, to a certain extent, the index differences caused by regional differences, so that regions with complex natural conditions can be classified using the same method. We only included the sum of precipitation and temperature of the 30 days before imaging. In other studies, precipitation, temperature and evapotranspiration were generally selected as environmental factors [15], as well as wind speed, atmospheric pressure, albedo, etc. For example, Nagaraj et al. selected 11 characteristic bands [16]. In our study, the most classic vegetation indices and the most basic environmental factors were chosen. The data were available on GEE. Different combinations of factors should be studied in the future. In terms of the relationship between remote sensing factors and environmental factors, only positive and negative correlation was reflected. In the future, more accurate numerical relationships should be studied.
In order to obtain the difference of time series curves between irrigated and rainfed drylands, series images with high temporal resolution (every half month during the growing season) were used. Reducing the number of features by selecting the data of critical phases not only reduced the difficulty of classification implementation, but also reduced information interference. For example, from May to June, there was no significant difference between these factors for irrigated drylands and rainfed drylands. From August to September, the characteristics of irrigated and rainfed drylands tended to be the same again. If they were all involved in the operation, the classification accuracy may be affected. Temporal resolution and critical phases should be singled out according to the research object. Therefore, it was confirmed that the characteristic period of growth in arid and semi-arid regions in northwest China is from June to August. In other studies, some used annual averages, and some used averages of dry and wet seasons. Compared to them, this paper has a higher temporal resolution and is more advantageous for capturing irrigated drylands with less distinct characteristics.

5.2. Classification Results of Irrigated and Rainfed Drylands

In this paper, the irrigated drylands in drylands were distinguished. In contrast to the extraction of irrigated croplands in other studies, there was no difference in crop types and no significant water characteristics between irrigated and rainfed drylands. In addition, this area was fragmented with small fields and more heterogeneous crops due to the topography and household management patterns, making it more difficult to be extracted than paddy fields or irrigated drylands in the plain region. The validation accuracy of the confusion matrix exceeded 85%, a higher level in this region compared with existing data.
Irrigated drylands in this region mainly included the following categories: cultivated lands located on the edge of the desert, those located on small flood plains, and around rivers. Classification effects of these typical irrigated drylands are shown in Figure 9, Figure 10 and Figure 11. Irrigated drylands located at the southeastern edge of Mu Us Sandy Land in the northwest of Yuyang District in Figure 9 show that the drylands equipped with circulating sprinkler irrigation can be obviously extracted, based on the data with 30 m spatial resolution. Its shapes were well extracted with reference to the high-resolution image from Google in 2015. Figure 10 shows the twisted Yellow River beach in Hequ County, Shanxi Province. Compared with Google’s 2015 HD image, the croplands on the river beach were completely classified as irrigated drylands, while those on the ridges, tablelands, and hills farther away from the Yellow River were classified as rainfed drylands. Figure 11 shows the Yangwu River alluvial fan belonging to the Hutuo River basin, which is the Yangwu river irrigation area in the Yuanping County of Xinzhou City. It is a large irrigated dryland area. The shape of the alluvial fan of the irrigated dryland could be completely extracted.

5.3. Classification of Change Types

In order to avoid the accumulation of classification errors, this study adopted the direct classification of the factor gaps between the two periods and considered the respective spatial clustering characteristics at the same time.
In this study, the difference between the mean values of NDVI and NDWI data of two periods were used for the classification of changes. The dynamic classification index was relatively single. The peak value or variance may also have had great classification significance, which could make the classification more accurate. Currently, sample-based supervised classification is still the main method for the classification of land cover and land use, but it is difficult to study long time series due to the difficulty of collecting historical samples. The gap-based detection is mainly used for quantitative analysis, while the transformation classification based on the time dimension information can assist in the status classification and improve the accuracy of a single period, especially in historical classification. In this study, the classification of 2005 was calibrated against the dynamic data after the direct classification. The distribution of 2005, the dynamic data and the distribution of 2015 could be combined to help with the classification. In other words, the classification in 2015 should also consider the dynamic information of the time dimension, not only with the help of the changes from 2005 to 2015, but also with the help of the changes from 2015 to 2020.

6. Conclusions

In this study, a method for extracting irrigated drylands based on the GEE platform and Landsat images was proposed. By selecting a one-harvest region in the northern Loess Plateau of China as the study area, the method was proven feasible for extracting irrigated drylands in arid and semi-arid regions. The method was easy to implement, because only four pieces of data, the NDVI, NDWI, temperature, and precipitation, were involved. In addition, a method was proposed to directly classify the types of changes in the two periods using the data gaps and then combining the results of each classification. The conclusions are as follows.
1. The classification accuracy can be effectively improved by using the ratio of NDVI and NDWI to the accumulative values of temperature and precipitation of the 30 days before imaging. The selection of data from the critical crop growing phases can ensure accuracy and greatly reduce the workload. In this study, data of the environmental factors were easily available, and the discriminative calculation relationship was obtained by studying the correlation between remote sensing factors and environmental factors. This provides inspiration for the classification of irrigated drylands in arid and semi-arid regions in northwest China and other regions. At the same time, research on the extraction method of irrigated drylands (no paddy fields), rather than irrigated croplands has been strengthened. While the former is uncommon, they are crucial in water-scarce areas where there are few paddy fields. In addition, this also provides references for land cover and land-use classifications in areas with complex natural environments.
2. In this paper, the classifications of the one-harvest region of the northern Loess Plateau of China complemented the current data, improved the accuracy of existing products in terms of spatial resolution, and provided a more detailed distribution of irrigated and rainfed drylands. This is very helpful for water resource management, ecological environment protection and local agricultural policy making. Compared with humid regions, the local ecological environment is more fragile, and the proportion of agriculture is larger in semi-arid areas, so the harmonious development of agriculture and ecological environment is particularly important. The distribution pattern of irrigated and rainfed drylands can be adjusted according to the development and changes in laws without reducing economic benefits.
3. Directly classifying the gaps of remote sensing factors in specific time dimensions and then combining these with spatial clustering information can lead to more accurate types of changes. Meanwhile, it can also avoid error accumulation in the change maps obtained by the overlaying analysis of two-phase distribution. The introduction of the dynamic information of time dimensions into the classification of historical periods can improve classification accuracy, and compensate for the problem of insufficient samples. This study provides a feasible method for detecting the changes in rainfed and irrigated drylands in arid and semi-arid regions. This method can also be used to study temporal and spatial changes in land use and land cover.

Author Contributions

Conceptualization, L.Z.; data curation, Z.Z. (Zijuan Zhu); formal analysis, Z.Z. (Zijuan Zhu).; funding acquisition, L.Z.; investigation, F.S., J.X., T.P. and Z.L.; methodology, Z.Z. (Zengxiang Zhang) and Z.Z. (Zijuan Zhu); resources, X.Z. and X.W.; writing—original draft, Z.Z. (Zijuan Zhu); writing—review and editing, L.Z. All authors have read and agreed to the published version of the manuscript.

Funding

This study was supported by National Key Research and Development Program of China (2017YFE0104600).

Data Availability Statement

The NDVI, NDWI and environmental data were available on GEE at https://developers.google.com/earth-engine/datasets/catalog accessed on 25 February 2022.

Acknowledgments

We thank all members of renewable resources sector of Aerospace Information Research Institute, Chinese Academy of Sciences for their help in making research plans and processing data.

Conflicts of Interest

The authors declare no conflict of interest.

References

  1. Tingting, D. Remote Sensing Classification and Landscape Pattern of Irrigated Land and Dry Land in China; Chinese Academy of Sciences: Beijing, China, 2009. [Google Scholar]
  2. FAO. The State of Food and Agriculture 2019; Food and Agricultural Organization of the United Nations: Rome, Italy, 2019; Available online: https://www.fao.org/state-of-food-agriculture/2019/pt/ (accessed on 22 January 2022).
  3. (UNCSD), U.N.C.o.S.D. Comprehensive Assessment of the Freshwater Resources of the World; Report E/CN.17/1997/9; Stockholm Environment Institute (SEI): Stockholm, Sweden, 1997. [Google Scholar]
  4. Feng, C.; Hongbo, W.; Wenju, Y. Survey and evaluation of cultivated land quality grade in China. China Land Sci. 2014, 28, 75–82+97. [Google Scholar]
  5. Cameira, M.d.R.; Santos Pereira, L. Innovation Issues in Water, Agriculture and Food. Water-Sui 2019, 11, 1230. [Google Scholar] [CrossRef] [Green Version]
  6. Popova, Z.; Kercheva, M. CERES model application for increasing preparedness to climate variability in agricultural planning—risk analyses. Phys. Chem. Earth Parts A/B/C 2005, 30, 117–124. [Google Scholar] [CrossRef]
  7. Mingguo, J. Forecast and prevention of the soil erosion in typical irrigation district of Kunes River basin. Water Sci. Eng. Technol. 2010, 42–44. [Google Scholar] [CrossRef]
  8. Ruonan, J.; Wuping, Z.; Shuai, H. Resource and Environment Impact Assessment of Winter Wheat Production in Dry Land and Irrigated Land. J. Shanxi Agric. Sci. 2018, 46, 928–933+961. [Google Scholar]
  9. Yu, M.; Li, Q.; Hayes, M.J.; Svoboda, M.D.; Heim, R.R. Are droughts becoming more frequent or severe in China based on the Standardized Precipitation Evapotranspiration Index: 1951-2010? Int. J. Climatol. 2014, 34, 545–558. [Google Scholar] [CrossRef]
  10. Huo, Z.; Dai, X.; Feng, S.; Kang, S.; Huang, G. Effect of climate change on reference evapotranspiration and aridity index in arid region of China. J. Hydrol. 2013, 492, 24–34. [Google Scholar] [CrossRef]
  11. Ayantobo, O.O.; Li, Y.; Song, S.; Yao, N. Spatial comparability of drought characteristics and related return periods in mainland China over 1961–2013. J. Hydrol. 2017, 550, 549–567. [Google Scholar] [CrossRef]
  12. Zhang, C.; Ye, Y.; Fang, X.; Li, H.; Wei, X. Synergistic Modern Global 1 Km Cropland Dataset Derived from Multi-Sets of Land Cover Products. Remote Sens-Basel 2019, 11, 2250. Remote Sens. 2019, 11, 2250. [Google Scholar] [CrossRef] [Green Version]
  13. Liu, Y.; Wu, W.; Li, H.; Imtiaz, M.; Li, Z.; Zhou, Q. Intercomparison on Four Irrigated Cropland Maps in Mainland China. Sensors 2018, 18, 1197. [Google Scholar] [CrossRef] [Green Version]
  14. Shi, H.; Auch, R.F.; Vogelmann, J.E.; Feng, M.; Rigge, M.; Senay, G.; Verdin, J.P. Case Study Comparing Multiple Irrigated Land Datasets in Arizona and Colorado, USA. J. Am. Water Resour. 2018, 54, 505–526. [Google Scholar] [CrossRef]
  15. Salmon, J.M.; Friedl, M.A.; Frolking, S.; Wisser, D.; Douglas, E.M. Global rain-fed, irrigated, and paddy croplands: A new high-resolution map derived from remote sensing, crop inventories and climate data. Int. J. Appl. Earth Obs. Geoinf. 2015, 38, 321–334. [Google Scholar] [CrossRef]
  16. Nagaraj, D.; Proust, E.; Todeschini, A.; Rulli, M.C.; D’Odorico, P. A new dataset of global irrigation areas from 2001 to 2015. Adv. Water Resour. 2021, 152, 103910. [Google Scholar] [CrossRef]
  17. Siebert, S.; Kummu, M.; Porkka, M.; Döll, P.; Ramankutty, N.; Scanlon, B.R. A global data set of the extent of irrigated land from 1900 to 2005. Hydrol. Earth Syst. Sci. 2015, 19, 1521–1545. [Google Scholar] [CrossRef] [Green Version]
  18. Siebert, S.; Henrich, V.; Frenken, K.; Burke, J. Update of the Digital Global Map of Irrigation Areas to Version 5; Food and Agriculture Organization of the United Nations: Rome, Italy, 2015. [Google Scholar] [CrossRef]
  19. Samasse, K.; Hanan, N.P.; Anchang, J.Y.; Diallo, Y. A High-Resolution Cropland Map for the West African Sahel Based on High-Density Training Data, Google Earth Engine, and Locally Optimized Machine Learning. Remote. Sens. 2020, 12, 1436. [Google Scholar] [CrossRef]
  20. Zhang, X.; Liu, L.; Chen, X.; Gao, Y.; Xie, S.; Mi, J. GLC_FCS30: Global land-cover product with fine classification system at 30 m using time-series Landsat imagery. Earth Syst. Sci. Data 2021, 13, 2753–2776. [Google Scholar] [CrossRef]
  21. Rojas, F.; Rubio, C.; Rizzo, M.; Bernabeu, M.; Akil, N.; Martín, F. Land Use and Land Cover in Irrigated Drylands: A Long-Term Analysis of Changes in the Mendoza and Tunuyán River Basins, Argentina (1986–2018). Appl. Spat. Anal. Policy 2020, 13, 875–899. [Google Scholar] [CrossRef]
  22. Zhu, X.; Zhu, W.; Zhang, J.; Pan, Y. Mapping Irrigated Areas in China from Remote Sensing and Statistical Data. IEEE J. Sel. Top. Appl. Earth Obs. Remote Sens. 2014, 7, 4490–4504. [Google Scholar] [CrossRef]
  23. Liu, Y.; Wu, W.; Li, Z.; Zhou, Q. Extracting irrigated cropland spatial distribution in China based on time-series NDVI. Trans. Chin. Soc. Agric. Eng. 2017, 33, 276–284. [Google Scholar] [CrossRef]
  24. Xiang, K.; Yuan, W.; Wang, L.; Deng, Y. An LSWI-Based Method for Mapping Irrigated Areas in China Using Moderate-Resolution Satellite Data. Remote Sens. 2020, 12, 4181. [Google Scholar] [CrossRef]
  25. Xiang, K.; Ma, M.; Liu, W.; Dong, J.; Zhu, X.; Yuan, W. Mapping Irrigated Areas of Northeast China in Comparison to Natural Vegetation. Remote Sens. 2019, 11, 825. [Google Scholar] [CrossRef] [Green Version]
  26. Zhu, Z.; Zhang, Z.; Zuo, L.; Sun, F.; Pan, T.; Li, J.; Zhao, X.; Wang, X. The Detecting of Irrigated Croplands Changes in 1987–2015 in Zhangjiakou. IEEE Access 2021, 9, 96076–96091. [Google Scholar] [CrossRef]
  27. Ma, Z.; Zheng, D.; Duan, Y.; Tuo, D.; Chen, Z. Problems and Countermeasures of Ecology and Sustainable Development of Agriculture in the Ecotone of the North Loess Plateau. Res. Soil Water Conserv. 2004, 11, 240–242. [Google Scholar]
  28. Yahui Liu, H.C. Problems and Suggestions of agricultural ecological Transformation in western China—A case study of Bayannur, Inner Mongolia. J. Shanxi Agric. Univ. 2022, 21, 19–25. [Google Scholar] [CrossRef]
  29. Songrui Ning, J.H.; Qili, H. Analysis of the change of cultivated land in Yulin City. Land Dev. Eng. Res. 2016, 2, 20–27. [Google Scholar]
  30. Feng Yang, S.G.; Chun, Y.; Tao, Y. Study on Optimization Layout of Cultivated Land and Basic Farmland of Shuozhou City in Shanxi Province. Resour. Dev. Mark. 2012, 28, 628–631, 635. [Google Scholar]
  31. Genglai Niu, H.W.; Wang, X.; Guo, F. Water saving analysis of agricultural comprehensive development in The Yellow River Irrigation area of Bayannur City. Inn. Mong. Water Conserv. 2006, 105, 14–15. [Google Scholar]
  32. Chen, S.; Hua, L.; He, Z.; Wei, D.; Xia Hou, G. Effect of Soil Erosion on Soil Properties in Deep Cultivated Hill Slope in Loess Plateau. Agro-Enviro. Prot. 2002, 21, 289–292. [Google Scholar]
  33. Chander, G.; Markham, B.L.; Helder, D.L. Summary of current radiometric calibration coefficients for Landsat MSS, TM, ETM+, and EO-1 ALI sensors. Remote Sens. Environ. 2009, 113, 893–903. [Google Scholar] [CrossRef]
  34. Gitelson, A.A.; Merzlyak, M.N. Remote estimation of chlorophyll content in higher plant leaves. Int. J. Remote Sens. 2010, 18, 2691–2697. [Google Scholar] [CrossRef]
  35. Gao, B.C. NDWI—A normalized difference water index for remote sensing of vegetation liquid water from space. Remote Sens. Environ. 1996, 58, 257–266. [Google Scholar] [CrossRef]
  36. Wan, Z.; Hook, S.; Hulley, G. MYD11A1 MODIS/Aqua Land Surface Temperature/Emissivity Daily L3 Global 1km SIN Grid V006. Nasa Eosdis Land Process. Daac 2015. [Google Scholar] [CrossRef]
  37. Braithwaite, D.K.; Sorooshian, S.; Hsu, K.-L.; Ashouri, H.; Knapp, K.R.; Cecil, L.D.; Nelson, B.R.; Prat, O.P. PERSIANN-CDR: Daily Precipitation Climate Data Record from Multisatellite Observations for Hydrological and Climate Studies. Bull. Am. Meteorol. Soc. 2015, 96, 69–83. [Google Scholar] [CrossRef] [Green Version]
  38. Sorooshian, S.H.; Braithwaite, K.D.; Hamed, A. NOAA Climate Data Record (CDR) of Precipitation Estimation from Remotely Sensed Information using Artificial Neural Networks (PERSIANN-CDR); National Oceanic and Atmospheric Administration: Washington, DC, USA, 2014. [Google Scholar] [CrossRef]
  39. Zhang, Z.; Wang, X.; Zhao, X.; Liu, B.; Yi, L.; Zuo, L.; Wen, Q.; Liu, F.; Xu, J.; Hu, S. A 2010 update of National Land Use/Cover Database of China at 1:100000 scale using medium spatial resolution satellite images. Remote Sens. Environ. 2014, 149, 142–154. [Google Scholar] [CrossRef]
  40. Editorial Board and Editorial Staff of Yulin Statistical Yearbook 2017. Yulin Statistical Yearbook 2017; China Statistics Press: Beijing, China, 2017. [Google Scholar]
  41. Editorial Board and Editorial Staff of Shanxi Statistical Yearbook 2016. Shanxi Statistical Yearbook 2016; China Statistics Press: Beijing, China, 2016. [Google Scholar]
  42. Editorial Board and Editorial Staff of Shanxi Statistical Yearbook 2006. Shanxi Statistical Yearbook 2006; China Statistics Press: Beijing, China, 2006. [Google Scholar]
  43. Editorial Board and Editorial Staff of Xinzhou Statistical Yearbook 2006. Xinzhou Statistical Yearbook 2006; China Statistics Press: Beijing, China, 2006. [Google Scholar]
  44. Editorial Board and Editorial Staff of Yulin Statistical Yearbook 2006. Yulin Statistical Yearbook 2006; China Statistics Press: Beijing, China, 2006. [Google Scholar]
  45. Editorial Board and Editorial Staff of Xinzhou Statistical Yearbook 2016. Xinzhou Statistical Yearbook 2016; China Statistics Press: Beijing, China, 2016. [Google Scholar]
  46. Editorial Board and Editorial Staff of Inner Mongolia Statistical Yearbook 2016. Inner Mongolia Statistical Yearbook 2016; China Statistics Press: Beijing, China, 2016. [Google Scholar]
  47. Editorial Board and Editorial Staff of Bayannur Statistical Yearbook 2016. Bayannur Statistical Yearbook 2016; China Statistics Press: Beijing, China, 2016. [Google Scholar]
  48. Editorial Board and Editorial Staff of Bayannur Statistical Yearbook 2006. Bayannur Statistical Yearbook 2006; China Statistics Press: Beijing, China, 2006. [Google Scholar]
  49. Editorial Board and Editorial Staff of Inner Mongolia Statistical Yearbook 2006. Inner Mongolia Statistical Yearbook 2006; China Statistics Press: Beijing, China, 2006. [Google Scholar]
  50. Zeng, H.; Wu, B.; Zou, W.; Yan, N.; Zhang, M. Performance comparison of crop condition assessments in irrigated and rain-fed areas: A case study in Nebraska. J. Remote Sens. 2015, 19, 560–567. [Google Scholar]
  51. Jackson, T.J.; Chen, D.Y.; Cosh, M.; Li, F.Q.; Anderson, M.; Walthall, C.; Doriaswamy, P.; Hunt, E.R. Vegetation water content mapping using Landsat data derived normalized difference water index for corn and soybeans. Remote Sens. Environ. 2004, 92, 475–482. [Google Scholar] [CrossRef]
  52. Papagiannopoulou, C.; Miralles, D.G.; Decubber, S.; Demuzere, M.; Verhoest, N.E.C.; Dorigo, W.A.; Waegeman, W. A non-linear Granger-causality framework to investigate climate–vegetation dynamics. Geosci. Model Dev. 2017, 10, 1945–1960. [Google Scholar] [CrossRef] [Green Version]
  53. Zhu, X.; Liu, Y.; Xu, K.; Pan, Y. Effects of Drought on Vegetation Productivity of Farmland Ecosystems in the Drylands of Northern China. Remote Sens. 2021, 13, 1179. [Google Scholar] [CrossRef]
  54. Turner, N.C. Agronomic options for improving rainfall-use efficiency of crops in dryland farming systems. J. Exp. Bot. 2004, 55, 2413–2425. [Google Scholar] [CrossRef] [Green Version]
  55. Irmak, S.; Sharma, V. Large-scale and long-term trends and magnitudes in irrigated and rainfed maize and soybean water productivity: Grain yield and evapotranspiration frequency, crop water use efficiency, and production functions. Trans. ASABE 2015, 58, 103–120. [Google Scholar] [CrossRef]
  56. Ma, D. A Meta-Analysis on Effect of Agronomic Measures on Yield and Water Use Efficiency of Wheat and Maize in Northern China; The University of Chinese Academy of Sciences: Beijing, China, 2020. [Google Scholar]
  57. Guoqing, W.; Jianyun, Z.; Ruimin, H.E.; Xinai, J. Trends of temperature change in middle of Yellow River and its impact to the evaporation potential. J. Water Resour. Water Eng. 2007, 18, 32–36. [Google Scholar]
  58. Sun, D.; Kafatos, M. Note on the NDVI-LST relationship and the use of temperature-related drought indices over North America. Geophys. Res. Lett. 2007, 34, L24406. [Google Scholar] [CrossRef] [Green Version]
  59. Maxwell, A.E.; Warner, T.A.; Fang, F. Implementation of machine-learning classification in remote sensing: An applied review. Int. J. Remote Sens. 2018, 39, 2784–2817. [Google Scholar] [CrossRef] [Green Version]
  60. Breiman, L.J.M.l. Random forests. Mach. Learn. 2001, 45, 5–32. [Google Scholar] [CrossRef] [Green Version]
  61. He, Y. Analysis of water resources exploitation and utilization in Wutai County. Shanxi Water Resour. 2014, 08, 6–8. [Google Scholar]
  62. Lei, C. Research on Water Resource Dispatching Model and Implementation of Dispatching Decision Support System in Hutuo River Basin. Master’s Thesis, China University of Geosciences, Beijing, China, 2019. [Google Scholar]
  63. Zhiyong, L. Application of Intelligent Water Meter for Agricultural Irrigation in Filtration Sihe Pumping Station. Intelligence 2011, 25, 68. [Google Scholar]
  64. Yong, Z. Discussion on countermeasures of sustainable development in agricultural irrigation area. Shanxi Water Conserv. 2007, 06, 85–86. [Google Scholar]
Figure 1. Study area and sample distribution.
Remotesensing 14 01256 g001
Figure 2. Scatterplots of remote sensing factors and environmental factors from the second half of June to the second half of August. Note: The precipitation and LST were accumulative values of the 30 days before imaging.
Remotesensing 14 01256 g002aRemotesensing 14 01256 g002b
Figure 3. Cumulative distribution of mean NDVI and NDWI of unchanged drylands.
Remotesensing 14 01256 g003
Figure 4. Comparison chart between classifications of 6/8/16 and statistical data.
Remotesensing 14 01256 g004
Figure 5. Irrigated and rainfed dryland distribution in 2015.
Remotesensing 14 01256 g005
Figure 6. Changes of irrigated and rainfed dryland distribution 2005–2015.
Remotesensing 14 01256 g006
Figure 7. Irrigated and rainfed dryland distribution in 2005.
Remotesensing 14 01256 g007
Figure 8. Percentage of area equipped for irrigation [18].
Remotesensing 14 01256 g008
Figure 9. Typical example of irrigated dryland classification in Yuyang.
Remotesensing 14 01256 g009
Figure 10. Typical example of irrigated dryland classification in Hequ.
Remotesensing 14 01256 g010
Figure 11. Typical example of irrigated dryland classification in Yuanping.
Remotesensing 14 01256 g011
Table 1. Importance of Features Table.
PhaseFeatureImportance
7–1NDVI/pre2.421076683
7–1NDVI/-LST2.759799328
7–1NDW/pre3.049326345
7–1NDWI/-LST1.812169093
7–2NDVI/pre1.910314563
7–2NDVI/-LST2.388141123
7–2NDW/pre3.365386511
7–2NDWI/-LST1.897729877
8–1NDVI/pre2.025320583
8–1NDVI/-LST3.767285626
8–1NDW/pre2.519476331
8–1NDWI/-LST2.092639257
8–2NDVI/pre0.908218837
8–2NDVI/-LST3.096507977
8–2NDW/pre2.958657798
8–2NDWI/-LST1.361460535
Table 2. Information of Some Classification Methods.
1234567
Classification factor NDVI/PNDVI/PNDVI/PNDVI/PNDVI/PNDVINDV Increment
NDWI/-TNDWI/-TNDWI/-TNDWI/-TNDWI/-TNDWINDWI increment
NDWI/PNDWI/PNDWI/PNDWI/PNDWI/P
NDVI/-TNDVI/-TNDVI/-TNDVI/-TNDVI/-T
Cumulative days15306090starts on 15 April3030
Phases5–1 to 9–25–1 to 9–25–1 to 9–25–1 to 9–25–1 to 9–25–1 to 9–25–1 to 9–2
The overall accuracy0.8530.8570.8220.8430.840.8240.784
Kappa coefficient0.6940.6970.6310.6710.6640.6320.556
891011121314
Classification factor NDVI increment/P incrementNDVINDVI/PNDVINDVI/PNDVINDVI/P
NDWI increment/-T incrementNDWINDWI/-TNDWINDWI/-TNDWINDWI/-T
NDWI increment/P increment NDWI/P NDWI/P NDWI/P
NDVI increment/-T increment NDVI/-T NDVI/-T NDVI/-T
Cumulative days30303030303030
Phases5–1 to 9–26–2 to 8–16–2 to 8–17–1 to 8–27–1 to 8–26–1, 6–26–1, 6–2
The overall accuracy0.8170.7910.8470.810.8510.7740.8
Kappa coefficient0.6140.5590.6840.60.6870.5270.579
151617181920
Classification factor NDVINDVI/PNDVINDVI/PNDVINDVI/P
NDWINDWI/-TNDWINDWI/-TNDWINDWI/-T
NDWI/P NDWI/P NDWI/P
NDVI/-T NDVI/-T NDVI/-T
Cumulative days303030303030
Phases7–1, 7–27–1, 7–28–1, 8–28–1, 8–27–2, 8–17–2, 8–1
The overall accuracy0.7950.8390.7920.8380.8170.86
Kappa coefficient0.570.6670.5640.660.6070.71
Note: P means accumulated precipitation; T means accumulated LST; increment means the increment compared with the former one phase; 1–20 refer to different classification methods.
Table 3. Area table of change types (km2).
CityTaiyuanShuozhouXinzhouLvliangHushiBaotouOrdosBayannaoerYulin
Non-cultivated land 45,477.78 45,139.71 162,476.05 125,306.93 106,938.28 65,092.35 841,678.40 121,785.44 246,892.39
Non-cultivated land to rainfed dryland2971.21 3994.10 12,151.23 12,602.47 5683.05 1960.06 8738.07 412.53 22,444.99
Non-cultivated land to irrigated dryland415.25 533.79 1458.60 404.07 1619.11 1295.50 11,425.43 6127.62 3893.23
Rainfed dryland to non-cultivated land 4365.40 8033.43 14,271.17 15,607.43 5517.16 1571.47 5331.76 563.97 29,332.19
Rainfed dryland10,042.54 26,175.87 47,063.72 50,993.02 32,529.77 12,754.14 20,182.09 695.63 103,421.50
Rainfed dryland to irrigated dryland1261.59 2513.28 2885.15 1267.70 9029.89 3023.80 3170.75 2168.54 6039.73
Irrigated dryland to non-cultivated land 1472.54 775.59 2246.60 1311.50 1445.86 2250.71 3912.57 5162.55 3949.21
Irrigated dryland to rainfed dryland2134.59 2098.22 5032.12 3753.54 3771.33 4960.14 3232.69 996.16 11,748.95
irrigated dryland2646.76 9273.03 13,486.74 4700.51 16,218.18 12,553.71 11,074.32 51,448.95 12,426.46
Publisher’s Note: MDPI stays neutral with regard to jurisdictional claims in published maps and institutional affiliations.

