Article

Vegetation Browning Trends in Spring and Autumn over Xinjiang, China, during the Warming Hiatus

1
Key Laboratory of Oasis Ecology of Ministry of Education, Institute of Arid Ecology and Environment, College of Geographical Sciences, Xinjiang University, Urumqi 830046, China
2
Institute of Desert Meteorology, China Meteorological Administration, Urumqi 830002, China
3
College of Tourism, Xinjiang University of Finance and Economics, Urumqi 830012, China
*
Author to whom correspondence should be addressed.
Remote Sens. 2022, 14(5), 1298; https://doi.org/10.3390/rs14051298
Submission received: 1 January 2022 / Revised: 22 February 2022 / Accepted: 5 March 2022 / Published: 7 March 2022
(This article belongs to the Special Issue Remote Sensing of Watershed)

Abstract

:
Satellite-derived vegetation records (GIMMS3g-NDVI) report that climate warming promotes vegetation greening trends; however, the climate impacts on vegetation growth during the global warming hiatus period (1998–2012) remain unclear. In this study, we focused on the vegetation change trend in Xinjiang in spring and autumn before and during the recent warming hiatus period, and their climate-driving mechanisms, which have not been examined in previous studies. Based on satellite records, our results indicated that the summer normalized difference vegetation index (NDVI) in Xinjiang experienced a greening trend, while a browning trend existed in spring and autumn during this period. The autumn NDVI browning trend in Xinjiang was larger than that in spring; however, the spring NDVI displayed a higher correlation with climatic factors than did the autumn NDVI. During the warming hiatus, spring climatic factors were the main controlling factors of spring NDVI, and spring vapor pressure deficit (VPD) had the highest positive correlation with spring NDVI, followed by spring temperature. The larger increase in air temperature in spring than in autumn resulted in increased VPD differences in spring and autumn. In autumn, summer climatic factors (e.g., VPD, WS, RH, and precipitation) were significantly correlated with the autumn NDVI during the warming hiatus. However, the autumn temperature was weakly correlated with the autumn NDVI. Our results have significant implications for understanding the response of vegetation growth to recent and future climatic conditions.

Graphical Abstract

1. Introduction

The global air temperature dataset indicates that the warming rate did not increase significantly during the period of 1998–2012 [1,2,3,4,5,6,7,8], and this period has become known as the “warming hiatus” or “global slowdown” [2,9]. Many previous reports have indicated that the “warming hiatus” phenomenon has also been reported in China and the Xinjiang region [10,11,12]. A warming hiatus has profound effects on ecosystems, water resources, and sustainable development.
Many studies have found that air temperature is a major controlling factor for vegetation growth changes [13,14,15,16]. Generally, vegetation growth is consistent with changes in temperature [17]. Kaufmann et al. [18] reported that global warming was the main contributor to vegetation greening in the Northern Hemisphere using the normalized difference vegetation index (NDVI). Other studies have indicated that global warming has advanced spring vegetation green-up and delayed autumn vegetation senescence [19,20]. Wang et al. [21] found that the spring phenology advancing rate over the Northern Hemisphere from 2000 to 2012 was larger than that during 1982–1992, similar to the autumn phenology. The long-term monitoring of the global NDVI has shown significant greening since 1982 [22]. However, the NDVI trend has indicated a greening stall and subsequent vegetation browning since the late 1990s [22,23]. Approximately 59% of the global vegetated area experienced a significant browning trend from 1998 to 2015 [22]. In addition, greening to browning reversals were experienced in southeast and northwest High Mountain Asia from 1982 to 2015 due to the continuous warming shift [24].
Global dryland vegetation has undergone a significant greening trend since the 1980s [25,26,27,28]. Central Asia is one of the driest regions in the world, and the vegetation NDVI showed a greening trend during 1982–1998, followed by a browning trend after 1999 [29,30]. Vegetation NDVI trends in arid regions of China have decreased since 2000 [11,31]. In Xinjiang, a previous study reported that the increased warming and reduced precipitation exemplified by the vegetation NDVI trends have reversed since the late 1990s [29]. Another study found that increased drought severity led to a decreased NDVI [12]. In addition, Yao et al. [31] found that climate extremes were the major drivers of the decreased NDVI in Xinjiang. However, information regarding vegetation growth changes and their climate-driving mechanisms is still scarce, especially for spring and autumn during the warming hiatus.
The primary objective of this study is to quantify the trend in vegetation growth changes in spring and autumn in Xinjiang during the global warming hiatus, and to assess the effects of the warming hiatus on vegetation changes trends. In this study, we used satellite-derived vegetation records (GIMMS3g-NDVI) to investigate the latest vegetation growth changes in spring and autumn in Xinjiang and to reveal the effects of the warming hiatus on vegetation NDVI trends. We examined vegetation NDVI trends in spring and autumn from 1982 to 2015. We also compared vegetation NDVI trends before and during the warming period. The climatic controls on vegetation NDVI trends were investigated based on correlation and partial correlation analyses. We also discuss the climate-driving mechanisms during the warming hiatus.

2. Materials and Methods
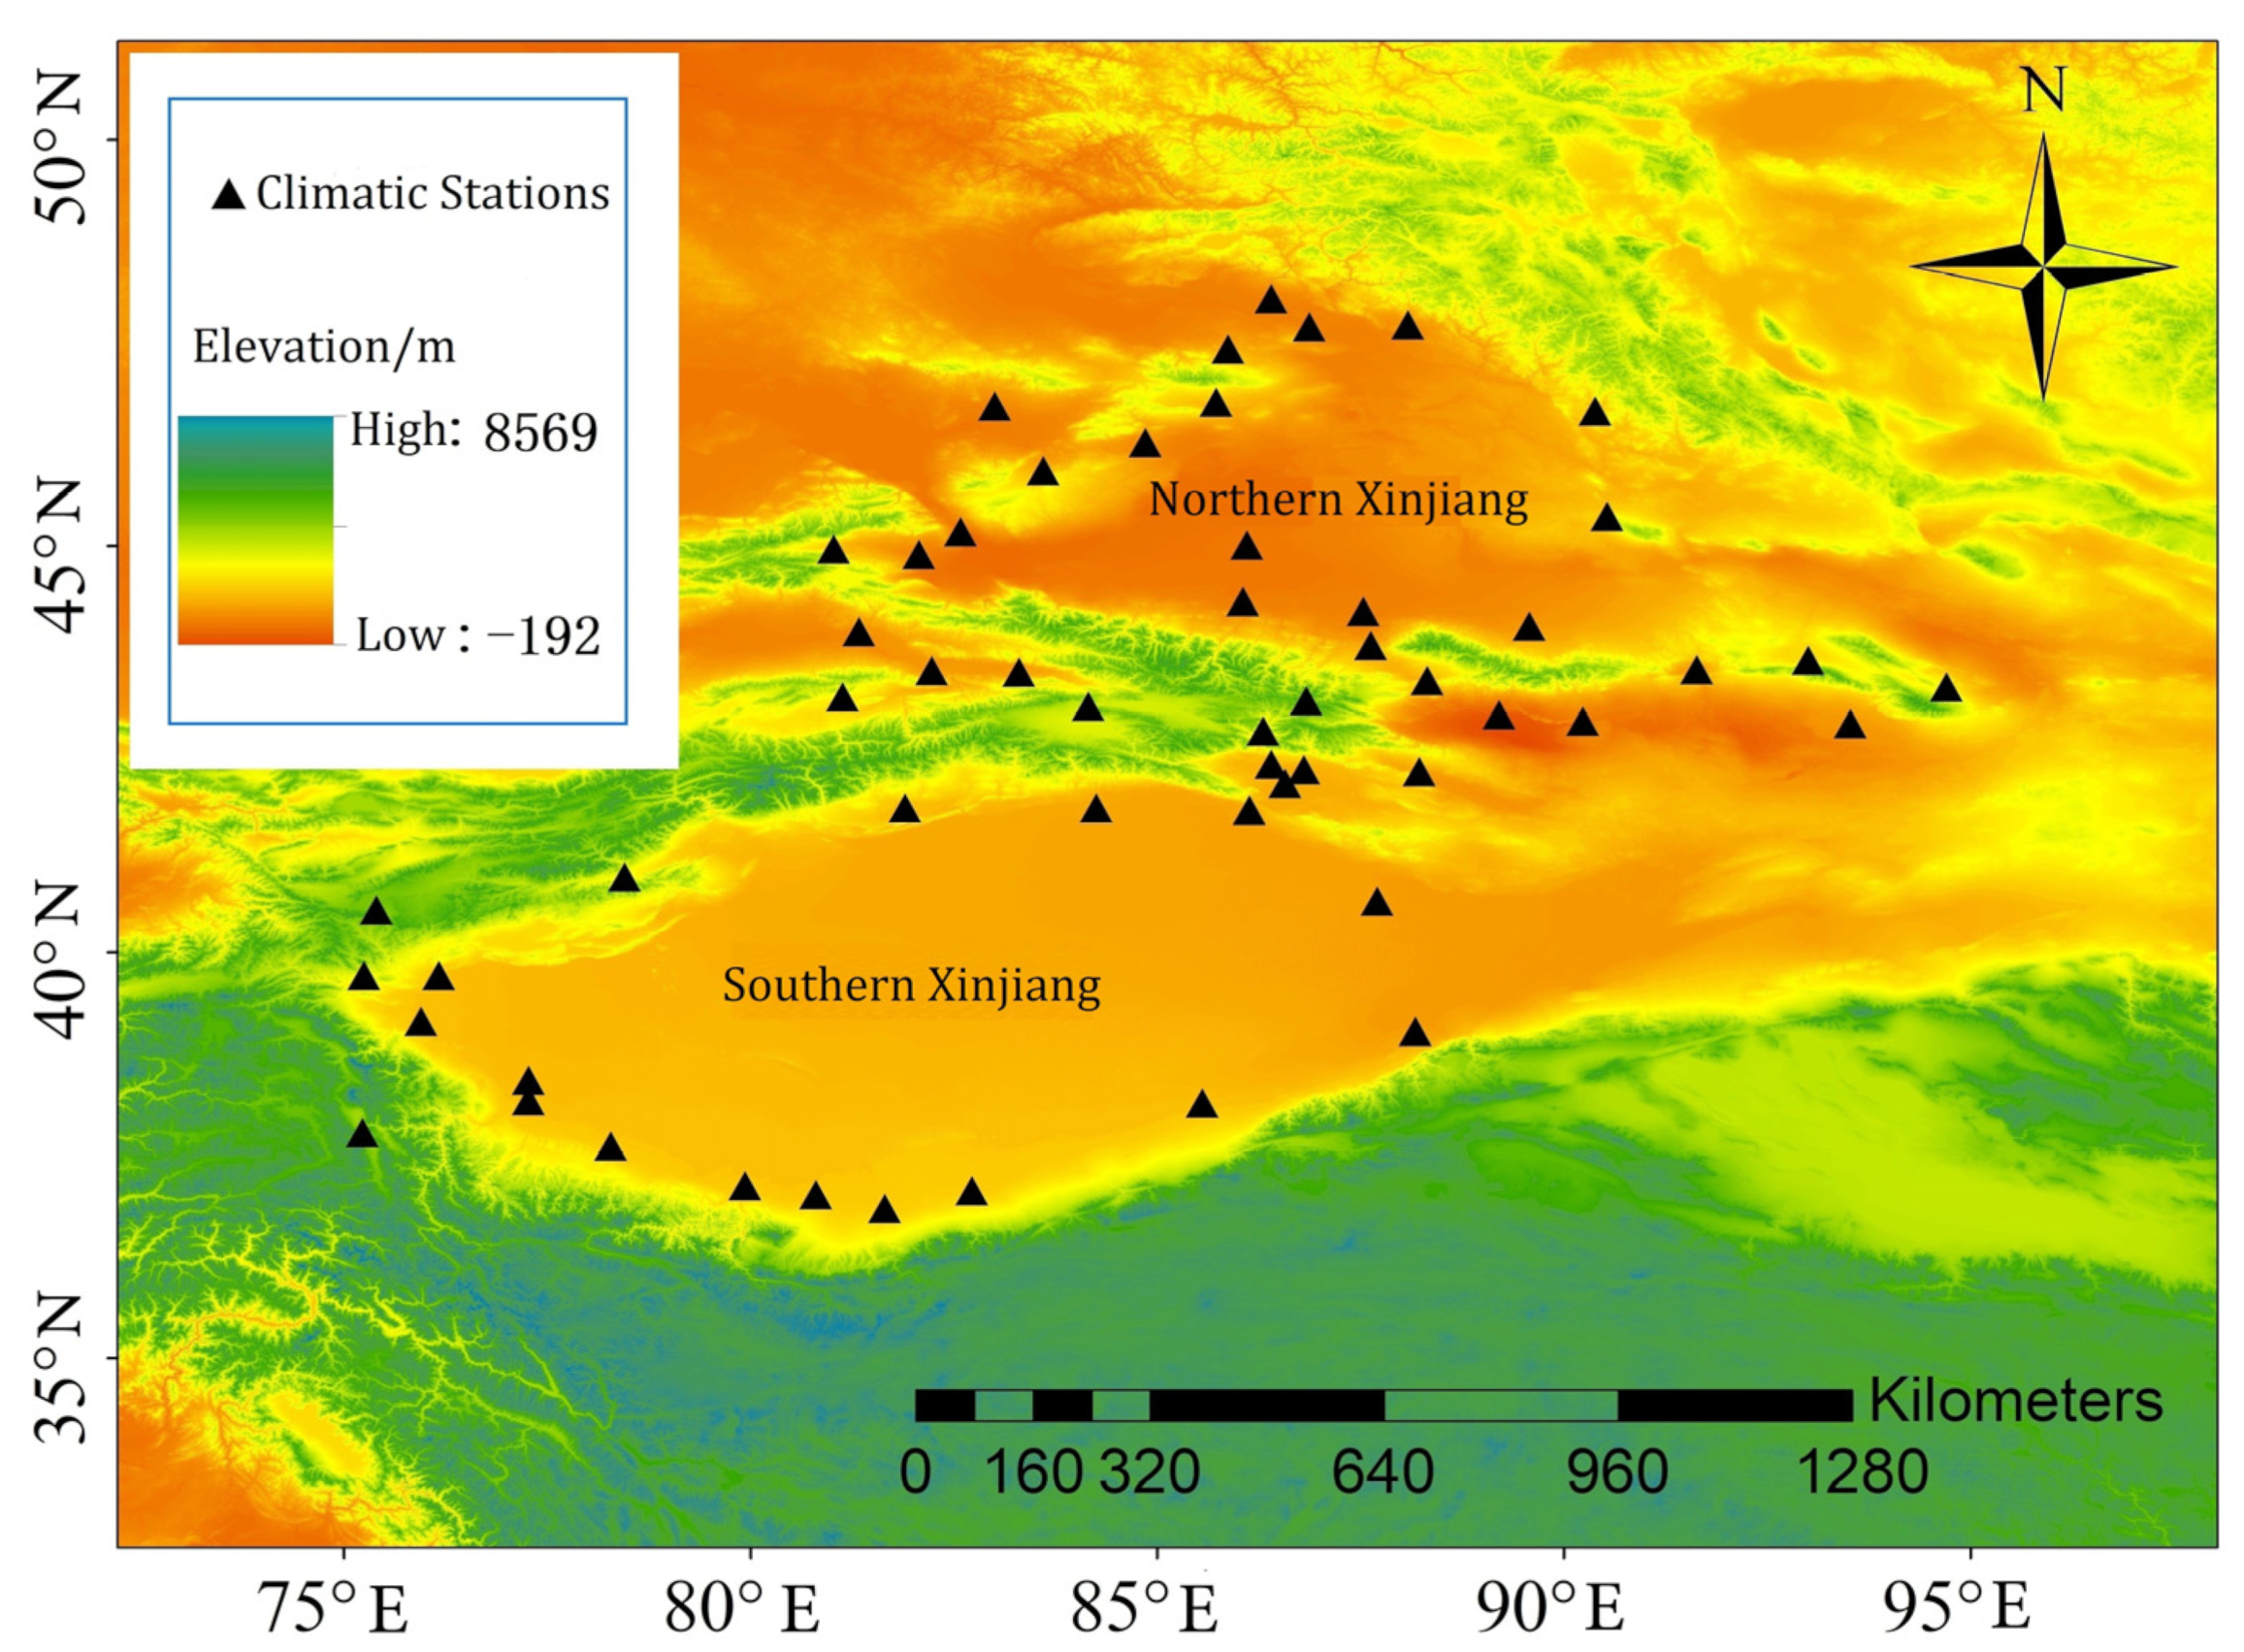
2.1. Climate Data

Monthly meteorological datasets were provided by the China Meteorological Administration (CMA) (http://data.cma.cn/, accessed on 1 May 2020). The dataset contained monthly air temperature (Tair), maximum temperature (Tmax), minimum temperature (Tmin), precipitation (Prec), relative humidity (RH), wind speed (WS), and sunshine duration (SD). This dataset consisted of 89 observed sites over Xinjiang and was available for the period from to 1982–2015 (Figure 1). These datasets were strictly quality-controlled and homogeneity-tested with high accuracy [32]. However, the monthly RH variable was inhomogeneous from the early 2000s, mainly due to data collection changes from manual to automatic systems [33]. Thus, we selected the homogenized RH series from the ChinaRHv1.0 dataset (http://www.sciencedb.cn/dataSet/handle/804, accessed on 25 May 2021), which was developed by Li et al. [34]. These meteorological variables were interpolated with the spatial resolution of 10 km by the gradient inverse distance square method (GIDS) from the data measured at the meteorological stations, which consider the effects of topographical factors.
We used the self-calibrating Palmer drought severity index (sc_PDSI; [35,36]) to analyze the dry or wet conditions in Xinjiang from 1982–2015. The monthly time series of sc_PDSI was calculated using monthly temperature and precipitation data from the CRU TS4.04 version (https://doi.org/10.1038/s41597-020-0453-3, accessed on 20 March 2021), together with fixed parameters related to soil/surface characteristics at each location [36]. The sc_PDSI dataset (https://crudata.uea.ac.uk/cru/data/drought/, accessed on 20 March 2021) was obtained from the CRU, with a spatial resolution of 0.5° [37]. In addition, the temperature of the Northern Hemisphere (NH) was obtained from the HadCRUTS5 version for 1982–2015.

2.2. Satellite-Derived NDVI Data

The newest NASA GIMMS3g-NDVI dataset was used to indicate vegetation growth in Xinjiang during 1982–2015 [31,38]. The GIMMS NDVI3g dataset was obtained from the NASA Ames Ecological Forecasting Lab (https://ecocast.arc.nasa.gov/data/pub/gimms/, accessed on 1 November 2019) with a spatial resolution of 1/12° and a temporal resolution of 15-days [22]. The regional mean NDVI was calculated by averaging the annual growing season (GS) and seasonal NDVI, excluding unvegetated regions. Pixels with multi-year average (1982–2015) GS NDVI values greater than 0.1 were used for analysis, and GS is defined as April–October. The maximum value composite (MVC) method is utilized to construct the monthly and seasonal NDVI datasets [38].

2.3. Methods

2.3.1. Calculation of VPD

The monthly vapor pressure deficit (VPD) is calculated according to the Allen et al. [39] equation:
VPD = esea
where es is the saturation vapor pressure (hPa) and ea is the actual vapor pressure (hPa). The es value is calculated by:
es = 0.611exp[(17.27 × Ta)/(Ta + 237.3)]
where Ta is the surface air temperature (°C). The ea value is calculated by:
ea = RH × es/100
where RH is relative humidity (%).

2.3.2. Trend Analysis

In this study, a linear least squares regression analysis was conducted to calculate trends in NDVI and climatic factors. The slope of the regression line was defined as the trend in the NDVI and climatic factors. The trend significance was examined by the Mann–Kendall test [40,41].
For the vegetation NDVI and climatic factors (VPD, air temperature, maximum temperature, minimum temperature, precipitation, RH, WS, and SD), the seasonal and annual growing season (GS) values were calculated using the average of the monthly NDVI and climatic factor values. The annual GS was defined from April to October, and other seasons were defined as spring (March, April, May), summer (June, July, August), and autumn (September, October, and November).

2.3.3. Correlation and Partial Correlation Analysis

Pearson’s correlation analysis was employed to examine the correlation coefficient between the four seasonal climatic factors and spring NDVI (or autumn NDVI), and a t-test was used to determine the significance of the correlation. Partial correlation analysis (PCA) was employed to determine the correlation between NDVI and climate factors at the annual GS and seasonal scales, excluding the impacts of other climatic factors. The PCA results describe the relationship between two variables independent of the impact of other variables [42,43].

3. Results

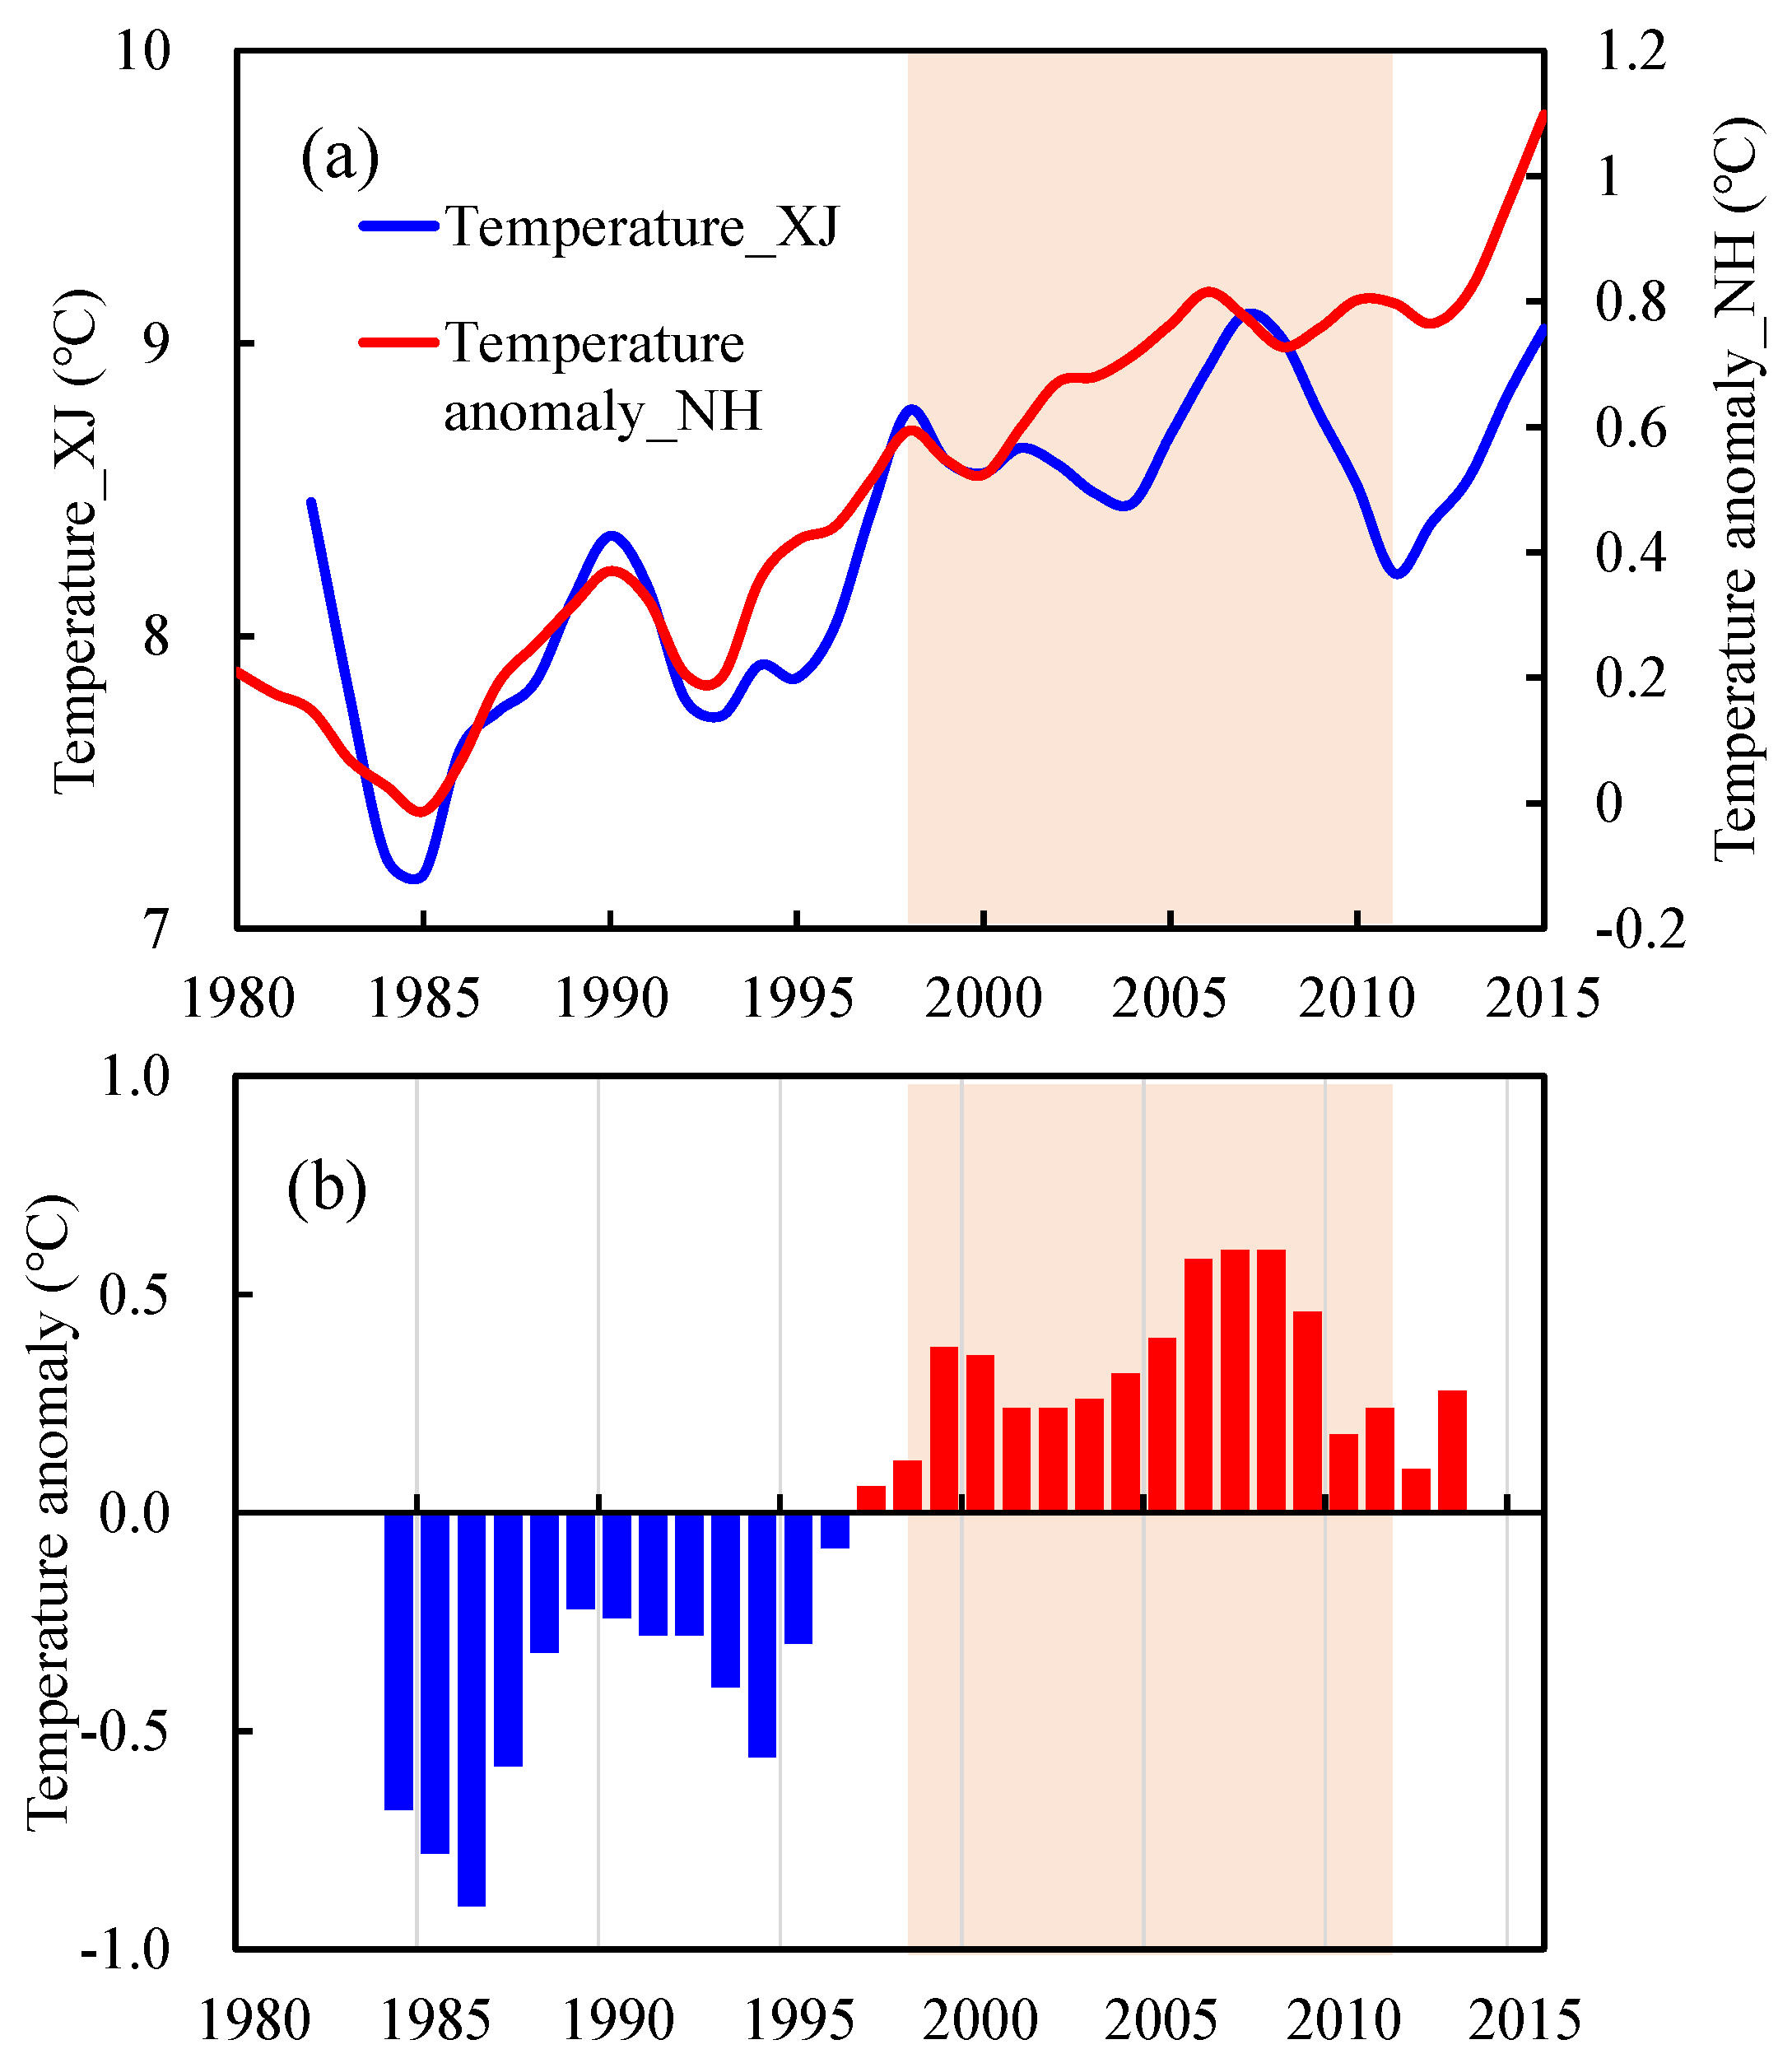
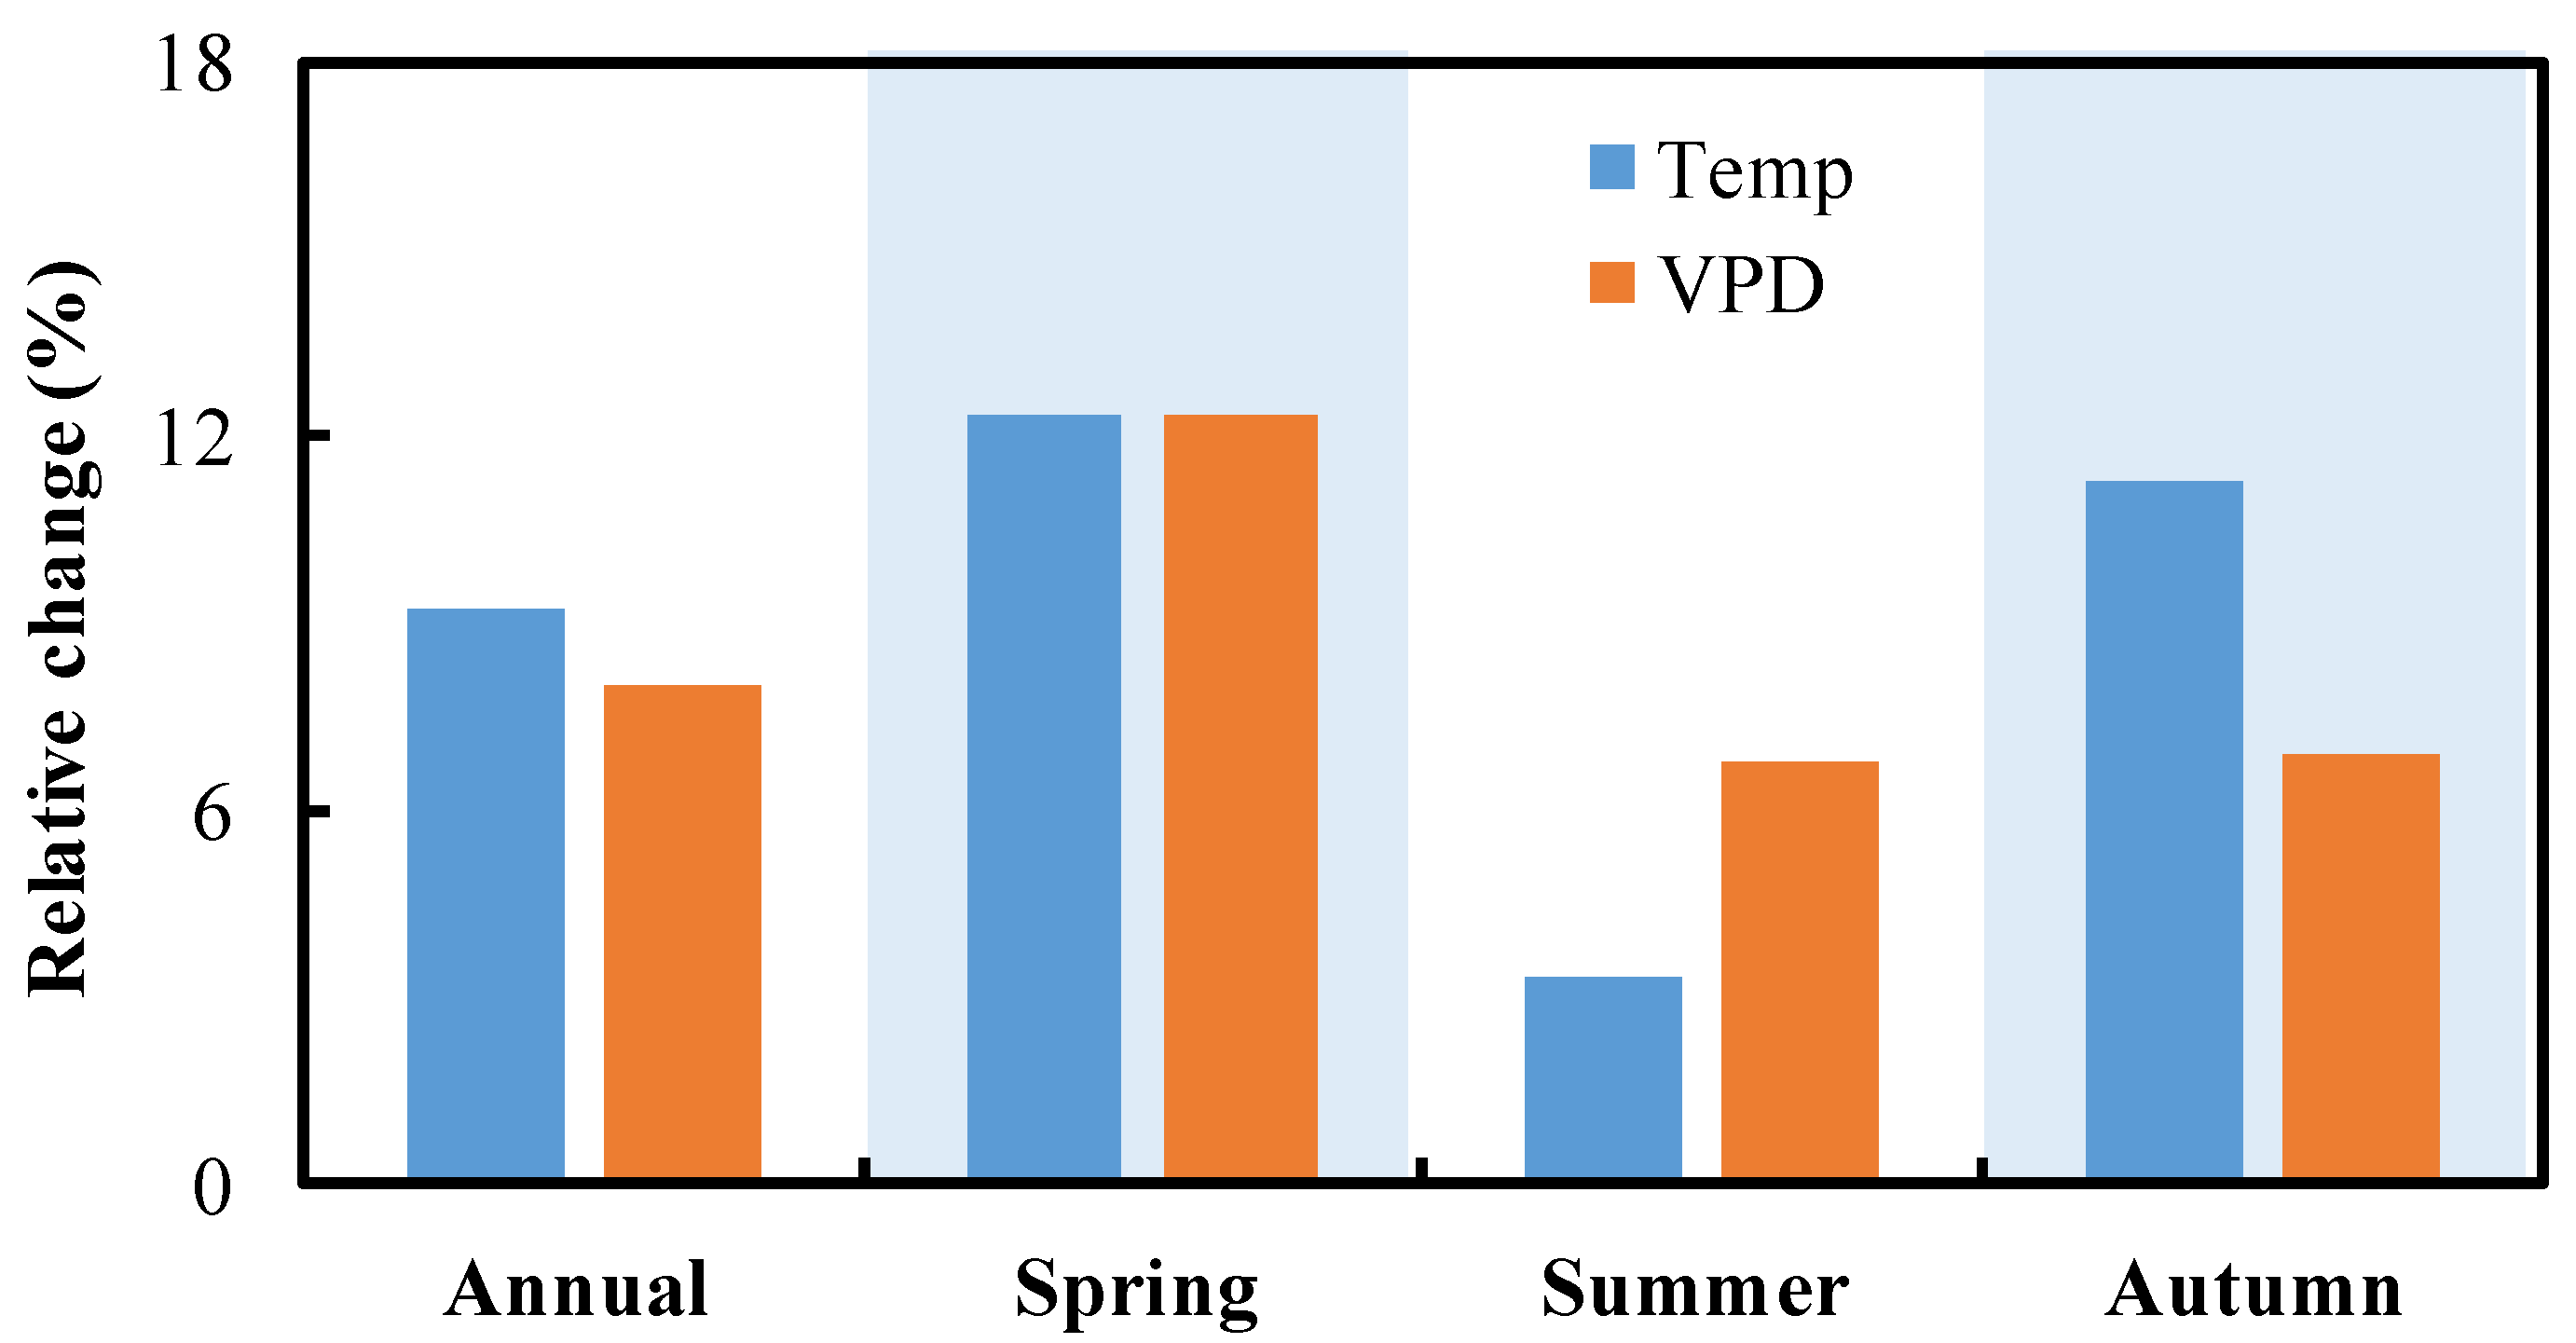
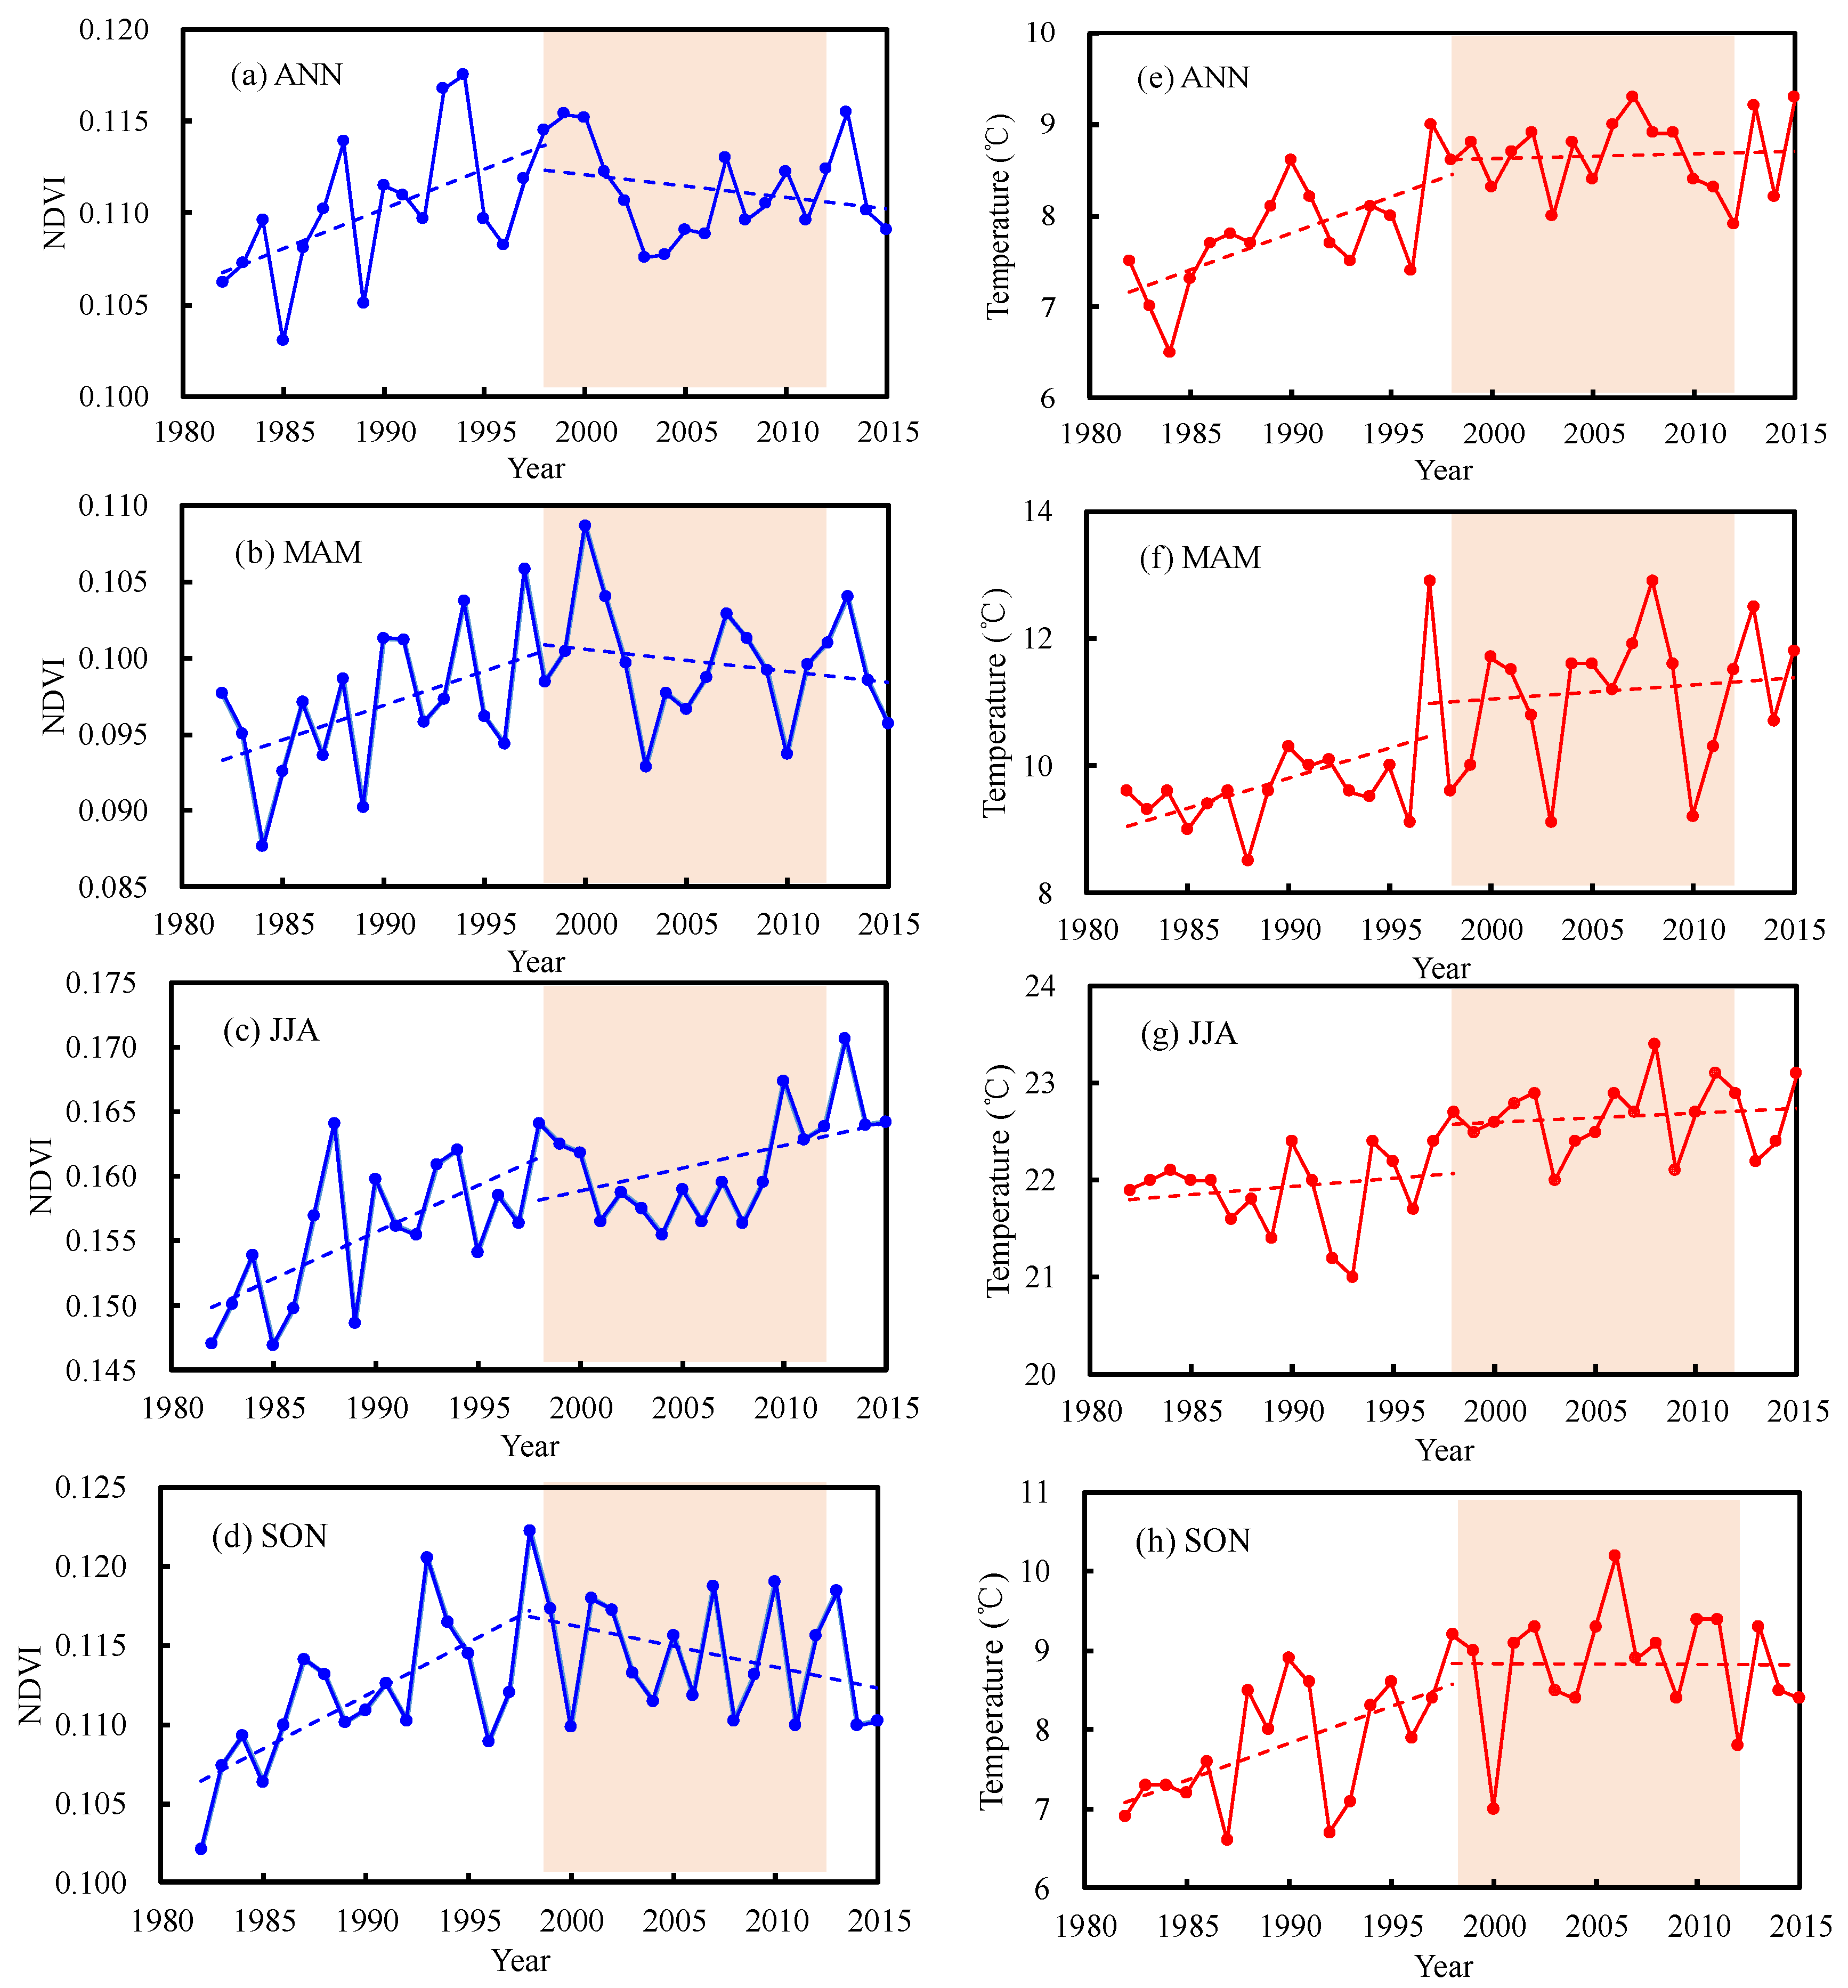
3.1. Temperature Change and Warming Hiatus Period

The global and regional surface air temperature did not increase significantly between 1998 and 2012, and this period can be regarded as the “warming hiatus” [1,2,3,4,5,6,7,8]. Figure 2 indicate the change in annual mean air temperature averaged across Xinjiang and the NH from 1982 to 2015, especially during the warming hiatus period (1998–2012). This indicates that the “warming hiatus” was also reporting the surface air temperature changes in Xinjiang during 1998–2012.
Trends in the regional mean time series of Tair, VPD, Tmax, Tmin, Prec, and RH had different characteristics during 1998–2012 (Figure 3). For Tair, the annual mean warming rate during 1998–2012 decreased by −0.14 °C/decade, and the decreases in the annual mean Tmax and Tmin, −0.13 °C/decade and −0.08 °C/decade, respectively, were much weaker and insignificant (Figure 3a,c,d). The annual total precipitation trends show an insignificant decline of −7.66 mm/decade between 1998–2012, which is contrasts markedly with the earlier period (1982–1997) (Figure 3e). The decrease in annual RH, −3.3%/decade, was significant during the warming hiatus (Figure 3f). For the VPD, the significant positive trends of 0.08 hPa/decade were impressive during 1998–2012 (Figure 3b), which is inconsistent with the reduction in other variables during the same time.
The seasonal SAT trends had different characteristics before and after 1998. The greatest increase in Tair occurred during the spring, 0.52 °C/decade, and the summer and autumn had slight warming trends, 0.22 °C/decade and 0.14 °C/decade, respectively; however, there was a decreasing trend, −1.36 °C/decade in winter. This contrasts markedly with 1982–1998, during which there was little change (0.17 °C/decade) in summer, while the other three seasons experienced significant warming trends, 0.76 °C/decade in spring, 0.93 °C/decade in autumn, and 0.98 °C/decade in winter (Table 1).
VPD is a direct indicator of atmospheric desiccation strength and is dependent on temperature and RH. The Xinjiang climate experienced remarkable changes during the warming hiatus. The annual mean temperature after 1998 increased by 9.2% compared with that during 1982–1998 (Figure 4). Seasonally, spring had the largest change at 12.4%, followed by autumn at 11.3%, and summer had the weakest change of 3.3% during 1998–2015 relative to 1982–1998 in Xinjiang (Figure 4). For VPD, the relative change was approximately 8.0% before and after 1998, and the seasonal VPD changes showed the greatest increase in spring (12.3%), followed by 6.9% in autumn, while summer showed the smallest change of 6.7% (Figure 4). Thus, on seasonal timescales, spring and autumn became warmer and drier during the warming hiatus period, and summer changed little.

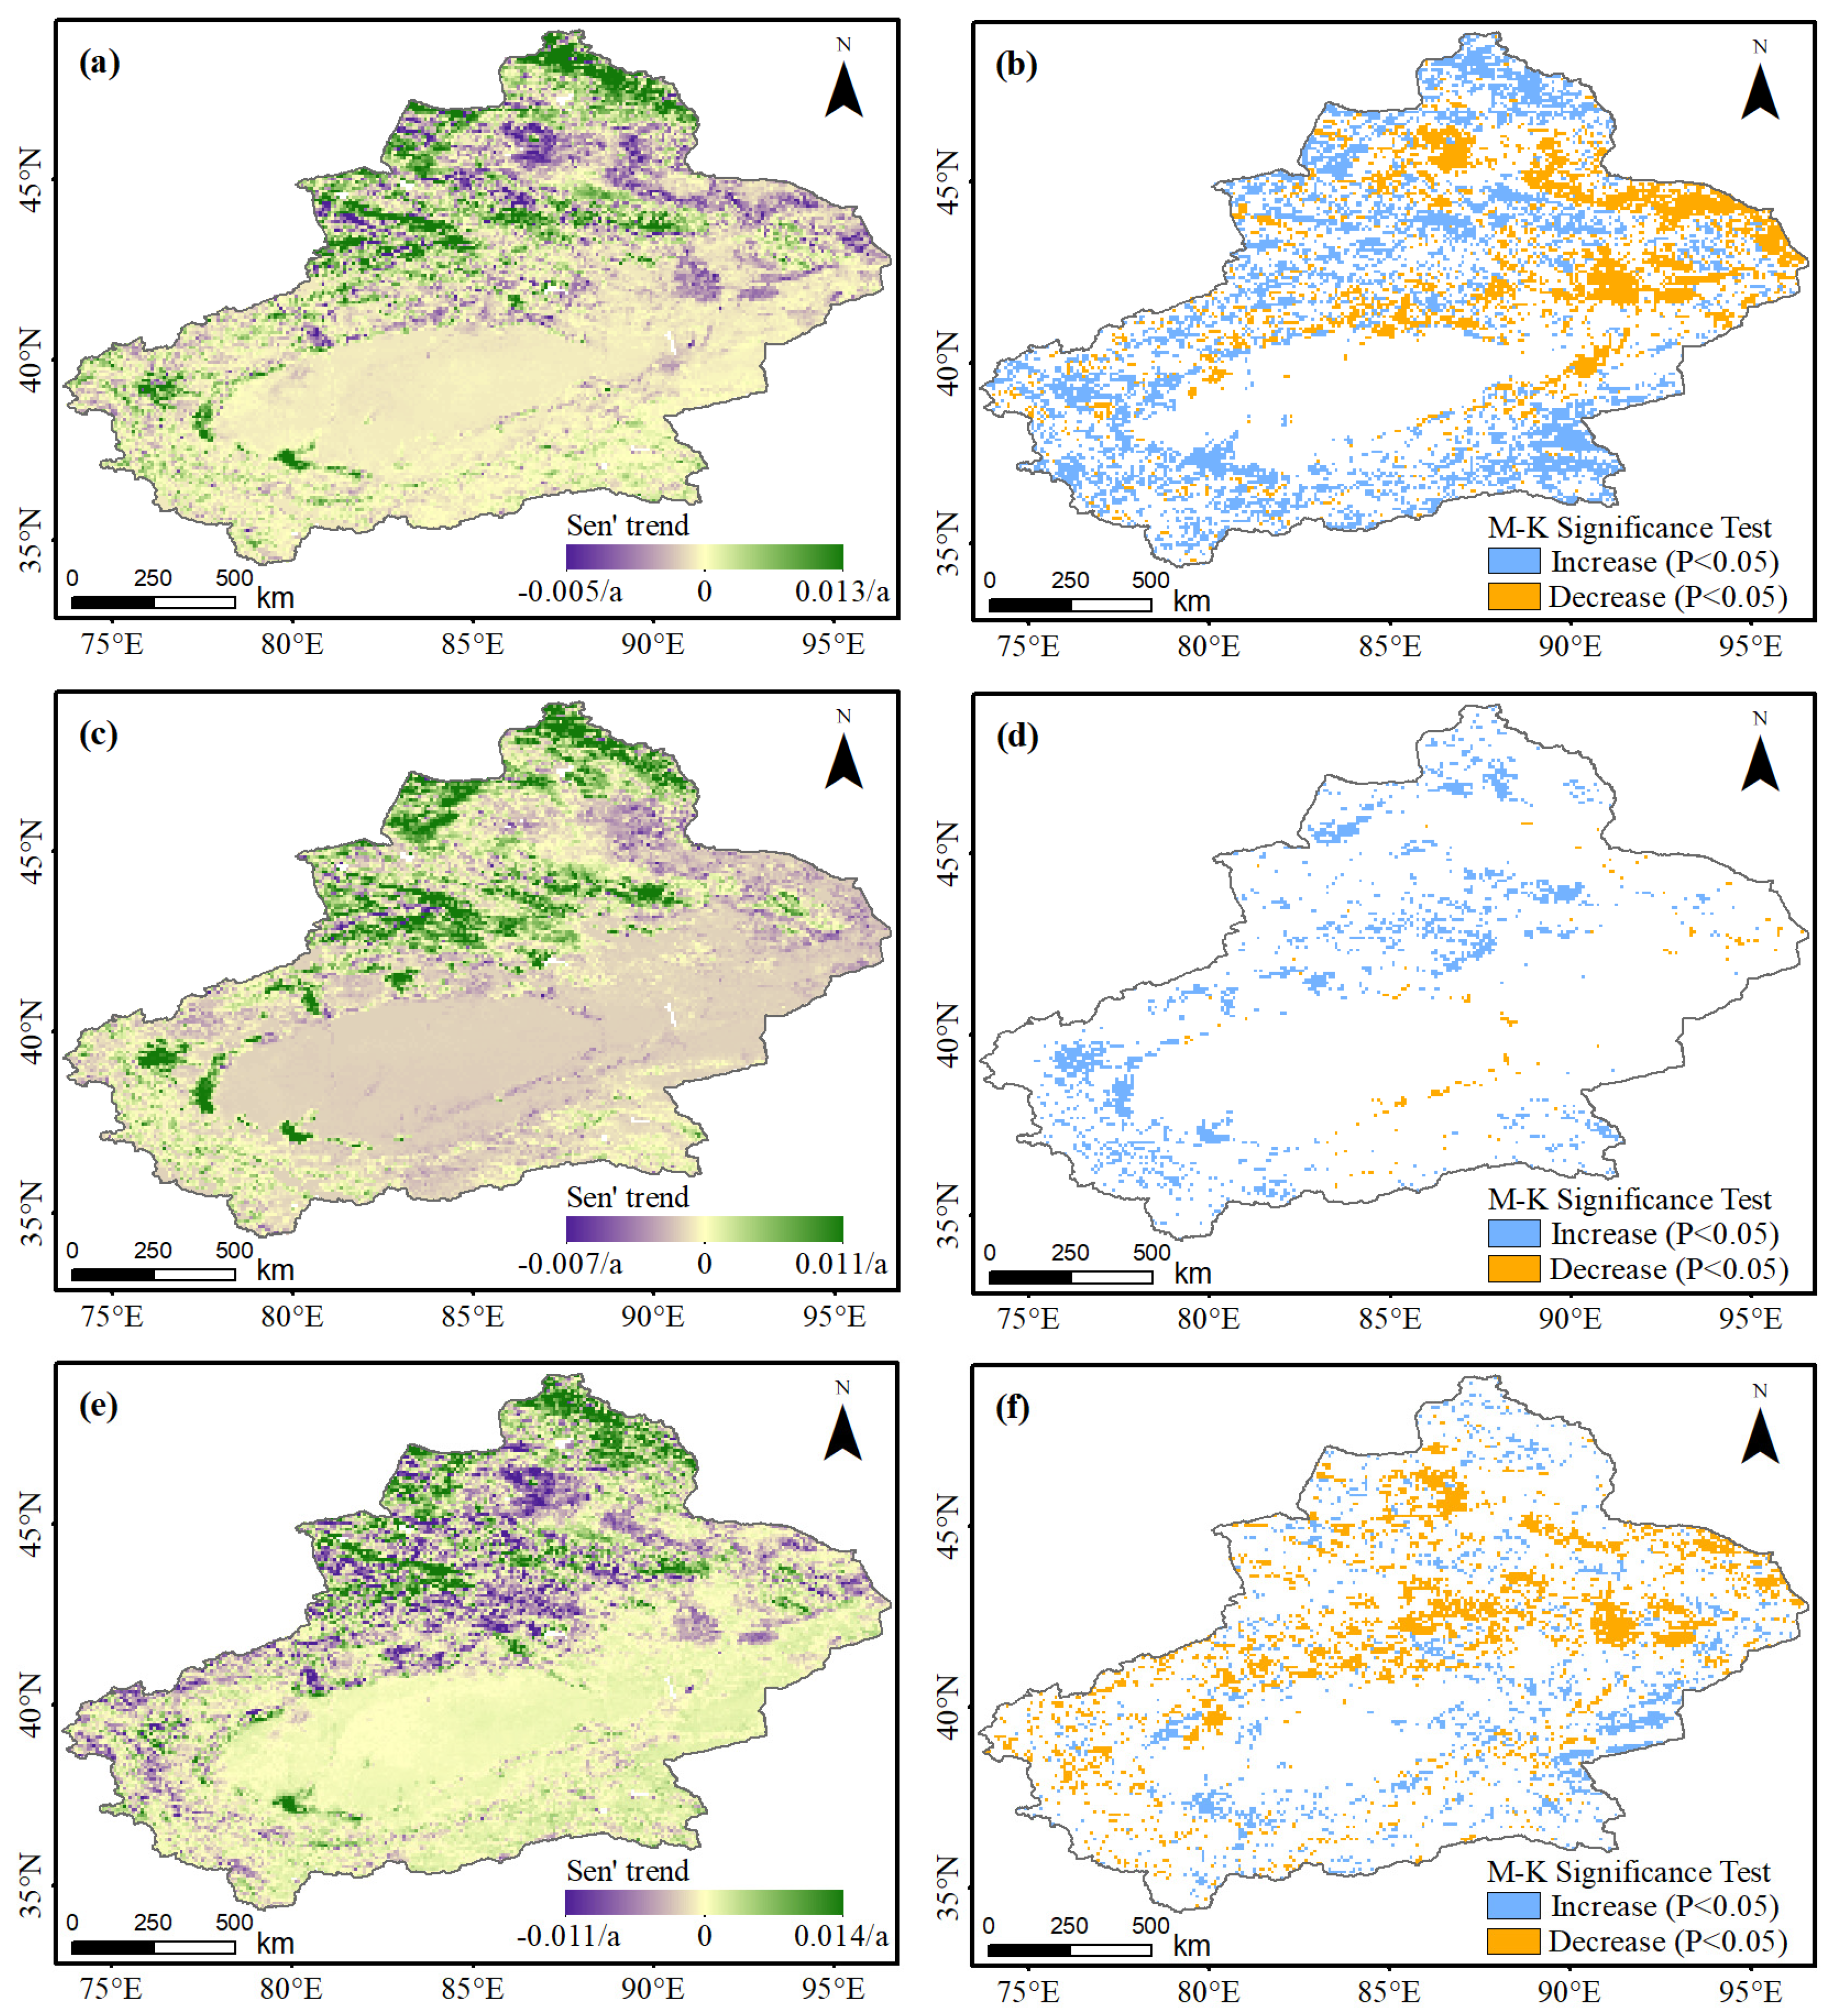
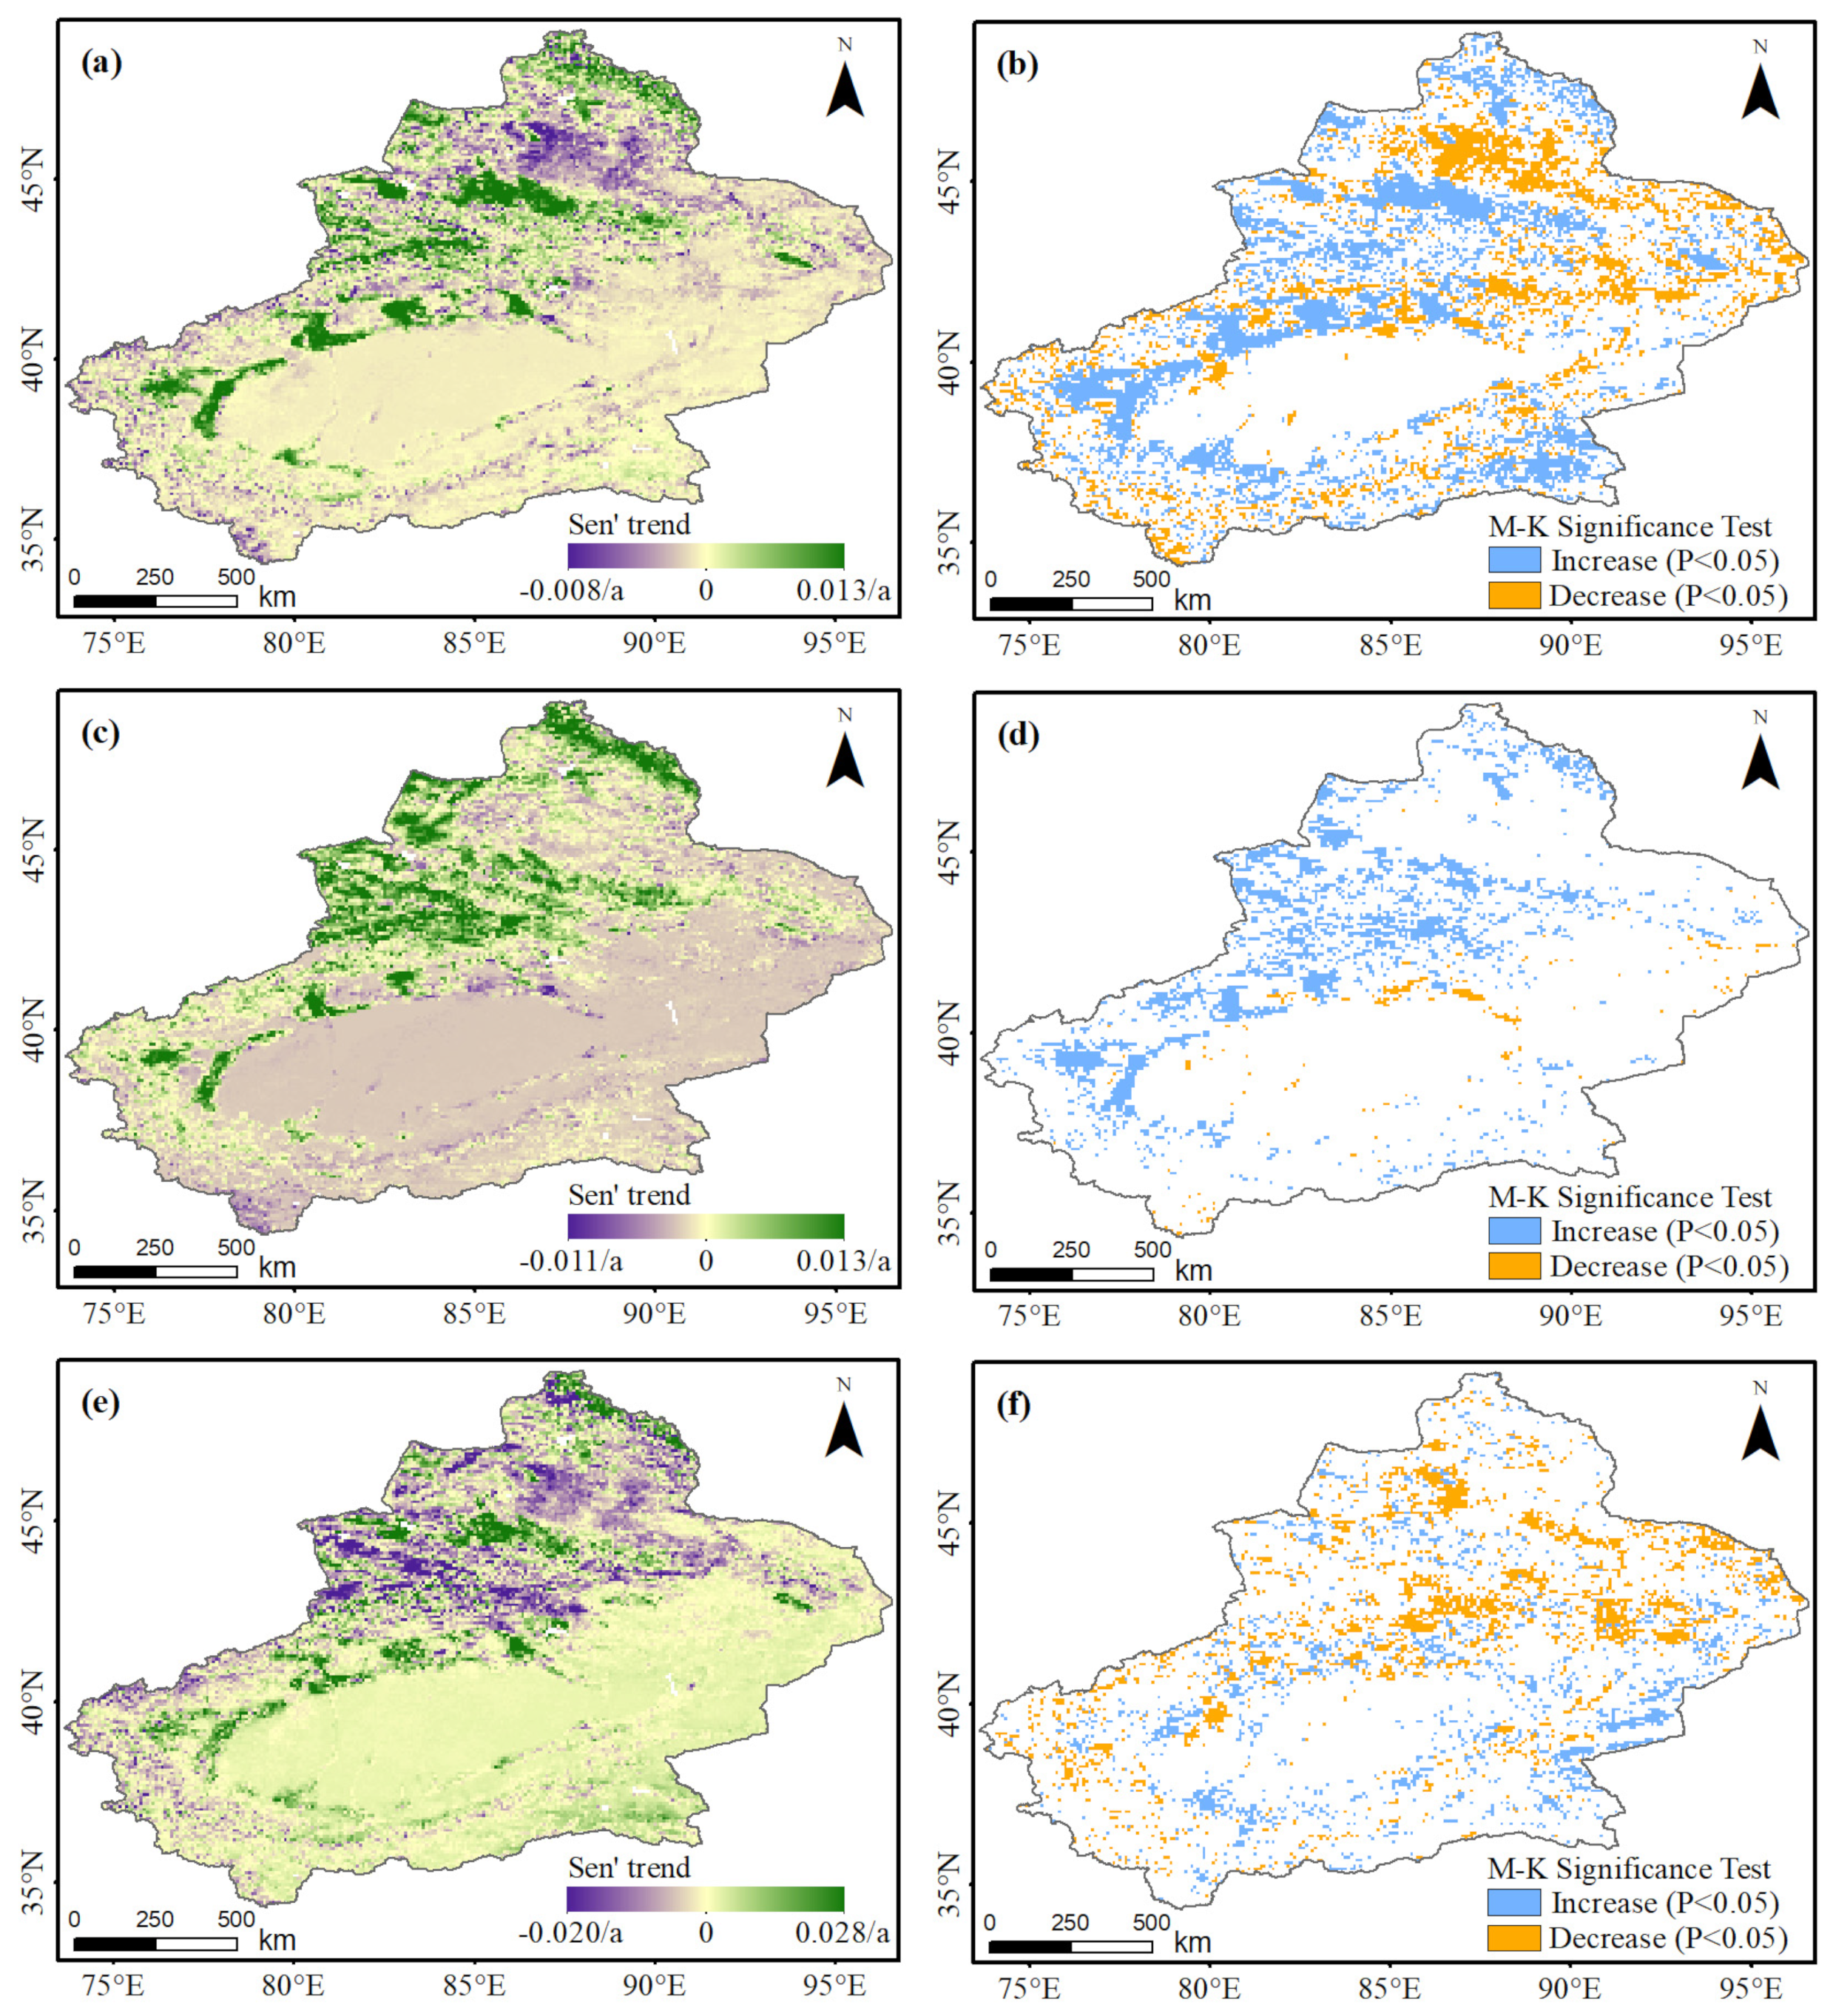
3.2. Vegetation Browning Trends Based on Remote Sensing Data

The monthly vegetation NDVI for each grid cell in Xinjiang during 1982–2015 was estimated using the satellite-derived GIMMS3g dataset. To determine the effects of the warming hiatus (1998–2012) on vegetation change, we investigated NDVI trends in Xinjiang before and after 1998. The average vegetation NDVI and temperature trends in Xinjiang before 1998, after 1998, and during the warming hiatus periods, are shown in Figure 5 and Table 1.
The annual NDVI showed a significant greening trend of 0.004/decade (p < 0.01) before 1998 but had an insignificant browning trend during 1998–2015 (slope = −0.001/decade, p > 0.1), and an NDVI browning rate of −0.002/decade occurred during the warming hiatus period (Figure 5a). Seasonally, the greatest greening rate of 0.007/decade (p < 0.01) occurred in summer, followed by a considerable greening rate of 0.06/decade (p < 0.01) in autumn, and 0.04/decade (p < 0.01) in spring during 1982–1998 (Figure 5b–d, Table 1).
During the warming hiatus period, the reductions in the spring and autumn NDVI, −0.002/decade and −0.003/decade (p > 0.05), respectively, were much weaker and insignificant (Figure 5b,d, Table 1). However, the summer NDVI increased significantly, with a greening rate of 0.001/decade (p < 0.05) (Figure 4c, Table 1). We also examined the annual and seasonal warming rates (Figure 5). During 1998–2012, the average temperature warming rates reversed at the annual scale (from 0.80 °C/decade to −0.14 °C/decade) and decreased in spring and autumn (from 0.76 °C/decade to 0.52 °C/decade and from 0.93 °C/decade to 0.14 °C/decade, respectively) but continuously increased in summer (from 0.17 °C/decade to 0.22 °C/decade) (Figure 5, Table 1).
The spatial patterns of the vegetation NDVI were also compared before and during the warming hiatus (Figure 6 and Figure 7). During 1982–1998, approximately 80% of the vegetation-covered area in Xinjiang exhibited a greening trend in spring (Figure 6c,d). In comparison, the greening trend of the spring NDVI reversed in southern Xinjiang, the Junggar Basin, and parts of the Tianshan Mountains, where a significant spring NDVI browning trend occurred during the warming hiatus (Figure 6e,f). In addition, the spring NDVI significantly increased between 1998 and 2012 in the mountainous areas, mainly in the Altay Mountains, northern Tianshan Mountains, and part of the Ili River valley, where there is abundant snowfall in winter.
In comparison, the NDVI greening trends in autumn were larger than those in spring during 1982–1998, and almost all vegetation-covered areas in Xinjiang exhibited a greening trend in autumn (Figure 7c,d). However, the autumn NDVI showed a significant browning trend during the warming hiatus, and the NDVI browning trend in autumn was greater than that in spring. The browning NDVI area was mainly found in the Tianshan Mountains, northern Xinjiang, and the Kunlun Mountains, which are dominated by natural vegetation (Figure 7e,f). The most dominant vegetation cover type is grassland, which is mainly driven by climate factors. In addition, the autumn NDVI greening trend during 1998–2012 was generally found in the artificial vegetation area, including the northern slope of the Tianshan Mountains and the lower Tarim River Basin.
The lower Tarim River is an ecologically fragile region due to its sensitivities to climate variations and anthropogenic activities. Due to the intensified human influence, a serious decline in vegetation cover occurred in the lower Tarim River during the recent 30 years. The autumn NDVI also showed a significant browning trend in the lower Tarim River during 1982–1998 (Figure 7c,d). The Chinese government has implemented the ecological water diversion project (EWDP) since 2000 to restore the riparian vegetation in the lower Tarim River. To evaluate the ecological effects of EWDP, Figure 8 shows the time series of the vegetation area and total water conveyance volume over the lower Tarim River from 2000 to 2015 corresponding to the 15 ecological water deliveries. Until the end of 2015, the total water conveyance volume reached 51.11 × 10⁸ m3 (Figure 8). The vegetation processes significantly responded to the water conveyance, the NDVI of the lower Tarim River increased by 28.6%, and the vegetation area increased by 161.2% from 2000 to 2015 (Figure 8).

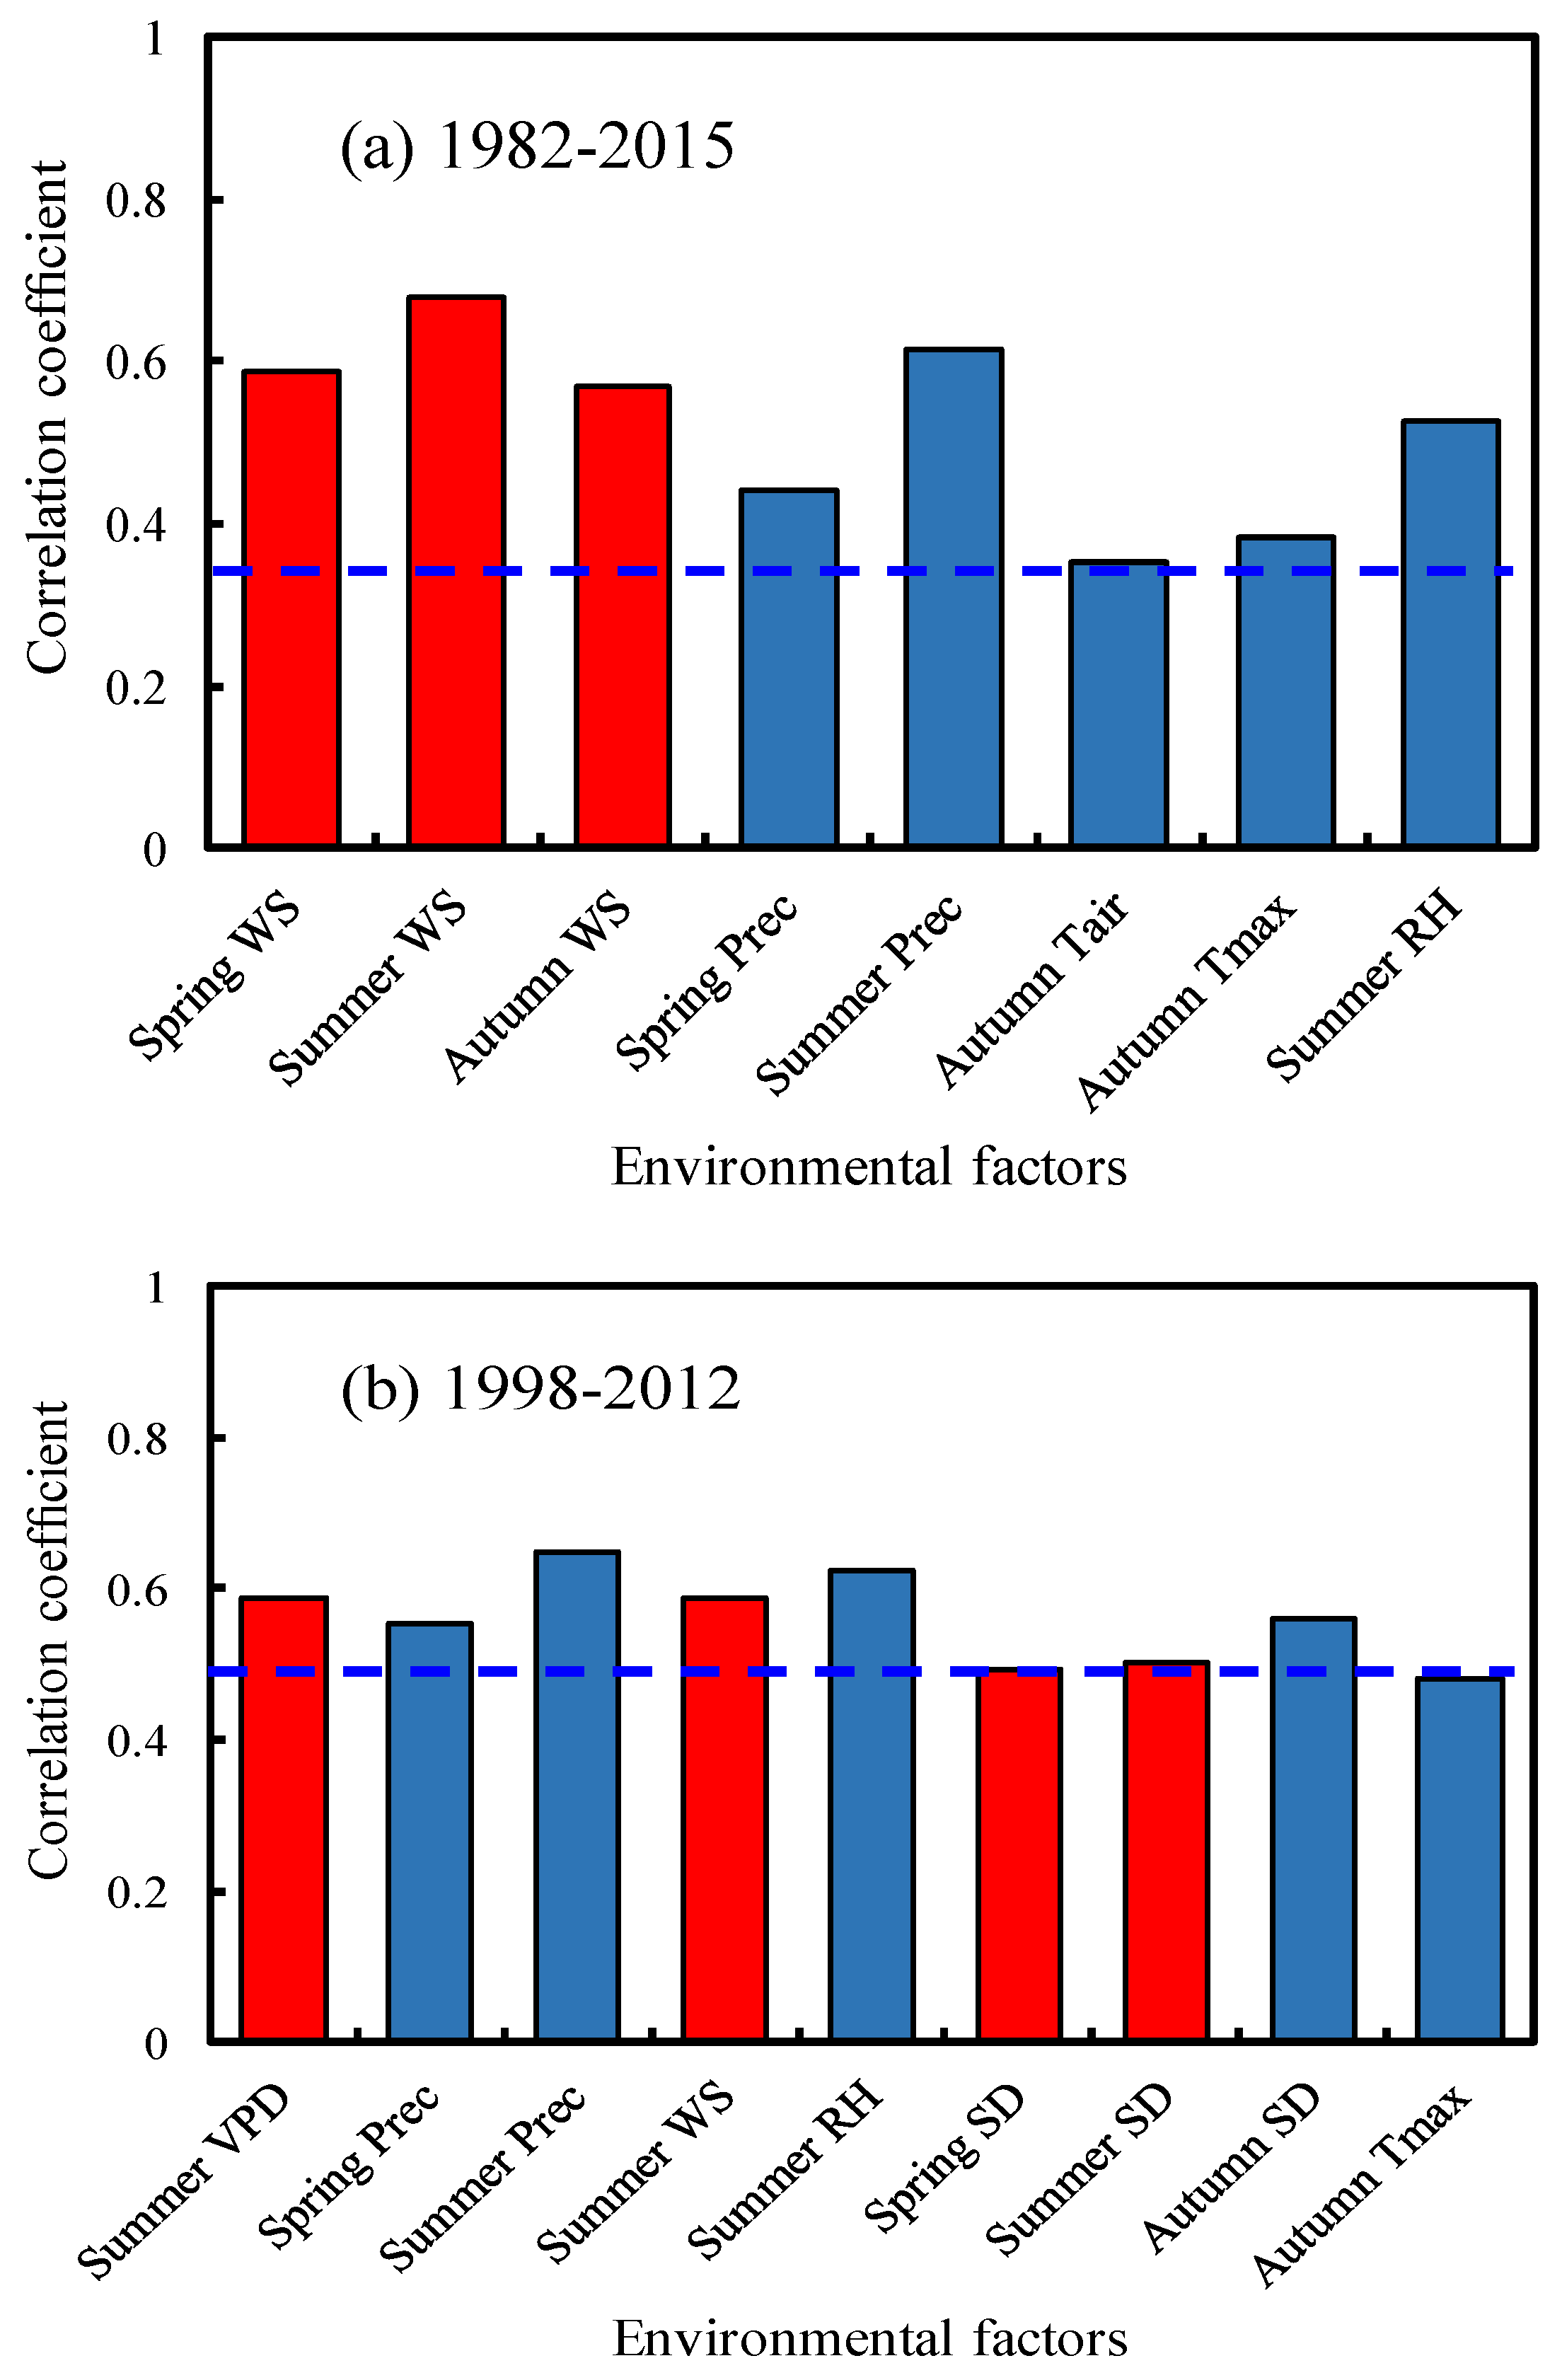
3.3. Climatic Controls of Vegetation NDVI

To examine the effects of climatic factors on vegetation change, we calculated the correlation coefficients between seasonal climatic factors (Tair, Tmax, Tmin, Prec, RH, WS, and SD) and vegetation NDVI in Xinjiang for the 1982–2015, and warming hiatus periods. For the spring vegetation NDVI, we used spring and winter climatic factors, and spring, summer, and autumn climatic factors were used for the autumn vegetation NDVI. The influence of climatic factors on vegetation change varied greatly among the seasonal scales. Generally, the spring NDVI displayed a higher correlation with climatic factors than did the autumn NDVI (Figure 9 and Figure 10).
For the spring vegetation NDVI during 1982–2015, the spring air temperature showed the highest correlation among the examined climatic factors, with correlation coefficients of 0.62 with Tair, 0.61 with Tmax, and 0.56 with Tmin, followed by the spring VPD (correlation coefficient of 0.54, p < 0.01) (Figure 9a). During the warming hiatus period, the spring VPD had the highest positive correlation with spring NDVI, followed by spring Tair and Tmax. Moreover, spring precipitation and RH were significantly negatively correlated with spring NDVI compared to any other climatic factor (Figure 9b). The spring browning NDVI area was mainly found in the alpine regions. Spring precipitation is mainly in the form of snowfall in alpine regions of Xinjiang, and snow cover is an essential component of alpine land cover [44]. Snow cover phenology has a strong control on alpine vegetation dynamics, for example, the length of snowing days and snowmelt dates have a significant impact on the NDVI variation in spring over large areas [45]. In summary, spring climatic factors (e.g., air temperature and VPD) were the main controlling factors of the spring NDVI.
Among the various factors, summer precipitation, and RH had the highest correlation with autumn vegetation NDVI during the 1982–2015 and warming hiatus periods, and antecedent and contemporaneous WS were significantly negatively correlated with autumn NDVI during 1982–2015 (Figure 10a,b). The correlation between temperature and NDVI in autumn was much weaker than that in spring. In addition, summer VPD was significantly negatively correlated with autumn NDVI for the warming hiatus period (Figure 10b). Thus, summer climatic factors (e.g., VPD, WS, RH, and precipitation) were significantly correlated with the autumn NDVI.
To illustrate the joint controls of the multiple climatic factors on NDVI change, we used PCA to determine the relationship between vegetation NDVI and climatic factors during the warming hiatus period. Spring temperature (Tair and Tmax) had the highest partial correlation with spring NDVI, while summer precipitation had the highest partial correlation with autumn NDVI. Climatic factors displayed a larger effect on autumn NDVI than spring NDVI. These results were generally like those based on univariate correlation analysis.

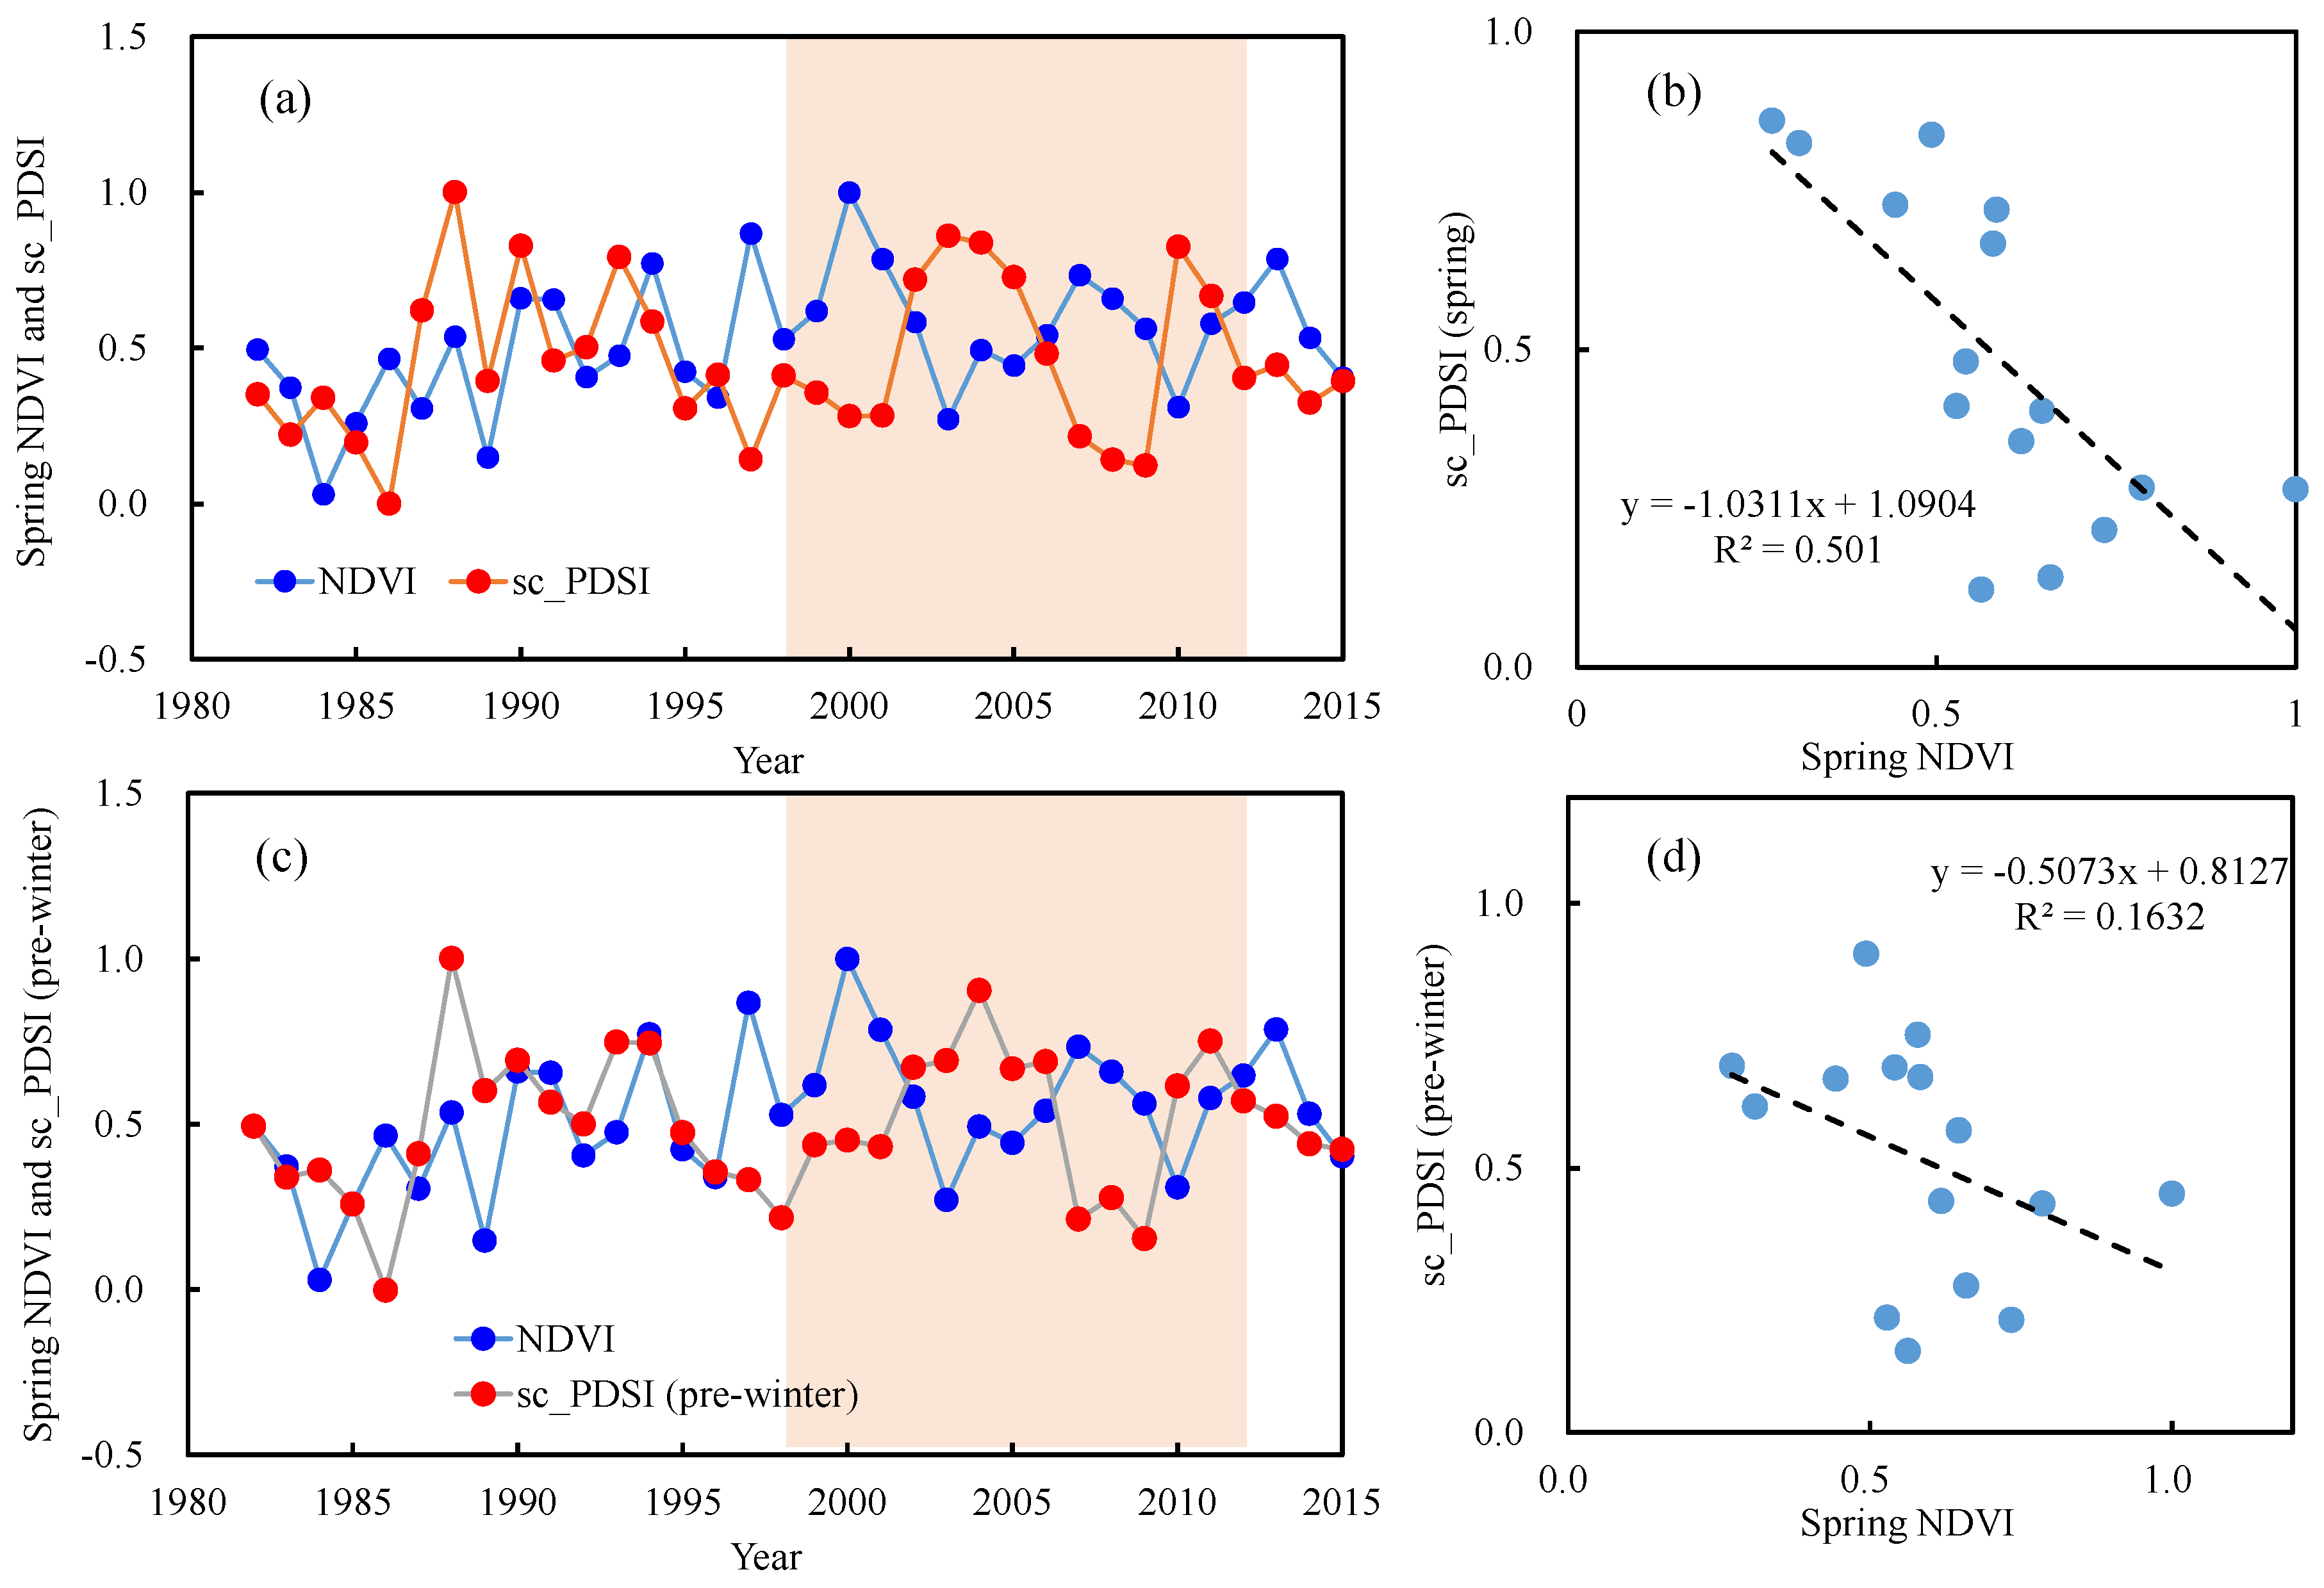
3.4. Impacts of Changes in Drought on Vegetation NDVI
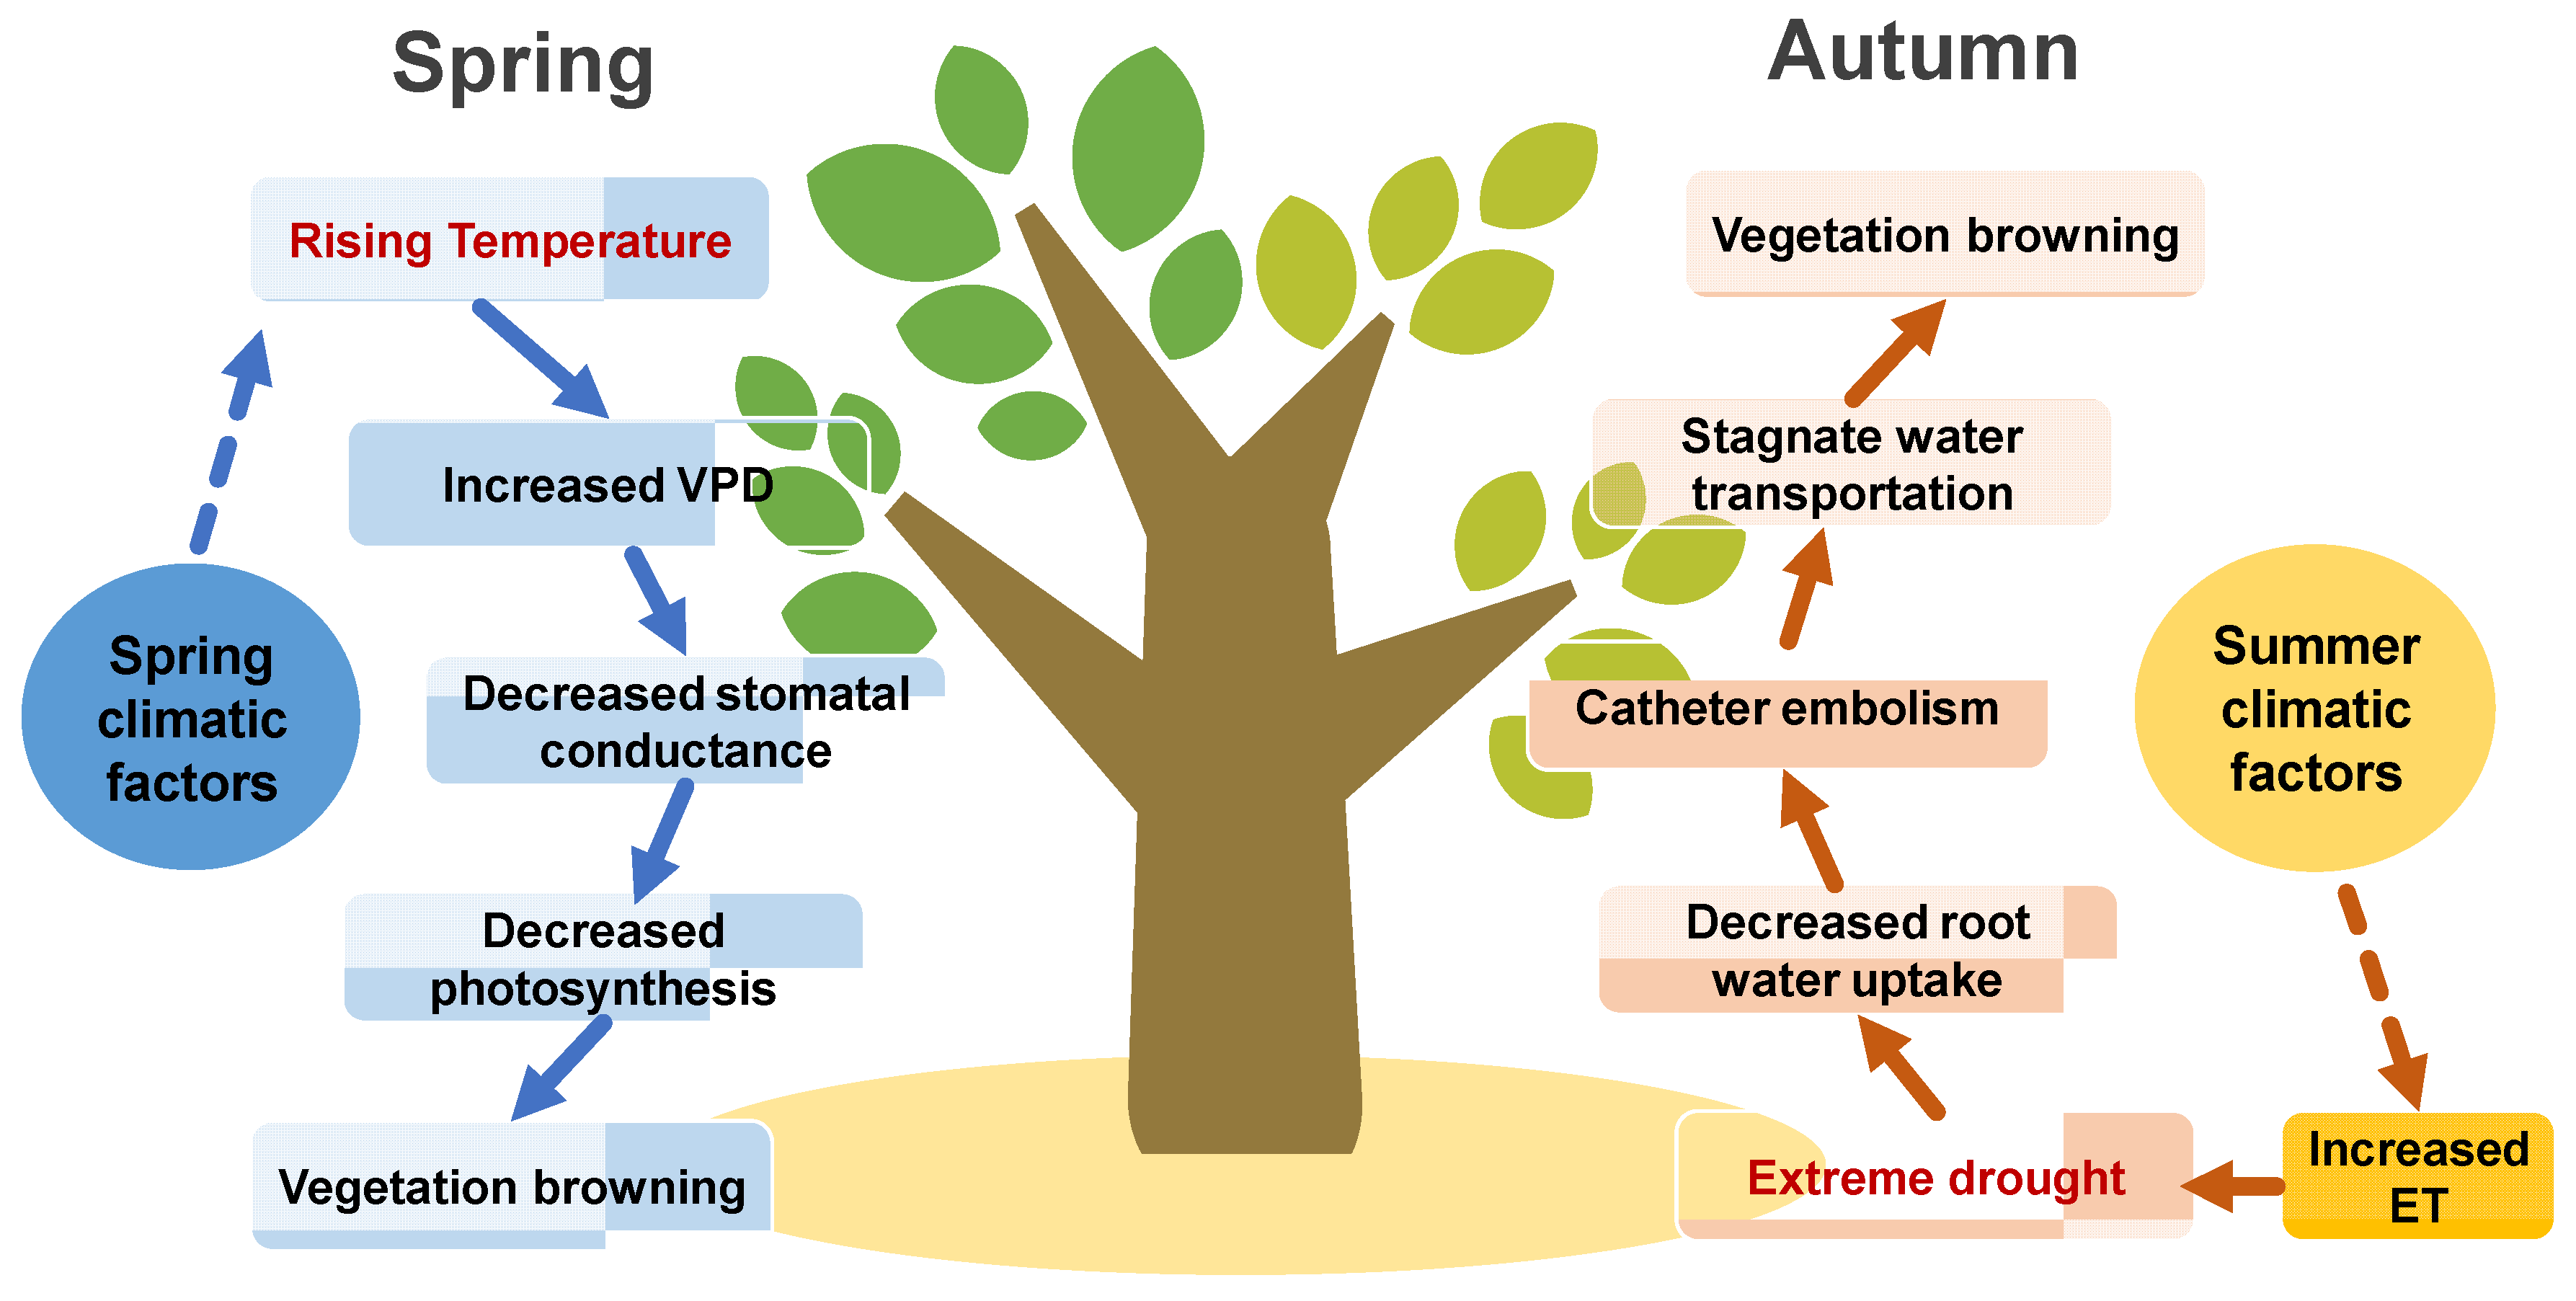
To investigate the effects of dry and wet conditions on vegetation NDVI changes, we examined the correlation coefficients between vegetation detrended NDVI and the drought index (sc_PDSI). The vegetation NDVI semi-arid regions tend to respond to drought at longer time scales [46]. For this purpose, we used the sc_PDSI, which has been reasonably successful at quantifying long-term drought [47], as it uses surface air temperature and a physical water balance model, and can capture the basic effect of global warming on drought through changes in potential evapotranspiration [47]. The procedure followed to calculate the correlations between the standardized vegetation NDVI series in spring and autumn and the series of the sc_PDSI series, which are illustrated in Figure 11 and Figure 12. For the spring NDVI, we used the spring and winter of the year before (pre-winter) sc_PDSI, and the summer and autumn sc_PDSI were used for autumn NDVI. The effects of dry and wet conditions on vegetation NDVI change varied greatly between the spring and autumn. Generally, the autumn NDVI showed a higher correlation with dry and wet conditions than the spring NDVI during 1982–2015 (Figure 11 and Figure 12).
During 1982–2015, the spring NDVI had a slight negative correlation with spring sc_PDSI (CC = −0.16, p > 0.05) and an insignificant positive correlation with pre-winter sc_PDSI (CC = 0.14, p > 0.05) (Figure 11). However, the spring NDVI was significantly negatively correlated with spring sc_PDSI (CC = −0.71, p < 0.01) and slightly negatively correlated with pre-winter sc_PDSI (CC = −0.40, p > 0.05) during the warming hiatus (1998–2012) (Figure 11). In summary, dry and wet conditions in spring and pre-winter were not the key factors controlling spring vegetation changes. For the autumn NDVI during 1982–2015, the summer sc_PDSI showed a higher correlation (CC = 0.37, p < 0.05), followed by autumn sc_PDSI (CC = 0.33, p > 0.05) (Figure 12). However, the correlation between the autumn NDVI and summer (autumn) sc_PDSI during the warming hiatus was much weaker than that during 1982–2015. Thus, dry and wet conditions in summer were key factors controlling autumn vegetation changes.

4. Discussion

Based on satellite-derived vegetation records (GIMMS3g-NDVI), a significant greening trend was observed in our study during 1982–1998, and an insignificant browning trend during 1998–2015. Many studies based on satellite records indicated vegetation greening trends in most of the global vegetation areas before the late 1990s [22,23,24,48], and a recent study showed a pronounced vegetation browning trend over approximately 59% of the global vegetation surface from 1998 to 2015 [22]. Many other studies have reported vegetation greening towards browning in Xinjiang and High Mountain Asia from the late 1990s to the early 2010s [11,12,24,49,50].
Compared to previous studies, we focused on the vegetation change trend in spring and autumn during the recent warming hiatus (1998–2012), which has not been examined in previous studies. According to the definition of the recent warming hiatus, we divided the study period into two shorter periods: before 1998 and after 1998. A previous study using satellite records found that the advancing (or delaying) rate of spring (or autumn) phenology from 2002 to 2012 was faster than that in 1982–1992 [21,51]. Another study using long-term satellite-derived vegetation records and FLUXNET datasets in NH proposed that spring and autumn phenology showed no trends during the global warming hiatus [17]. Our analysis showed that the summer NDVI significantly increased; however, there was an insignificant reduction in the spring and autumn NDVI during the warming hiatus period. We also found that the autumn NDVI browning trend was greater than that in spring. The 56 site FLUXNET database indicated that more records showed significant phenology trends in autumn than in spring [17], and these studies were consistent with our results based on satellite records. We also examined the vegetation change trend in seasons that were consistent with those in seasonal temperature during 1998–2012, and the temperature in spring and autumn decreased but continuously increased in summer.
Our results using the GIMMS NDVI3g database indicated that the vegetation greening trend stalled or reversed during the warming hiatus period. This vegetation browning area is mainly dominated by natural vegetation. In addition, the GIMMS NDVI3g dataset contains uncertainties in data quality, which are caused by noise, sensor degradation, and calibration between different sensors [52].
Many studies have indicated that the spring temperature is the key controlling factor of vegetation change, and rising spring temperatures lead to advancing trends in spring phenology [17,53,54]. Previous studies have also indicated that winter temperature is negatively correlated with spring vegetation NDVI and phenology change [20,55].
Our results suggested that spring NDVI was more largely correlated with spring VPD than with spring temperature during the warming hiatus. Previous studies have shown that an increase in VPD can reduce global vegetation growth [22], and other studies have reported that an increase in VPD is a driver of drought-related forest mortality [56,57]. We also used PCA to confirm that the spring NDVI was mainly dominated by spring temperature, including mean and extreme variables. The VPD represents the difference between saturation vapor pressure (es) and the actual vapor pressure (ea) at a given temperature [43]. Rising air temperatures may increase the es, and the ea is constrained at the upper end by es so that as air temperature increases, so does the maximum amount of water vapor [58]. Thus, higher VPD is driven by rising air temperature following a nonlinear relationship [58]. Li et al. [43] also indicated that the VPD increase in Xinjiang was jointly determined by the increased saturation vapor pressure from rising temperatures and decreased actual vapor pressure. Thus, rising air temperatures resulted in increased VPD, which corresponded to the vegetation browning trend. In addition, our results indicated that spring precipitation was significantly negatively correlated with the spring NDVI. Li et al. [29] found that the reversed trends in NDVI after the late 1990s can be attributed to increased warming and reduced precipitation. Yao et al. [12] found that increased drought severity exacerbated the loss of soil moisture and led to a decreased NDVI. These results are consistent with those of our work during the warming hiatus period.
Compared to spring vegetation NDVI, climatic factors displayed a stronger control on autumn NDVI. Wang et al. [17] also proposed that autumn vegetation growth is determined by a combination of climatic factors and phenology statuses. Richardson et al. [59] reported the effects of temperature on autumn vegetation change and neglected other climatic factors [59]. In contrast, our results indicate that summer climatic factors (e.g., VPD, WS, RH, and precipitation) were significantly correlated with autumn NDVI during the warming hiatus. However, the autumn temperature was weakly correlated with the autumn NDVI. Wang et al. [17] found that temperature, VPD, shortwave radiation, precipitation, and soil moisture had strong effects on autumn vegetation among the 56 FLUXNET sites in the NH. These results emphasize the complexity of the impacts on autumn vegetation changes during the warming hiatus period.
Figure 13 shows the mechanisms of the impact of climatic variables on spring and autumn vegetation growth. Our results provide evidence for the different impacts of climatic variables on spring and autumn NDVI during the warming hiatus periods. The difference in spring and autumn temperature has played a key role in recent decades, and a larger increase in air temperature in spring than in autumn has resulted in increased VPD differences in spring and autumn [60,61]. The VPD and extreme drought stress can trigger vegetation growth retardation through hydraulic failure and carbon starvation [57]. In spring, an increased spring VPD enhances evaporative water loss, which triggers stomatal closure. Increased VPD and reduced stomatal conductance result in restricted plant carbon uptake and productivity and drive widespread vegetation browning [62]. Our study suggests the importance of summer climatic variables in controlling autumn vegetation growth in Xinjiang. The autumn NDVI had a higher correlation with dry and wet conditions. Furthermore, increased ET directly influences soil moisture and causes extreme drought. Soil moisture is a direct reservoir for vegetation, and its deficit plays a large role in autumn vegetation browning in Xinjiang. Extreme drought may decrease the amount of water that can be taken up by plant roots, increase catheter embolism, stagnate water transportation, and can drive vegetation browning.
The AVHRR-based GIMMS3g-NDVI is a fundamental dataset for the study of global vegetation growth and ecosystem processes. Guay et al. [63] compared the long-term NDVI trends in high northern latitudes (>50° N), between the GIMMS3g dataset and four commonly used NDVI datasets. and found that the marked differences were both in mean seasonal NDVI and long-term trends. The vegetation greening was more prominent in GIMMS 3g-NDVI than in the older dataset, especially in the tundra, needle-leaved evergreen and mixed-leaf forests [63,64,65], while the browning was across sizeable areas of boreal forest [66,67]. Consistent with the MODIS record, the spatial patterns of GIMMS 3g-NDVI trends showed roughly half greening and half browning across high northern latitudes [63]. In the High Mountain Asia region, the GIMMS 3g-NDVI showed a browning trend, whereas MODIS and SPOT exhibited a greening trend during 2001–2015 [68]. Thus, it was necessary to provide a comprehensive comparison with different NDVI datasets, as well as to validate these NDVI data against in situ measurements of ecosystem processes.

5. Conclusions

This study focused on the latest changes in spring and autumn vegetation growth in Xinjiang and their climate-driving mechanisms, using satellite-derived vegetation records (GIMMS3g-NDVI) as indicators. The results indicated that the vegetation NDVI showed a significant greening trend during 1982–1998 and an insignificant browning trend during 1998–2015. We focused on the vegetation change trends in spring and autumn during the recent warming hiatus (1998–2012), which had not been examined in previous studies.
During the recent warming hiatus, the summer NDVI increased significantly; however, there were insignificant reductions in the spring and autumn NDVI. The autumn NDVI browning trend in Xinjiang was greater than that in spring. The seasonal vegetation change trend was consistent with the seasonal temperature, and the temperature slowed down in spring and autumn but continuously increased in summer during the warming hiatus.
The correlation coefficients between climatic factors and vegetation NDVI showed that the climatic factors controlling vegetation change varied greatly at the seasonal scale. Spring NDVI displayed a stronger correlation with climatic factors than did the autumn NDVI. During the warming hiatus, the spring VPD had the highest positive correlation with the spring NDVI, followed by spring temperature. In addition, spring precipitation has a significantly negative correlation with the spring NDVI. Thus, spring climatic factors (e.g., air temperature and VPD) were the main controlling factors of the spring NDVI.
Compared to the spring vegetation NDVI, climatic factors displayed a stronger control over the autumn NDVI. Summer climatic factors (e.g., VPD, WS, RH, and precipitation) were significantly correlated with the autumn NDVI during the warming hiatus. However, the autumn temperature was weakly correlated with the autumn NDVI. These results emphasize the complexity of the impacts on autumn vegetation changes during the warming hiatus.
We also provided evidence for the different impacts of climatic variables on spring and autumn vegetation NDVI during the warming hiatus period. The larger increase in air temperature in spring than in autumn resulted in increased VPD differences in spring and autumn. Increased spring VPD can trigger spring vegetation browning through mechanisms of carbon starvation; however, summer drought may decrease the amount of water that can be taken up by plant roots and can drive autumn vegetation browning.

Author Contributions

Conceptualization, M.L., J.Y. and J.Z.; methodology, M.L.; formal analysis, M.L. and J.G.; writing—original draft preparation, M.L.; writing—review and editing, M.L., J.Y., J.G. and J.Z.; funding acquisition, J.Y. and J.Z. All authors have read and agreed to the published version of the manuscript.

Funding

This work was funded by the National Natural Science Foundation of China (U1903113), the Major Program of National Social Science Foundation of China (No. 17ZDA064), and the Xinjiang Tianshan Cedar Project (No. 2020XS04).

Institutional Review Board Statement

Not applicable.

Informed Consent Statement

Not applicable.

Data Availability Statement

The data presented in this study are available on request from the corresponding author or the reference website.

Acknowledgments

We thank “anonymous” reviewers for their original insights. We are also immensely grateful to the editor for their comments on the manuscript.

Conflicts of Interest

The authors declare no conflict of interest.

References

  1. IPCC. Climate change 2013: The physical science basis. In Contribution of Working Group I to the Fifth Assessment Report of the Intergovernmental Panel on Climate Change; Stocker, T.F., Qin, D., Plattner, G.K., Tignor, M., Allen, S.K., Boschung, J., Nauels, A., Xia, Y., Bex, V., Midgley, P.M., Eds.; Cambridge University Press: Cambridge, UK; New York, NY, USA, 2013. [Google Scholar]
  2. Fyfe, J.; Gillett, N.; Zwiers, F. Overestimated global warming over the past 20 years. Nat. Clim. Chang. 2013, 3, 767–769. [Google Scholar] [CrossRef]
  3. Kosaka, Y.; Xie, S.P. Recent global-warming hiatus tied to equatorial Pacific surface cooling. Nature 2013, 501, 403–407. [Google Scholar] [CrossRef] [PubMed] [Green Version]
  4. England, M.H.; McGregor, S.; Spence, P.; Meehl, G.A.; Timmermann, A.; Cai, W.; Gupta, A.S.; McPhaden, M.J.; Purich, A.; Santoso, A. Recent intensification of wind-driven circulation in the Pacific and the ongoing warming hiatus. Nat. Clim. Chang. 2014, 4, 222–227. [Google Scholar] [CrossRef]
  5. Meehl, G.A.; Teng, H.; Arblaster, J.M. Climate model simulations of the observed early-2000s hiatus of global warming. Nat. Clim. Chang. 2014, 4, 898–902. [Google Scholar] [CrossRef] [Green Version]
  6. Trenberth, K.E.; Fasullo, J.T.; Branstator, G.; Phillips, A.S. Seasonal aspects of the recent pause in surface warming. Nat. Clim. Chang. 2014, 4, 911–916. [Google Scholar] [CrossRef] [Green Version]
  7. Dai, A.; Fyfe, J.C.; Xie, S.P.; Dai, X. Decadal modulation of global surface temperature by internal climate variability. Nat. Clim. Chang. 2015, 5, 555–559. [Google Scholar] [CrossRef]
  8. Guan, X.; Huang, J.; Guo, R.; Lin, P. The role of dynamically induced variability in the recent warming trend slowdown over the Northern Hemisphere. Sci. Rep. 2015, 5, 12669. [Google Scholar] [CrossRef] [Green Version]
  9. Guemas, V.; Doblas-Reyes, F.J.; Andreu-Burillo, I.; Asif, M. Retrospective prediction of the global warming slowdown in the past decade. Nat. Clim. Chang. 2013, 3, 649–653. [Google Scholar] [CrossRef]
  10. Li, Q.; Yang, S.; Xu, W.; Wang, X.L.; Jones, P.; Parker, D.; Zhou, L.; Feng, Y.; Gao, Y. China experiencing the recent warming hiatus. Geophys. Res. Lett. 2015, 42, 889–898. [Google Scholar] [CrossRef]
  11. Chen, Y.N.; Li, Z.; Fan, Y.; Wang, H.; Deng, H. Progress and prospects of climate change impacts on hydrology in the arid region of northwest China. Environ. Res. 2016, 139, 11–19. [Google Scholar] [CrossRef]
  12. Yao, J.; Zhao, Y.; Chen, Y.; Yu, X.; Zhang, R. Multi-scale assessments of droughts: A case study in Xinjiang, China. Sci. Total Environ. 2018, 630, 444–452. [Google Scholar] [CrossRef]
  13. Walther, G.R.; Post, E.; Convey, P.; Menzel, A.; Parmesan, C.; Beebee, T.J.; Fromentin, J.M.; Guldberg, O.H.; Bairlein, F. Ecological responses to recent climate change. Nature 2002, 416, 389–395. [Google Scholar] [CrossRef]
  14. Osborne, C.; Chuine, I.; Viner, D.; Woodward, F. Olive phenology as a sensitive indicator of future climatic warming in the Mediterranean. Plant Cell Environ. 2000, 23, 701–710. [Google Scholar] [CrossRef] [Green Version]
  15. Keenan, T.F.; Gray, J.; Friedl, M.A.; Toomey, M.; Bohrer, G.; Hollinger, D.Y.; Munger, J.W.; O’Keefe, J.; Schmid, H.P.; Wing, I.S.; et al. Net carbon uptake has increased through warming-induced changes in temperate forest phenology. Nat. Clim. Chang. 2014, 4, 598–604. [Google Scholar] [CrossRef]
  16. Fu, Y.H.; Zhao, H.; Piao, S.; Peaucelle, M.; Peng, S.; Zhou, G.; Ciais, P.; Huang, M.; Menzel, A.; Peñuelas, J.; et al. Declining global warming effects on the phenology of spring leaf unfolding. Nature 2015, 526, 104–107. [Google Scholar] [CrossRef] [Green Version]
  17. Wang, X.; Xiao, J.; Li, X.; Cheng, G.; Ma, M.; Zhu, G.; Altaf Arain, M.; Andrew Black, T.; Rachhpal, S.J. No trends in spring and autumn phenology during the global warming hiatus. Nat. Commun. 2019, 10, 2389. [Google Scholar] [CrossRef]
  18. Kaufmann, R.K.; Zhou, L.; Tucker, C.J.; Slayback, D.; Shabanov, N.V.; Myneni, R.B. Reply to Comment on ‘Variations in northern vegetation activity inferred from satellite data of vegetation index during 1981–1999 by JR Ahlbeck. J. Geophys. Res. 2002, 107, 10-1029. [Google Scholar] [CrossRef]
  19. Menzel, A.; Sparks, T.H.; Estrella, N.; Koch, E.; Aasa, A.; Ahas, R.; Alm-Kübler, K.; Bissolli, P.; Braslavská, O.G.; Briede, A.; et al. European phenological response to climate change matches the warming pattern. Glob. Chang. Biol. 2006, 12, 1969–1976. [Google Scholar] [CrossRef]
  20. Körner, C.; Basler, D. Phenology under global warming. Science 2010, 327, 1461–1462. [Google Scholar] [CrossRef]
  21. Wang, S.; Yang, B.; Yang, Q.; Lu, L.; Wang, X.; Peng, Y. Temporal trends and spatial variability of vegetation phenology over the Northern Hemisphere during 1982–2012. PLoS ONE 2016, 11, e0157134. [Google Scholar] [CrossRef]
  22. Yuan, W.; Zheng, Y.; Piao, S.; Ciais, P.; Lombardozzi, D.; Wang, Y.; Ryu, Y.; Chen, G.; Dong, W.; Hu, Z.; et al. Increased atmospheric vapor pressure deficit reduces global vegetation growth. Sci. Adv. 2019, 5, eaax1396. [Google Scholar] [CrossRef] [PubMed] [Green Version]
  23. Piao, S.; Yin, G.; Tan, J.; Cheng, L.; Huang, M.; Li, Y.; Liu, R.; Mao, J.; Myneni, R.B.; Peng, S.; et al. Detection and attribution of vegetation greening trend in China over the last 30 years. Glob. Chang. Biol. 2015, 21, 1601–1609. [Google Scholar] [CrossRef] [PubMed]
  24. Liu, Y.; Li, Z.; Chen, Y.N. Continuous warming shift greening towards browning in the southeast and northwest high mountain Asia. Sci. Rep. 2021, 11, 17920. [Google Scholar] [CrossRef] [PubMed]
  25. Donohue, R.J.; Roderick, M.L.; McVicar, T.R.; Farquhar, G.D. Impact of CO2 fertilization on maximum foliage cover across the globe’s warm, arid environments. Geophys. Res. Lett. 2013, 40, 3031–3035. [Google Scholar] [CrossRef] [Green Version]
  26. Fensholt, R.; Langanke, T.; Rasmussen, K.; Reenberg, A.; Prince, S.D.; Tucker, C.; Scholes, R.J.; Le, Q.B.; Bondeau, A.; Eastman, R.; et al. Greenness in semi- arid areas across the globe 1981–2007—An Earth Observing Satellite based analysis of trends and drivers. Remote Sens. Environ. 2012, 121, 144–158. [Google Scholar] [CrossRef]
  27. Andela, N.; Liu, Y.Y.; van Dijk, A.I.J.M.; de Jeu, R.A.M.; McVicar, T.R. Global changes in dryland vegetation dynamics (1988–2008) assessed by satellite remote sensing: Comparing a new passive microwave vegetation density record with reflective greenness data. Biogeosciences 2013, 10, 6657–6676. [Google Scholar] [CrossRef] [Green Version]
  28. Piao, S.; Wang, X.; Park, T.; Chen, C.; Lian, X.U.; He, Y.; Bjerke, J.W.; Chen, A.; Ciais, P.; Tømmervik, H.; et al. Characteristics, drivers and feedbacks of global greening. Nat. Rev. Earth Environ. 2020, 1, 14–27. [Google Scholar] [CrossRef]
  29. Li, Z.; Chen, Y.; Li, W.; Deng, H.; Fang, G. Potential impacts of climate change on vegetation dynamics in Central Asia. J. Geophys. Res. Atmos. 2015, 120, 12345–112356. [Google Scholar] [CrossRef]
  30. Yao, J.; Chen, Y.; Chen, J.; Zhao, Y.; Tuoliewubieke, D.; Li, J.; Yang, L.M.; Mao, W. Intensification of extreme precipitation in arid Central Asia. J. Hydrol. 2021, 598, 125760. [Google Scholar] [CrossRef]
  31. Yao, J.Q.; Chen, Y.N.; Zhao, Y.; Mao, W.; Xu, X.; Liu, Y.; Yang, Q. Response of vegetation NDVI to climatic extremes in the arid region of Central Asia: A case study in Xinjiang, China. Theor. Appl. Climatol. 2018, 131, 1503–1515. [Google Scholar] [CrossRef]
  32. Yao, J.; Chen, Y.; Zhao, Y.; Guan, X.; Mao, W.; Yang, L. Climatic and associated atmospheric water cycle changes over the Xinjiang, China. J. Hydrol. 2020, 585, 124823. [Google Scholar] [CrossRef]
  33. Zhu, Y.N.; Cao, L.J.; Tang, G.L.; Zhou, Z.J. Homogenization of Surface Relative Humidity over China. Adv. Clim. Chang. Res. 2015, 11, 379–386. [Google Scholar] [CrossRef]
  34. Li, Z.; Yan, Z.W.; Zhu, Y.N.; Freychet, N.; Tett, S. Homogenized daily relative humidity series in China during 1960–2017. Adv. Atmos. Sci. 2020, 37, 318–327. [Google Scholar] [CrossRef] [Green Version]
  35. Barichivich, J.; Osborn, T.J.; Harris, I.; van der Schrier, G.; Jones, P.D. Drought [in “State of the Climate in 2018”]. Bull. Am. Meteorol. Soc. 2019, 100, S1–S306. [Google Scholar] [CrossRef] [Green Version]
  36. Van der Schrier, G.; Barichivich, J.; Briffa, K.R.; Jones, P.D. A scPDSI-based global data set of dry and wet spells for 1901–2009. J. Geophys. Res. Atmos. 2013, 118, 4025–4048. [Google Scholar] [CrossRef]
  37. Barichivich, J.; Osborn, T.J.; Harris, I.; van der Schrier, G.; Jones, P.D. Drought [in “State of the Climate in 2019”]. Bull. Am. Meteorol. Soc. 2020, 101, S1–S429. [Google Scholar] [CrossRef]
  38. Pinzon, J.E.; Tucker, C.J. A non-stationary 1981–2012 AVHRR NDVI 3g time series. Remote Sens. 2014, 6, 6929–6960. [Google Scholar] [CrossRef] [Green Version]
  39. Allen, R.G.; Pereira, L.S.; Raes, D.; Smith, M. Crop Evapotranspiration—Guidelines for Computing Crop Water Requirements-FAO Irrigation and Drainage Paper 56. 300; FAO: Rome, Italy, 1998; p. 6541. [Google Scholar]
  40. Mann, H.B. Non-Parametric Test Against Trend. Econometrica 1945, 13, 245–259. [Google Scholar] [CrossRef]
  41. Kendall, M.G. Rank Correlation Methods, 4th ed.; Charles Grifin: London, UK, 1975. [Google Scholar]
  42. Yadolah, D. The Concise Encyclopedia of Statistics; Springer: New York, NY, USA, 2008. [Google Scholar]
  43. Li, M.; Yao, J.Q.; Guan, J.Y.; Zheng, J.H. Observed changes in vapor pressure deficit suggest a systematic drying of the atmosphere in Xinjiang of China. Atmos. Res. 2020, 248, 105199. [Google Scholar] [CrossRef]
  44. Yao, J.; Chen, Y.; Guan, X.; Zhao, Y.; Chen, J.; Mao, W. Recent climate and hydrological changes in a mountain—Basin system in Xinjiang, China. Earth-Sci. Rev. 2022, 226, 103957. [Google Scholar] [CrossRef]
  45. Wang, X.; Wu, C.; Peng, D.; Gonsamo, A.; Liu, Z. Snow cover phenology affects alpine vegetation growth dynamics on the Tibetan Plateau: Satellite observed evidence, impacts of different biomes, and climate drivers. Agric. For. Meteorol. 2018, 256, 61–74. [Google Scholar] [CrossRef]
  46. Vicente-Serrano, S.M.; Gouveia, C.; Camarero, J.J.; Beguería, S.; Trigo, R.; López-Moreno, J.; Azorín-Molina, C.; Pasho, E.; Lorenzo-Lacruz, J.; Revuelto, J.; et al. Response of vegetation to drought time-scales across global land biomes. Proc. Natl. Acad. Sci. USA 2013, 110, 52–57. [Google Scholar] [CrossRef] [Green Version]
  47. Dai, A. Characteristics and trends in various forms of the Palmer Drought Severity Index (PDSI) during 1900–2008. J. Geophys. Res. 2011, 116, D12115. [Google Scholar] [CrossRef] [Green Version]
  48. Li, Y.; Chen, Y.; Sun, F.; Li, Z. Recent vegetation browning and its drivers on Tianshan Mountain, Central Asia. Ecol. Indic. 2021, 129, 107912. [Google Scholar] [CrossRef]
  49. Chen, Y.; Zhang, X.; Fang, G.; Li, Z.; Wang, F.; Qin, J.; Sun, F. Potential risks and challenges of climate change in the arid region of northwestern China. Reg. Sustain. 2021, 1, 20–30. [Google Scholar] [CrossRef]
  50. Fang, S.; Yan, J.; Che, M.; Zhu, Y.; Liu, Z.; Pei, H.; Lin, X. Climate change and the ecological responses in Xinjiang, China: Model simulations and data analyses. Quat. Int. 2013, 311, 108–116. [Google Scholar] [CrossRef]
  51. Zeng, H.; Jia, G.; Epstein, H. Recent changes in phenology over the northern high latitudes detected from multi-satellite data. Environ. Res. Lett. 2011, 6, 045508. [Google Scholar] [CrossRef] [Green Version]
  52. Jiang, C.; Ryu, Y.; Fang, H.; Myneni, R.; Claverie, M.; Zhu, Z. Inconsistencies of interannual variability and trends in long-term satellite leaf area index products. Glob. Chang. Biol. 2017, 23, 4133–4146. [Google Scholar] [CrossRef] [PubMed]
  53. Millerrushing, A.J.; Primack, R.B. Global warming and flowering times in Thoreau’s Concord: A community perspective. Ecology 2008, 89, 332–341. [Google Scholar] [CrossRef] [PubMed]
  54. Vitasse, Y.; Delzon, S.; Dufrêne, E.; Pontailler, J.Y.; Louvet, J.M.; Kremer, A.; Michalet, R. Leaf phenology sensitivity to temperature in European trees: Do within-species populations exhibit similar responses? Agric. For. Meteorol. 2009, 149, 735–744. [Google Scholar] [CrossRef]
  55. Richardson, A.D.; Bailey, A.; Denny, E.; Martin, C.; O’Keefe, J. Phenology of a northern hardwood forest canopy. Glob. Chang. Biol. 2006, 12, 1174–1188. [Google Scholar] [CrossRef] [Green Version]
  56. McDowell, N.; Pockman, W.T.; Allen, C.D.; Breshears, D.D.; Cobb, N.; Kolb, T.; Plaut, J.; Sperry, J.; West, A.; Williams, D.G.; et al. Mechanisms of plant survival and mortality during drought: Why do some plants survive while others succumb to drought? New Phytol. 2008, 178, 719–739. [Google Scholar] [CrossRef]
  57. Allen, C.D.; Macalady, A.K.; Chenchouni, H.; Bachelet, D.; McDowell, N.; Vennetier, M.; Kitzberger, T.; Rigling, A.; Breshears, D.D.; Hogg, E.H.T.; et al. A global overview of drought and heat-induced tree mortality reveals emerging climate change risks for forests. For. Ecol. Manag. 2010, 259, 660–684. [Google Scholar] [CrossRef] [Green Version]
  58. Grossiord, C.; Buckley, T.N.; Cernusak, L.A.; Novick, K.A.; Mcdowell, N.G. Plant responses to rising vapor pressure deficit. New Phytol. 2020, 226, 1550–1556. [Google Scholar] [CrossRef] [Green Version]
  59. Richardson, A.D.; Keenan, T.F.; Migliavacca, M.; Ryu, Y.; Sonnentag, O.; Toomey, M. Climate change, phenology, and phenological control of vegetation feedbacks to the climate system. Agric. For. Meteorol. 2013, 169, 156–173. [Google Scholar] [CrossRef]
  60. Xia, J.; Chen, J.; Piao, S.; Ciais, P.; Luo, Y.; Wan, S. Terrestrial carbon cycle affected by non-uniform climate warming. Nat. Geosci. 2014, 7, 173–180. [Google Scholar] [CrossRef]
  61. Wang, Y.; Xu, W.; Yuan, W.; Chen, X.; Zhang, B.; Fan, L.; He, B.; Hu, Z.; Liu, S.; Liu, W.; et al. Higher plant photosynthetic capability in autumn responding to low atmospheric vapor pressure deficit. Innov. 2021, 2, 100163. [Google Scholar] [CrossRef]
  62. McDowell, N.G.; Allen, C.D. Darcy’s law predicts widespread forest mortality under climate warming. Nat. Clim. Chang. 2015, 5, 669–672. [Google Scholar] [CrossRef]
  63. Guay, C.K.; Beck, P.S.; Berner, L.; Goetz, C.J.; Baccini, A.; Buermann, W. Vegetation productivity patterns at high northern latitudes: A multi-sensor satellite data assessment. Glob. Chang. Biol. 2014, 20, 3147–3158. [Google Scholar] [CrossRef]
  64. Forbes, B.C.; Fauria, M.M.; Zetterberg, P. Russian Arctic warming and ‘greening’ are closely tracked by tundra shrub willows. Glob. Chang. Biol 2010, 16, 1542–1554. [Google Scholar] [CrossRef]
  65. Verbyla, D. The greening and browning of Alaska based on 1982–2003 satellite data. Glob. Ecol. Biogeogr. 2008, 17, 547–555. [Google Scholar] [CrossRef]
  66. Beck, P.S.A.; Goetz, S.J. Satellite observations of high northern latitude vegetation productivity changes between 1982 and 2008: Ecological variability and regional differences. Environ. Res. Lett. 2011, 7, 029501. [Google Scholar] [CrossRef] [Green Version]
  67. Bunn, A.G.; Goetz, S.J. Trends in satellite-observed circumpolar photosynthetic activity from 1982 to 2003: The influence of seasonality, cover type, and vegetation density. Earth Interact. 2006, 10, 1–19. [Google Scholar] [CrossRef] [Green Version]
  68. Liu, Y.; Li, Z.; Chen, Y.; Li, Y.; Li, H.; Xia, Q.Q.; Kayumba, P.M. Evaluation of consistency among three NDVI products applied to High Mountain Asia in 2000–2015. Remote Sens. Environ. 2022, 269, 112821. [Google Scholar] [CrossRef]
Figure 1. Meteorological stations in Xinjiang.
Remotesensing 14 01298 g001
Figure 2. (a) Long-term changes in temperature _XJ and the Northern Hemisphere (NH) temperature anomaly from 1982 to 2015, showing the low-pass Loess filter design. (b) Five-year moving average of temperature anomaly in Xinjiang. The light gray background indicates the warming hiatus (1998–2012).
Remotesensing 14 01298 g002
Figure 3. Regional mean time series of Tair, VPD, Tmax, Tmin, Prec, and RH in Xinjiang during the period 1998–2012 (1982–1997 and 2013–2015 series are shown by gray lines for comparison).
Remotesensing 14 01298 g003
Figure 4. Change (%) in temperature during 1998–2015 relative to that in 1982–1998 in Xinjiang. The light gray background shows the spring and autumn.
Remotesensing 14 01298 g004
Figure 5. GIMMS3g-NDVI and temperature trends in Xinjiang from 1982 to 2015. A linear trend was determined for the periods before and after 1998, separately. The light gray background shows the warming hiatus (1998–2012).
Remotesensing 14 01298 g005
Figure 6. Vegetation NDVI trends (left) and M–K significance test (right) in spring over Xinjiang, China during 1982–2015 (a,b) and the two periods of 1982–1998 (c,d) and 1998–2012 (e,f).
Remotesensing 14 01298 g006
Figure 7. Vegetation NDVI trends (left) and M–K significance test (right) in autumn over Xinjiang, China during 1982–2015 (a,b) and the two periods of 1982–1998 (c,d) and 1998–2012 (e,f).
Remotesensing 14 01298 g007
Figure 8. The time series of the vegetation area (km2) and total water conveyance volume (108 m3) over the lower Tarim River during 2000–2015.
Remotesensing 14 01298 g008
Figure 9. Correlation coefficients between spring NDVI and climatic factors. The 95% confidence limits for the correlation are ±0.35 and ±0.51 for 1982–2015 and 1998–2012, respectively. The blue background indicates a positive correlation, and red indicates a negative correlation.
Remotesensing 14 01298 g009
Figure 10. Correlation coefficients between autumn NDVI and climatic factors. The 95% confidence limits for the correlation are ±0.35 and ±0.51 for 1982–2015 and 1998–2012, respectively. The blue background indicates a positive correlation, and red indicates a negative correlation.
Remotesensing 14 01298 g010
Figure 11. Relationships between spring standardized NDVI and standardized sc_PDSI in Xinjiang. The left graph is a comparison of the time series of spring NDVI and spring sc_PDSI (a), and winter of the year before (pre-winter) sc_PDSI (c) during 1982–2015. The right graph is the scatter plot between the spring NDVI and spring sc_PDSI (b) and between the spring NDVI and previous winter sc_PDSI (d) during 1998–2012. The gray shaded regions in (a,c) denote the warming hiatus (1998–2012).
Remotesensing 14 01298 g011
Figure 12. Relationships between autumn standardized NDVI and standardized sc_PDSI in Xinjiang. The left graph (a) is the time series of autumn NDVI and summer sc_PDSI and the right graph (b) is the scatter plot between the autumn NDVI and summer sc_PDSI during 1982–2015. The gray shaded regions in (a) denote the warming hiatus (1998–2012).
Remotesensing 14 01298 g012
Figure 13. Schematic diagram of the impacts of climatic variables on spring and autumn vegetation growth.
Remotesensing 14 01298 g013
Table 1. Change trend for GIMMS3g-NDVI and temperature for the periods 1982–1998 and warming hiatus (1998–2012).
DataSeasonWarming Period (1982–1998)Warming Hiatus (1998–2012)
Slope (/10a)p-ValueSlope (/10a)p-Value
GIMMS3g-NDVIAnnual0.0040.009−0.0020.151
Spring0.0040.023−0.0020.218
Summer0.0070.0020.0010.030
Autumn0.0060.001−0.0030.072
Tair (°C)Annual0.800.002−0.140.579
Spring0.760.0470.520.450
Summer0.170.2290.220.328
Autumn0.930.0070.140.778
Publisher’s Note: MDPI stays neutral with regard to jurisdictional claims in published maps and institutional affiliations.

