Article

Lidar and Radar Signal Simulation: Stability Assessment of the Aerosol–Cloud Interaction Index

by
Carlos Mario Fajardo-Zambrano
1,†,
Juan Antonio Bravo-Aranda
2,3,*,†,
María José Granados-Muñoz
2,3,
Elena Montilla-Rosero
1,
Juan Andrés Casquero-Vera
2,3,
Fernando Rejano
2,3,
Sonia Castillo
2,3 and
Lucas Alados-Arboledas
2,3
1
Faculty of Science, EAFIT University, Medellín 050021, Colombia
2
Department of Applied Physics, University of Granada, 18011 Granada, Spain
3
Andalusian Institute of Earth System Research, 18006 Granada, Spain
*
Author to whom correspondence should be addressed.
These authors contributed equally to this work.
Remote Sens. 2022, 14(6), 1333; https://doi.org/10.3390/rs14061333
Submission received: 28 January 2022 / Revised: 25 February 2022 / Accepted: 1 March 2022 / Published: 9 March 2022
(This article belongs to the Special Issue Selected Papers of the European Lidar Conference)

Abstract

:
Aerosol–cloud interactions (ACI) are in the spotlight of atmospheric science since the limited knowledge about these processes produces large uncertainties in climate predictions. These interactions can be quantified by the aerosol–cloud interaction index (ACI index), which establishes a relationship between aerosol and cloud microphysics. The experimental determination of the ACI index through a synergistic combination of lidar and cloud radar is still quite challenging due to the difficulties in disentangling the aerosol influence on cloud formation from other processes and in retrieving aerosol-particle and cloud microphysics from remote sensing measurements. For a better understanding of the ACI and to evaluate the optimal experimental conditions for the measurement of these processes, a Lidar and Radar Signal Simulator (LARSS) is presented. LARSS simulate vertically-resolved lidar and cloud-radar signals during the formation process of a convective cloud, from the aerosol hygroscopic enhancement to the condensation droplet growth. Through LARSS simulations, it is observed a dependence of the ACI index with height, associated with the increase in number ( A C I N d ) and effective radius ( A C I r e f f ) of the droplets with altitude. Furthermore, A C I N d and A C I r e f f for several aerosol types (such as ammonium sulfate, biomass burning, and dust) are estimated using LARSS, presenting different values as a function of the aerosol model. Minimum A C I N d values are obtained when the activation of new droplets stops, while A C I r e f f reaches its maximum values several meters above. These simulations are carried out considering standard atmospheric conditions, with a relative humidity of 30 % at the surface, reaching the supersaturation of the air mass at 3500 m. To assess the stability of the ACI index, a sensitivity study using LARSS is performed. It is obtained that the dry modal aerosol radius presents a strong influence on the ACI index fluctuations of 18 % cause an ACI variability of 30 % while the updraft velocity within the cloud and the wet modal aerosol radius have a weaker impact. LARSS ACI index uncertainty is obtained through the Monte Carlo technique, obtaining A C I r e f f uncertainty below 16 % for the uncertainty of all LARSS input parameters of 10 % . Finally, a new ACI index is introduced in this study, called the remote-sensing ACI index ( A C I R s ), to simplify the quantification of the ACI processes with remote sensors. This new index presents a linear relationship with the A C I r e f f , which depends on the Angstrom exponent. The use of A C I R s to derive A C I r e f f presents the advantage that it is possible to quantify the aerosol–cloud interaction without the need to perform microphysical inversion retrievals, thus reducing the uncertainty sources.

1. Introduction

A complete understanding of the climate system is difficult due to its complexity and the multiple interactions occurring [1]. Thus, atmospheric physical processes need to be deeply investigated for a better understanding of climate change and its future effects [2]. One of the principal causes of the atmospheric radiative forcing high uncertainties is the atmospheric aerosol, which has complex and non-linear interactions with a wide variety of atmospheric components. These interactions are generally enclosed as aerosol-radiation interaction (ARI) and aerosol–cloud interaction (ACI) [3]. The ARI refers to the role that aerosols have by directly scattering and absorbing solar radiation, reducing the amount of solar energy that reaches the ground, by increasing the radiation absorbed in the atmosphere and backscattered to the space [4]. Therefore, changing the surface energy budget, atmospheric thermodynamic stability, cloud evolution, among others [5,6,7]. The ACI refers to the role of atmospheric aerosols as cloud condensation and ice nuclei, changing cloud microphysics. Thus, ACI affects cloud albedo, development, and lifetime, and therefore the atmospheric stability [7,8,9,10].
The impact of the ACI was firstly introduced by Twomey [11], highlighting the influence of aerosols on cloud albedo. Feingold et al. [12] presented the ACI index as a parameter to quantify the effect of aerosols on cloud properties, given by the ratio of cloud optical properties to aerosol optical properties, based either on in situ or remote-sensing measurements or the combination of both [13,14]. Aircraft in situ measurements have proven to be an effective platform for studying the relationship between aerosols and cloud microphysical properties near the cloud base [15,16]. However, these measurements are quite costly, and, thus, limited. To overcome these limitations, ground-based in situ experimental approaches have been applied with promising results, although these techniques are invasive.
By allowing multiple measurements in real atmospheric conditions, remote-sensing techniques are a suitable alternative to retrieve the ACI index, especially as satellite-based remote sensing is the primary source of information for ACI [10]. Although several studies are based on the use of remote sensing instrumentation, most of them present qualitative results due to the great difficulty of disentangling the influence of aerosols from other factors [17,18,19]. Sarna and Russchenberg [20] obtained quantitative values of the ACI index through a synergistic combination of lidar, radar, and microwave radiometer measurements, but highlighting the problem to disentangle the aerosol influence on clouds from other variables such as temperature or water vapor content. Mamouri and Ansmann [21] also provided quantitative values using vertical profiles of particle linear depolarization ratio to retrieve cloud condensation nucleus (CCN) and ice nucleating particle number concentrations. More recently, Jimenez et al. [22] presented the possibility of studying ACI through the use of a dual field of view lidar for measuring both the aerosol below the cloud and the microphysical properties of liquid-water clouds. Despite recent advances, ACI is still the primary uncertainty source [10], mainly due to the limited observational capabilities and coarse-resolution of the climate models [23].
This work presents a simulator of the lidar (e.g., attenuated backscatter coefficient) and radar (e.g., radar reflectivity) products, considering the atmospheric physical processes involved in the formation of convective clouds. Particularly, LARSS simulates the aerosol hygroscopic growth, droplet activation, and droplet condensation growth processes, providing the attenuated backscatter coefficient using MOPSMAP (Modeled optical properties of ensembles of aerosol particles) and the radar reflectivity using the radar equation (Section 2). The study of ACI indexes sensitivity to variations of the atmospheric conditions (such as dry and wet aerosol modal radius and the updraft velocity) performed by LARSS allows to enhance the research approach for ACI study from the identification of some of the technical difficulties to the optimization of data analysis. Furthermore, a new ACI index based on the lidar and cloud radar signal is presented, reducing the ACI uncertainty by avoiding the use of microphysical inversions techniques.
Due to its theoretical nature, LARSS has been evaluated with well-known processes, such as the Twomey effect [11]. In addition, an experimental comparison of the activation fraction (AF) measured at the Andalusian Global Observatory of the Atmosphere (AGORA) has been performed (Section 3). The Monte Carlo technique and the one-factor-at-a-time method have been used to retrieve the ACI uncertainty and the ACI sensitivity to the fluctuation of the atmospheric parameters, respectively (Section 4). Finally, a new ACI index directly based on lidar and radar optical measurements is presented in Section 5.

2. Methodology

LARSS is a simplified approach to simulate lidar and radar signals under convective clouds formation. From these simulated signals, it is possible to study ACI indexes and the influence that different atmospheric variables and aerosol properties have in ACI, disentangling the effects of the multiple processes involved.

2.1. Lidar and Radar Signal Simulator (LARSS)

LARSS simulation process is schematized in Figure 1. This process starts with a dry air parcel (relative humidity [ R H ] 30 % ), characterized by its initial temperature, pressure, and water vapor content at ground level. This air parcel is assumed to contain a specific aerosol load characterized by its density, hygroscopicity parameter, refractive index, aerosol number concentration ( N a ), and particle number size distribution (PSD). The PSD is assumed to be Gaussian, defined by a modal radius, standard deviation, and minimum and maximum radius.
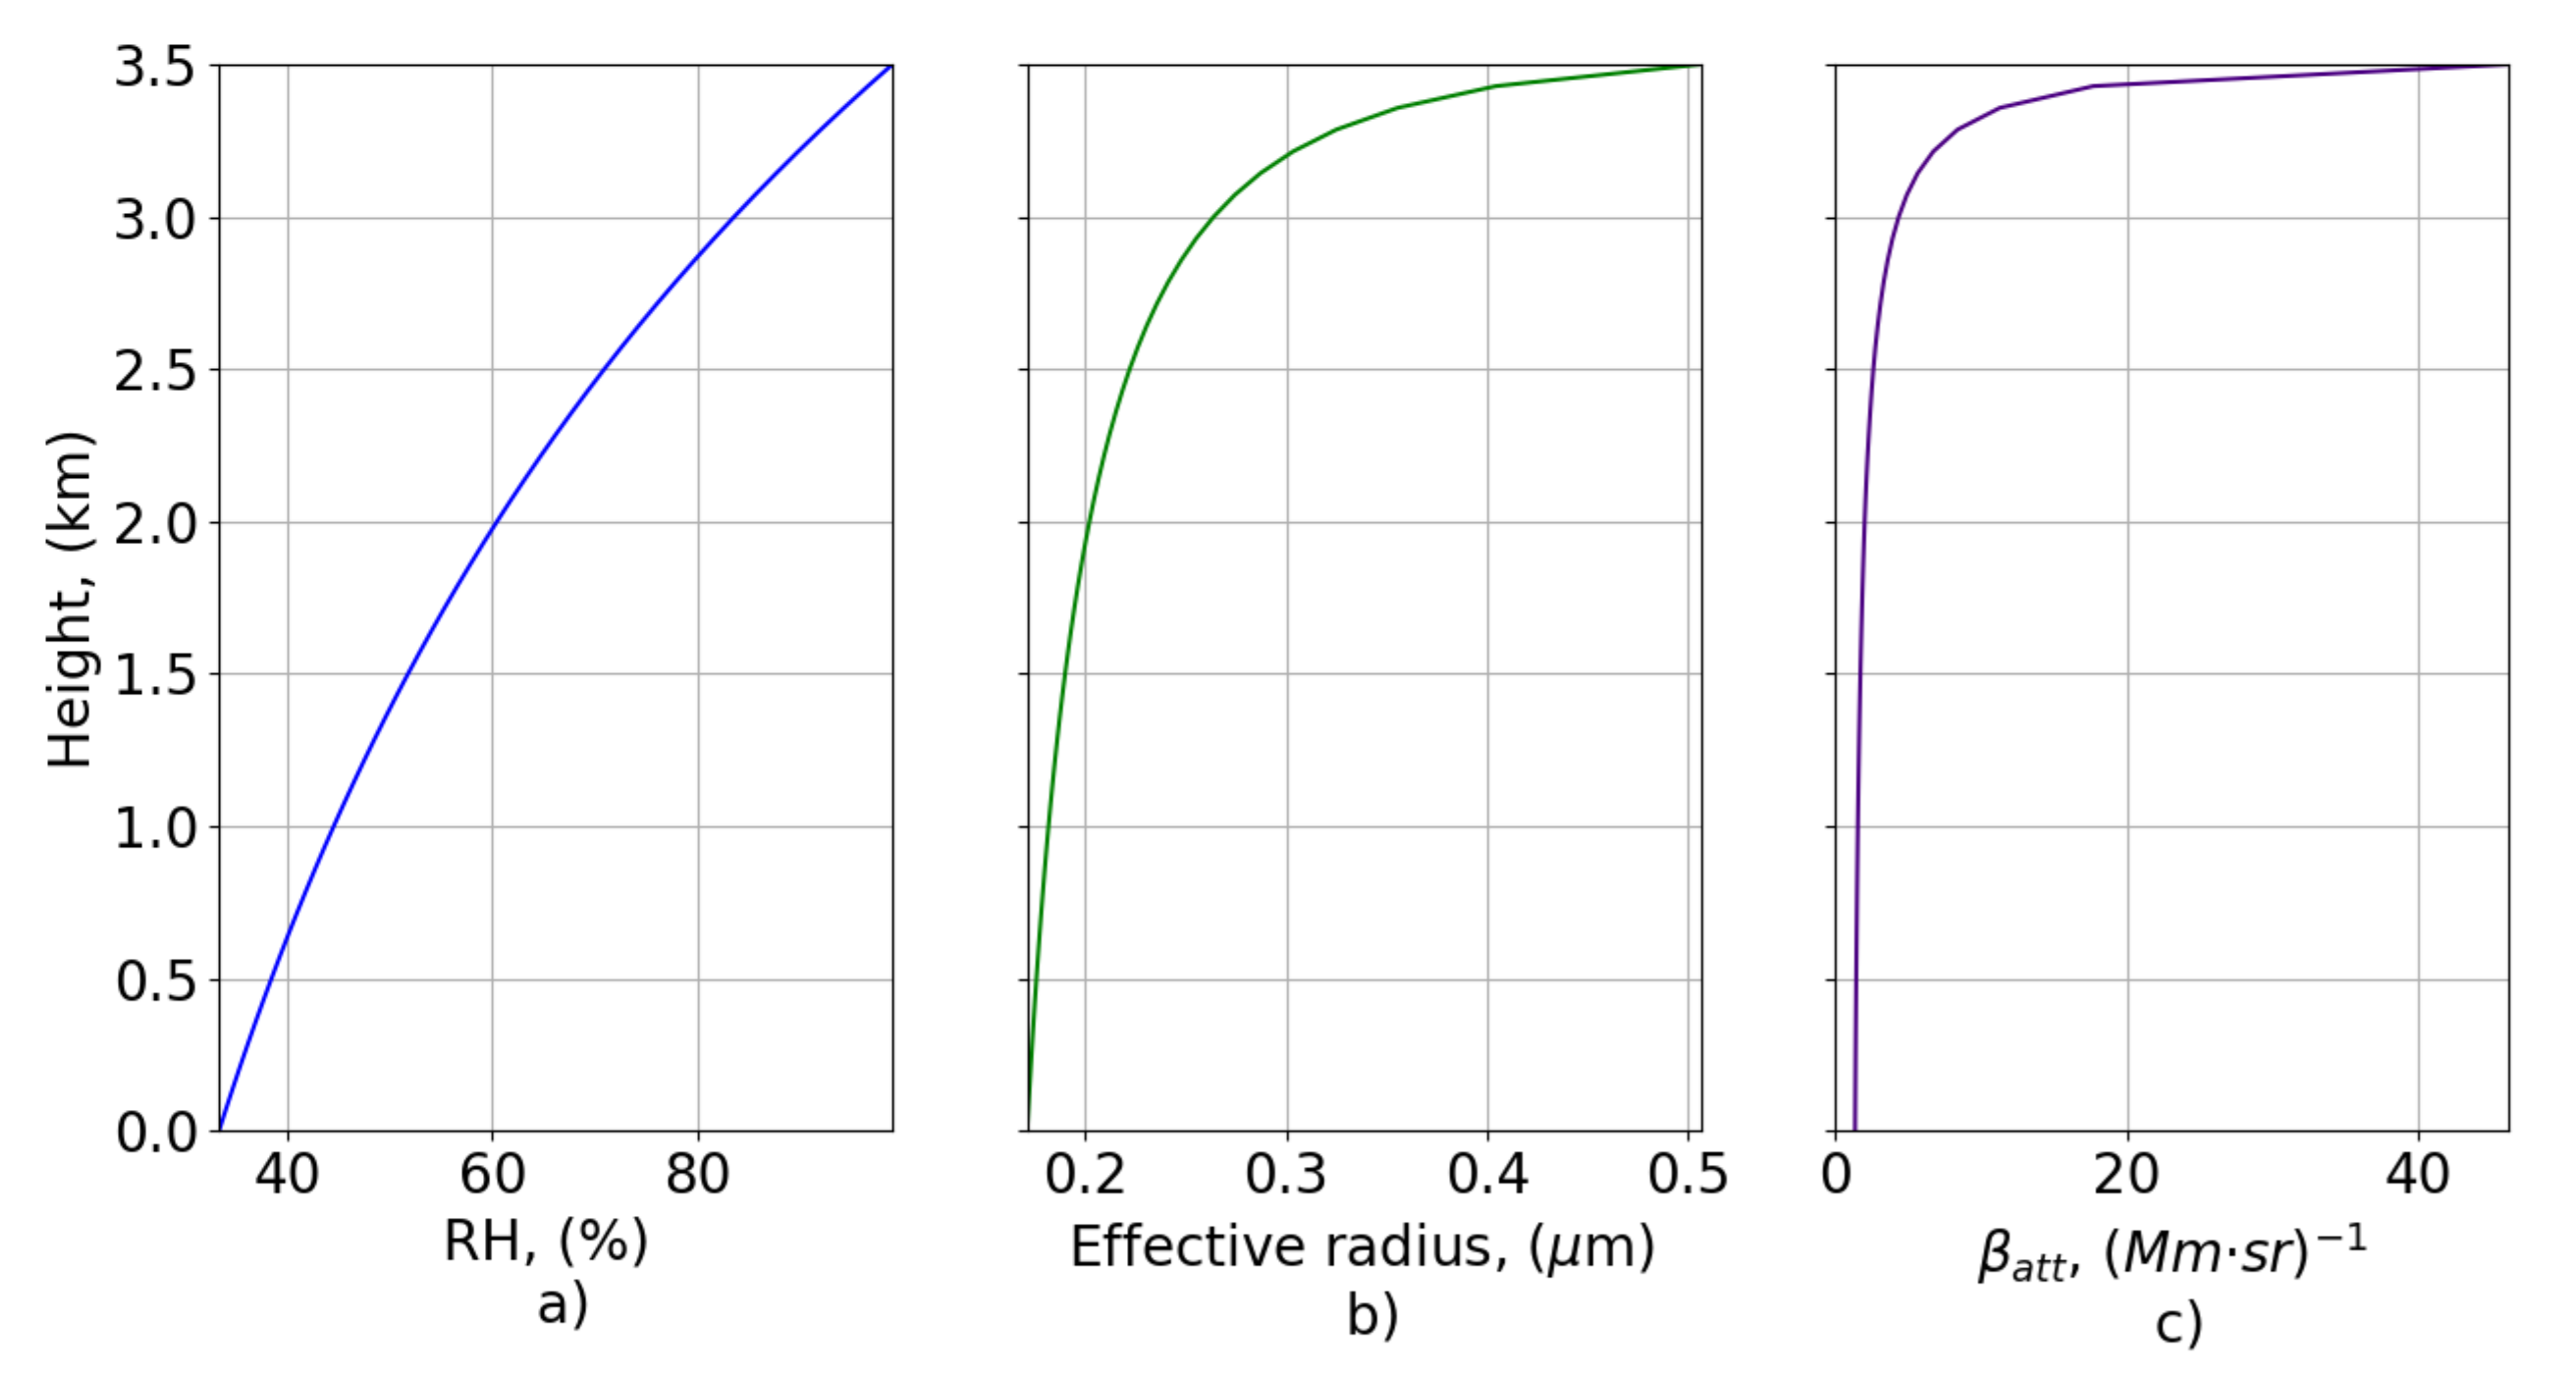
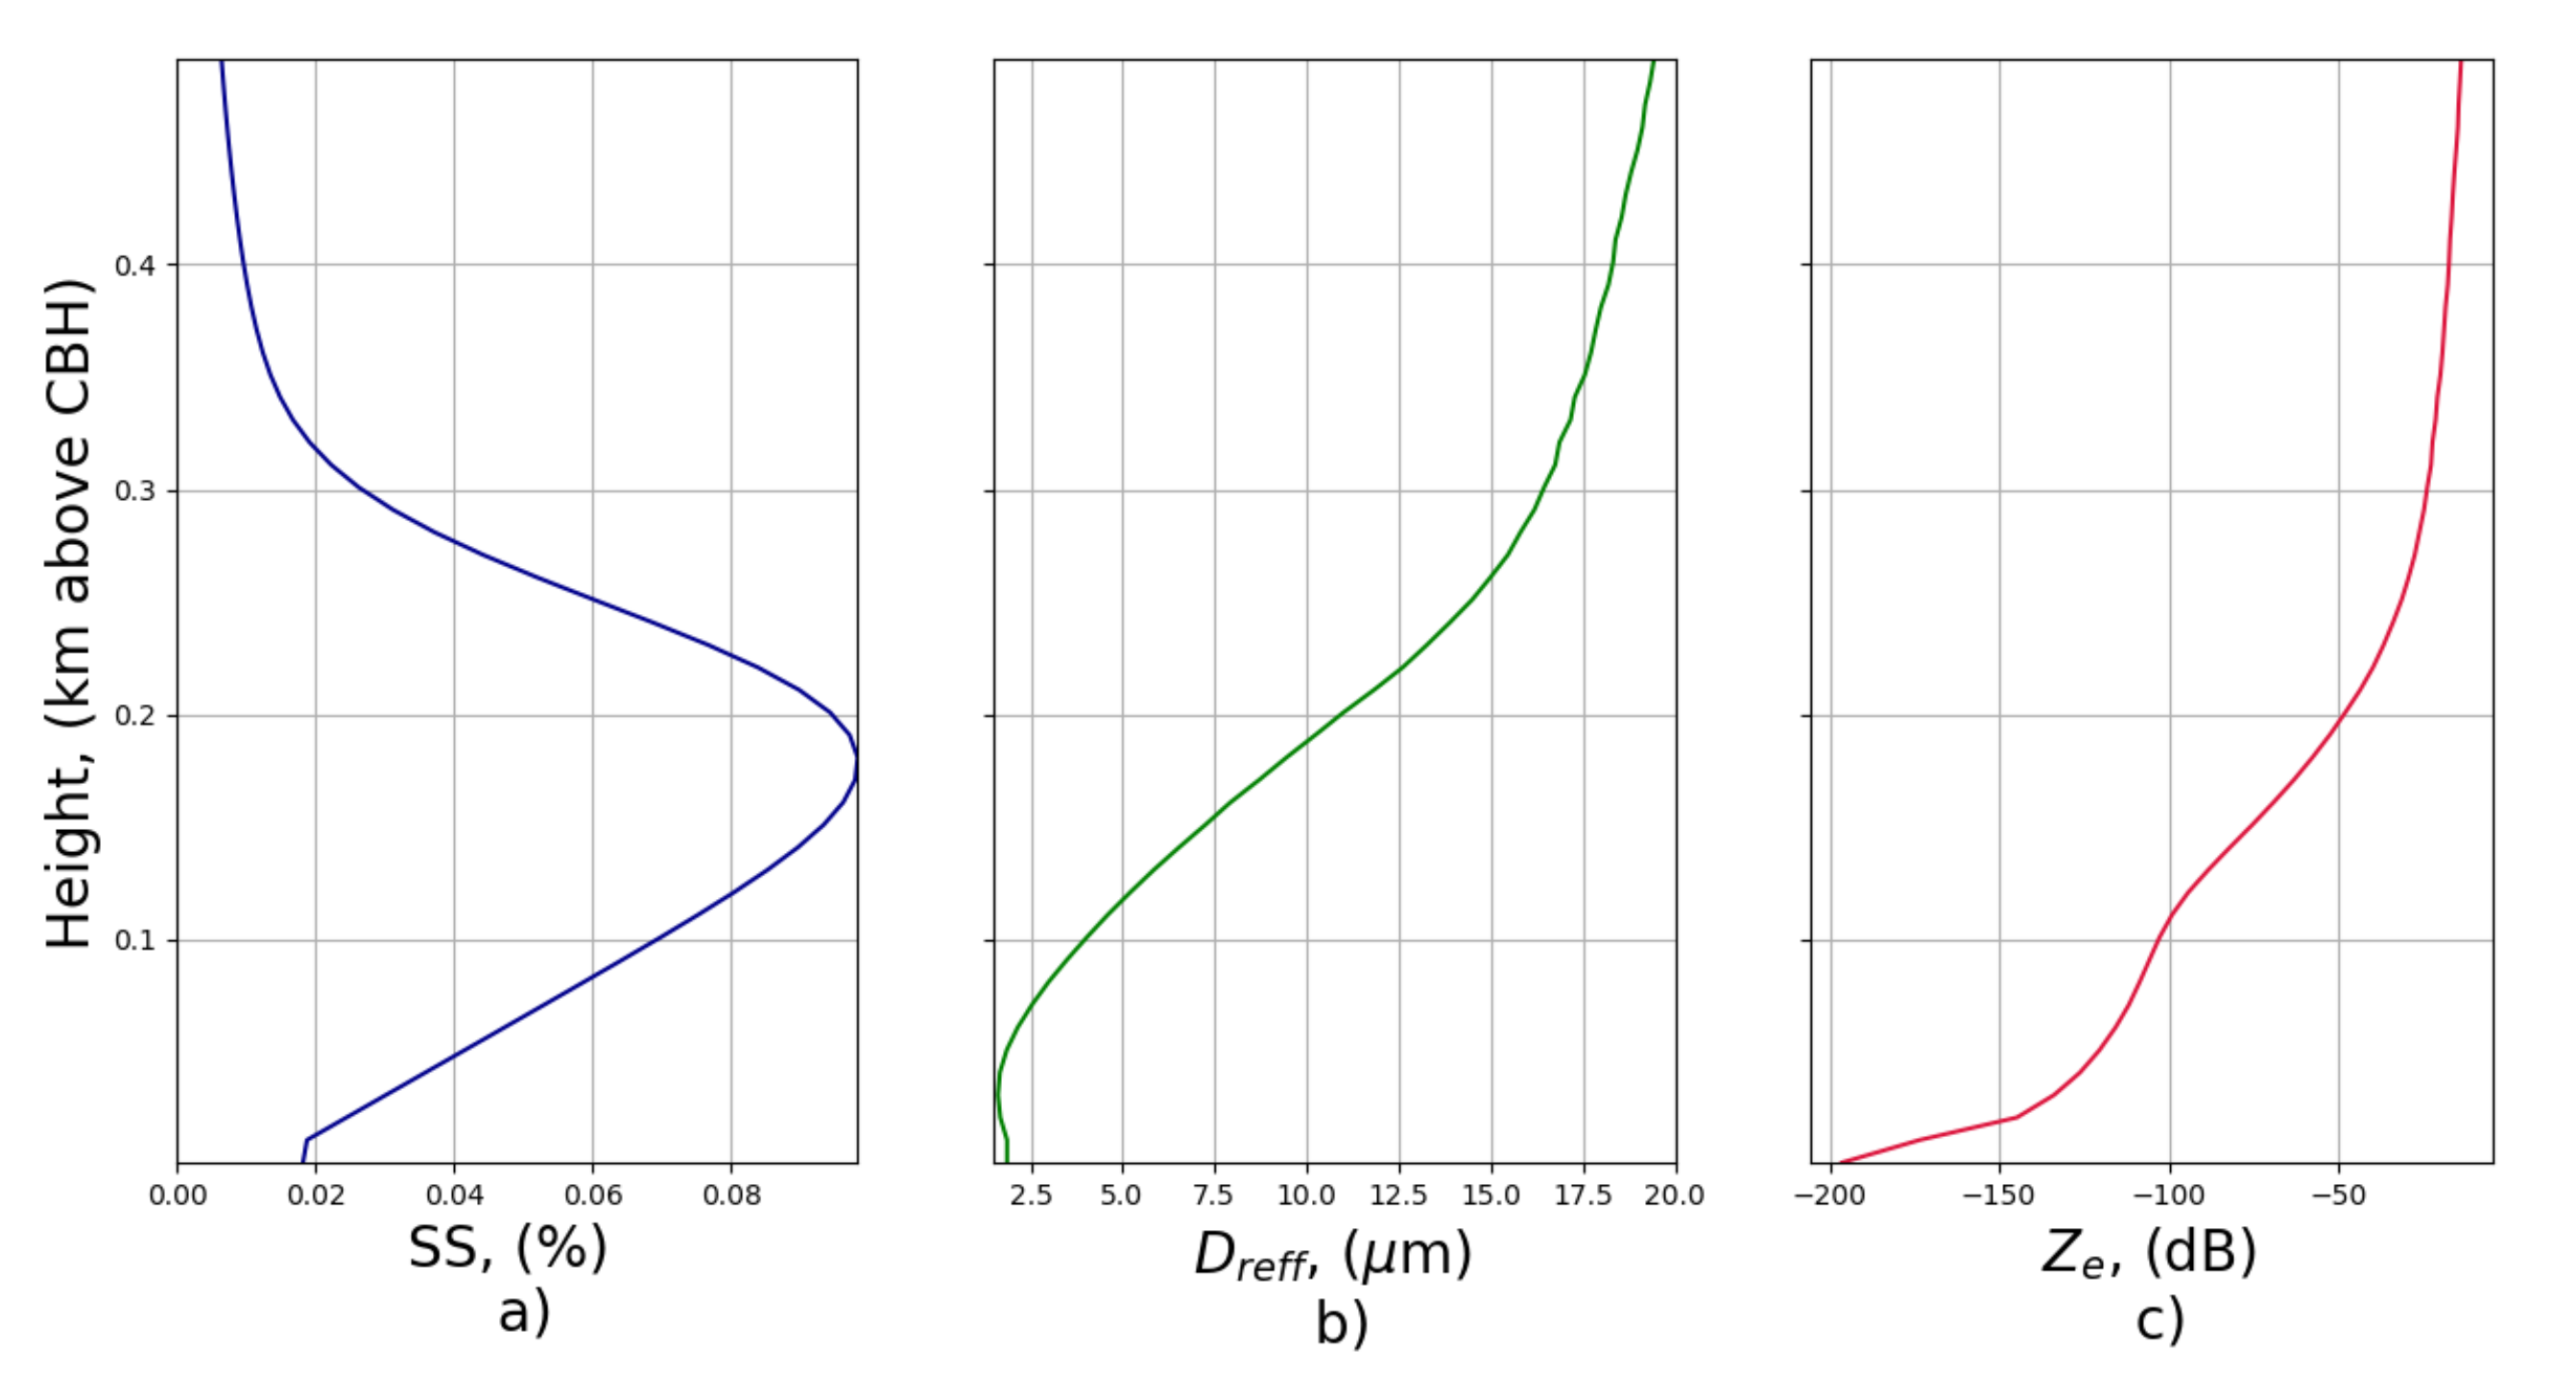
LARSS simulates the reduction of the saturation pressure with height during the air-parcel ascent and the dry adiabatic lapse rate at a given updraft velocity (w). Since the water vapor mixing ratio remains constant during the ascent, R H increases (see Figure 2a). This R H increase triggers two different processes. First, aerosol hygroscopic growth, described by the Hänel theory, for R H below 100 % [24,25] (see Figure 2b). Therefore, in the ascending air parcel, PSD changes with height toward larger sizes. Second, droplet formation, described by the Köhler theory, starts once the supersaturation ( S S , i.e., R H 100 % ) reaches the minimum S S required to activate the PSD bin with the largest radius (C) [26,27]. It is worthy to note that there is a smooth transition from Hänel to the Köhler theory since the last one also covers R H 99 % .
From this point on, the S S is calculated in height (see Figure 3a) according to the theoretical model presented by Pinsky et al. [28],
S S = A 1 z A 2 q w + C
where A 1 and A 2 are temperature-dependent functions, z is the height above ground level, q w is the liquid water mixing ratio which depends on the temperature, the saturation mixing ratio, and the supersaturation, and C is the aforementioned initial supersaturation. A 2 q w term represents the decrease of available water-vapor molecules due to condensation, so it contributes to reduce the S S . This explains the S S maximum reached at 180 m above C B H shown in Figure 3a).
The S S evolution with height affects the droplet number size distribution (DSD): (i) as long as the S S increases, smaller particles are activated, increasing the DSD. Once S S reaches its maximum, no more particles are activated and thus, the droplet number concentration ( N d ) stays constant from this height. (ii) Droplet growth continues as long as R H is greater than 100 % . This two effects causes the D r e f f evolution in height shown in Figure 3b).
The attenuated backscatter coefficient profile ( β a t t ) (directly proportional to the lidar range-corrected signal) below the cloud base height ( C B H ) is the lidar product used in LARSS to obtain the ACI index. This profile is derived from the PSD using MOPSMAP (modeled optical properties of ensembles of aerosol particles) (see Figure 2c) [29]. MOPSMAP is an open-source code based on a data set of pre-calculated single-particle optical properties, according to either Rayleigh, Mie, T-matrix, or optical-geometry scattering. Additionally, aerosol-particle backscatter ( β ) and extinction ( α ) coefficients can be derived, and the Aerosol Optical Depth ( A O D ) can be retrieved by integrating α in a certain layer. The radar reflectivity ( Z e ), is directly derived from the DSD according to Pruppacher and Klett [30] (see Figure 3c):
Z e = λ r 4 π 5 | K p | 2 σ b ( D d ) n ( D d ) d D d
where D d is the droplet diameter, σ b is the cross-section of a droplet with diameter D d , n ( D d ) is the number of droplets with diameter D d , λ r is the radar wavelength, and | K p | 2 is the dielectric factor [31].
In this study, simulations with LARSS have been performed under specific conditions based on a series of assumptions that are summarized next:
  • The PSD and DSD are described by a log-normal size distribution.
  • The aerosol number concentration is constant with height, presenting the same PSD except for hygroscopic growth.
  • The minimum S S to start the droplet formation is established by the PSD bin with the largest radius.
  • The LWP is constant, as it is a requirement for retrieving the ACI indexes.
  • The updraft velocity is constant with height.
  • The droplets are only allowed to grow through condensation, making the maximum radius of a droplet at r = 20 μ m (the limit where coalescence growth starts to present a considerable contribution).
These assumptions provide a simplified but realistic approach to the cloud formation process. They allow us to identify the different parameters involved in the ACI processes, and thus, to quantify how these parameters influence the ACI indexes. Despite these assumptions, LARSS provides valuable information on how remote sensing instrumentation can be used to estimate ACI indexes.

2.2. ACI Indices Estimation by LARSS

According to Feingold et al. [12], different ACI indices can be estimated based on different aerosol and cloud proxies,
A C I r e f f = ln r r e f f ln γ LWP 0 < A C I r e f f < 0.33 A C I N d = ln N d ln γ 0 < A C I N d < 1 A C I r e f f = 1 3 A C I N d
where γ is an aerosol proxy, and A C I r e f f and A C I N d use the r r e f f and the N D as cloud proxies, respectively.
To estimate the ACI indices using LARSS, a certain number of iterations, N, are performed with different values of N a . As an example, ACI indices for sulfate-aerosol particles are calculated here using LARSS with N a values ranging between 5 to 20 × 10 8 part / m 3 , keeping constant the rest of the input parameters, with the values provided in Table 1.
The simulated values for N d and r e f f allowed us to calculate the ACI indices at different altitudes within the clouds. Figure 4 (left) shows the dependence between l o g ( N d ) and l o g ( N a ) where the A C I N d index is obtained from the slope of the linear fit between both datasets. Similarly, Figure 4 (center) shows the dependence between l o g ( r e f f ) and l o g ( N a ) , from which A C I r e f f can be retrieved. Table 2 shows the value of the different ACI types at each height according to the Figure 4.
The retrieval of r r e f f and N d from remote sensors is performed with inversion algorithms that usually require many assumptions and increase the uncertainty. To avoid these intermediate steps, an ACI index based on direct measurements, such as Z e and β , the ( A C I R s ), is proposed in this study (Section 5),
A C I R s = ln Z e ln β LWP 0 < A C I R s < 1
where β is used as a proxy of N a , and Z e as a proxy of N d . Figure 4 (right) shows the dependence between l o g ( Z e ) and l o g ( β ) .

2.2.1. ACI Uncertainty Based on Monte Carlo Technique

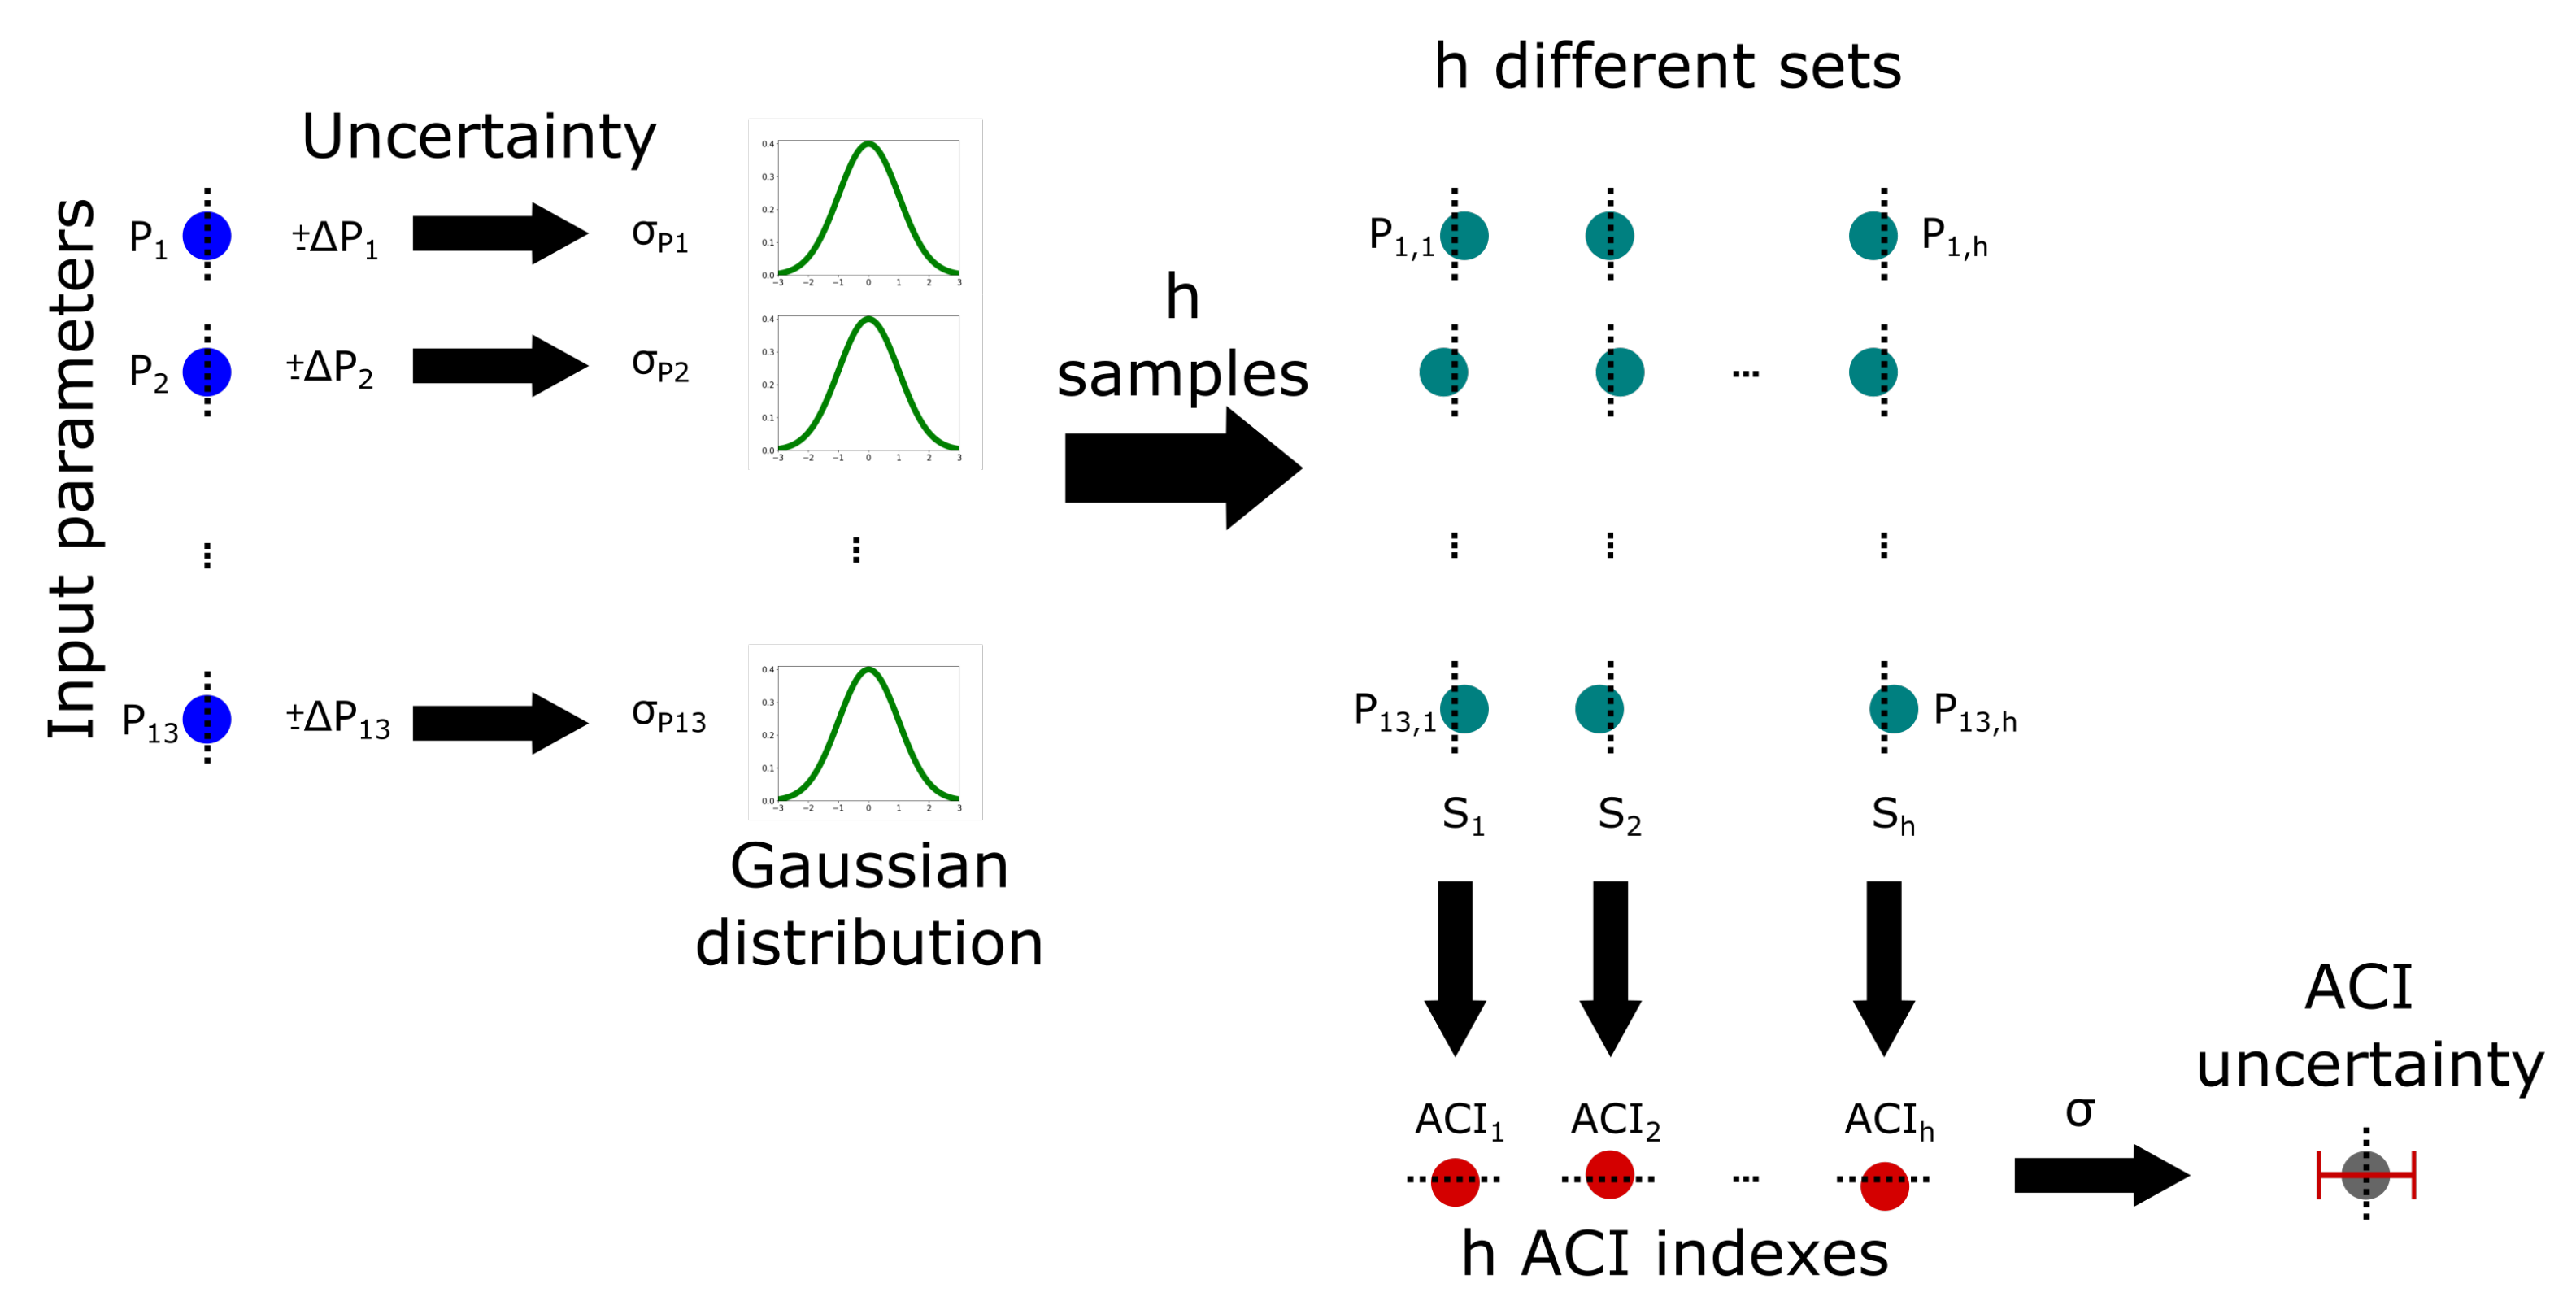
The calculation of ACI indices uncertainties is not straightforward due to the nonlinear physical phenomena related to aerosol particles [36] and droplet formation. Thus, to calculate these uncertainties, the Monte Carlo technique (MCT), widely used in the literatures [37,38], is implemented in LARSS (schematized in Figure 5) as follows:
1.
Table 1 shows the 13 initial parameters required to initialize one simulation with LARSS ( P 1 , P 2 ,…, P 13 ). This set of parameters is noted as S.
2.
The uncertainty associated to each parameter P i is represented by its relative error Δ P i .
3.
A Gaussian distribution is associated to the uncertainty of each parameter P i where its standard, σ P i , is derived from Δ P i .
4.
From each Gaussian distribution, h random values are selected (e.g., P 1 , 1 , P 1 , 2 , , P 1 , h ).
5.
Random values are grouped in h sets (e.g., S 1 , S 2 , , S h ). For example, the set S 1 is given by P 1 , 1 , P 2 , 1 , , P 13 , 1 .
6.
h ACI indexes are retrieved with the generated sets.
7.
The ACI index uncertainty is the standard deviation of the h ACI indexes.
Despite ACI index uncertainty depends on the number of simulations (h), it converges once h is large enough. The ACI uncertainty has been retrieved for several h values ranging between 10 and 40 (with Δ P = 5 % for all the input parameters) to identify the number of simulations needed for this convergence. Table 3 shows the convergence of the ACI uncertainty at h = 30 . Similarly, if the input parameters have an uncertainty of Δ P = 10 % the uncertainty for A C I R s is 0.05 , for A C I r e f f is 0.018 , and for A C I N d is 0.06 .
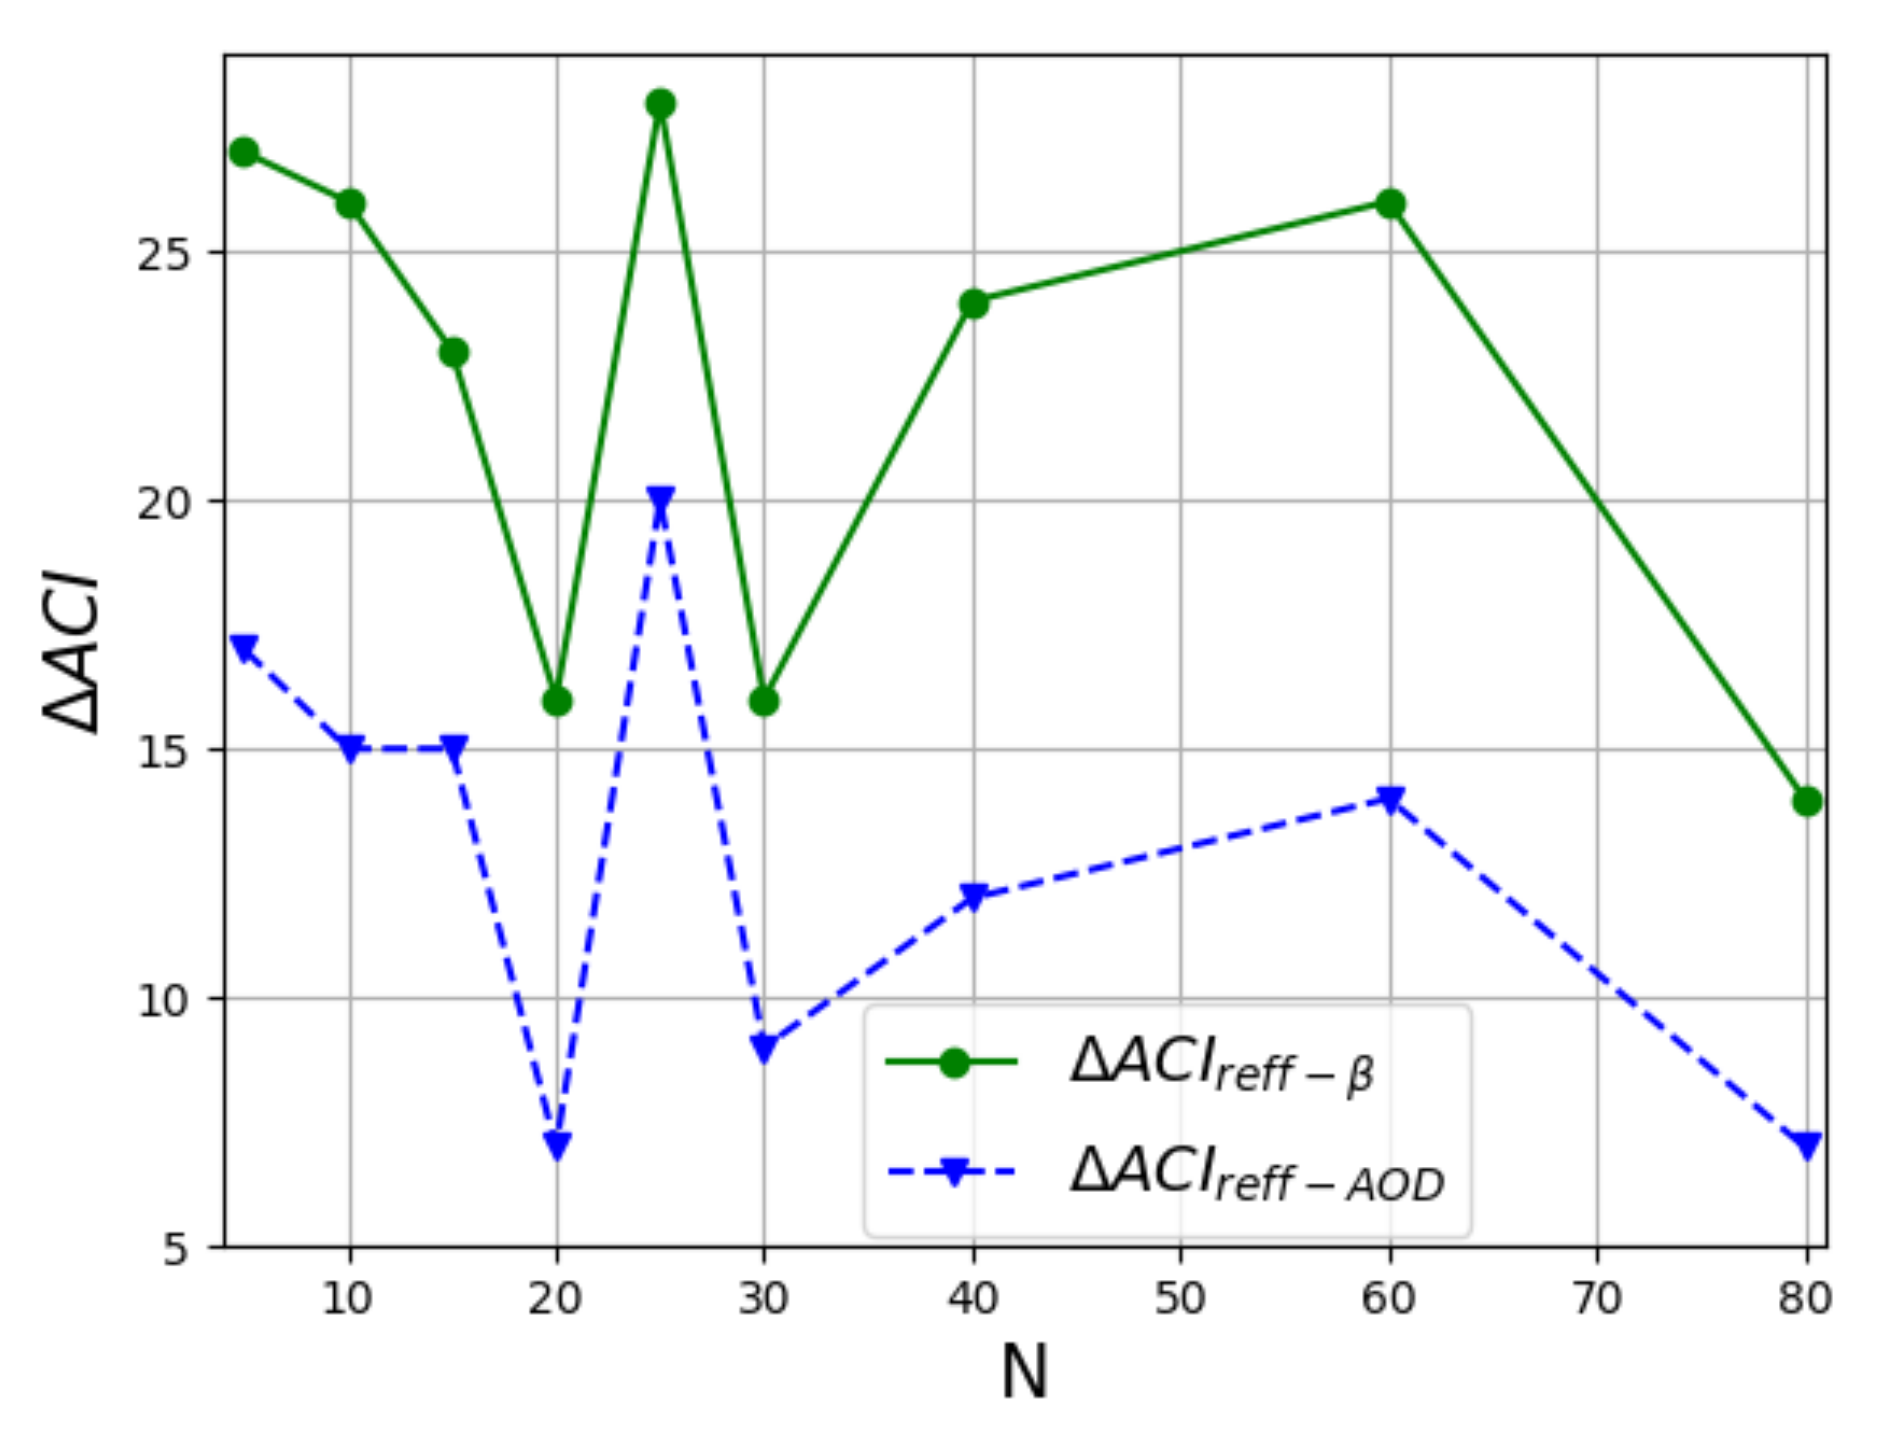
The number of iterations (N) to retrieve the ACI indices only affects the ACI index value if at least one input parameter uncertainty is taken into account. Figure 6 shows the variability of the ACI indexes ( Δ ACI) with respect to the ideal ACI indexes without uncertainty, as a function of N assuming a dry modal radius uncertainty of 13 % . As it can be seen, Δ ACI reaches a local minimum at N equals to 20, 30, and 80, with a coefficient of determination R 2 > 0.85 from N 20 . Due to the increase in the computational cost, N is fixed at 20. Δ ACI is lower if A O D is used as an aerosol proxy instead of beta. β a t t at 200 m below the CBH causes a Δ ACI (not shown) similar to A O D . Considering that both proxies provide the same value of ACI, this result indicates that A O D is a more stable aerosol proxy to retrieve the ACI index.

3. LARSS Evaluation and ACI Assessment for Simulated Data

3.1. LARSS Evaluation against Experimental Data

Even though LARSS is a tool that reproduces idealized atmospheric conditions, it provides a realistic approximation that allows us to understand the behavior of aerosols and droplets interactions. Under specific atmospheric conditions, CCN data obtained from LARSS have been evaluated against experimental data measured at the Andalusian Global Observatory of the Atmosphere (AGORA).
AGORA includes two sampling sites: an urban background station located in the city of Granada (37.18 N, 3.58 W, 680 m a.s.l., UGR) and an alpine station in Sierra Nevada mountain range (37.10 N, 3.39 W, 2500 m a.s.l., SNS). PSD and CCN concentrations were measured for almost a year at UGR (from October 2018 to May 2019) and during the summer period at SNS (from June to August 2019) [39]. Table 4 shows the mean values of aerosol and droplet properties obtained at the AGORA observatory for these periods. The activation fractions ( A F ) were calculated using the ratio between the CCN and the N a .
The mean and standard deviation of the A F obtained from the experimental data at Granada ( A F U G R ) and Sierra Nevada ( A F S N S ) are compared with the A F derived from LARSS ( A F L A R S S ) using the atmospheric aerosol properties of Table 4 as input parameters. Figure 7 shows the variation of the A F L A R S S with height until it reaches the maximum supersaturation ( S S m a x ) values of 0.20 ± 0.10 and 0.25 ± 0.10 , respectively. These S S m a x coincides with the S S at which A F U G R and A F S N S were obtained, allowing the intercomparison. Note that S S uncertainty was calculated with the Monte Carlo technique [Section 2.2.1] and does not include systematic error due to LARSS assumptions discussed at the end of Section 2.1.
Since A F L A R S S values are within the A F S N S and A F U G R uncertainties, good agreement between simulated and experimental A F data can be considered, indicating the good performance of the simulator. Even though LARSS underestimates the AF with a relative difference of 25 % and 22 % for U G R and S N S , respectively, results indicate that experimental data can be reproduced by the simulations. Furthermore, similar difference between predicted and measured CCN concentration were found by Ervens et al. [40] for S S = 0.22 , and by Almeida et al. [41] for S S = 0.23 .

3.2. Analysis of the ACI Indices for Different Aerosol Types

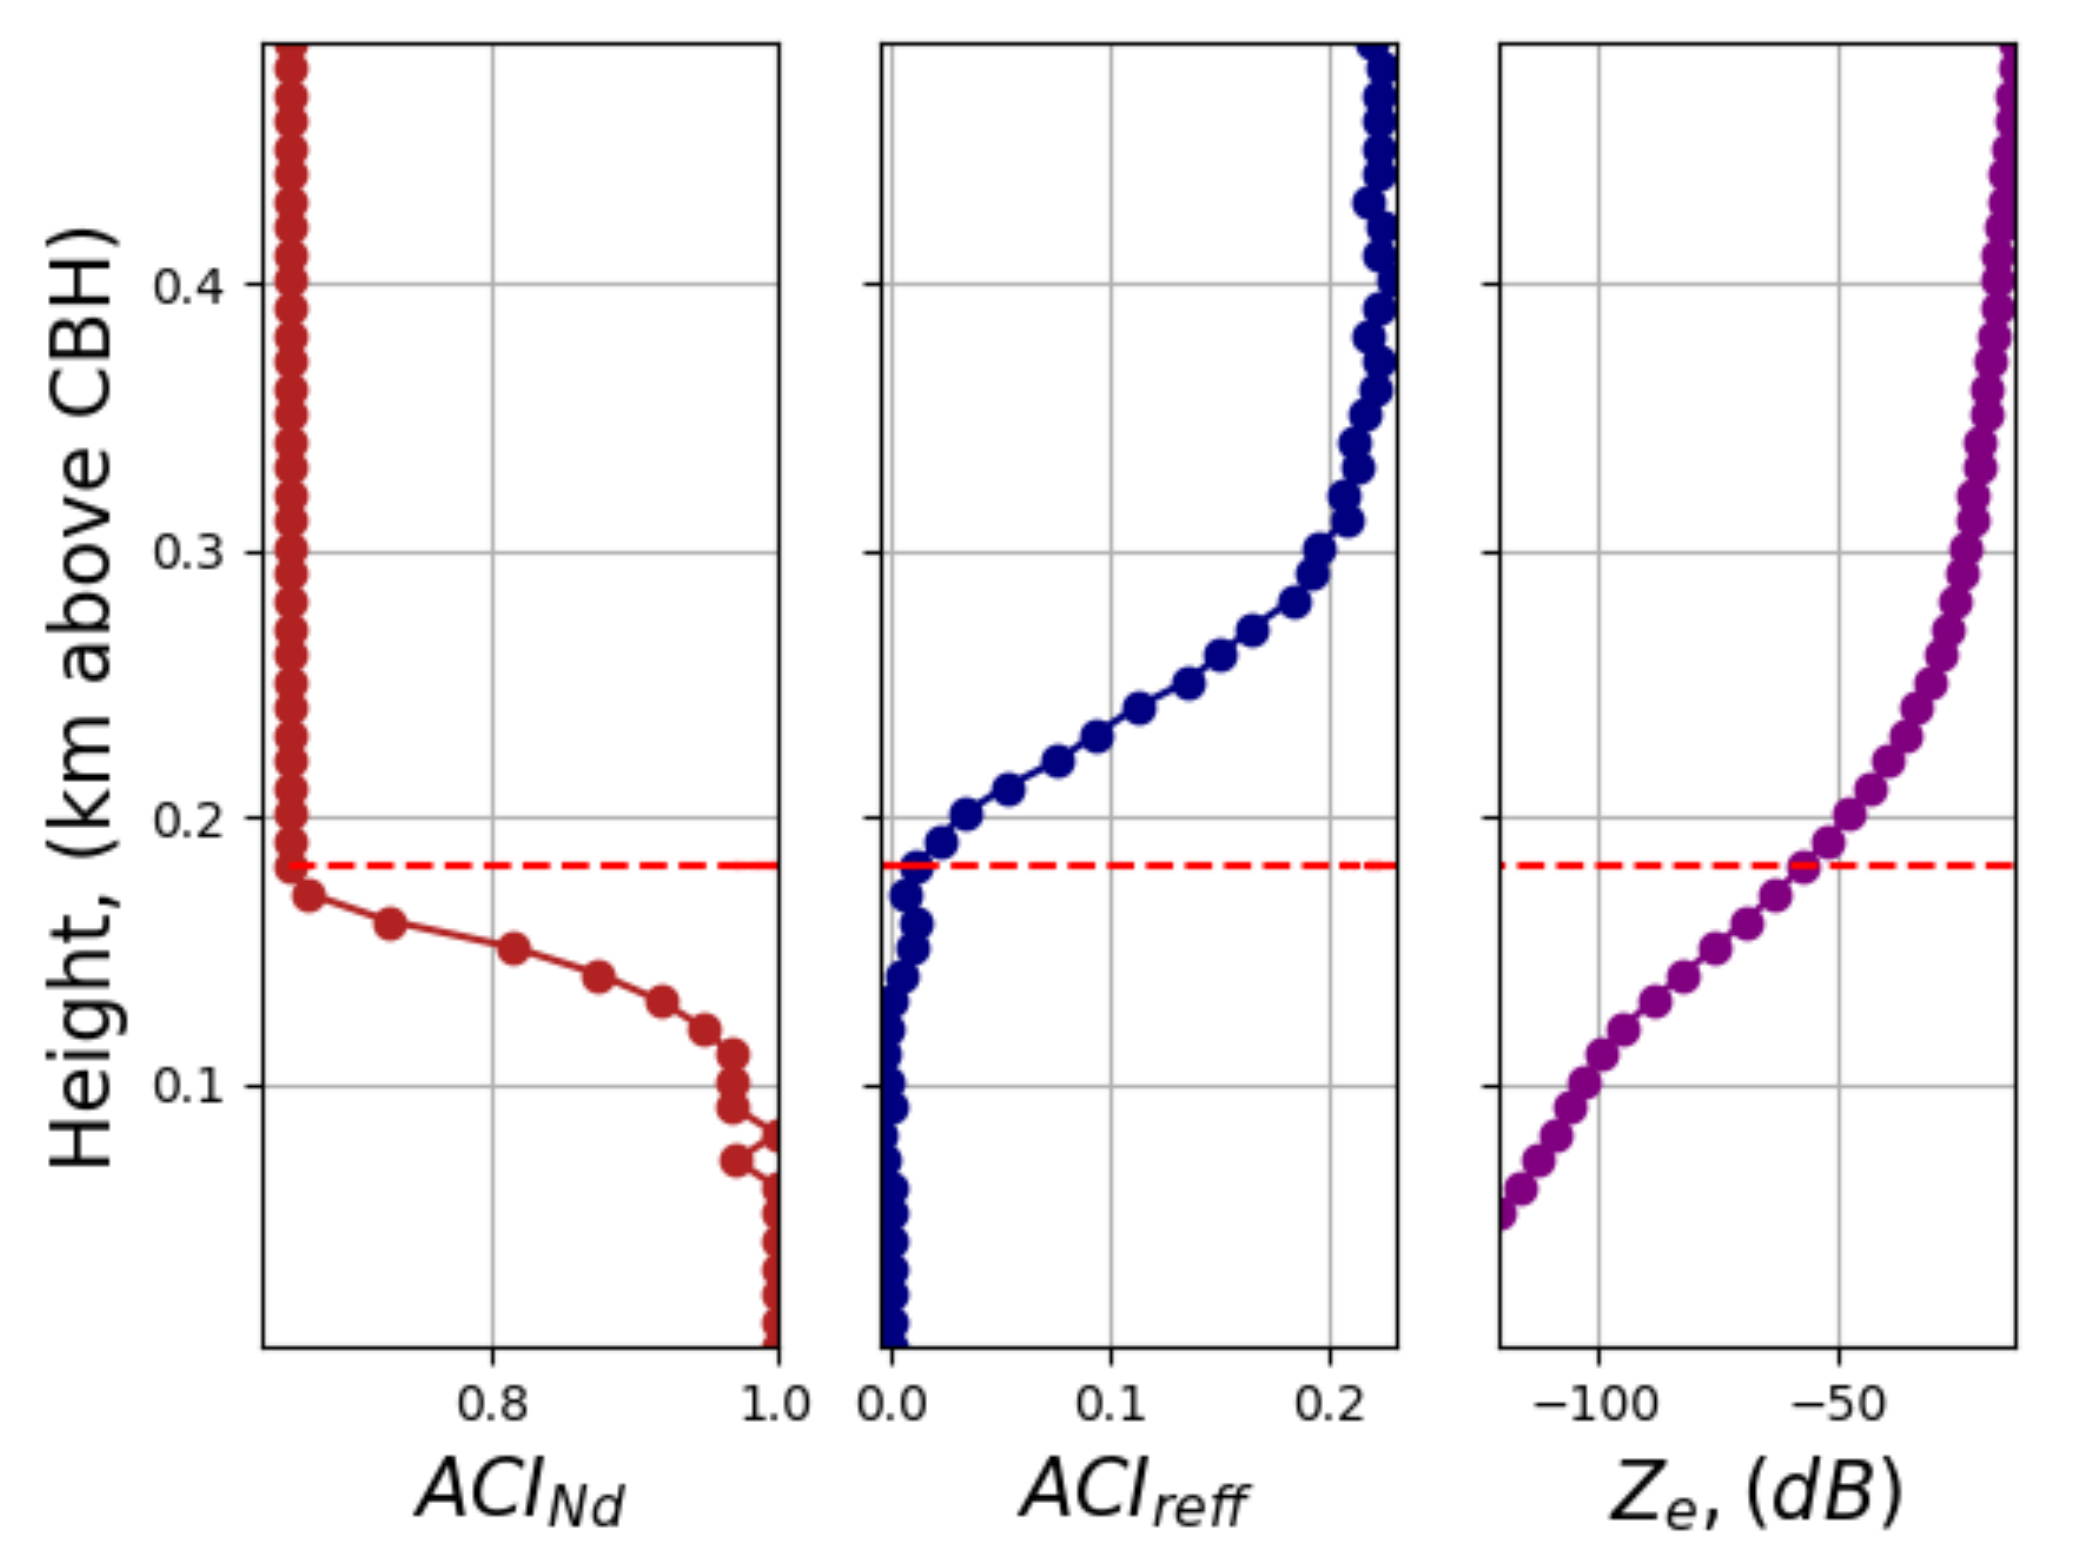
Figure 8 shows the A C I N d (left), A C I r e f f (center) and Z e (right) vertical profiles within the cloud obtained with LARSS for the case study noted as Case A a (see input parameters in Table 1). The horizontal red dashed line marks the height at which the assumed radar sensitivity value is reached ( 60 dB [42]). The A C I r e f f is close to zero in the first tens of meters above the CBH because only a few large particles are activated. From ∼200 m to 350 m, A C I r e f f increases with height. In this region, Z e is just above the minimum radar sensitivity. A C I r e f f reaches its maximum value from 350 m above CBH ( L W P > 154 g / m 2 ). As it can be seen in Figure 8 (left), A C I N d is equal to one at the very beginning, decreasing up to its minimum value (0.660 at CBH + 180 m), where S S m a x is reached. Thus, A C I N d minimum is reached at a lower altitude (i.e., 170 m below) than A C I r e f f maximum.
The same analysis of the ACI indices has been repeated for the aerosol types listed in Table 5. A total of 15 cases have been analyzed (Figure A7) for fixed instrument parameters and atmospheric conditions. Given the large number of combinations, simulated cases are noted as ‘Case T m ’ where T refers to the aerosol type (i.e., A = ammonium sulfate, B = biomass burning, D = dust) and the subscript m refers to the mode (i.e., a = accumulation and c = coarse). For example, ‘Case D c ’ refers to a simulation of coarse-mode dust aerosol particles. In the case of an aerosol mixture, we follow the notation ‘Case T 1 m 1 T 2 m 2 ’, just adding as many monomodal cases as needed. For example, ‘Case A a D c ’ refers to a simulation for a mixture of accumulation-mode sulfate and coarse-mode dust particles. Fine mode aerosols have been omitted since they require higher S S than those occurring in the free atmosphere to be activated, even for highly hygroscopic particles [43]. Most of the simulations focus on accumulation mode aerosol particles since this is the predominant mode for the natural formation of clouds [43]. Coarse mode aerosol particles require a lower S S to be activated, but they are much fewer in number [43].
Table 6 shows the input parameters used for the initialization of LARSS for each aerosol type. The hygroscopicity parameter, standard deviation, and density of ammonium sulfate and dust are extracted from Hande et al. [33]. The hygroscopicity parameter and density of biomass burning are extracted from Psichoudaki et al. [44] and Zhai et al. [45], respectively. The minimum, modal, and maximum radius, and the N a of the ammonium sulfate and dust are from Mészáros [32] and Tu and Kanapilly [35], and Dentener et al. [46], respectively. The minimum, modal, and maximum radius, and the N a of the biomass burning are from Remer et al. [47] and Keil and Haywood [48]. The refractive index of ammonium sulfate, dust and biomass burning are extracted from Curtis et al. [34], Denjean et al. [49] and Remer et al. [47], respectively.
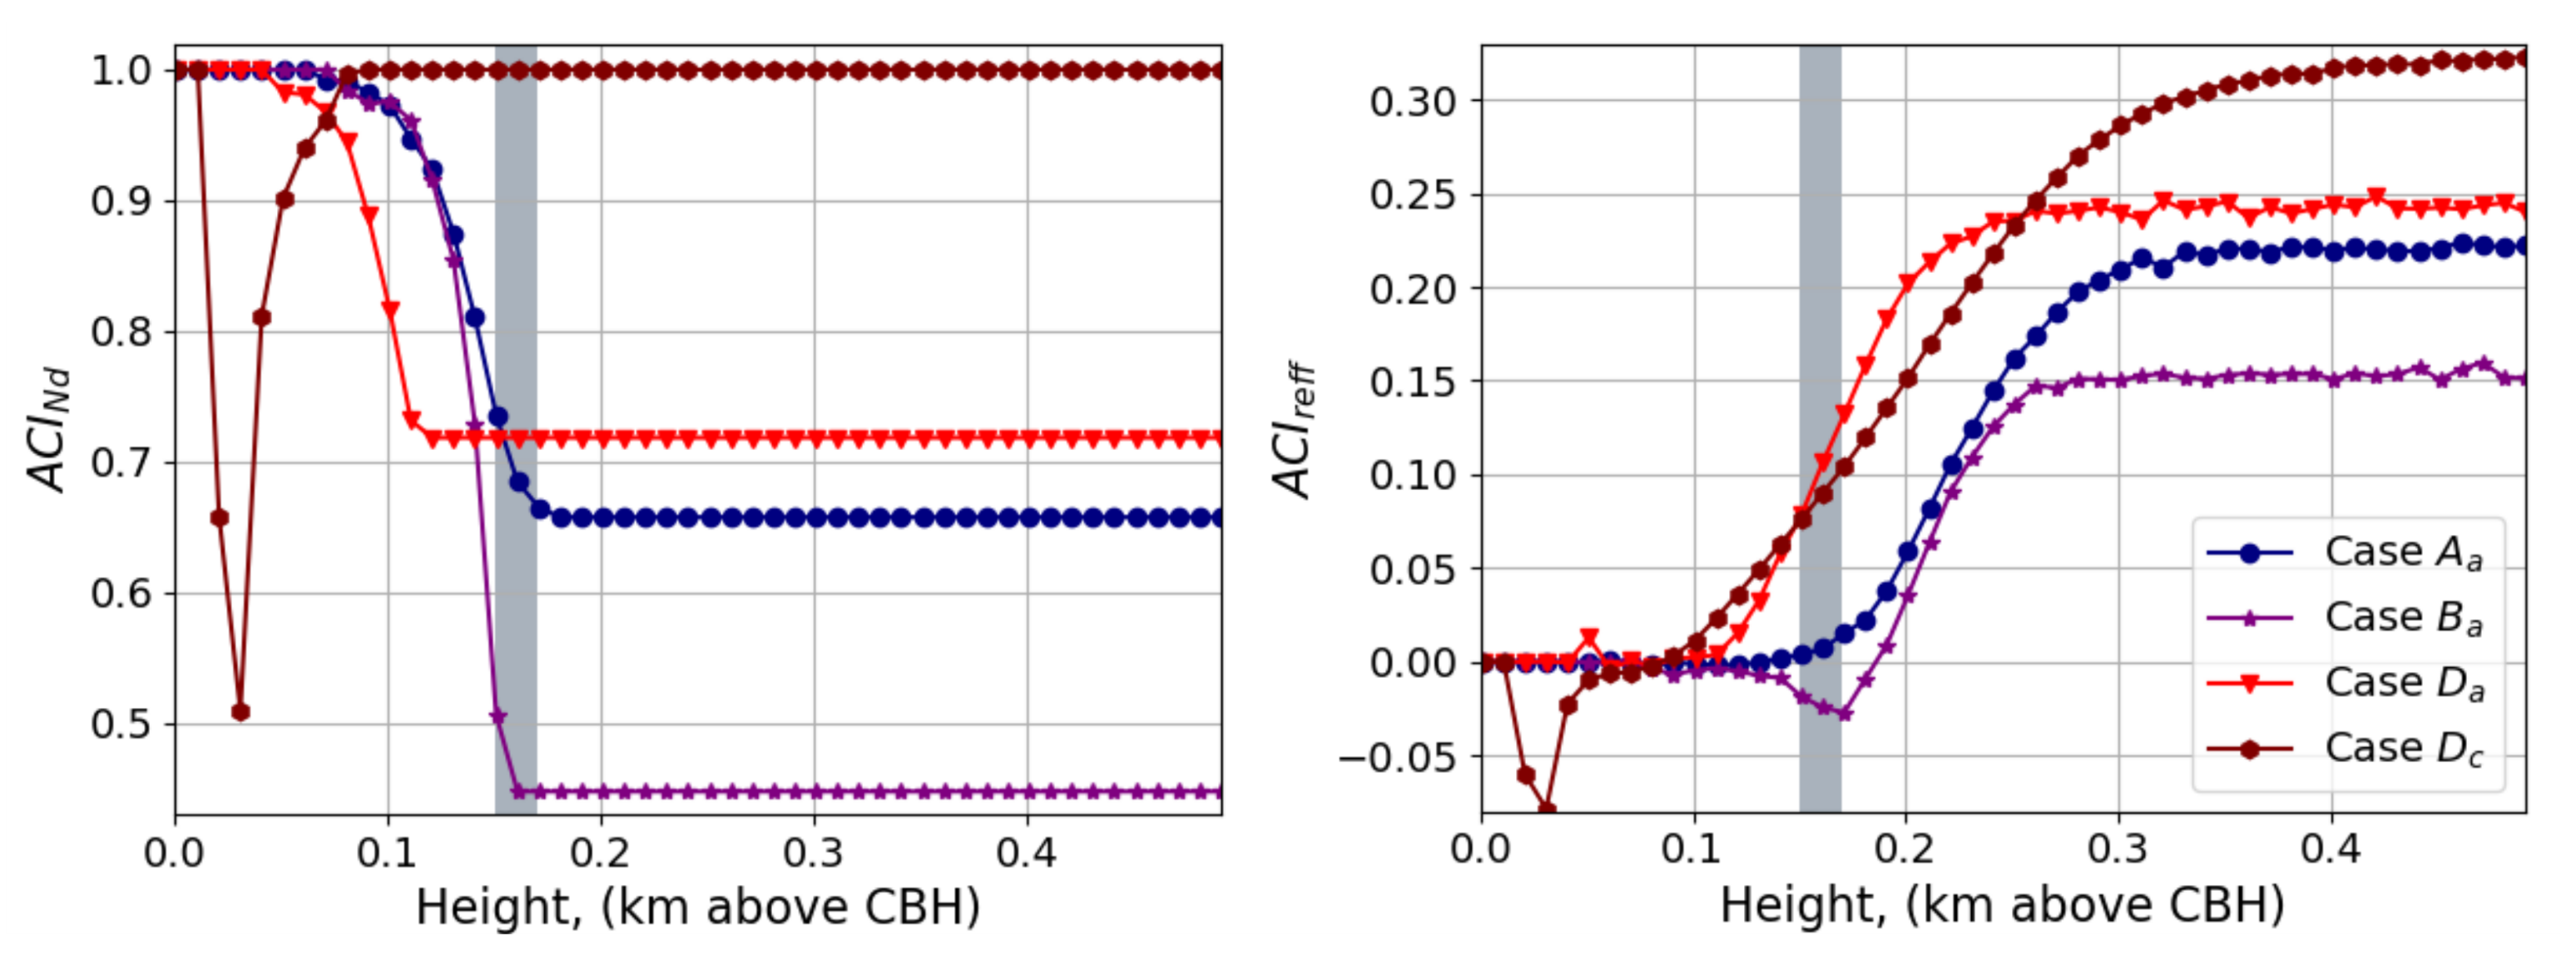
The simulated A C I N d and A C I r e f f for accumulation-mode Cases ( A a , B a , and D a ) (Figure 9) present opposite behaviors, decreasing and increasing with height, respectively. A C I N d minimum range is between 0.447 and 0.718, whereas A C I r e f f maximum range is between 0.152 and 0.322. The Case B a presents negatives A C I r e f f values from C B H + 120 to C B H + 180 m due to a positive relationship between N a and the droplet effect radius. This is known as the anti-Twomey effect and it has been previously observed in the Gulf of Mexico and the South China Sea [51]. It may be caused by the low LWP values in this region (from 0.12 to 5.79 g / m 2 ). In the Case D c , both A C I N d and A C I r e f f reach the maximum theoretical value (i.e., 1 and 0.33, respectively). In other words, the whole PSD is activated. This case would rarely occur in real atmospheric conditions since it requires the presence of pure coarse-mode dust. The grey bars mark the height at which Z e reaches the minimum radar sensitivity value. Thus, only the information to the right side of this bar can be seen by the radar. The ACI indexes of Case D c also present a local minimum at 20 m, which may also be associated with the anti-Twomey effect. In any case, this behavior would not be detectable by radar because Z e is below the typical minimum radar sensitivity.
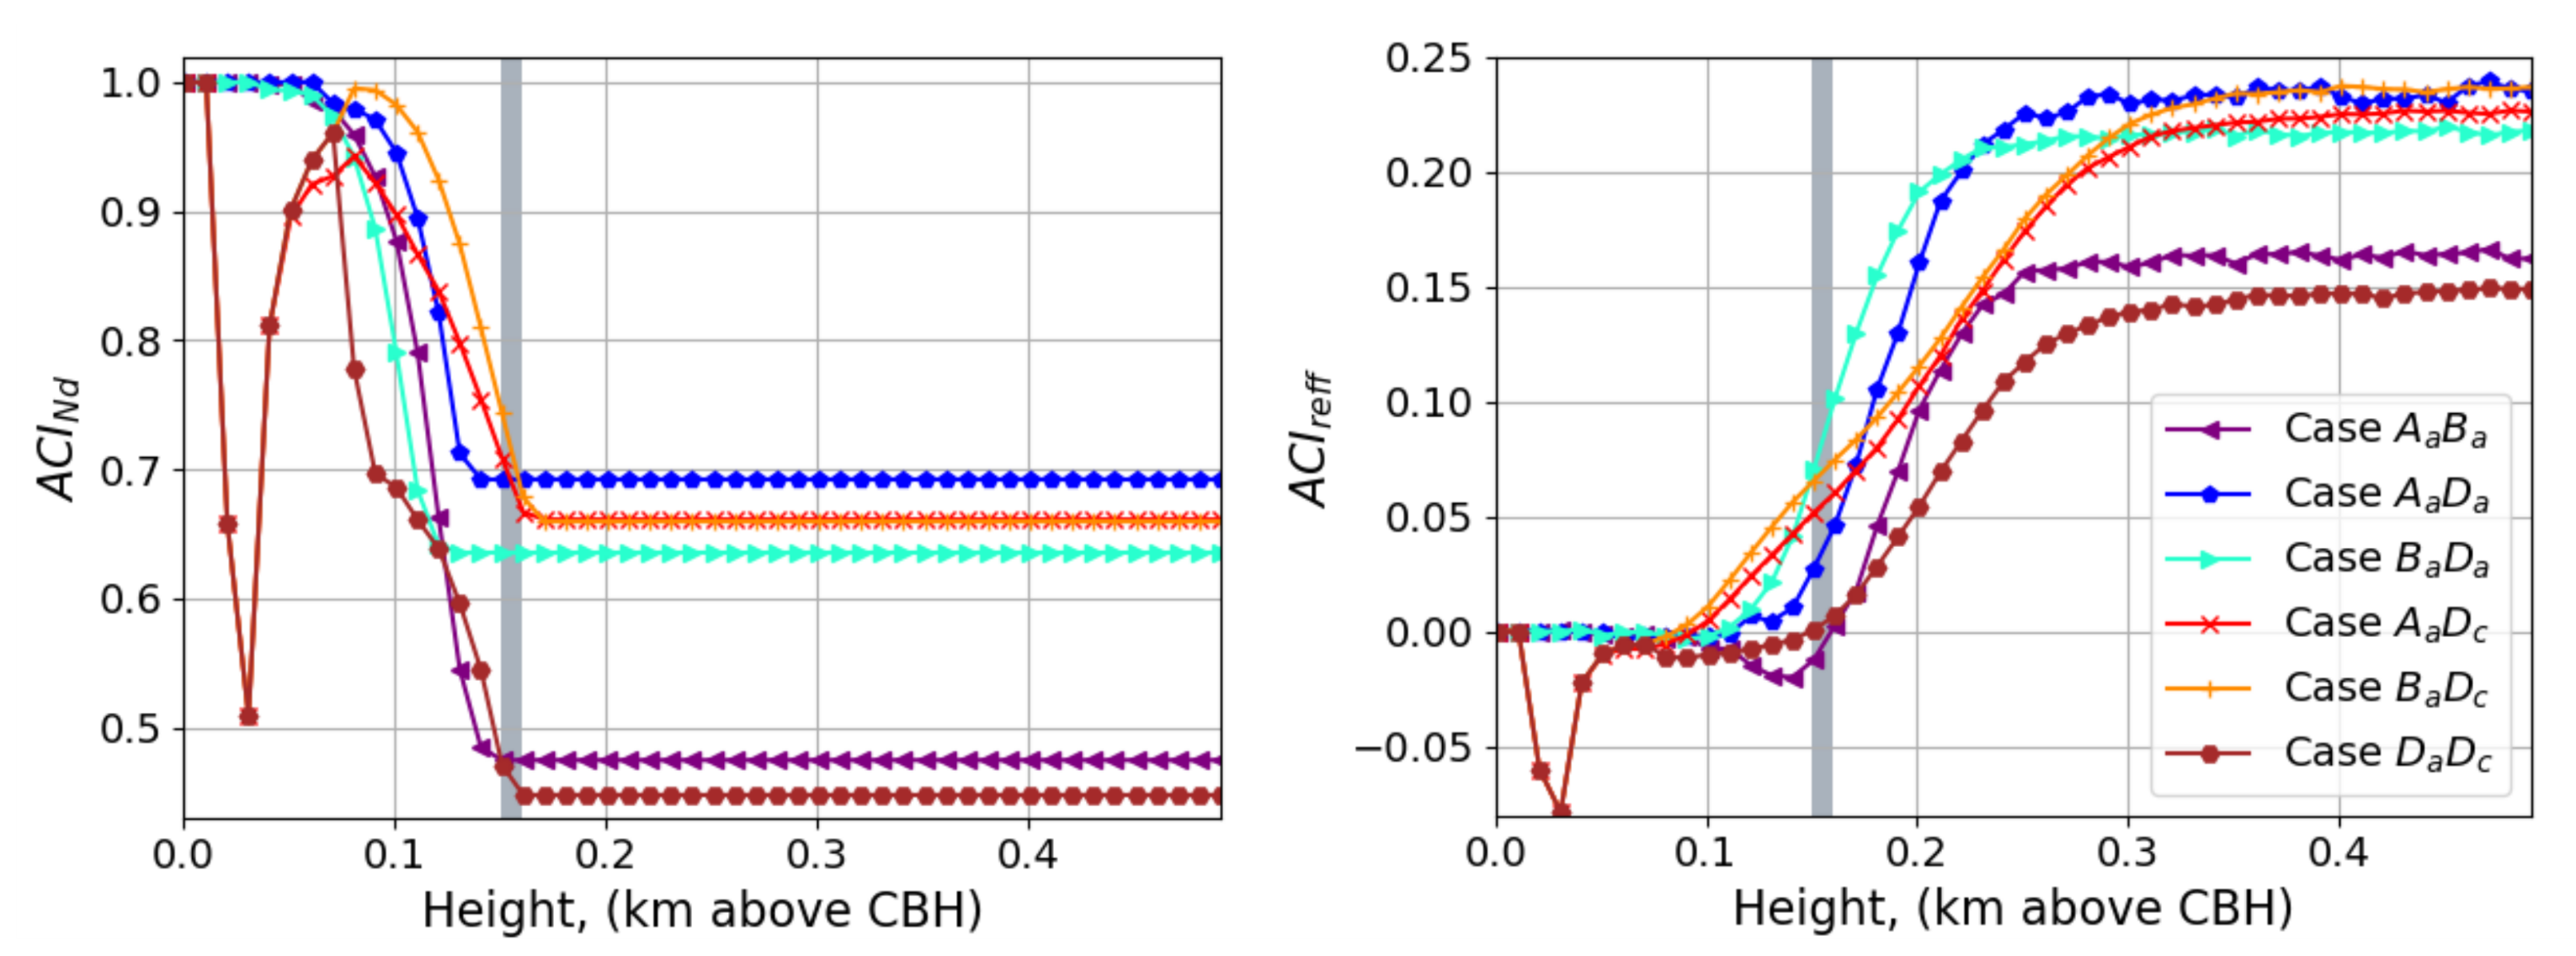
Looking for more realistic study cases, two-type aerosol particles mixtures have been simulated (Figure 10). The ACI index values of accumulation-mode mixtures (i.e., A a B a , …) are dominated by the single-mode aerosol type with the larger modal radius. For example, the ACI value of B a D a ( A C I r e f f = 0.218 ) is close to the ACI of D a ( A C I r e f f = 0.240 ) because the modal radius of D a ( 0.2 μ m ) is larger than B a one ( 0.14 μ m ). This is related to the strong influence of the modal radius in the ACI index, as indicated by the sensitivity analysis performed in Section 4.
The ACI index behaviour is dominated by the D c if present in the mixture, as observed in Case A a D c and Case B a D c ). This behaviour is easily explained considering that D c is totally activated due to its bigger dry size, while only a small amount of A a and B a is activated [52] in the simulated process. However, the Case D a D c is dominated by D a because, although D a modal radius is smaller than the D c one, the N a of D a is more than 14 times larger than N a of D c [43]. The special Case D a D c is analyzed in detail in the Appendix A.2.
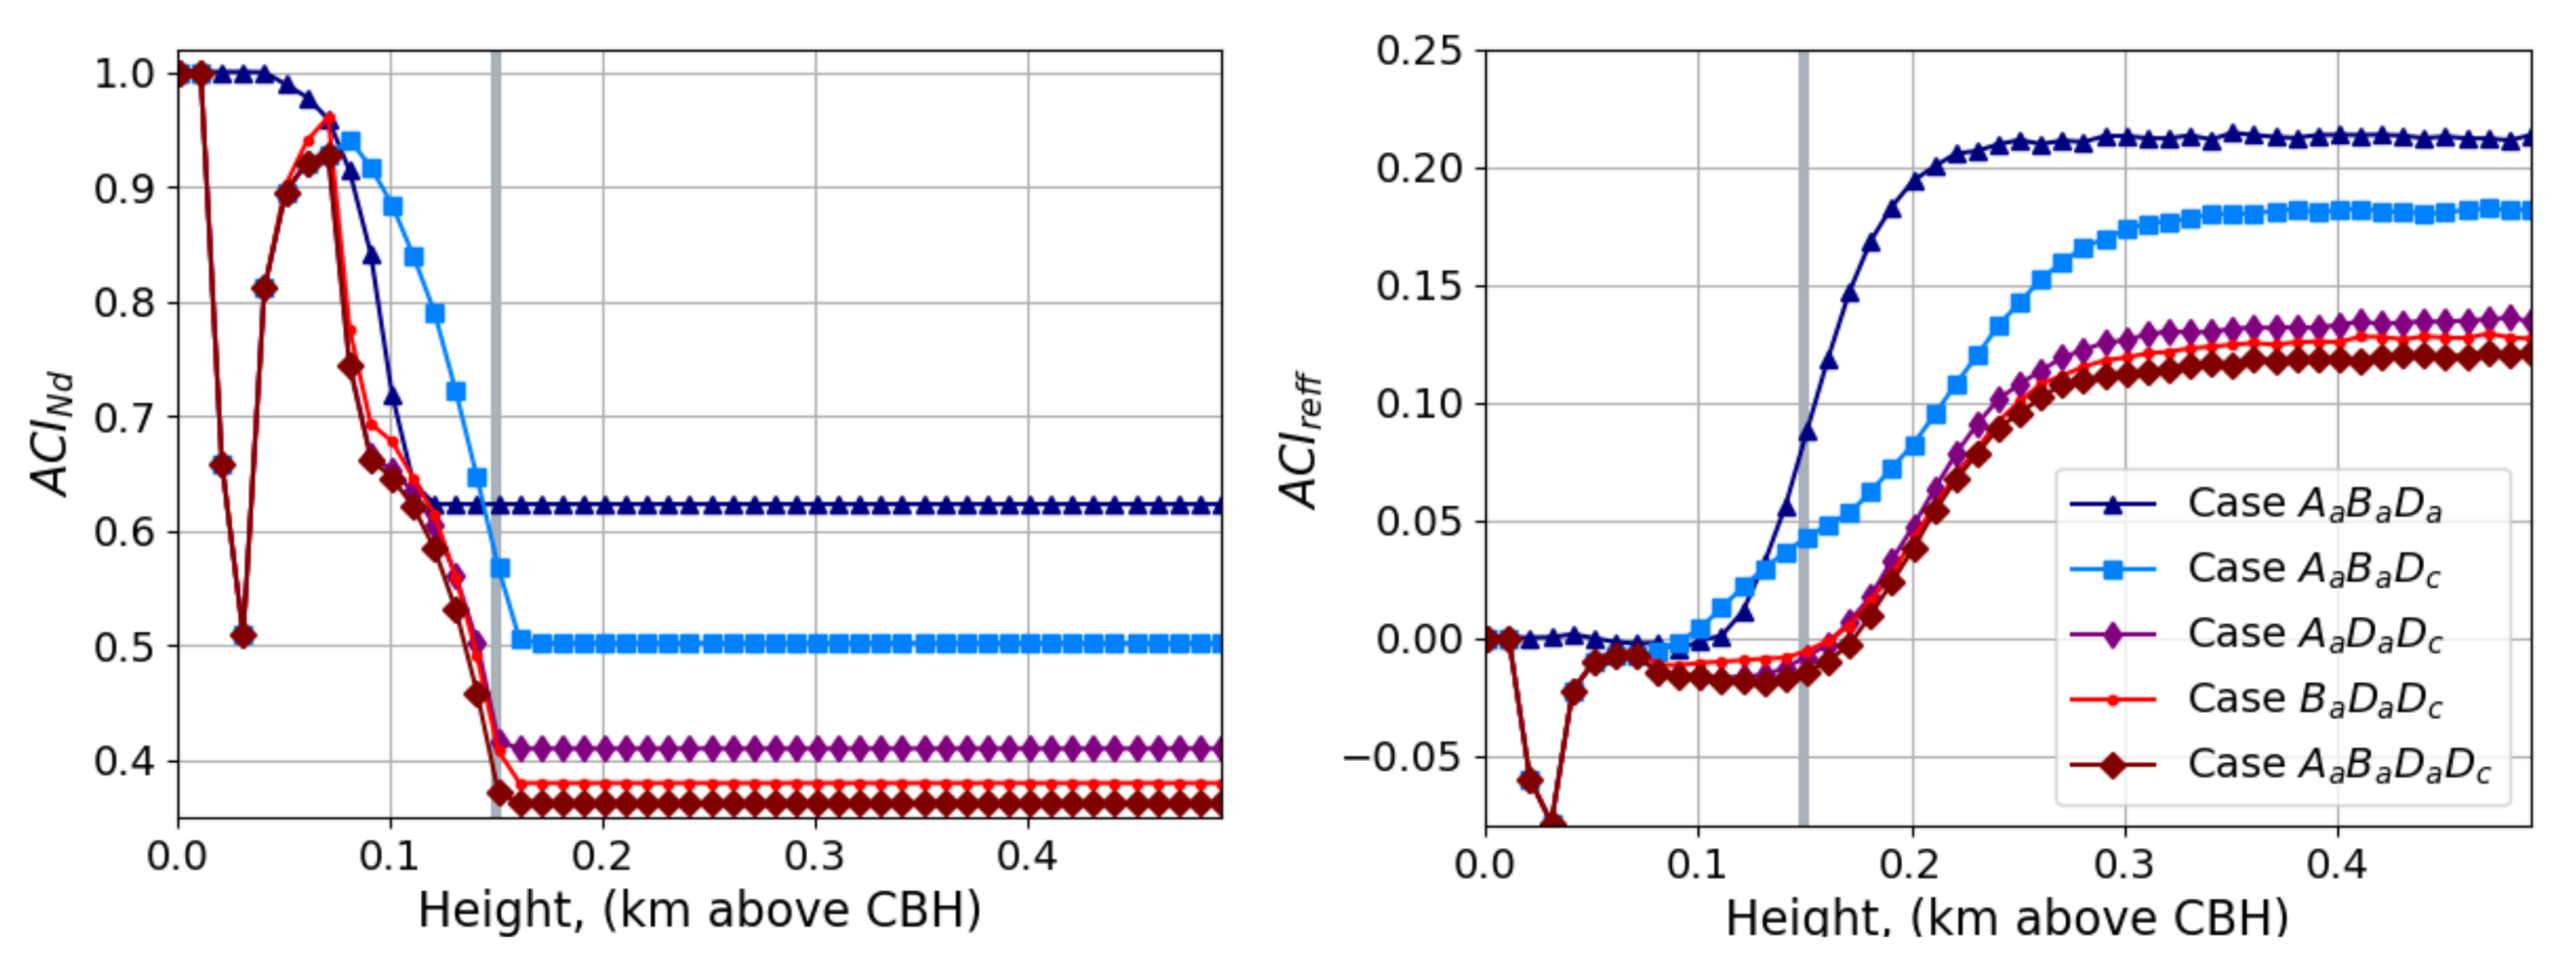
ACI indexes of mixtures of three and four aerosol types are shown in Figure 11. As previously mentioned, the weight of D a and D c is larger than the A a and B a in the ACI index values. Furthermore, it is worthy to note that the variation range of ACI indexes maxima decrease with the increase of aerosol-type mixture (i.e., variation range of the A C I r e f f maxima is [ 0.152 , 0.322 ] for one-type cases according to Figure 9 whereas variation range of the A C I r e f f maxima is [ 0.127 ; 0.213 for mixtures cases according to Figure 11). As the A C I r e f f range of variation decreases with mixtures, it is crucial to reduce the ACI uncertainty to distinguish mixture types.
If N a in accumulation mode increases enough, its influence can significantly decrease the ACI index values, as it can be seen in the Case A a B a D c where ACI values decreases up to A C I r e f f = 0.182 from A C I r e f f = 0.235 and A C I r e f f = 0.237 of the Cases A a D c and B a D c , respectively.
Considering the different aerosol types and mixtures analyzed, in general, it can be concluded that the ACI index must be measured at least 200 m above the minimum altitude measured by the radar (represented in this case by the grey bar) to assure that the ACI index is stable.

4. Results: ACI Index Sensitivity to Atmospheric Conditions

Under real atmospheric conditions, atmospheric parameters vary with time, affecting lidar and radar signals. As aforementioned, LARSS has been developed to investigate ACI indexes sensitivity to these changes. To do so, the one-variable-at-a-time method is used. This method allows to determine the fluctuation range of a single atmospheric parameter (e.g., updraft velocity) that causes an ACI-index variability ( Δ ACI) of 10 % (taking as reference the ACI index with constant atmospheric parameters). This process has been performed for the atmospheric parameters shown in Table 7, and for an ACI-index variability of 20 % and 30% for Case A a .
Table 7 shows the atmospheric parameters used in LARSS to investigate ACI indexes sensitivity. Those parameters to which the ACI indexes are more sensitive can be observed on the upper side of the table, whereas the bottom contains the ones which exert less influence. For example, refractive index fluctuation of [1%, 5%] causes an A C I β variation of [10%, 30%], making the ACI index very sensitive to refractive index. The same A C I A O D variation is obtained if the refractive index varies between 15% and 35%, indicating that A C I β is more sensitive to variations in the refractive index. According to these results, the ACI index must be derived in cases when the same aerosol type is present in the analyzed aerosol layer in order to keep the refractive index as constant as possible. It is worthy to highlight that A C I A O D should be prioritized over A C I β since it is less sensitive to refractive index variations (as noted by differences between blue and pink lines in Figure 12).
After the refractive index, ACI indexes show large sensitivity to the PSD standard deviation. Fluctuations of [4%, 10%]([6%, 16%]) cause an A C I β ( A C I A O D ) variation of [10%, 30%], i.e., ACI variation is still larger than the parameter fluctuation and must be carefully considered during the data analysis. Thus, events with the same aerosol characteristics must be used to prevent this influence and determine the ACI index. For example, it may be assumed that the anthropogenic aerosol is constant during winter. However, this assumption may not be valid for inter-seasonal anthropogenic aerosol. Thus, the ACI index may be derived from the same season but not with cases from the whole year.
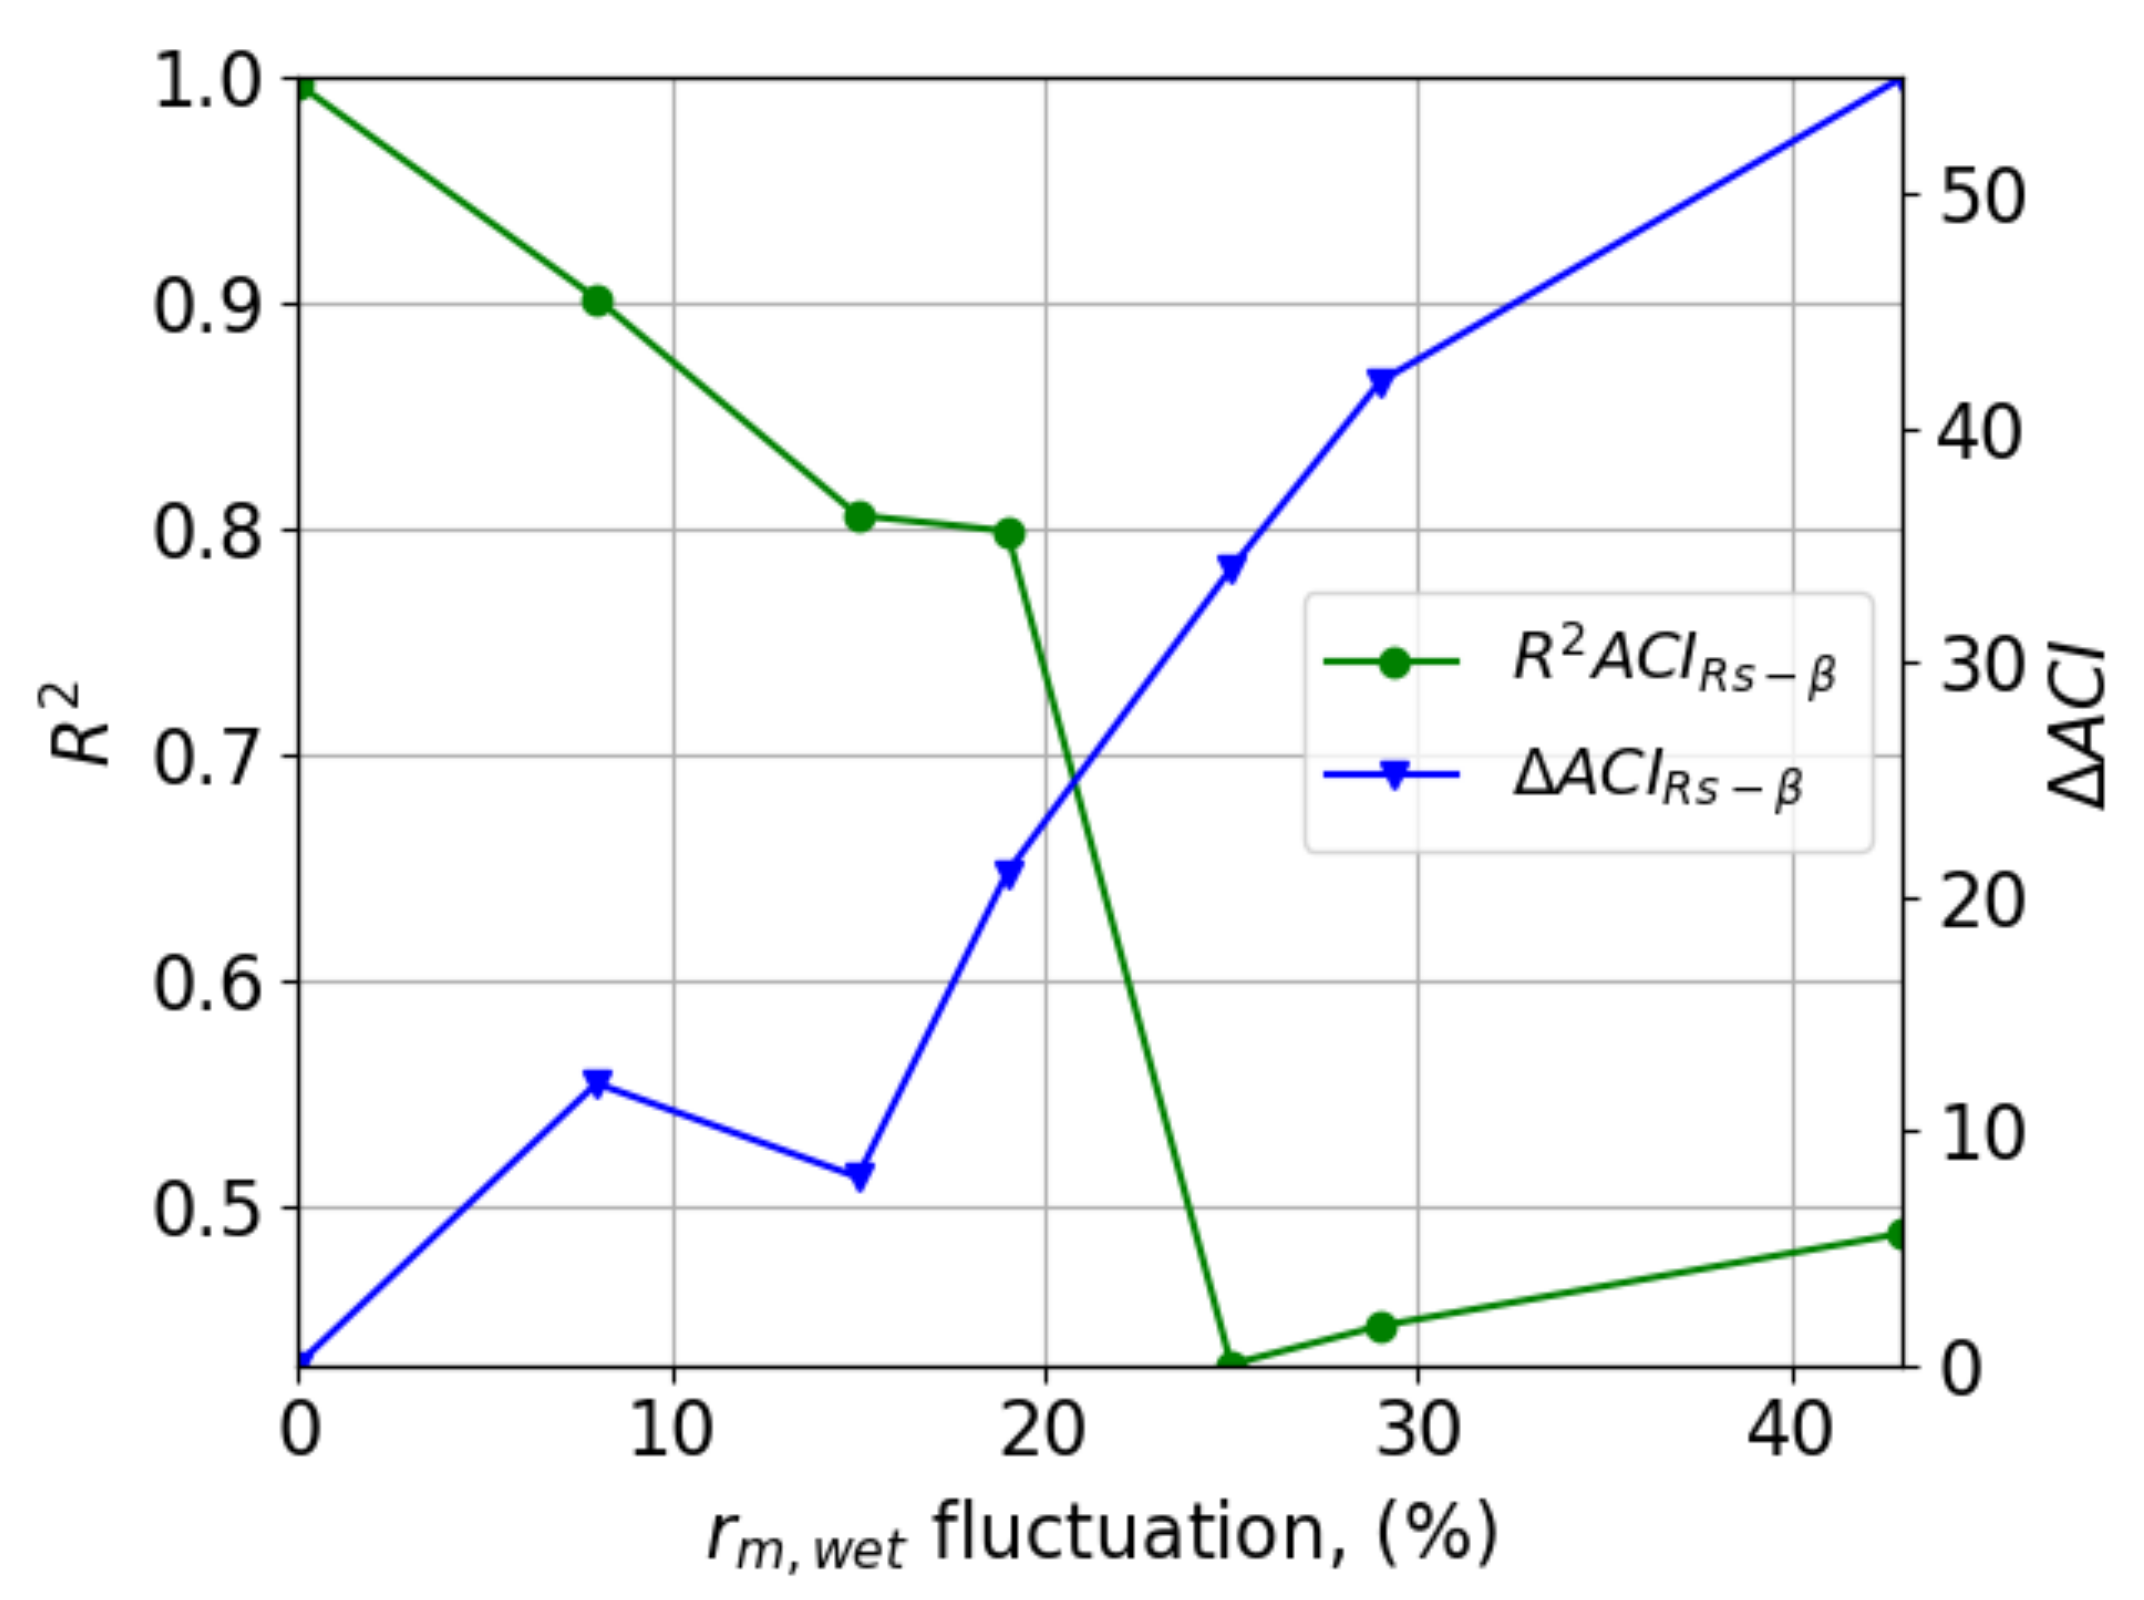
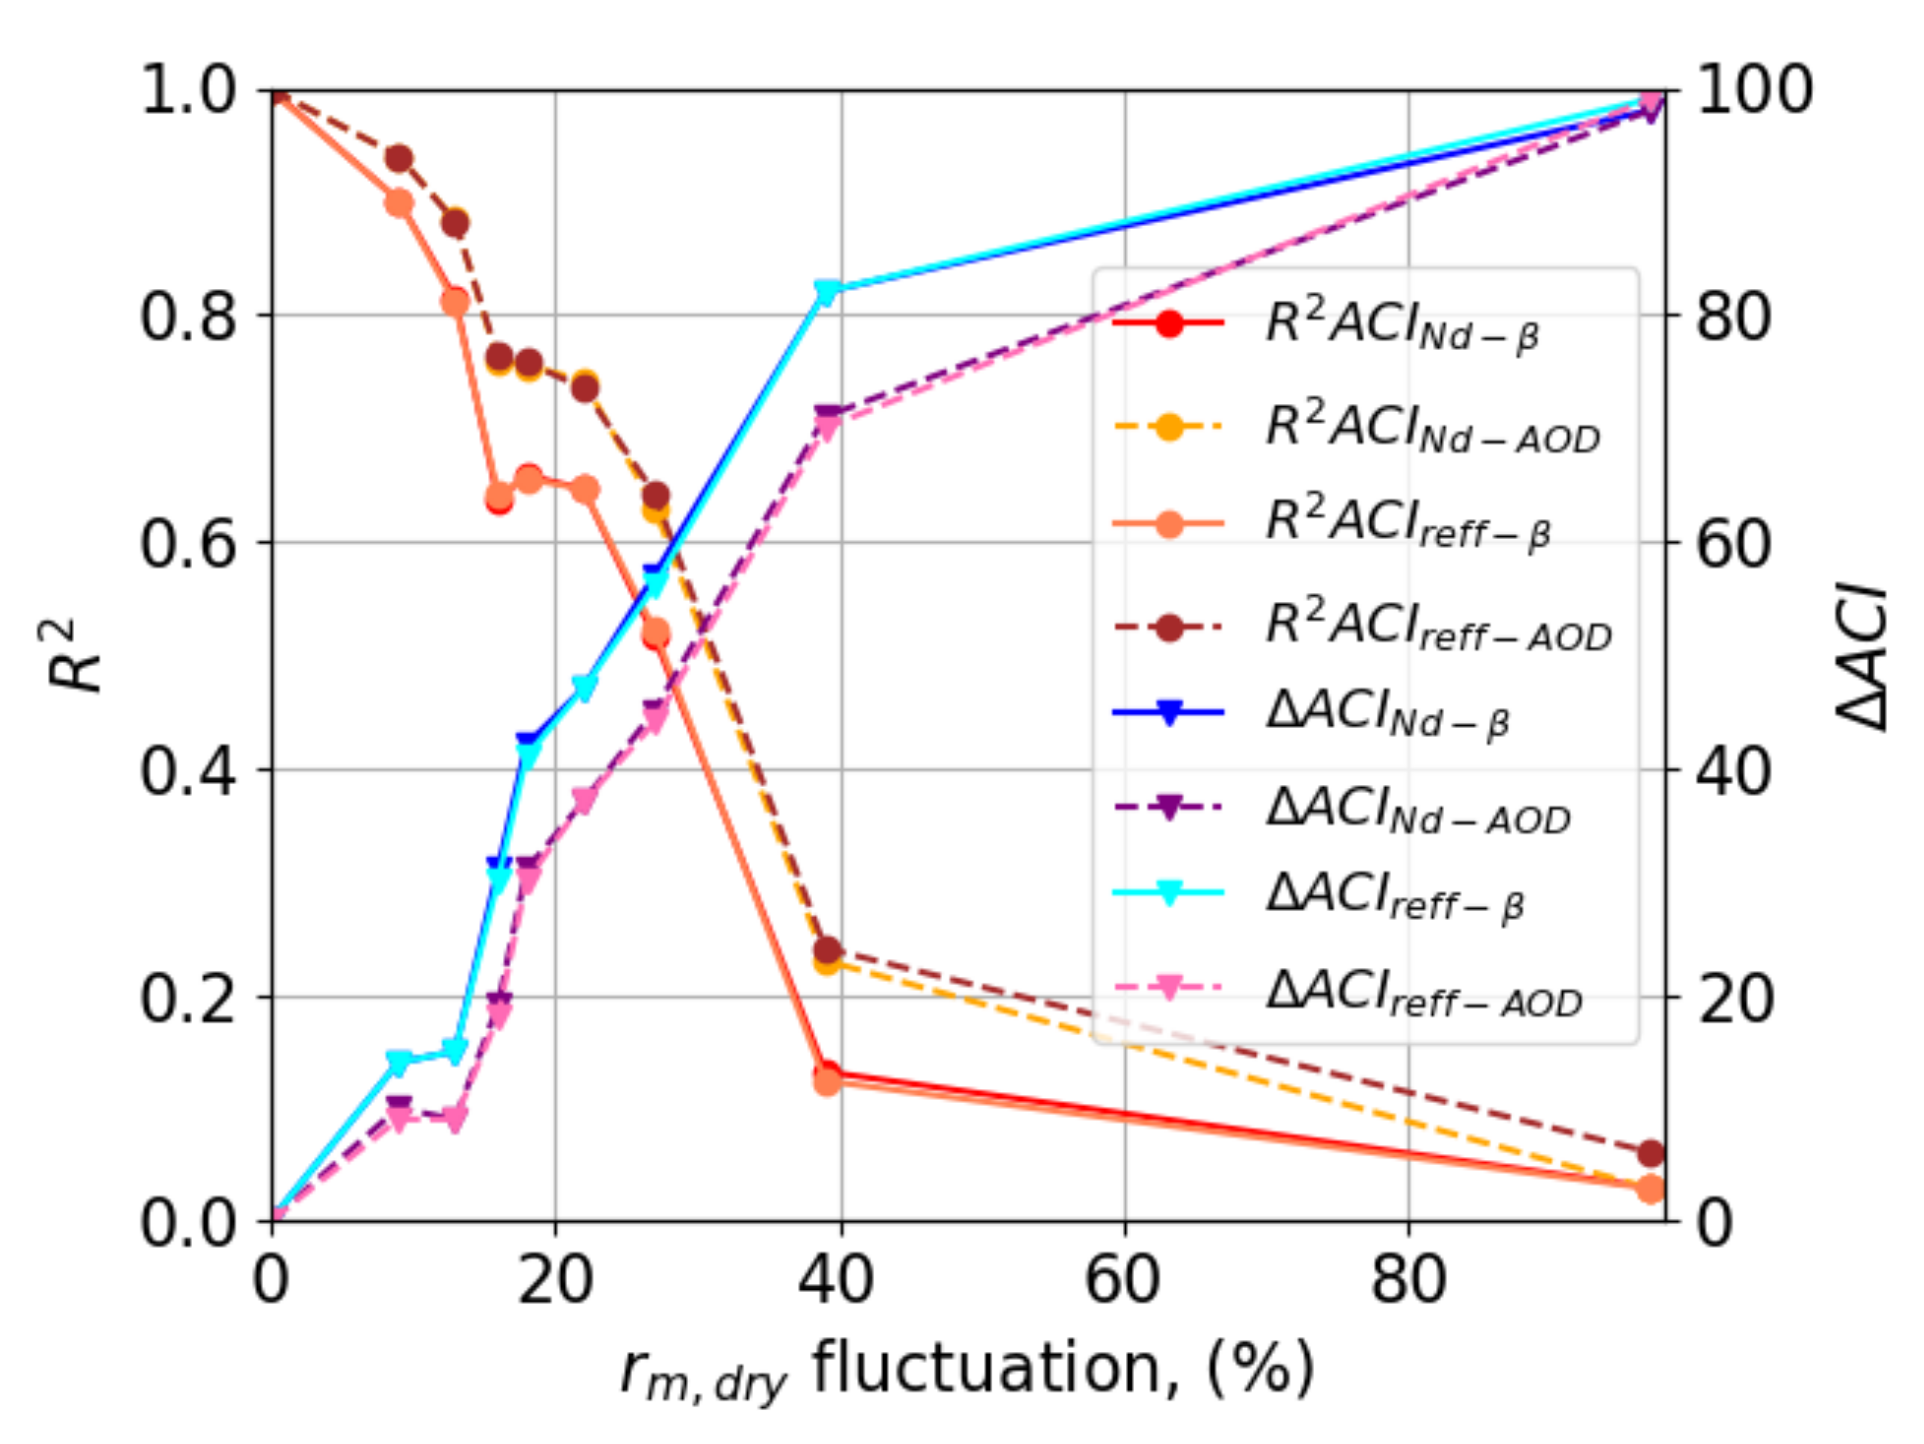
The last of the parameters that present a considerable influence on ACI indexes are dry ( r m , d r y ) and wet ( r m , w e t ) aerosol-particle modal radius. Δ ACI and the correlation coefficient ( R 2 ) are shown in Figure 12. As it can be seen, while r m , d r y fluctuations vary from 0% to 97%, R 2 A C I decreases from ∼0.99 to ∼0 and Δ ACI increases from ∼0% to ∼99%. According to these results, r m , d r y fluctuations must remain below 18 % during experimental studies to obtain a Δ ACI below 30% and R 2 greater than 0.76 . Larger fluctuations become a limitation that prevents the determination of the ACI indexes. As above-mentioned, the use of A O D as an aerosol proxy to retrieve the ACI index decreases the influence of the r m , d r y fluctuations (blue and light blue lines are above pink and purple lines in Figure 12).
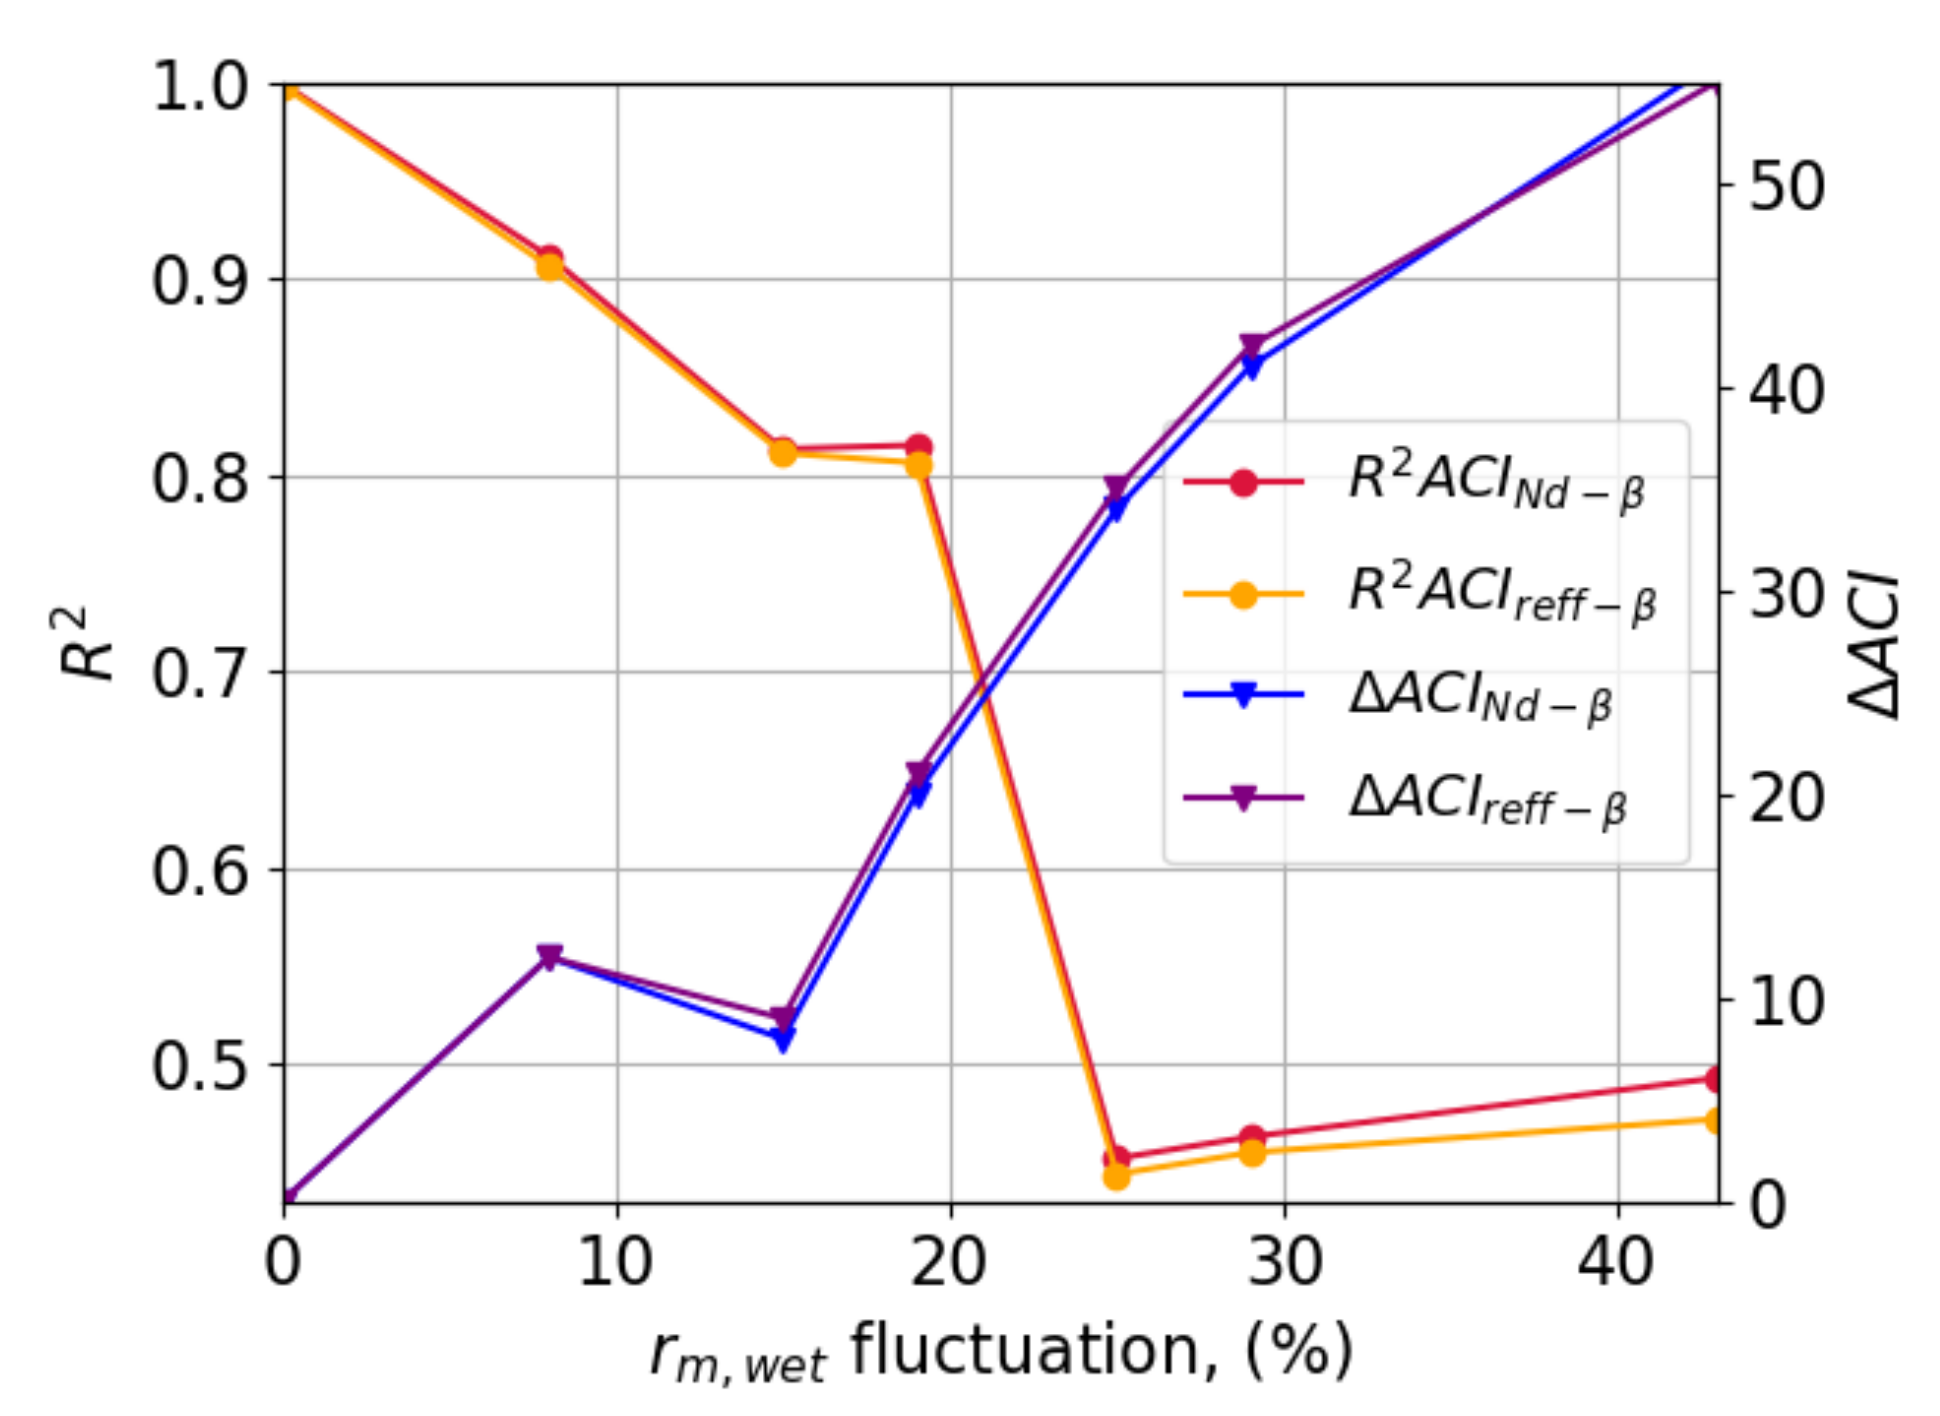
Since random variations may also occur in the vicinity of the CBH, the fluctuations of the wet aerosol-particle modal radius ( r m , w e t ) are also analyzed (see Figure 13). The results present a similar behavior to those shown in Figure 12. In this case, the r m , w e t fluctuations must remain below 19 % to keep Δ ACI below 21 % and R 2 greater than 0.80 . Thus, the fluctuations of r m , d r y are more important than r m , w e t in terms of ACI accuracy. This is a technical advantage since it is easier to control the r m , d r y at the surface level than at the CBH (for example, through in situ instrumentation). The influence of r m , w e t on the rest of the ACI indexes, similar to A C I R s β and A C I R s A O D , is shown in Figure A5.
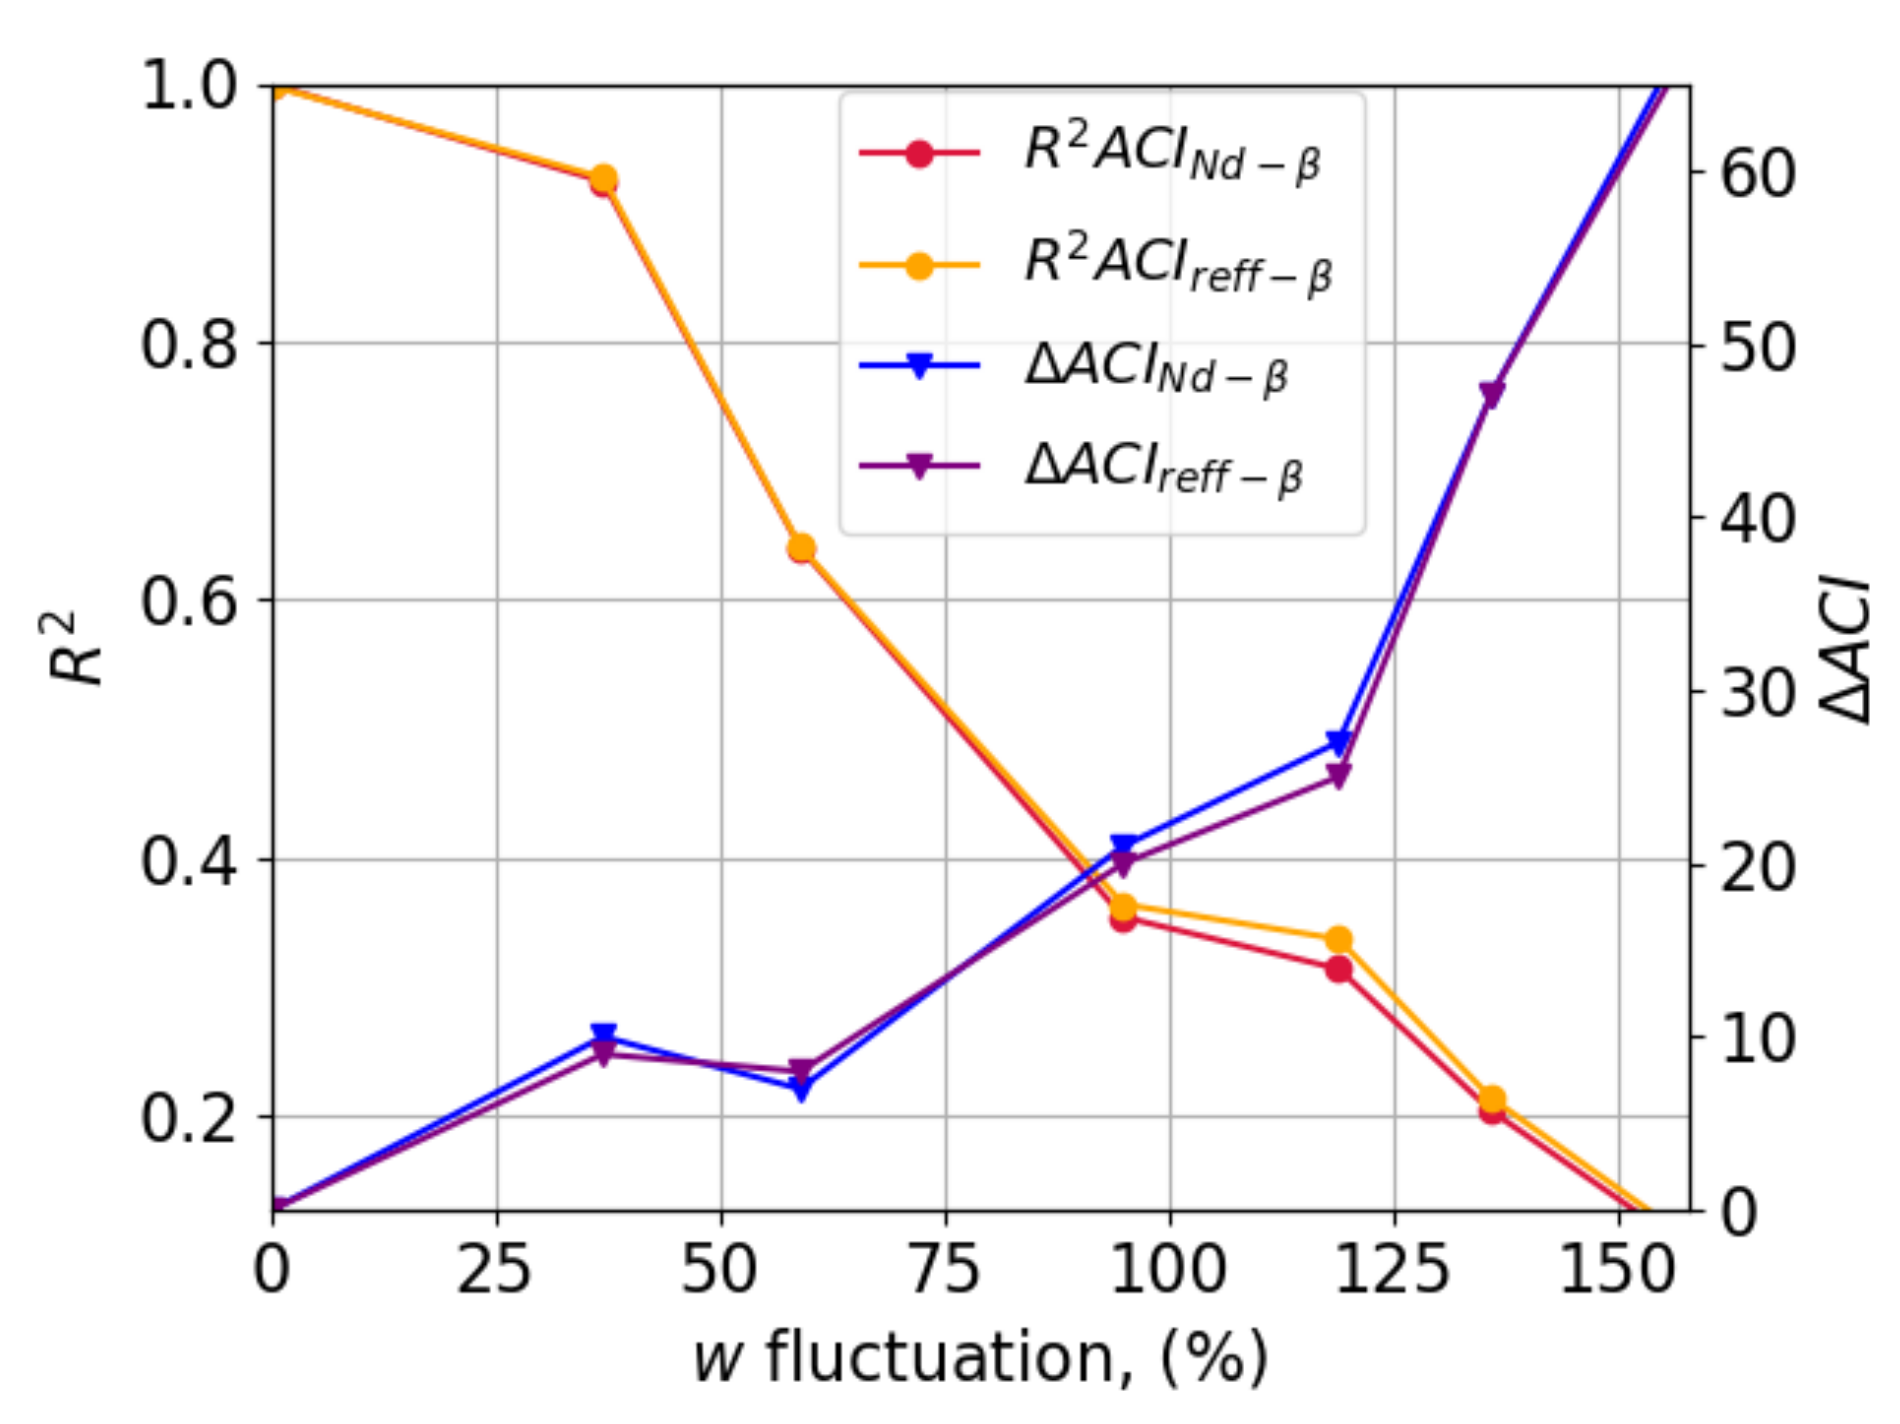
The ACI indexes show low sensitivity to the hygroscopicity parameter, the PSD maximum radius, and the updraft velocity, having small ACI variations associated with relatively large variations of these parameters. For example, large hygroscopic parameter fluctuations (135%) cause ACI variations below 20%. Despite the updraft velocity shows a low influence on the ACI index, its variability strongly affects the correlation of the linear fit ( R 2 ) used to determine the ACI index (Figure 4). While R 2 remains above 0.6 for all the parameters in Table 7, the updraft velocity presents a R 2 of 0.3. A detailed analysis is tackled in Figure 14 with both Δ ACI and R 2 due to updraft velocity (w) fluctuations ranged between 0 % to 158 % . Despite Δ ACI remains very low even for large w fluctuations (e.g., Δ ACI = 25 % for Δ w = 119 % ), R 2 decreases considerably, affecting the ACI index reliability. Thus, w fluctuations must remain below 59 % during the experimental study to obtain a Δ ACI below 9% with a correlation of around 0.650 . The influence of w on the rest of the ACI indexes is shown in the Appendix (Figure A6). From the point of view of the experimental approach, the availability of w data (e.g., from a Doppler cloud radar, Doppler lidar, radiosonde) would be very beneficial for the study of ACI.
As a summary, from our sensitivity analysis, we can conclude that the ACI index is quite sensitive to the aerosol refractive index, PSD standard deviation, and the modal radius, whereas the hygroscopicity parameter, the PSD maximum radius, and the updraft velocity have much lower influence. Nonetheless, these properties still contribute to the process and can alter other parameters, such as R 2 , and should not be neglected.

5. Proposal of ACI Index Based on Remote-Sensing Measurements (ACIRs)

As mentioned in Section 2.2, A C I r e f f and A C I N d are calculated through retrieval algorithms that require many assumptions, increasing the ACI uncertainty. To avoid these assumptions and reduce the uncertainty, we propose an alternative ACI index based on direct measurement of radar ( Z e ) and lidar ( β ), introduced here as remote-sensing ACI index ( A C I R s ). This new index has been simulated for different mixtures of aerosol using LARSS (see Figure 15 and Figure A8). From the simulations, we observe that the A C I R s index behavior in the vertical coordinate is similar to the A C I r e f f but with a wider variation range ( [ 1 , 1 ] ). This variation range is explained by the combined influence of N d and D r e f f in Z e .
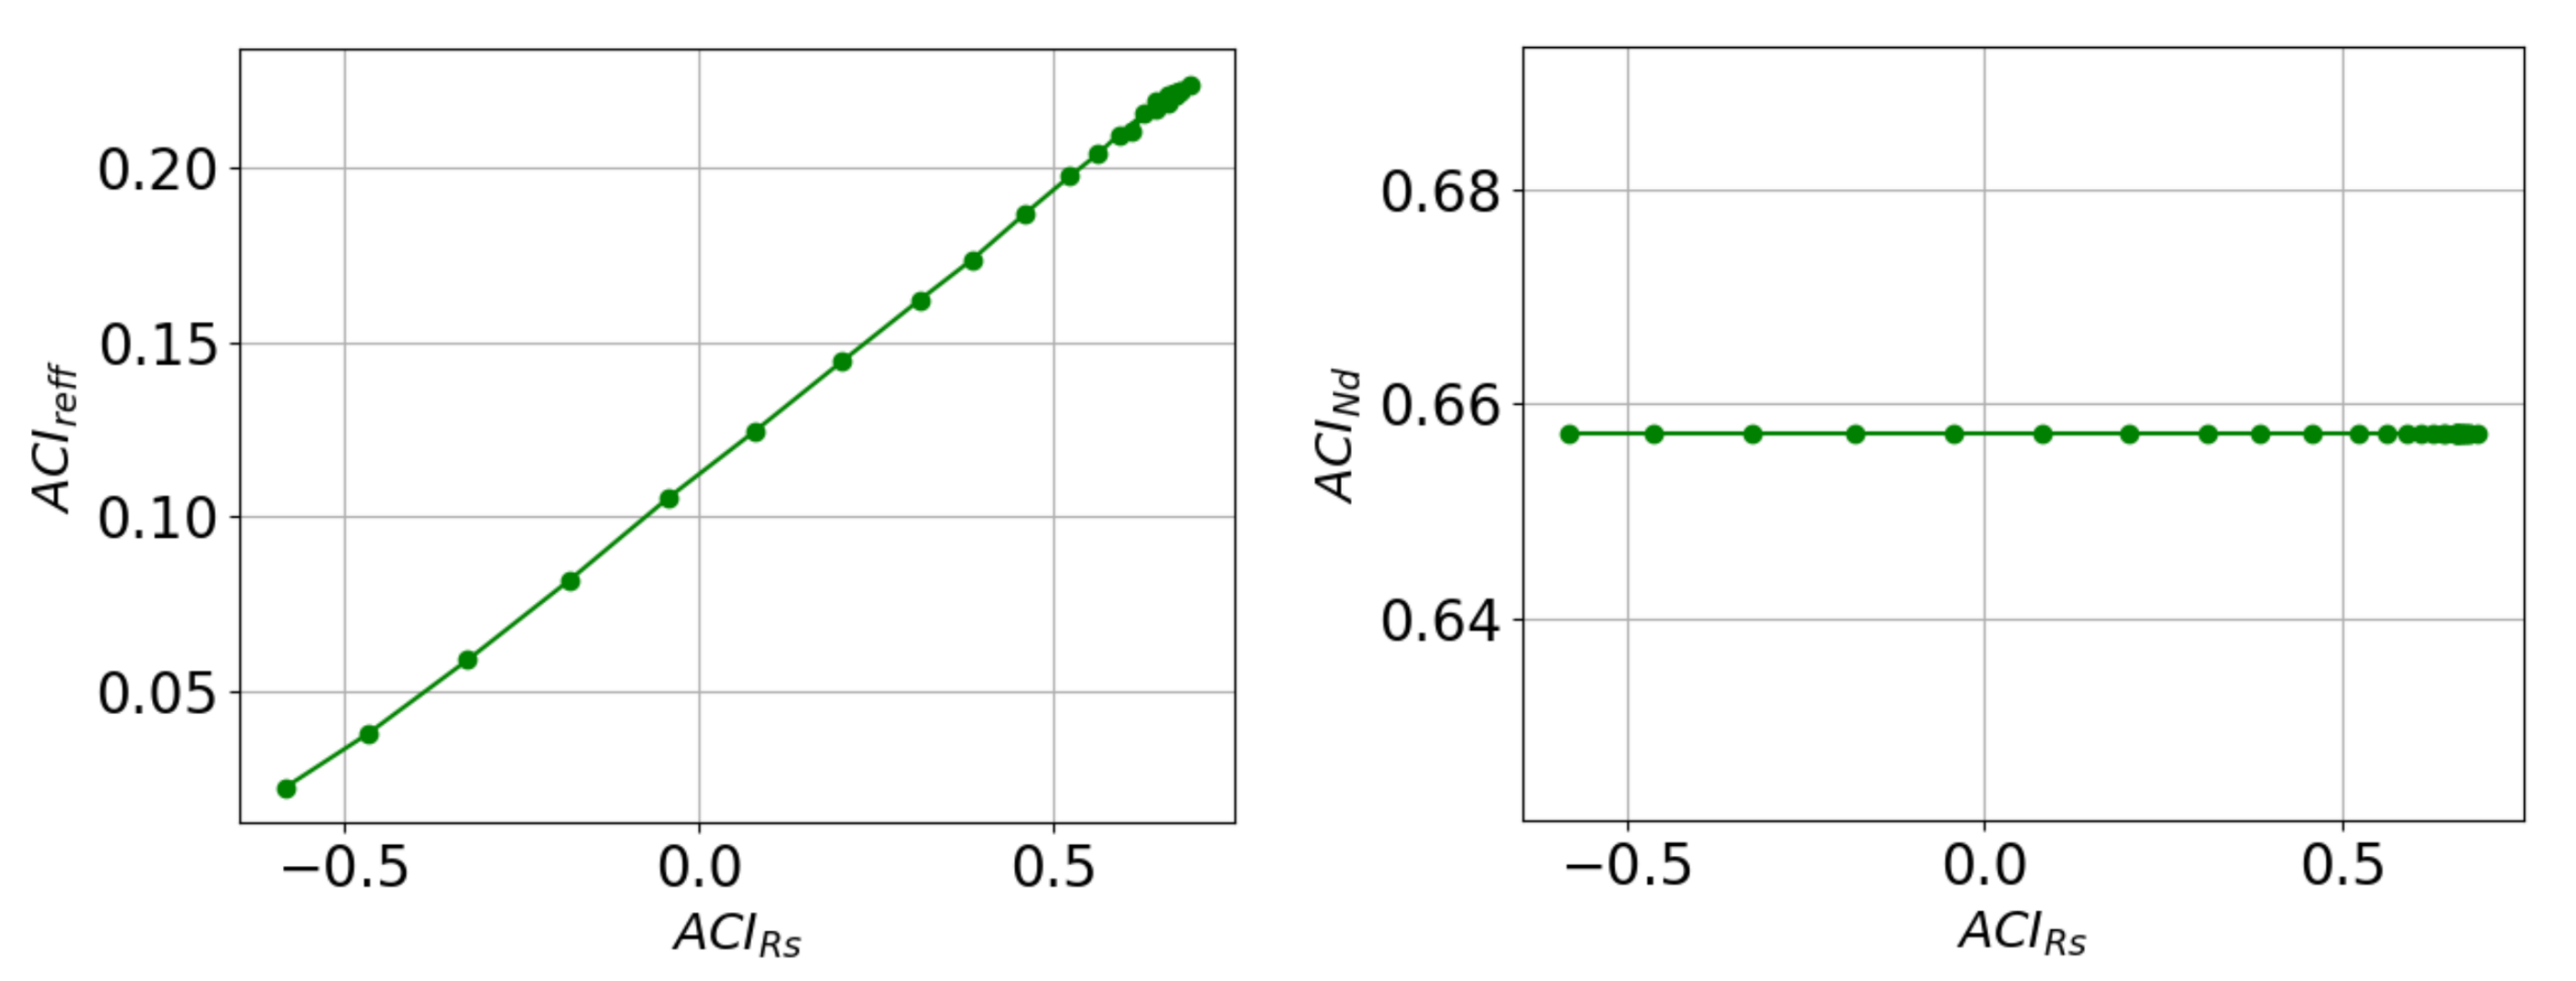
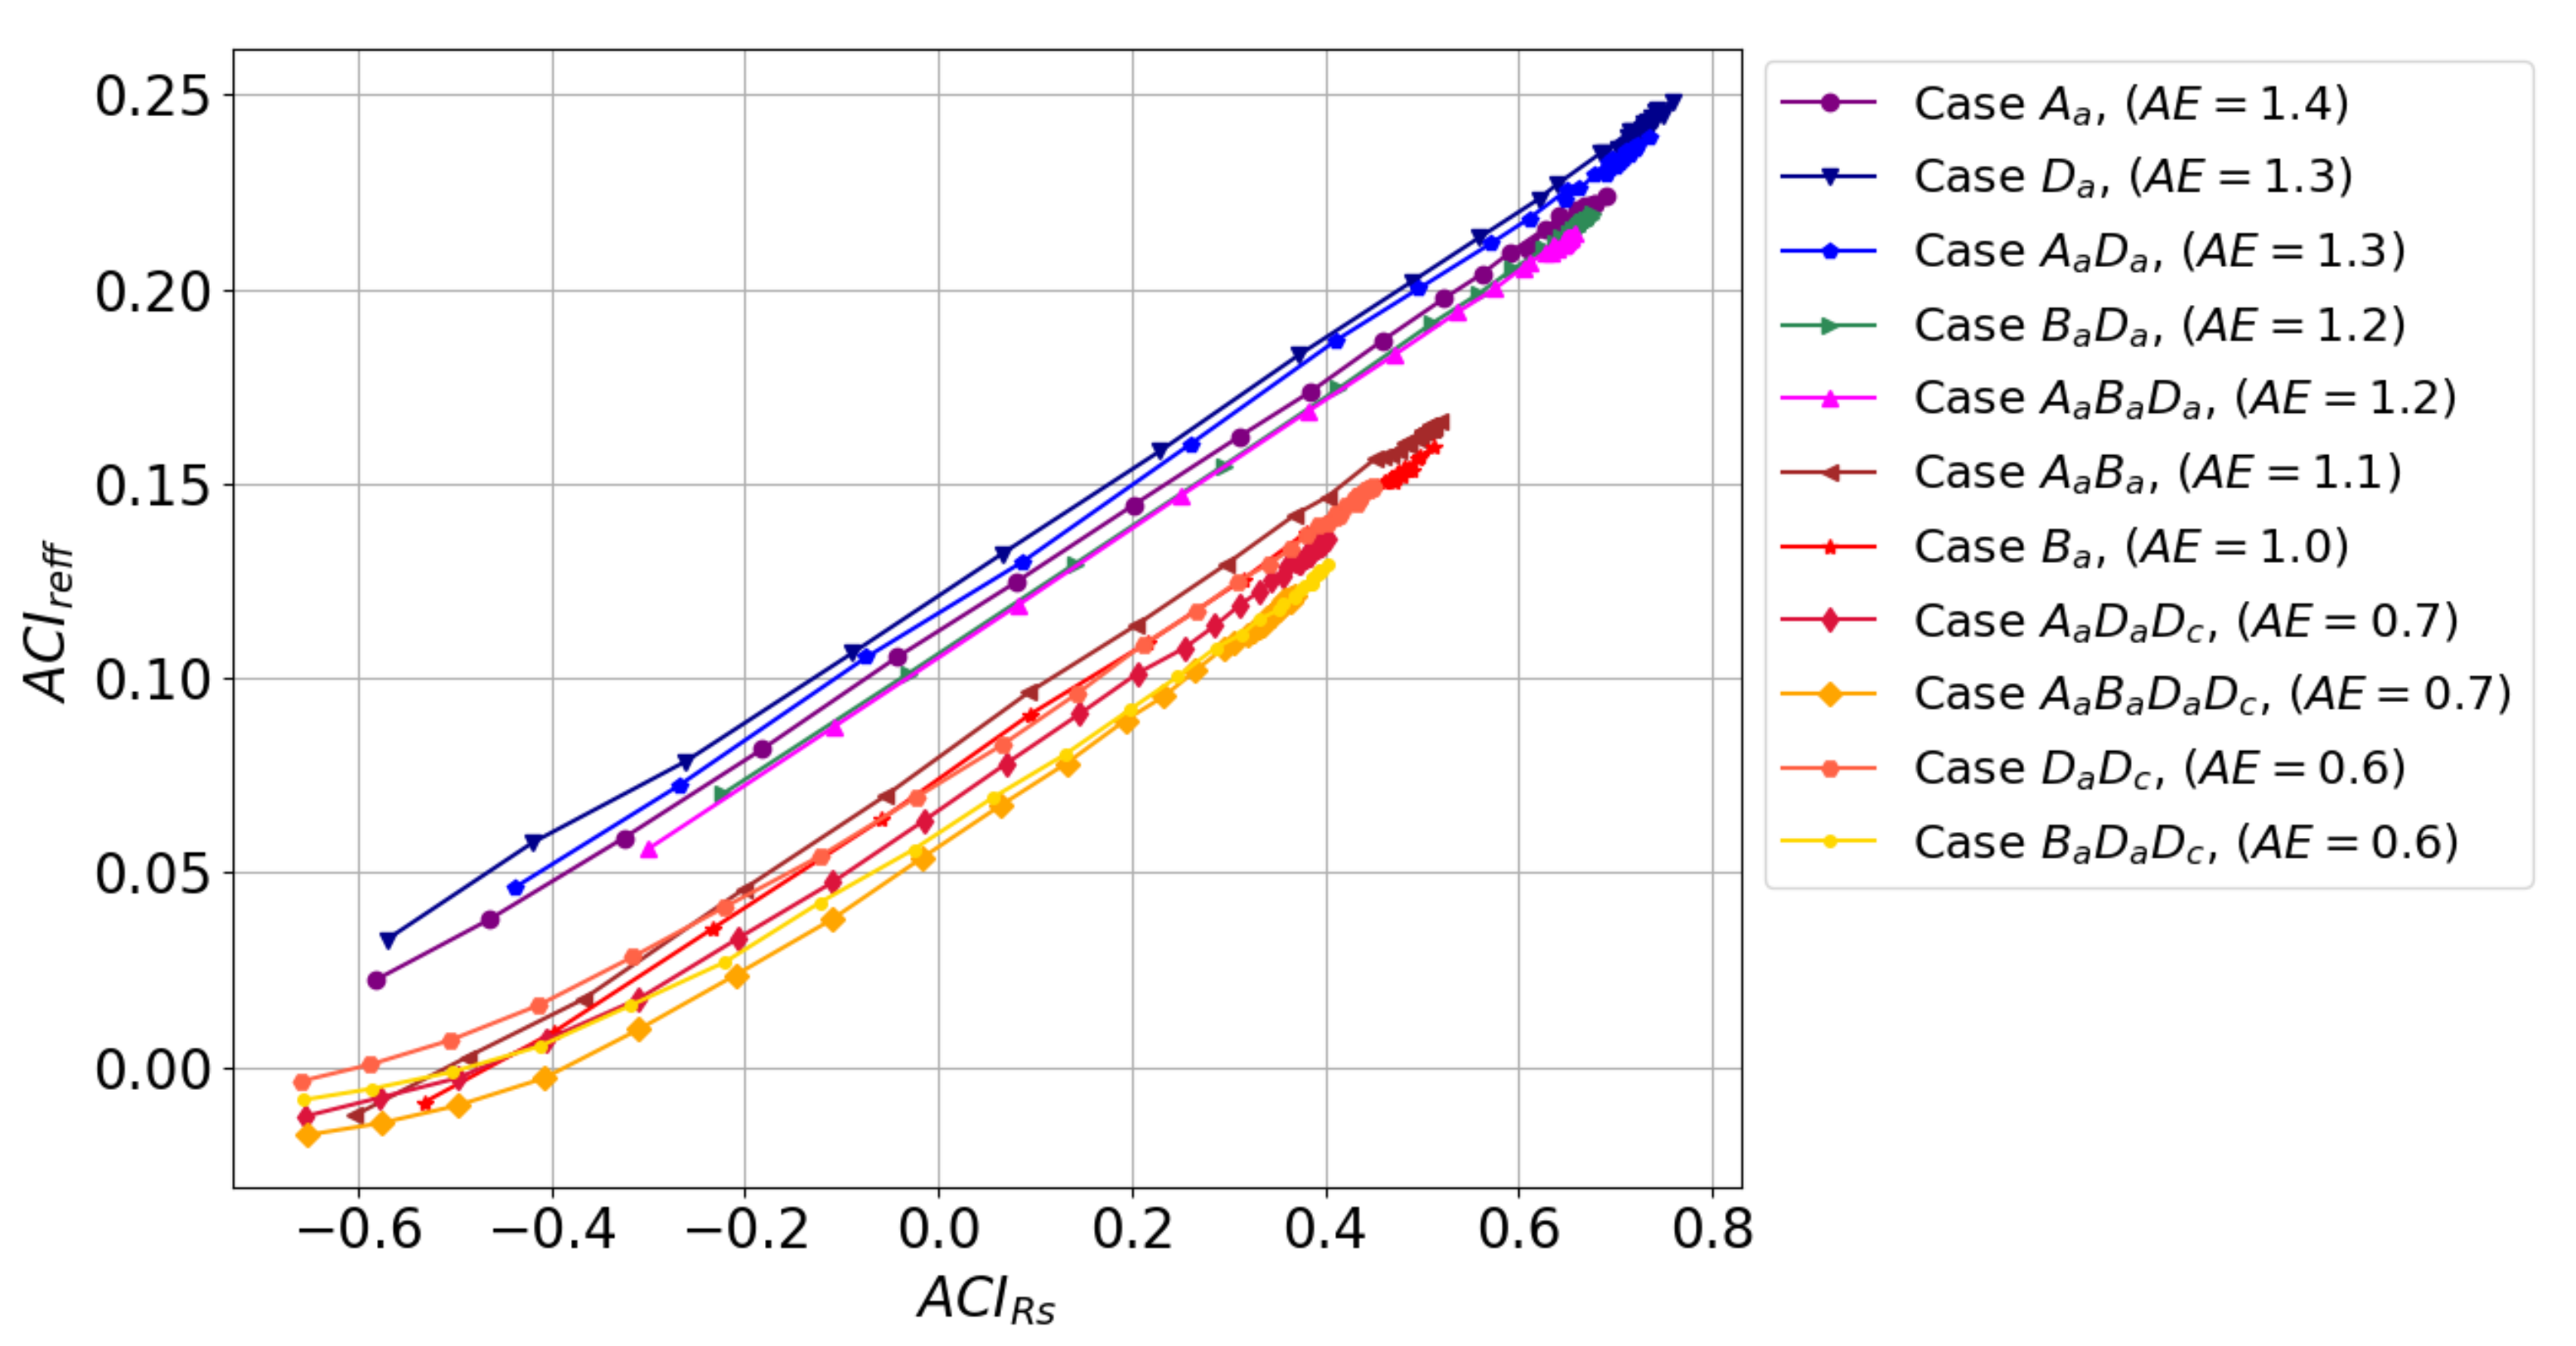
Since A C I R s is proposed as a new index in this study, there are no theoretical or experimental values in the literature to compare to. Thus, A C I R s is directly compared to A C I N d and A C I r e f f in Figure 16. In the case of A C I N d and A C I R s no direct relationship is observed. However, there is a high linear correlation between A C I r e f f and A C I R s , with R 2 = 0.990 . Restricting the linear fit to the region where Z e is greater than 60 d B , the assumed minimum radar sensitivity in LARSS [42], the linear correlation improves up to R 2 = 0.999 . Therefore, A C I r e f f can be derived by means of the A C I R s as A C I r e f f = 0.161 · A C I R s + 0.112 . However, this relationship depends on the aerosol type as shown in Figure 17, where A C I r e f f and A C I R s are compared ( Z e > 60   d B ). It can be noticed that the aerosol type does not affect the slope ( 0.16 ), but the intercept which ranges from 0.117 (Case A a D a ) to 0.072 (Case A a B a D a ).
According to the backscatter-related Ansgtrom exponent ( A E ), indicated in the legend, the data can be grouped by A E 1.2 (lines with blue color range) and ≤1.1 (lines with red color range), resulting in two A C I R s -to- A C I r e f f conversion equations, A C I r e f f = 0.164 · A C I R s + 0.112 and A C I r e f f = 0.153 · A C I R s + 0.073 , respectively. The A C I r e f f uncertainty derived from A C I R s is below 0.008 (a relative error of 4% for A a ), which indicates a good performance, considering that aerosol-particle and cloud microphysical inversion generate A C I r e f f uncertainties over 45 % [53,54,55]. Therefore, this method facilitates the retrieval of the A C I r e f f index from this linear relationship based on A C I R s since any inversion algorithm is needed. Finally, an A C I R s -to- A C I r e f f conversion cannot be inferred for A E < 0.6 because small changes in the A E imply a large change in both the slope and the intercept (see Figure A9).

6. Conclusions

This work has successfully presented a lidar and radar signal simulator (LARSS) under convective cloud conditions. LARSS has allowed studying the ACI indexes evolution in height, showing that A C I N d ( A C I r e f f ) decreases (increases) with height. A C I N d minimum value is reached at the S S m a x height. However, the ACI index evolution depends on the aerosol types. According to the 15 simulated cases, the A C I r e f f reaches the stable value between 220 m and 350 m above the CBH. Thus, the simulations indicate that the vicinity of the CBH shall be avoided to derive stable A C I indexes.
The Monte Carlo technique has been used to estimate the LARSS retrieved ACI-index uncertainty associated with the input parameters of the simulation (e.g., temperature, hygroscopicity parameter, standard deviation). For a case study using ammonia sulfate, an uncertainty of 5 % in all input parameters causes uncertainty of 6 % , 5 % , and 4 % in A C I N d , A C I r e f f and A C I R s , respectively. These results indicate the robust behavior of LARSS due to the low theoretical uncertainties. Additionally, the Activation Fraction ( A F ) (i.e., CCN-to- N a ratio) simulated by LARSS is within the uncertainty interval of the experimental one measured at the AGORA observatory in two sites (Granada and Sierra Nevada). Similar differences between predicted and measured CCN concentration were measured by Ervens et al. [40] for S S = 0.22 , and by Almeida et al. [41] for S S = 0.23 . Therefore, LARSS has been validated, exhibiting a good agreement with experimental results.
The combination of co-located lidar and radar measurements to disentangle the aerosol particle effect on clouds requires the rest of the atmospheric conditions to be constant. Since this assumption is usually not fulfilled, the ACI indexes sensitivity to atmospheric conditions (such as dry and wet aerosol modal radius and the updraft velocity) has been analyzed through the once-variable-at-a-time study. It has been determined that even small fluctuations of the refractive index, the standard deviation of the PSD, and the modal radius of the PSD prevent the quantification of the ACI index. Thus, the aerosol properties must be constant during the analyzed period and in the aerosol layers used for the retrievals of ACI indexes. For example, r m , d r y fluctuations must be below 18% to obtain a deviation of the ACI index below 30%. On the contrary, the updraft velocity, the maximum radius, and the hygroscopicity parameter presents little influence on the ACI indexes. Indeed, w fluctuations can be as high as 119 % to obtain a deviation of the ACI index of 30%. Additionally, this analysis points out that the ACI index based on the A O D is less affected by atmospheric fluctuations than the ACI index based on β , and thus, its use should be prioritized. Thus, the sensitivity study helps to improve the research approach for experimental ACI remote sensing studies, establishing an appropriate guideline on the technical setup and data analysis.
This study also provides a new methodology to obtain A C I r e f f A O D from A C I R s —a new index based on A O D and Z e as proxies. According to simulations, A C I r e f f A O D = a · A C I R s + b with a = 0.164 and b = 0.112 for A E 1.2 and a = 0.153 and b = 0.073 for A E < 1.2 for ammonium sulfate (relative error of 4%). This approximation is valid if the predominance of the coarse-mode is not too strong ( A E > 0.6 ). The main benefit of this new approach, based on direct measurements, is that aerosol-particle and cloud microphysical inversion are avoided.
Despite the current version of LARSS allows a better understanding of the experimental approach of the aerosol influence in convective cloud formation, future developments including more processes, such as the coalescence droplet growth, may help to better understand the aerosol–cloud interactions in more complex scenarios, such as in stratocumulus clouds.

Author Contributions

C.M.F.-Z. and J.A.B.-A. designed the methodology, the simulator, obtained simulation results and wrote the manuscript. M.J.G.-M. helped with the discussion of the results and wrote the manuscript. J.A.C.-V., F.R. and S.C. obtained and provided the in situ experimental results. E.M.-R. and L.A.-A. helped to improve the manuscript. All authors have read and agreed to the published version of the manuscript.

Funding

This work was supported by the Spanish Ministry of Economy and Competitiveness through projects CGL2016-81092-R, PID2020-120015RB-I00 and RTI2018-101154-A-I00, the Regional Government of Andalusia through project AEROPRE (P18-RT-3820), and by the Spanish Ministry of Education, Culture and Sports and Spanish Ministry of universities through grant FPU19/05340. The financial support for EARLINET in the ACTRIS.IMP 871115 (H2020-INFRADEV-2018-2020) is gratefully acknowledged. This work is related to activities within the COST Action CA18235 PROBE (PROfiling the atmospheric Boundary layer at European scale). The authors thank the University of Granada, Programa Operativo FEDER Andalucia 2014–2020 through project DEM3TRIOS (A-RNM-430-UGR20). Juan Antonio Bravo-Aranda received funding from the Marie Skłodowska-Curie Action Cofund 2016 EU project—Athenea3i under grant agreement no. 754446. Maria J. Granados-Muñoz project has received funding from the European Union’s Horizon 2020 research and innovation programme under the Marie Skłodowska-Curie grant agreement No 796539. The financial support for UGR and FEDER funds through project B-RNM-496-UGR18 is gratefully acknowledged.

Data Availability Statement

The data that support the findings of this study are available from the corresponding author, upon reasonable request.

Acknowledgments

The authors thankfully acknowledge the FEDER program for the instrumentation used in this work. Thanks to the NOAA Global Monitoring Laboratory for providing the data acquisition and processing system and for the use of the CCN counter.

Conflicts of Interest

The authors declare no conflict of interest.

Abbreviations

SymbolDescriptionUnits
A 1 g R T L w R c p R v T 1 m 1
A 2 1 q v + L w 2 c p R v T 2 -
A C I Aerosol cloud interaction-
A C I A O D Aerosol cloud interaction index based on the backscatter coefficient-
A C I r e f f Aerosol cloud interaction based on the aerosol optical depth-
A F Activation fraction-
A O D Aerosol optical depth-
CInitial supersaturation-
C C N Cloud condensation nuclei # / m 3
c p Specific heat capacity of most air at constant pressure J / k g K
D d Droplet diameter μ m
D r e f f Droplet effective radius μ m
D r m o d Droplet modal radius μ m
DSDDroplet number size distribution-
gMean gravitational acceleration m / s 2
q v water vapor mixing ratio (mass of water per 1 kg of air)-
q w Liquid water mixing ratio (mass of liquid water per 1 kg of dry air)-
| K p | m r 1 m r + 2 2 -
m r Refractive index of water-
n ( D d ) Droplet number concentration with a diameter d # / m 3
N a Aerosol number concentration # / m 3
N d Droplet number concentration # / m 3
PSDParticle number size distribution-
RSpecific gas constant of most gases J / k g K
R 2 Correlation coeficient-
RHRelative humidity%
r m , d r y Dry aerosol-particle modal radius μ m
r m , w e t Wet aerosol-particle modal radius μ m
R v Specific gas constant of water vapor J / k g K
S S Supersaturation-
S S m a x Maximum supersaturation-
TTemperatureK
T o Reference temperatureK
wUpdraft velocity m / s
zHeight above ground levelm
Z e Radar reflectivity d B
α e x t Extinction coefficient m 1
β Backscatter coefficient 1 / M m s r
β a t t Attenuated backscatter coefficient 1 / M m s r
γ aerosol proxy
Δ ACIVariability between the ACI index with and without fluctuations%
Δ r m , d r y Fluctuation of the dry aerosol-particle modal radius%
Δ r m , w e t Fluctuation of the wet aerosol-particle modal radius%
Δ w Fluctuation of the updraft velocity%
κ Hygroscopicity parameter-
λ r Radar wavelength m m
σ Standard deviation-
σ b Droplet effective cross-section m 2

Appendix A. Additional LARSS Simulations

Appendix A.1. Simulation of the Twomey Effect by LARSS
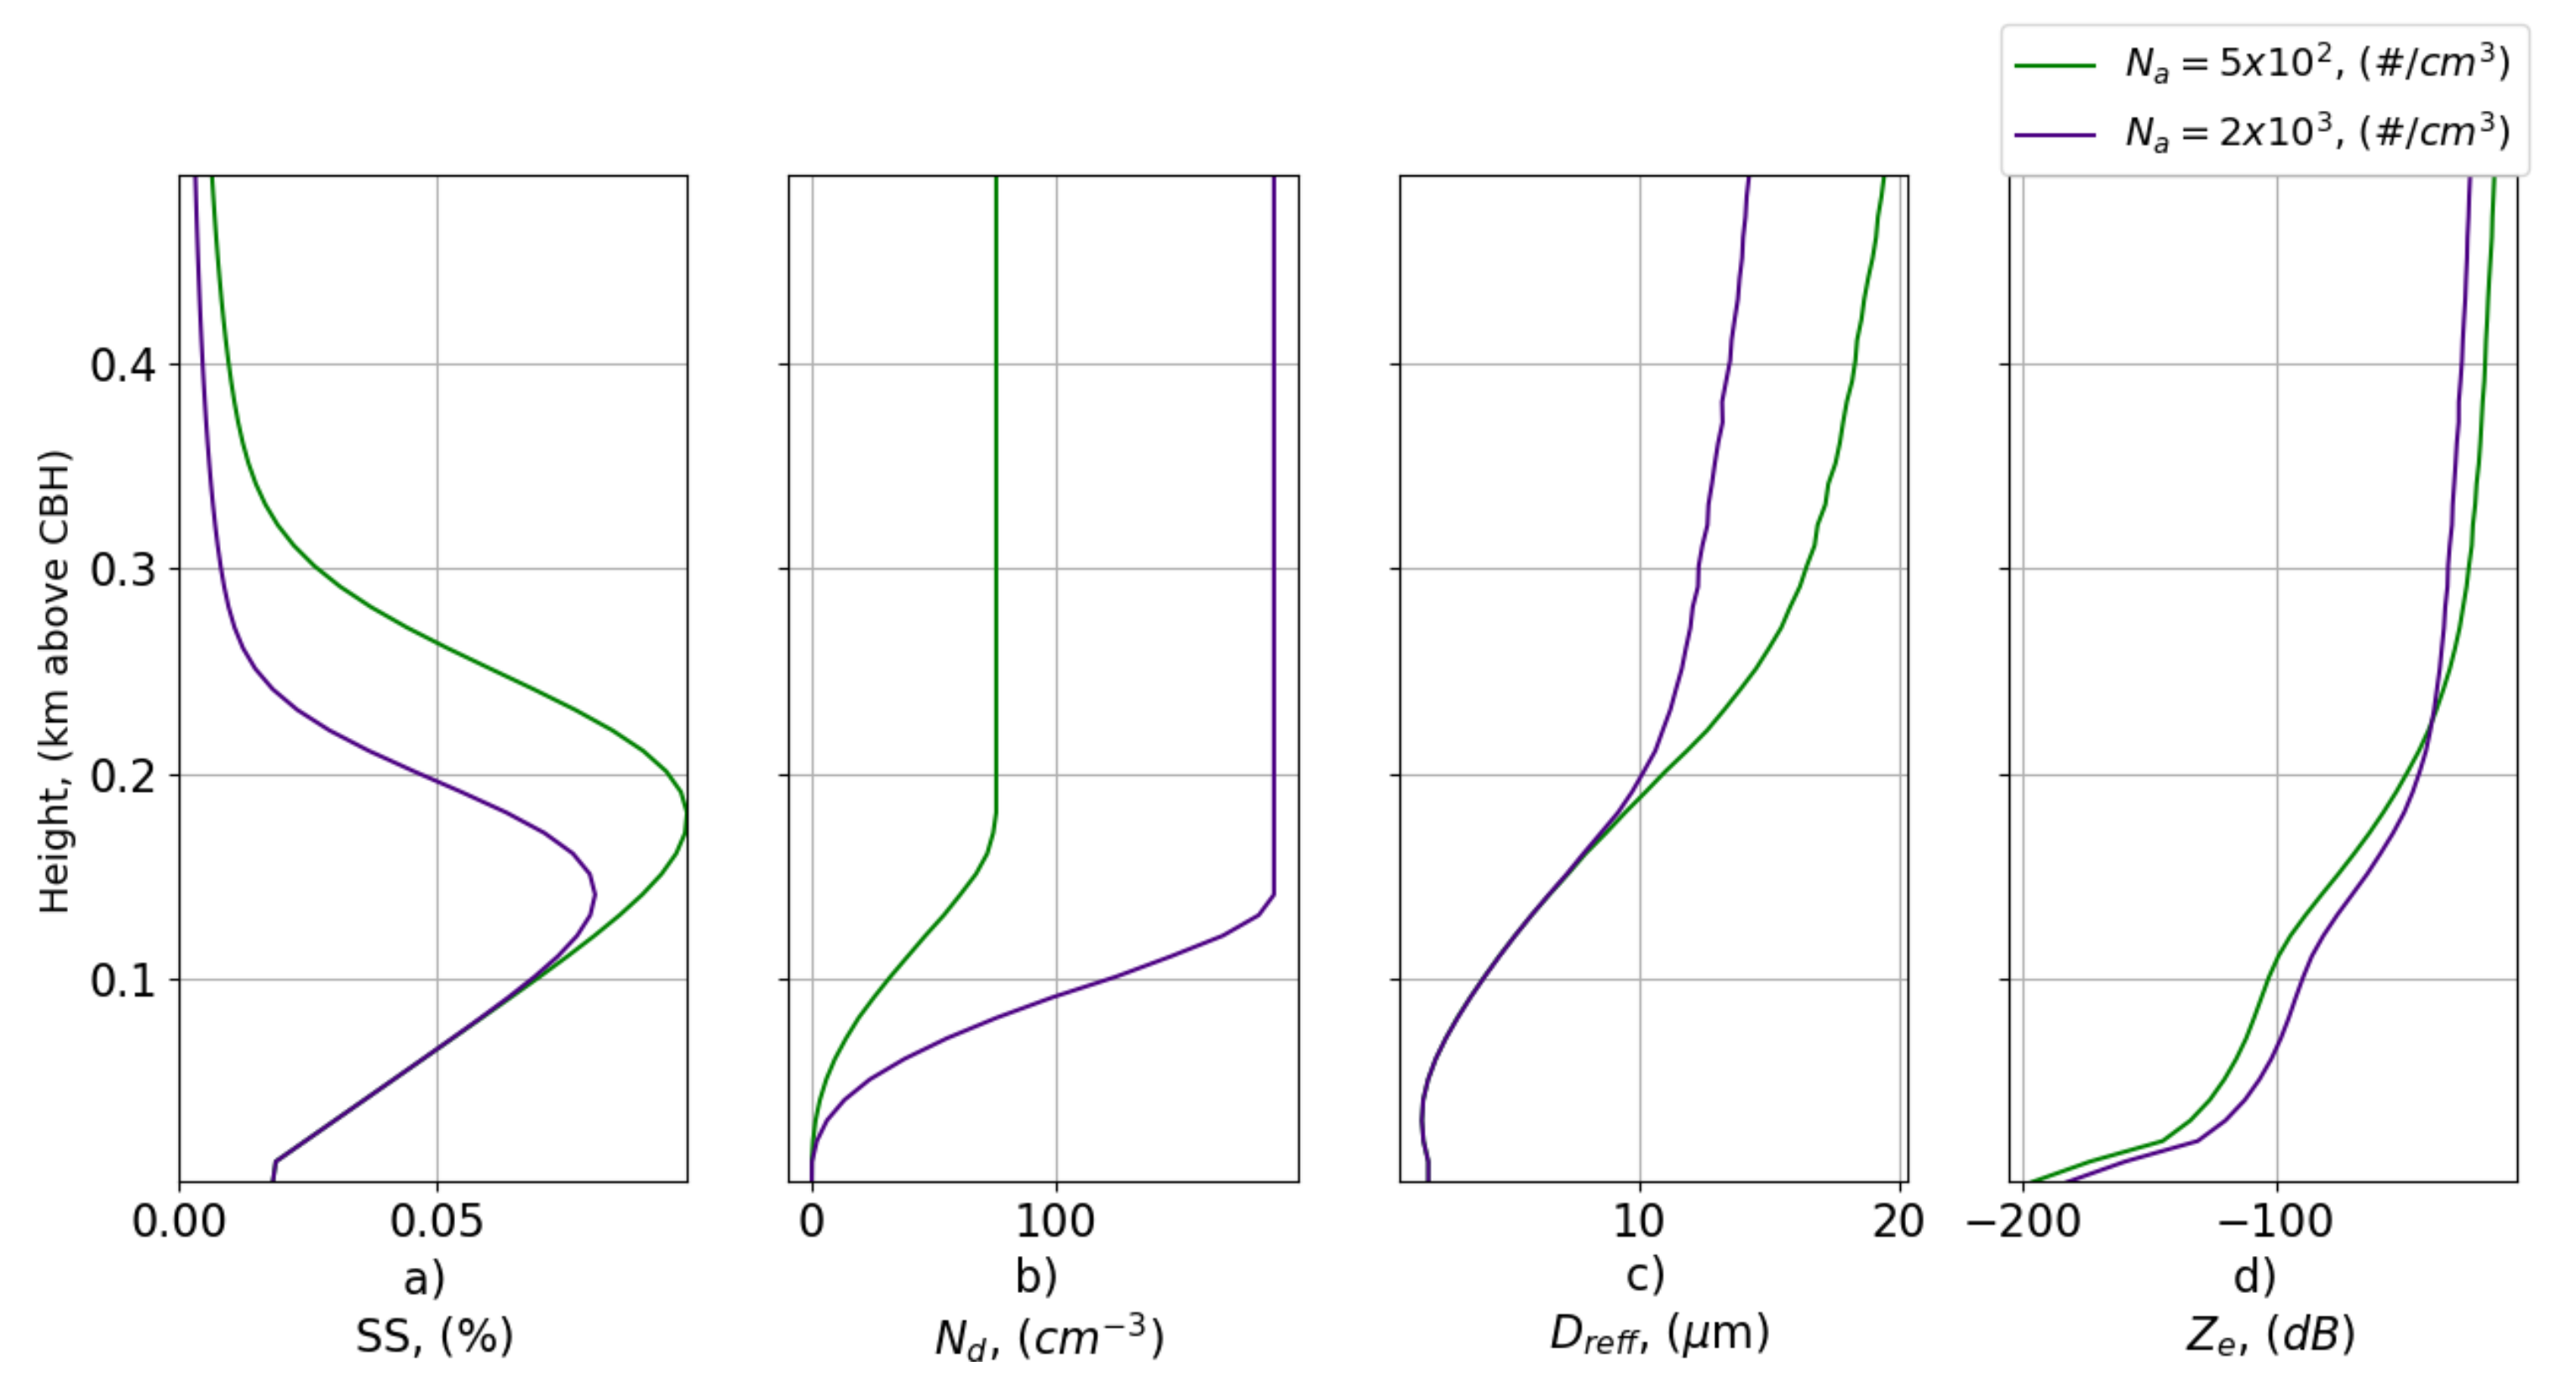
Twomey effect describes that an N a increase results in a cloud albedo increase due to larger N d and lower D r e f f [11]. Feingold et al. [56] evidence this effect for liquid-water clouds, single-layered, non-precipitating, and free of airborne insects using ground-based remote sensors. This cloud type has been simulated by LARSS for N a = 500 # / c m 3 and N a = 2000 # / c m 3 , keeping the rest of input parameters constants. S S , N d , D r e f f and Z e profiles of theses two cases are shown in Figure A1. As it can be seen, the increase of N a causes a considerable increase of N d from 76 to 189 # / c m 3 at CBH + 160 m (Figure A1b). The increase of N d causes the decrease of available water-vapour molecules which explain the decrease of the S S m a x from 0.1 at CBH + 180 m to 0.08 at CBH + 140 m (Figure A1a). The effect of N a in D r e f f is negligible below CBH + 200 m (Figure A1c) and thus, Z e at N a = 500 # / c m 3 (green) is lower than at N a = 2000 # / c m 3 (purple), following the N d evolution. However, above CBH+250 m, the increase of D r e f f at N a = 500 # / c m 3 (green) is large enough to overcomes Z e at N a = 2000 # / c m 3 (purple). This Z e dependence with the N d and the D r e f f can also be appreciated in Raghavan [57]. It is worthy to note that the N d (green curve) agrees with the N d obtained by Mei et al. [58] for ammonium sulfate at S S = 0.12 % .
Figure A1. Twomey effect of a cloud formed from the activation of ammonium sulfate particles. Supersaturation (SS) (a), droplet number concentration ( N d ) (b), droplet effective radius ( D r e f f ) (c), and radar reflectivity ( Z e ) (d) profiles inside the cloud.
Remotesensing 14 01333 g0a1

Appendix A.2. Variations in ACI Related to the Presence of a Second (Coarse) Mode in the PSD
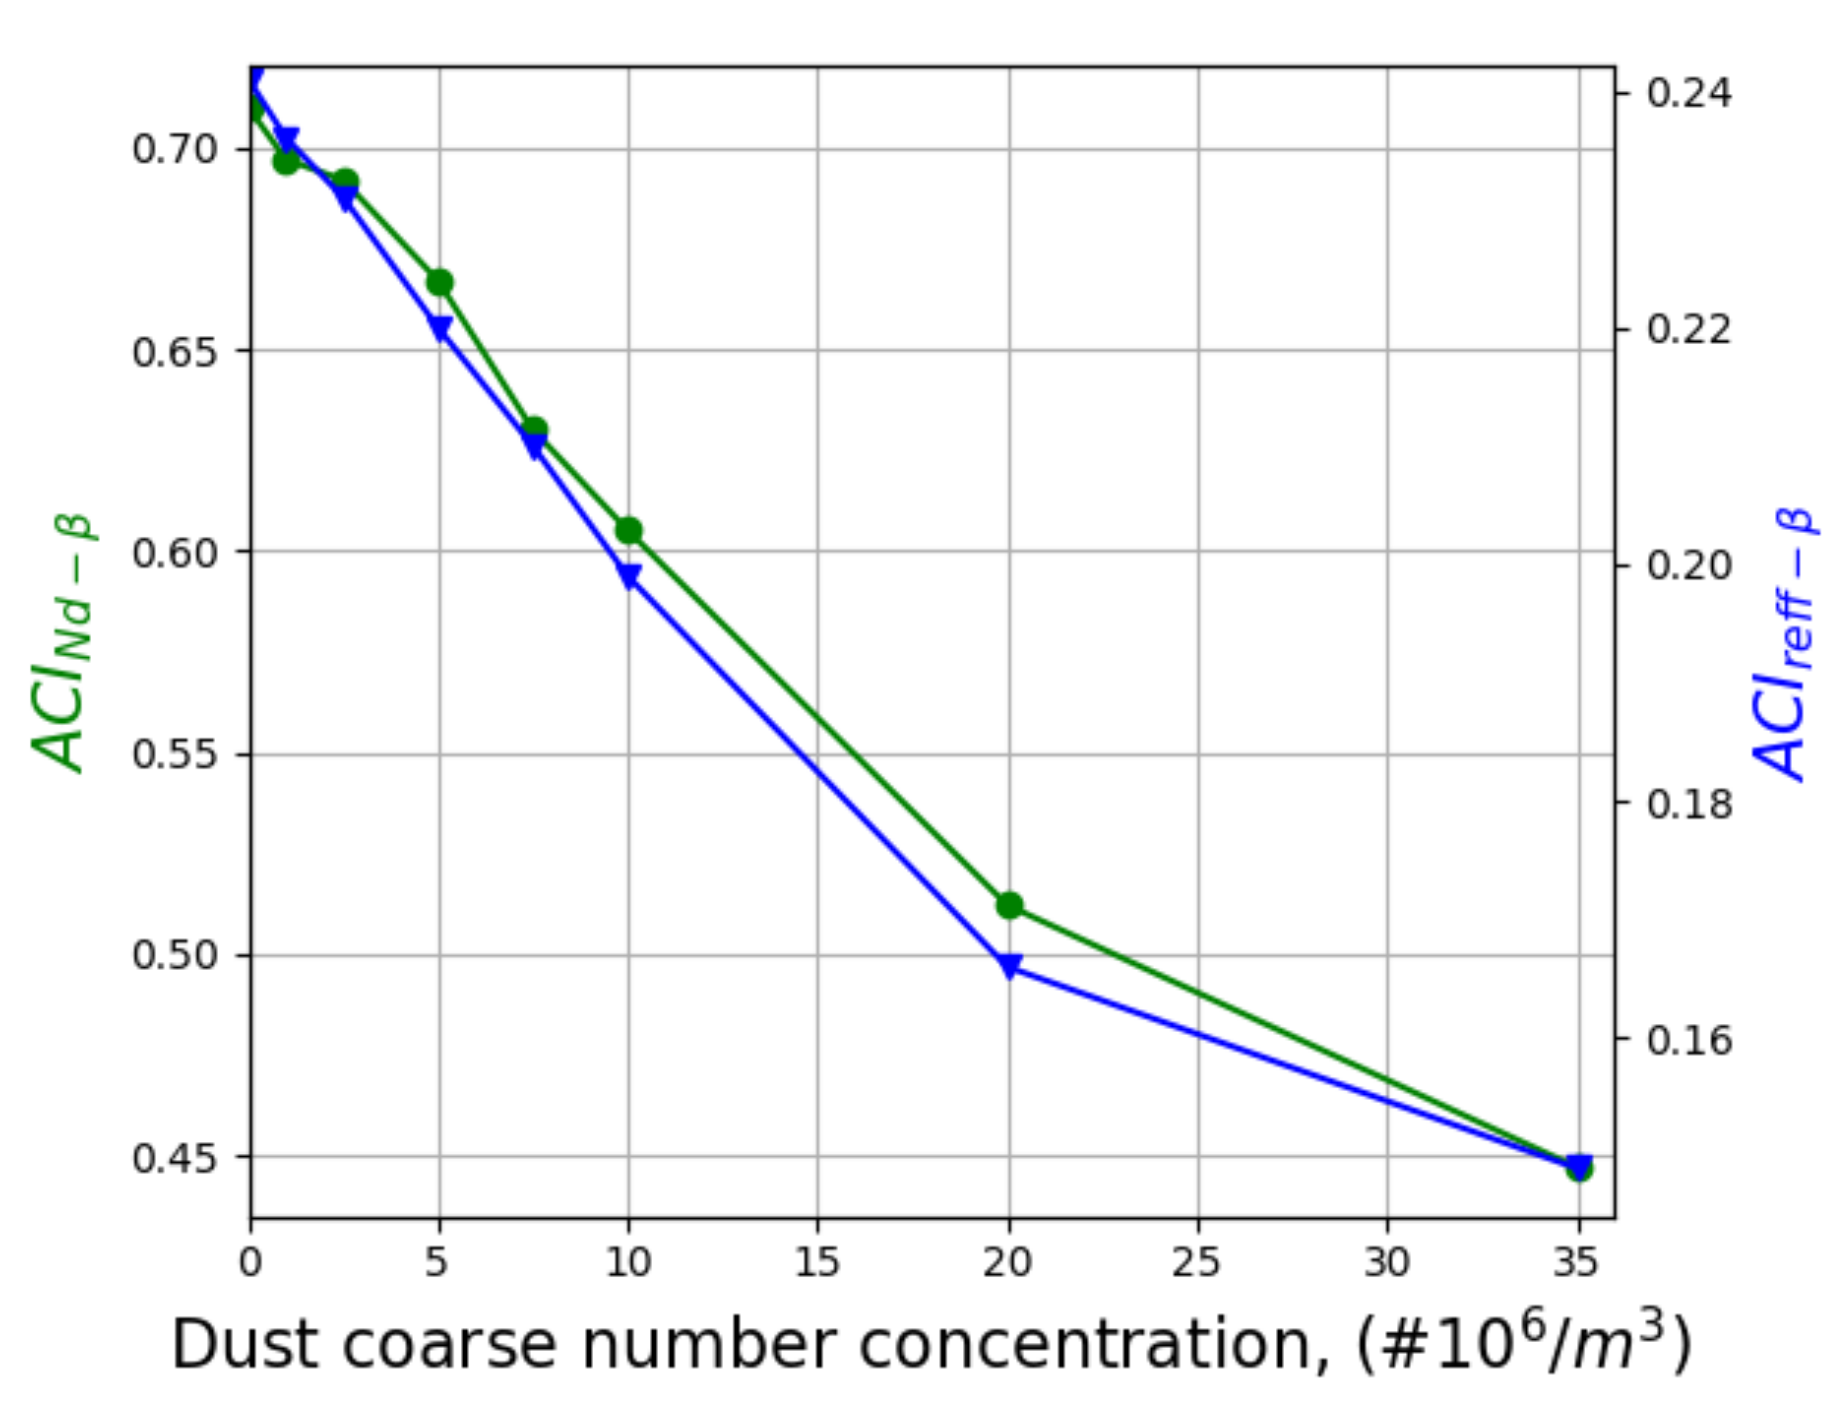
In Section 3.2, the ACI index was retrieved for a monomodal distribution of ammonium sulphate (type A a ). However, PSD ussualy are bimodal, e.g., D a D c . Figure A2 shows the influence on A C I N d β of the coarse-mode size, varying the coarse-mode concentration N a between 0 and 35 × 10 6 m 3 with a constant accumulation-mode concentration N a at 7 × 10 8 m 3 .
Figure A2. Accumulation mode dust A C I indexes variations due to the presence of a coarse mode.
Remotesensing 14 01333 g0a2
The increases of the coarse-mode predominance causes an almost linear decrease of the A C I N d β (greater slope from 0 to 20 · 10 6 m 3 ) from the value of pure D a of 0.718 to the mixture D a D c value of 0.447.

Appendix A.3. Range-Dependence of Cloud Microphysics
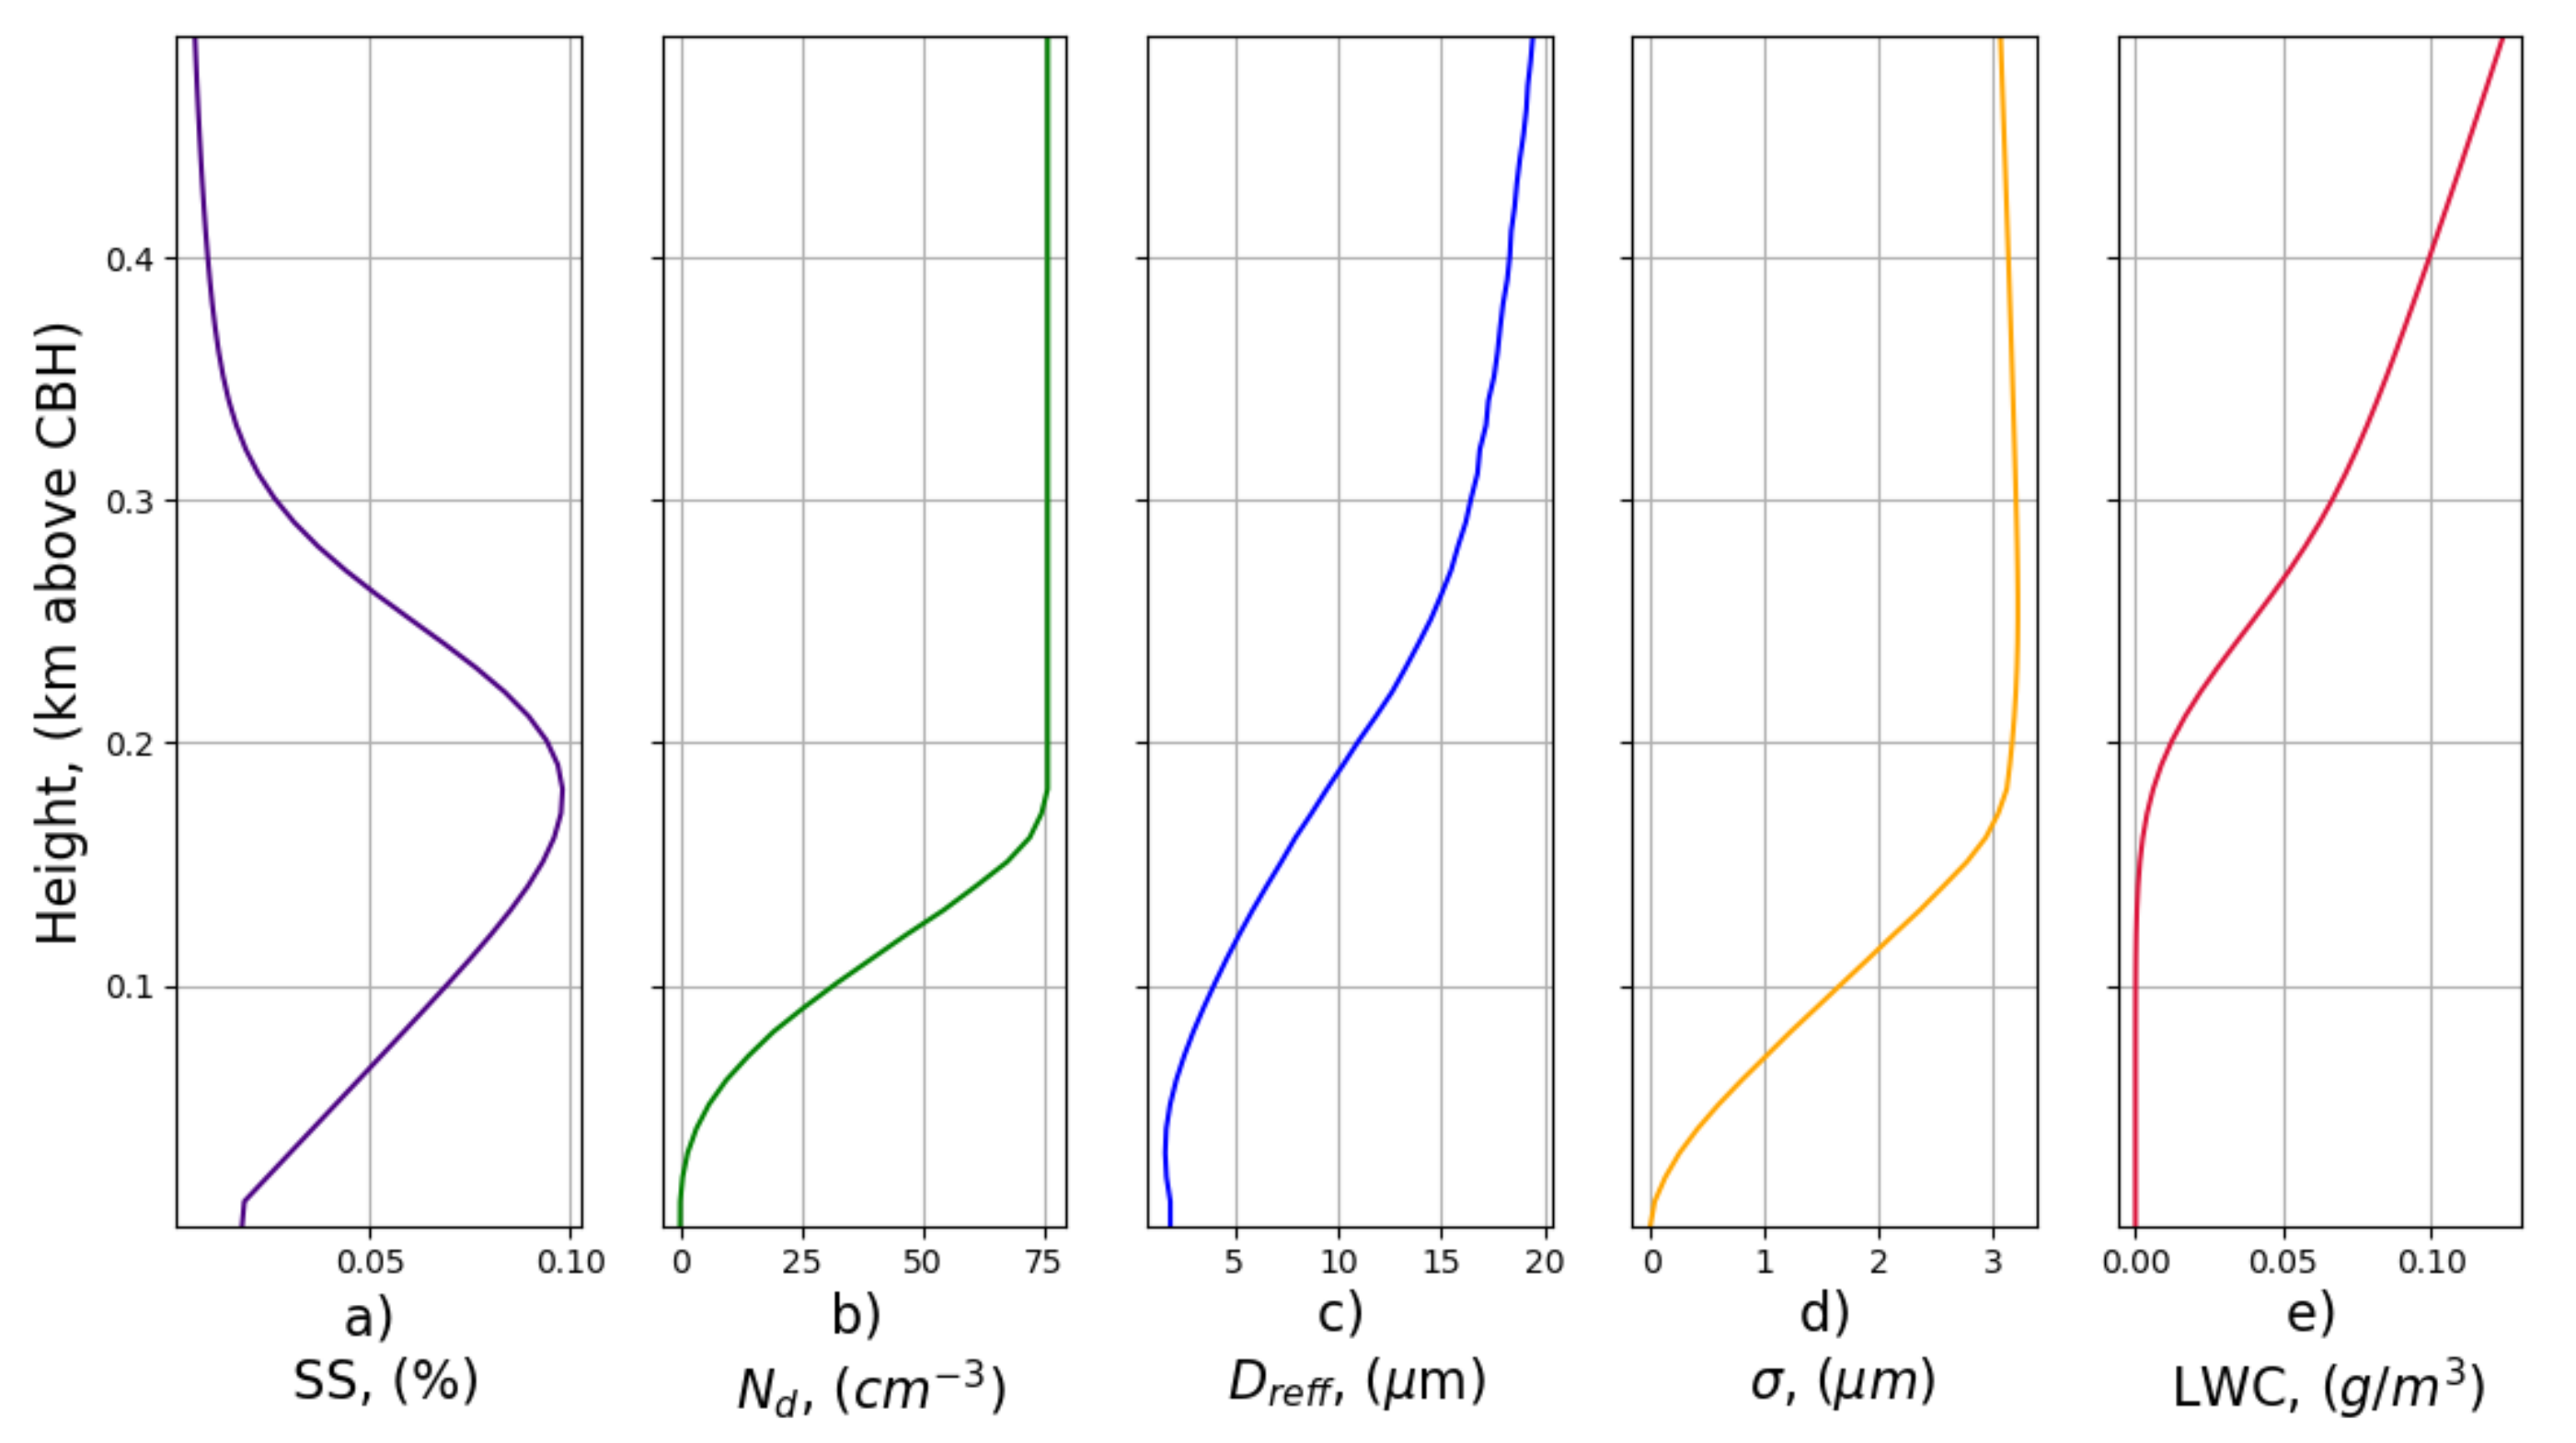
LARSS considers two processes within the cloud: droplet activation and condensation growth. Figure A3 shows the evolution with height of the most relevant cloud properties obtained with LARSS (such as S S , N d , D r e f f , σ , and L W P ) for the aerosol type A a . This figure can be successfully compared with Figure 7.4 of Yau and Rogers [43] for sodium chloride.
Figure A3. Early development of cloud properties: (a) supersaturation (SS), (b) droplet number concentration ( N d ), (c) droplet effective radius ( D r e f f ), (d) standard deviation ( σ ), (e) liquid water content (LWC) in air ascending at constant velocity of 2 m / s .
Remotesensing 14 01333 g0a3

Appendix B. Additional Figures

Appendix B.1. ACIRs Sensitivity to rm,dry, rm,wet and w
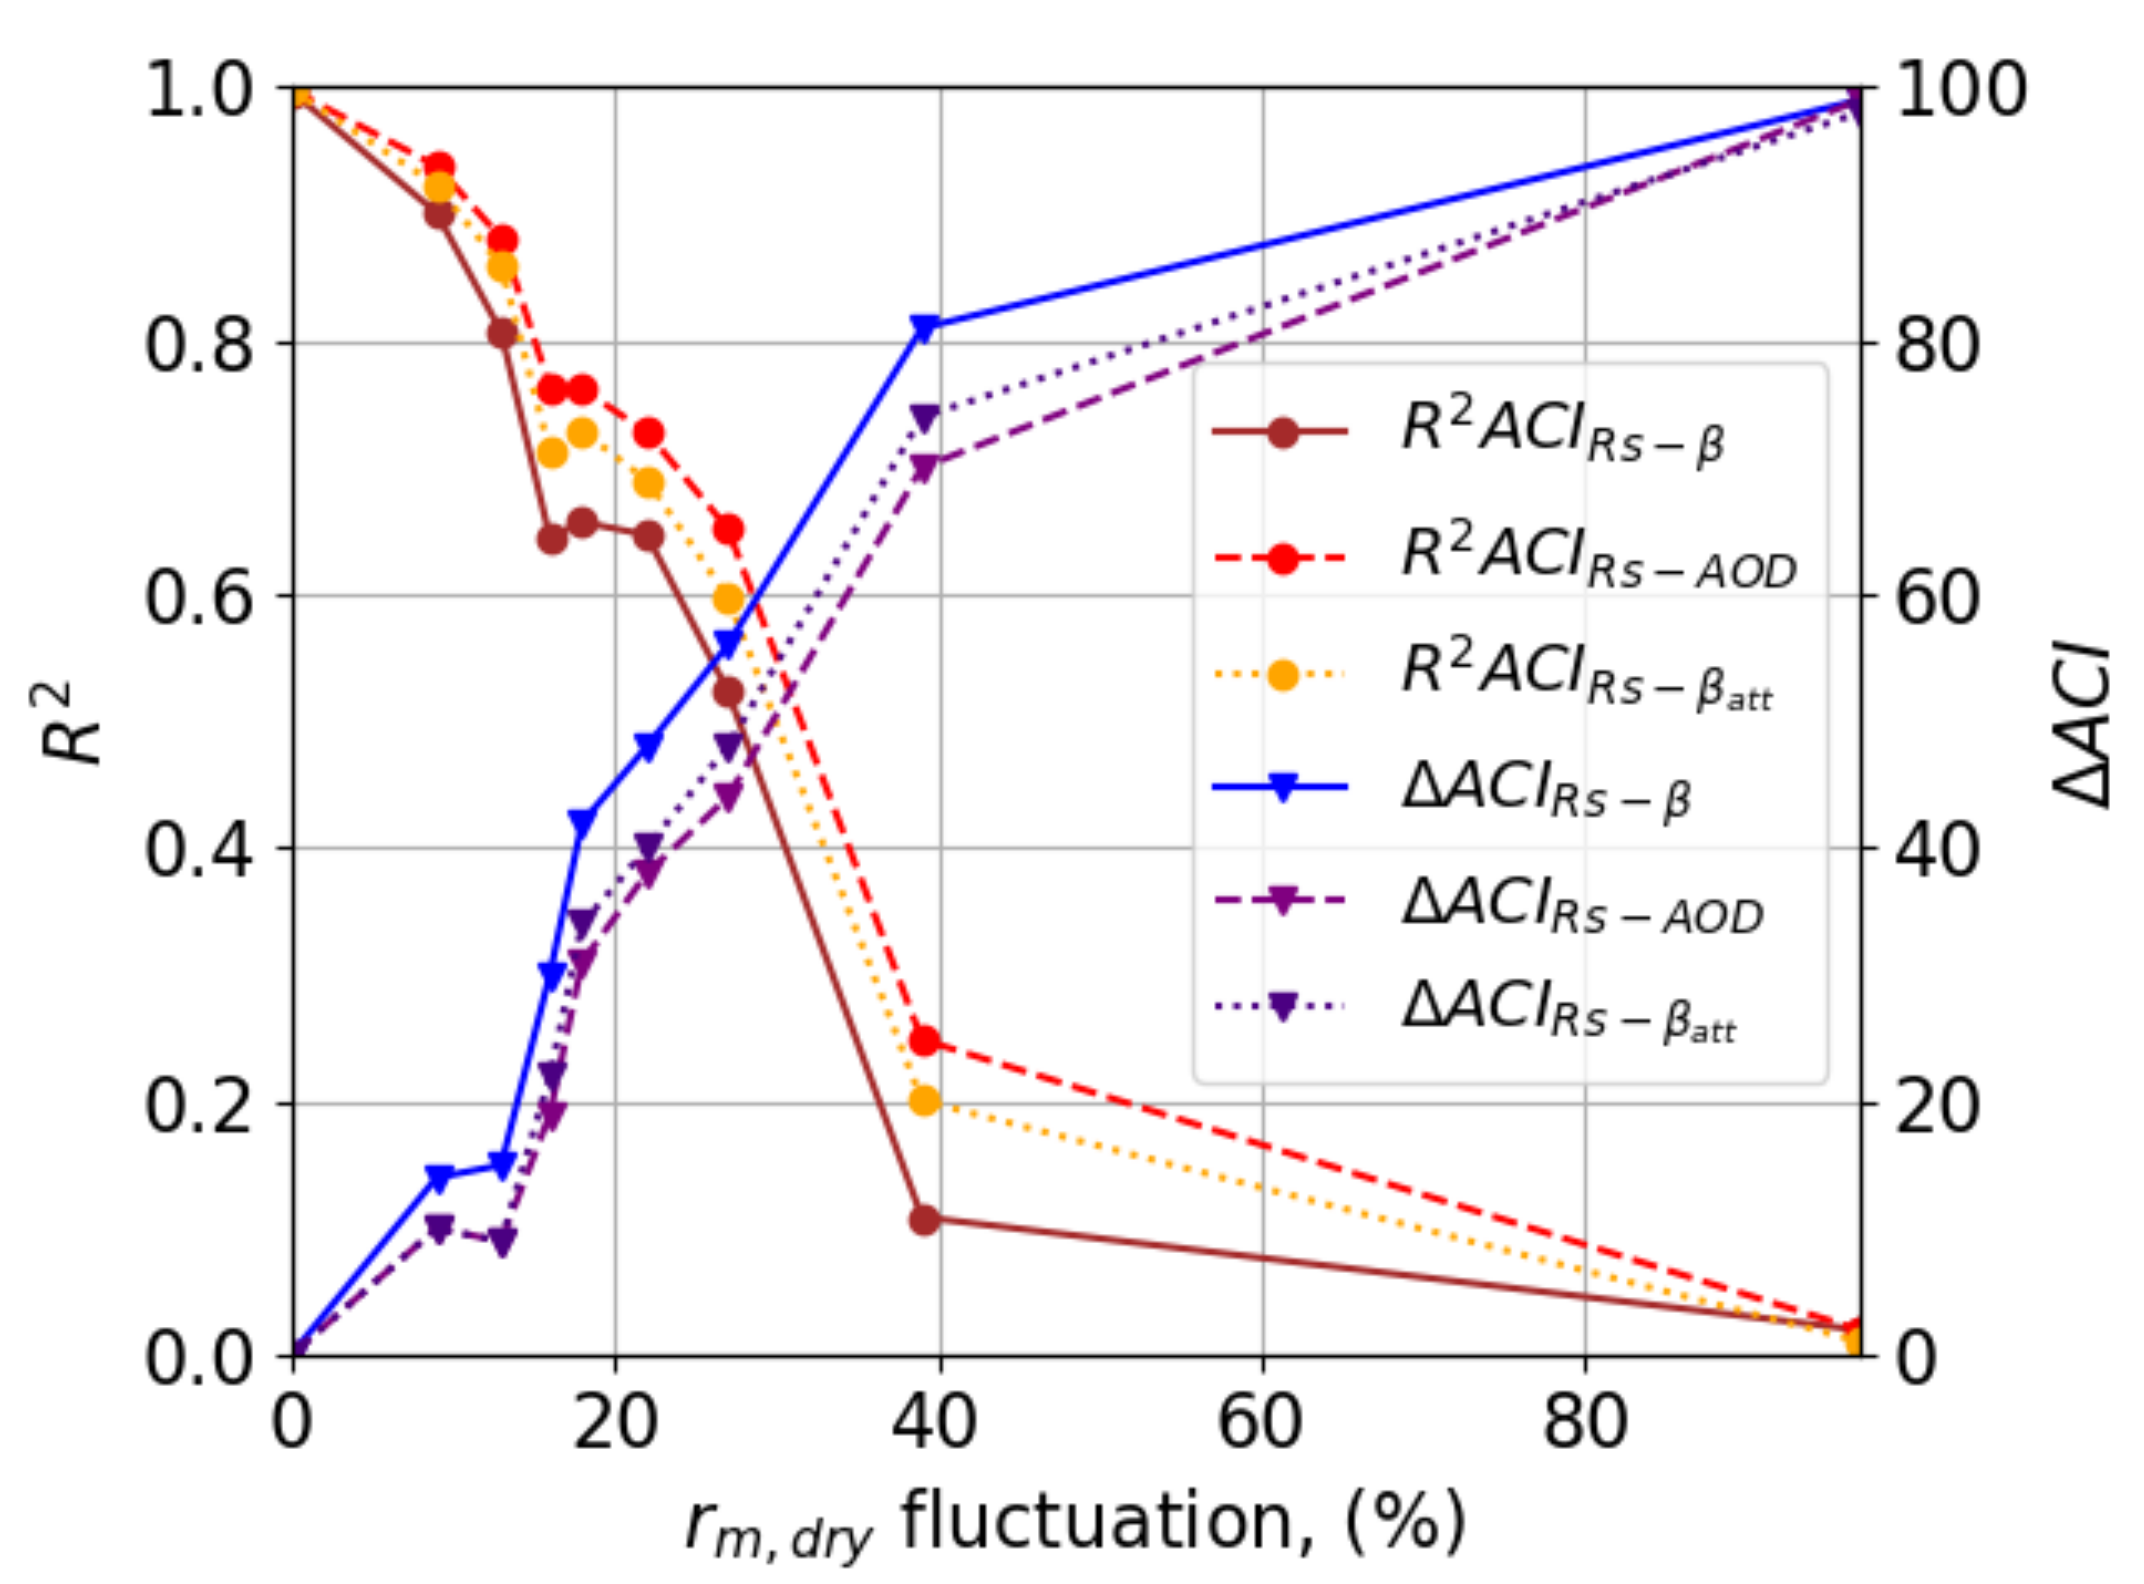
Figure A4. R 2 (left axis) and Δ A C I (right axis) with Respect to the r m , d r y Uncertainty.
Remotesensing 14 01333 g0a4
Figure A5. R 2 (left axis) and Δ A C I (right axis) with respect to the r m , w e t uncertainty. R 2 N d A O D and Δ A C I r e f f A O D (not shown) are identical to R 2 N d β and Δ A C I r e f f β because the uncertainty of r m , w e t in the vecinity of the CBH does not affect the dry aerosol properties.
Remotesensing 14 01333 g0a5
Figure A6. R 2 (left axis) and Δ A C I (right axis) with respect to the w uncertainty. R 2 N d A O D and Δ A C I r e f f A O D (not shown) are identical to R 2 N d β and Δ A C I r e f f β because the uncertainty of w only affect within the cloud.
Remotesensing 14 01333 g0a6

Appendix B.2. ACINd and ACIreff for All the Cases Used in LARSS

Figure A7. A C I N d , A C I r e f f for different aerosol types according to the legend.
Remotesensing 14 01333 g0a7

Appendix B.3. ACIRs for All the Cases Used in LARSS
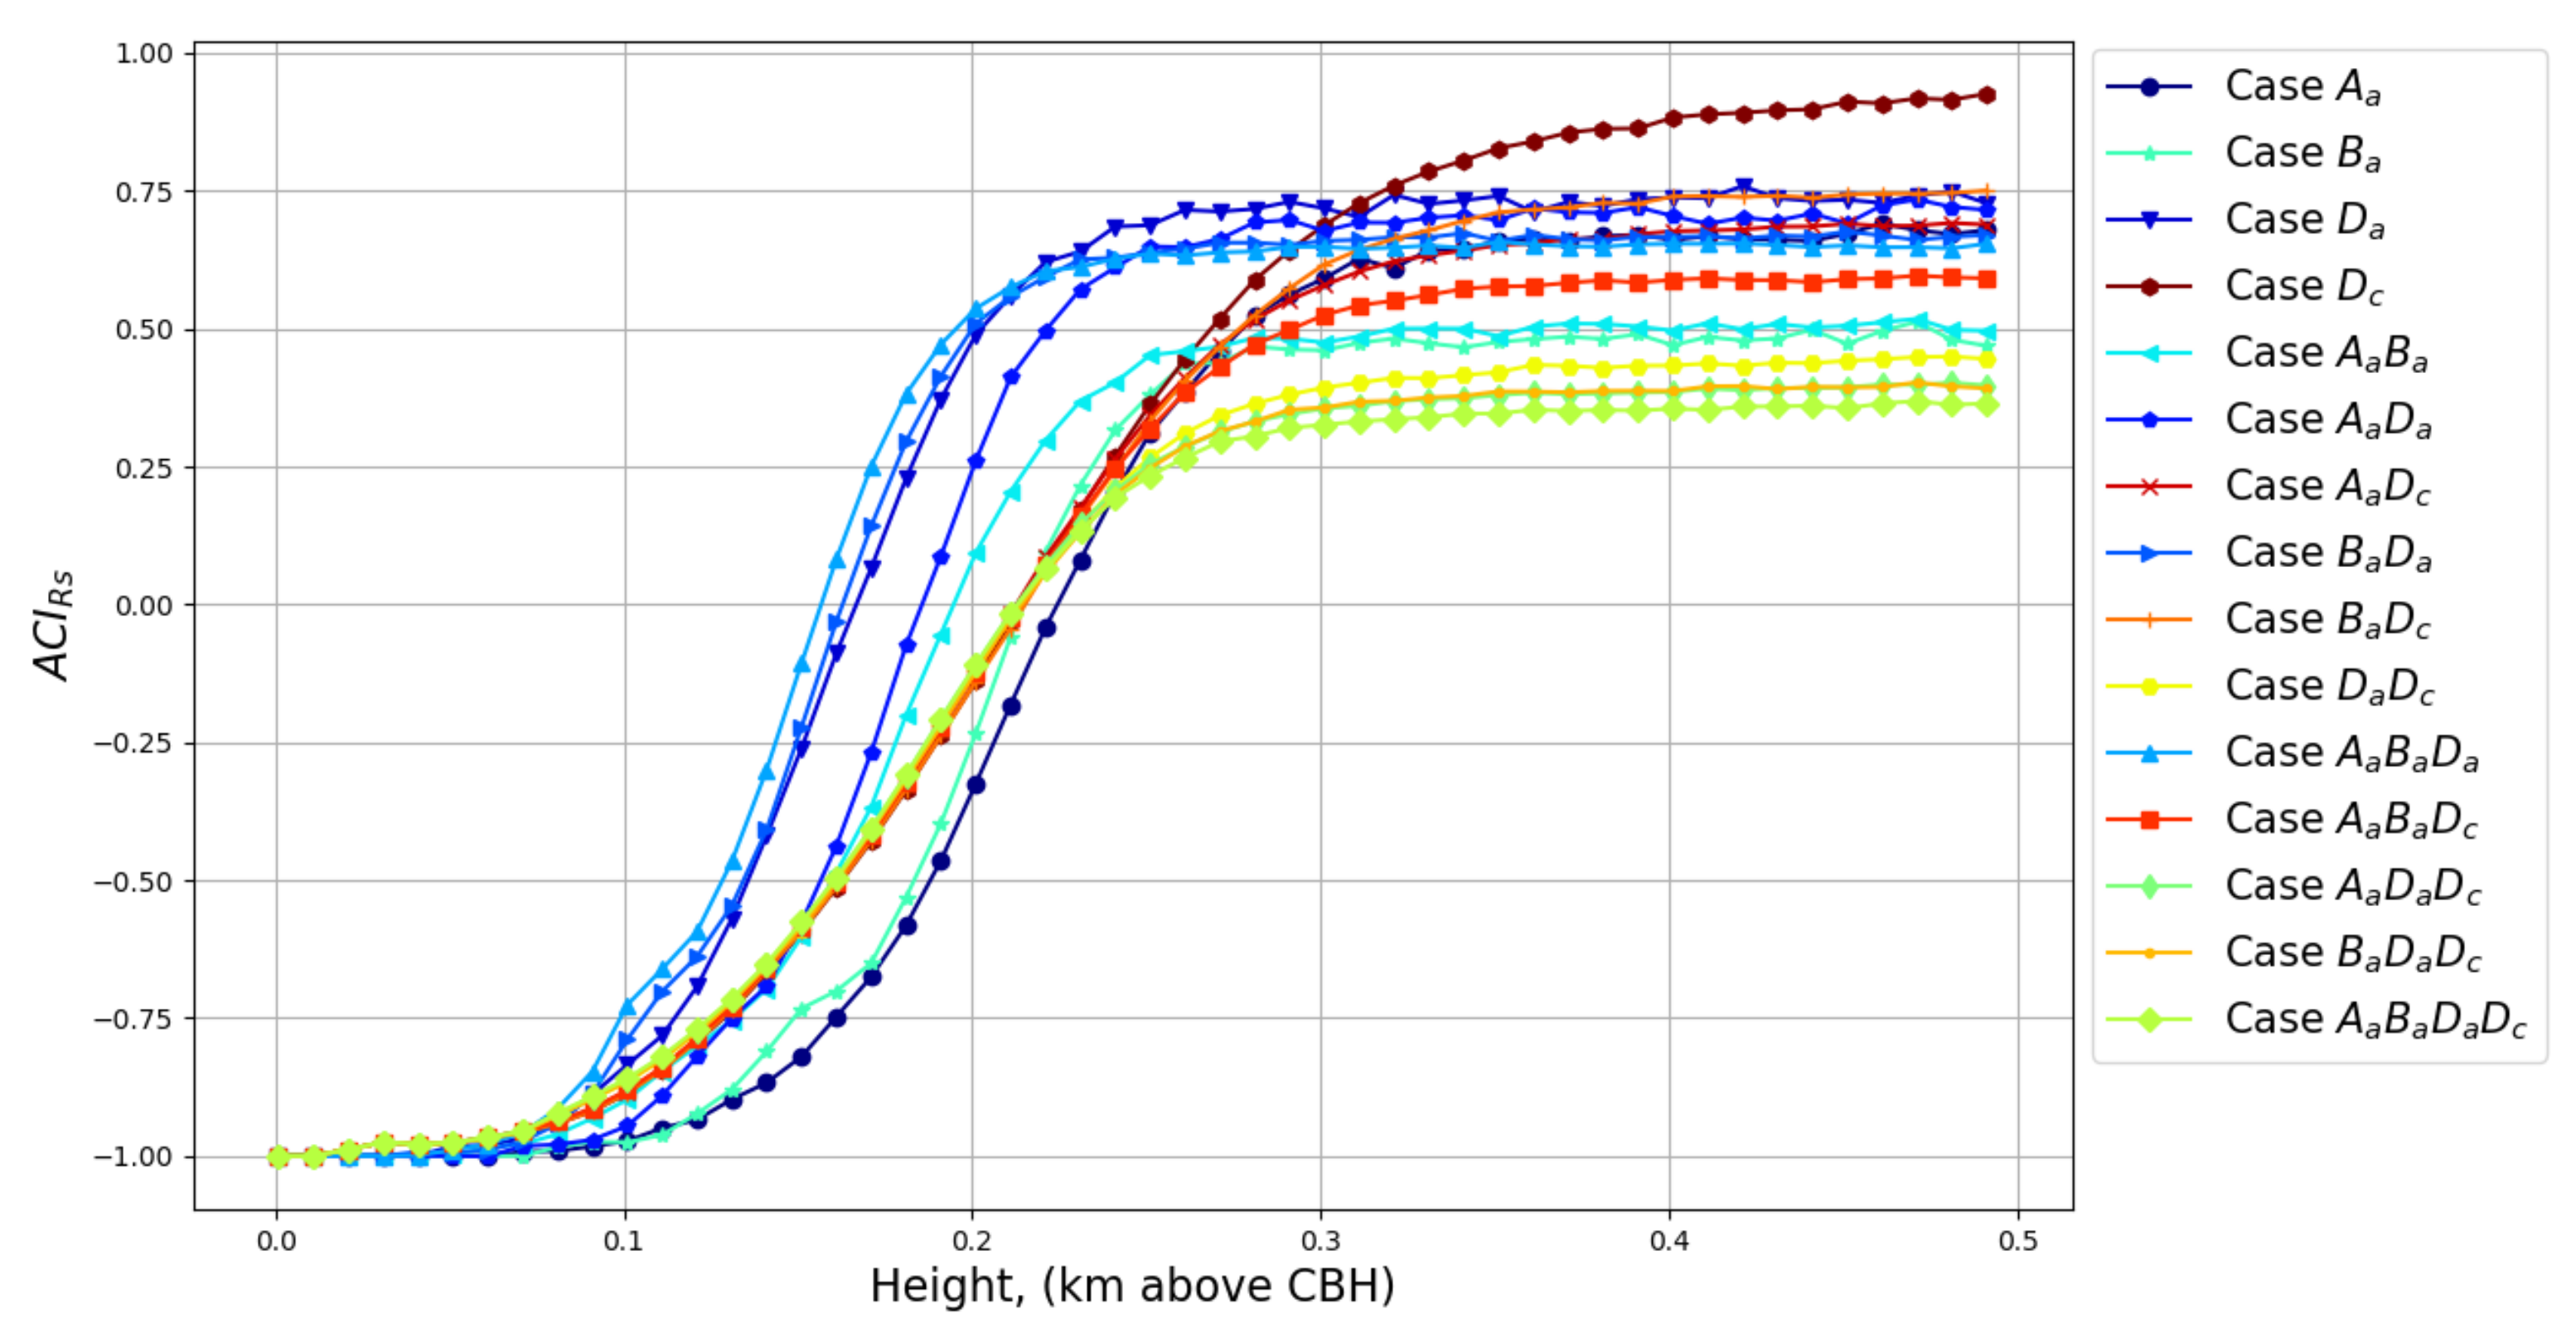
Figure A8. A C I R s for different cases according to the legend.
Remotesensing 14 01333 g0a8

Appendix B.4. ACIRs to ACIreff Relation for All the Cases Used in LARSS
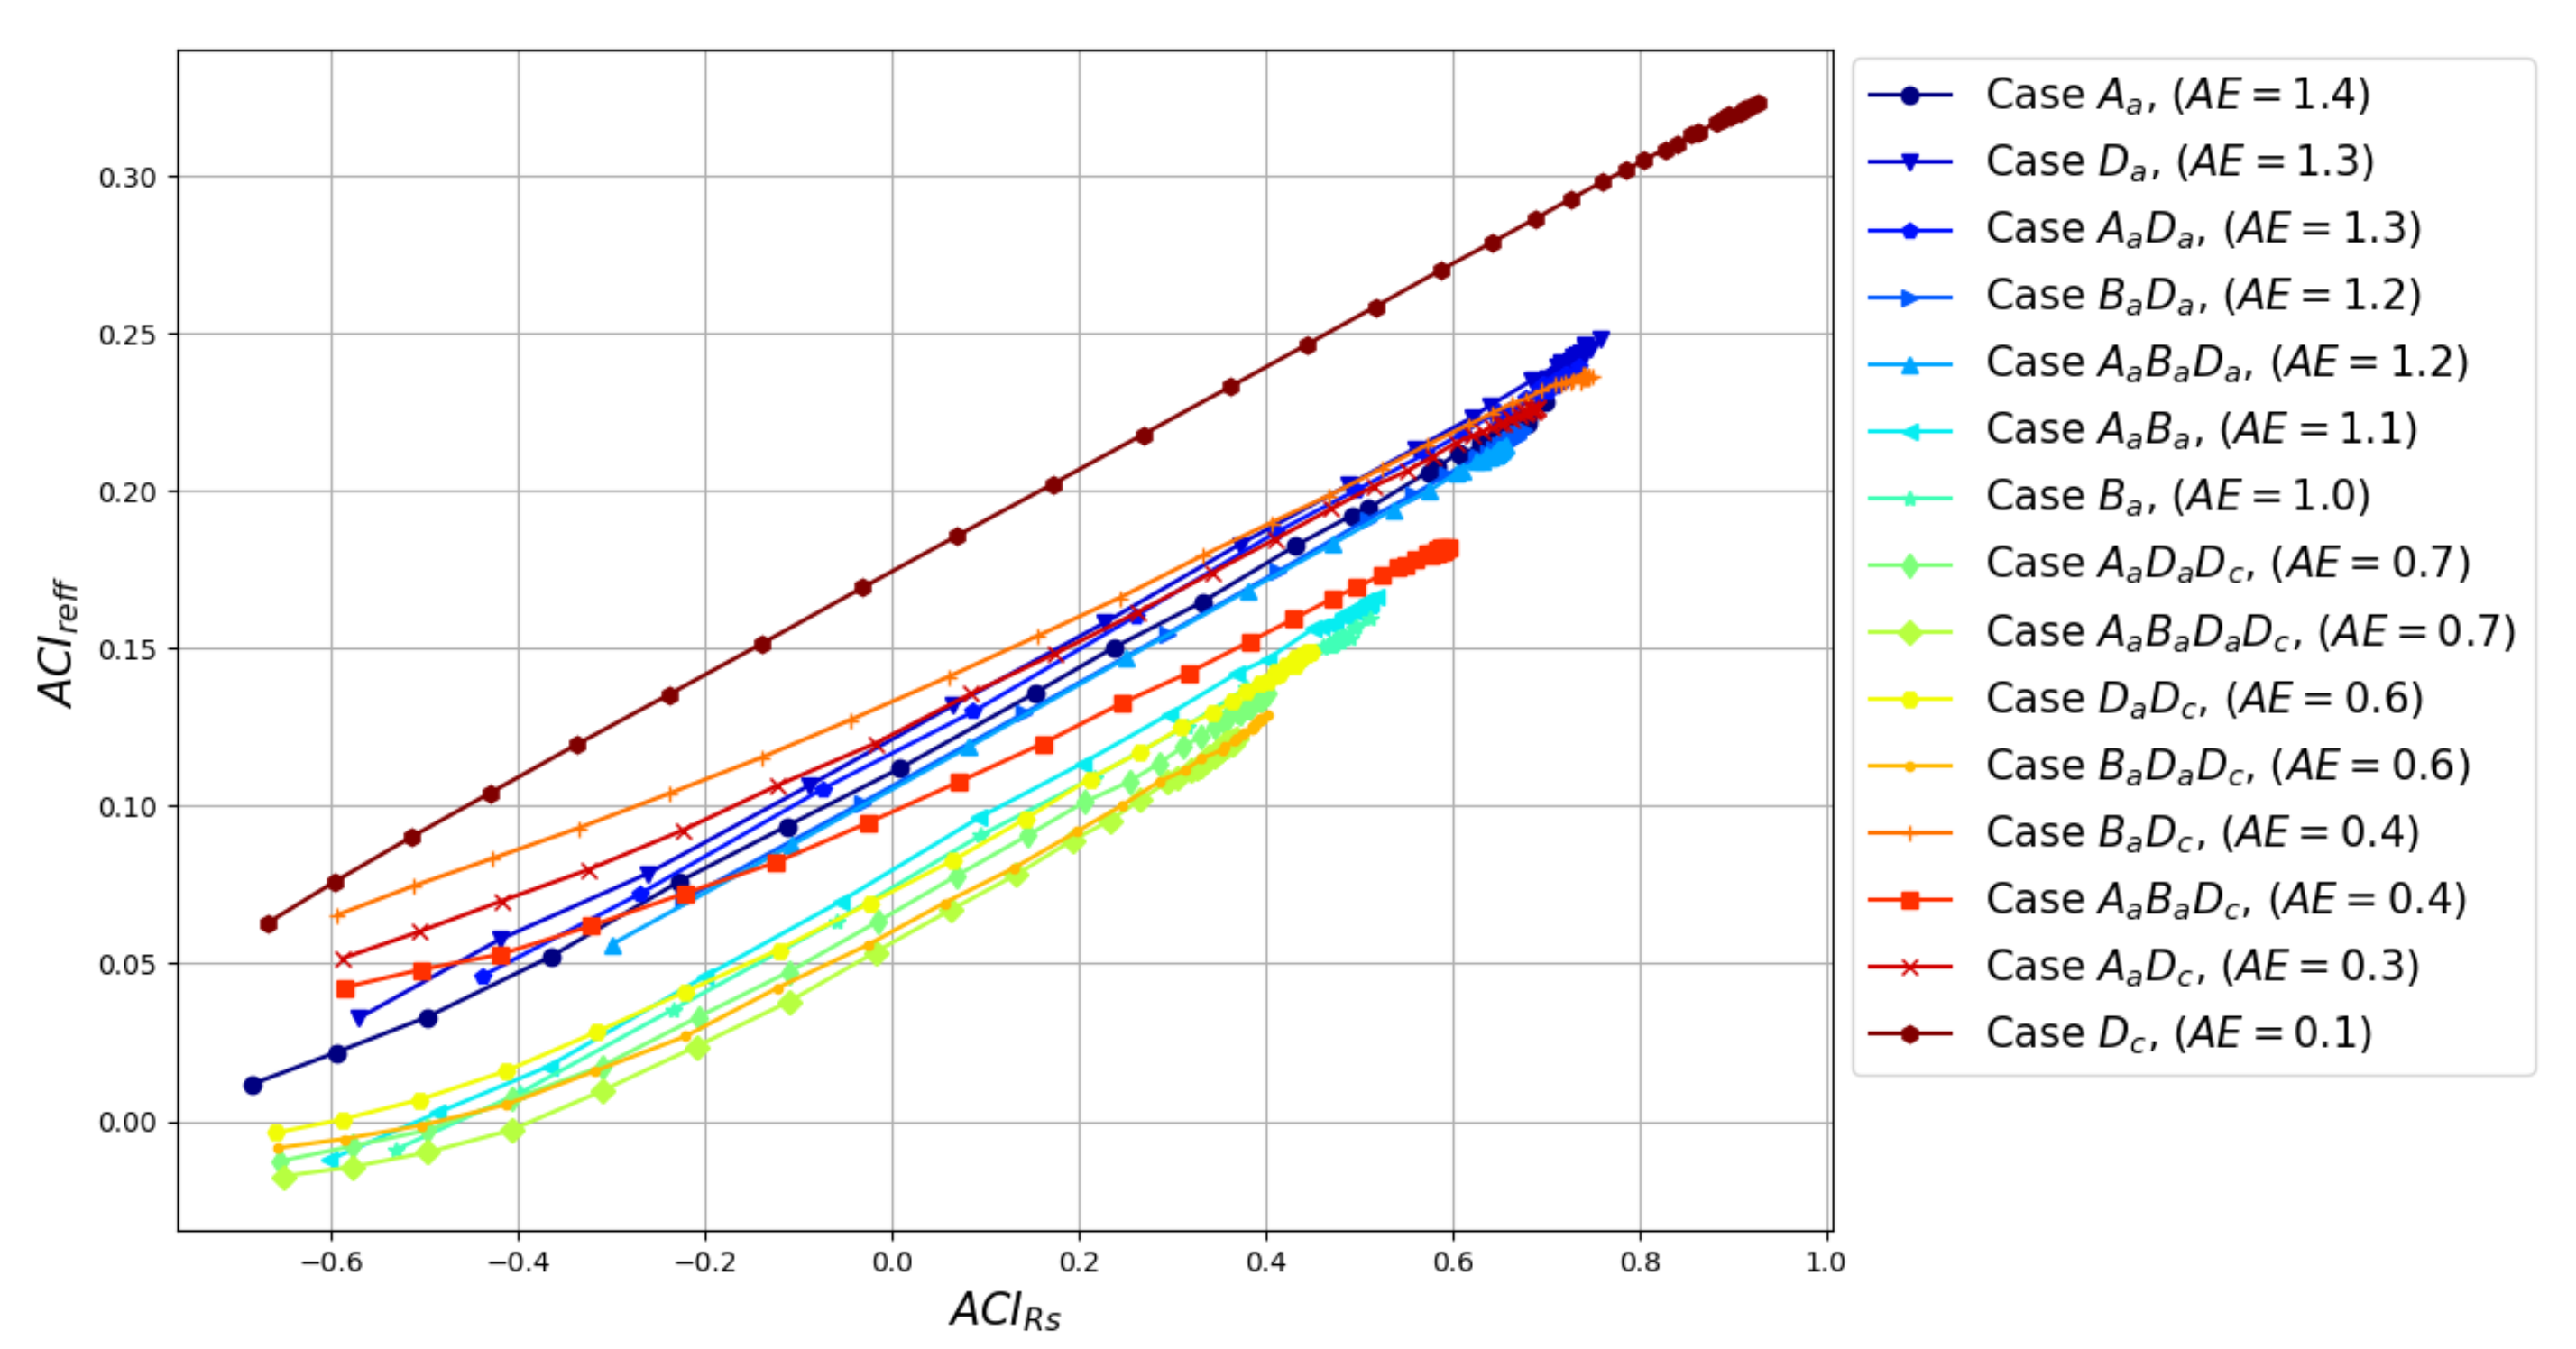
Figure A9. Relation between the A C I r e f f with the A C I R s for different cases according to the legend.
Remotesensing 14 01333 g0a9

References

  1. Solomon, S.; Qin, D.; Manning, M.; Alley, R.B.; Berntsen, T.; Bindoff, N.L.; Chen, Z.; Chidthaisong, A.; Gregory, J.M.; Hegerl, G.C.; et al. Technical Summary; Cambridge University Press: Cambridge, UK, 2007; Volume 151. [Google Scholar]
  2. Ciscar, J.C.; Soria, A.; Goodess, C.M.; Christensen, O.B.; Iglesias, A.; Garrote, L.; Moneo, M.; Quiroga, S.; Feyen, L.; Dankers, R.; et al. Climate Change Impacts in Europe. Final Report of the PESETA Research Project; Technical Report; Joint Research Centre (Seville Site): Seville, Spain, 2009. [Google Scholar]
  3. López-Romero, J.M.; Montávez, J.P.; Jerez, S.; Lorente-Plazas, R.; Palacios-Peña, L.; Jiménez-Guerrero, P. Precipitation response to aerosol–radiation and aerosol–cloud interactions in regional climate simulations over Europe. Atmos. Chem. Phys. 2021, 21, 415–430. [Google Scholar] [CrossRef]
  4. Li, Z.; Rosenfeld, D.; Fan, J. Aerosols and their impact on radiation, clouds, precipitation, and severe weather events. In Oxford Research Encyclopedia of Environmental Science; USDOE: Richland, WA, USA, 2017. [Google Scholar]
  5. Li, Z. Influence of absorbing aerosols on the inference of solar surface radiation budget and cloud absorption. J. Clim. 1998, 11, 5–17. [Google Scholar] [CrossRef] [Green Version]
  6. Feingold, G.; Jiang, H.; Harrington, J.Y. On smoke suppression of clouds in Amazonia. Geophys. Res. Lett. 2005, 32. [Google Scholar] [CrossRef] [Green Version]
  7. Liu, L.; Cheng, Y.; Wang, S.; Wei, C.; Pöhlker, M.; Pöhlker, C.; Artaxo, P.; Shrivastava, M.; Andreae, M.O.; Pöschl, U.; et al. Impact of biomass burning aerosols on radiation, clouds, and precipitation over the Amazon during the dry season: Dependence of aerosol–cloud and aerosol-radiation interactions on aerosol loading. Atmos. Chem. Phys 2020, 20, 13283–13301. [Google Scholar] [CrossRef]
  8. Albrecht, B.A. Aerosols, cloud microphysics, and fractional cloudiness. Science 1989, 245, 1227–1230. [Google Scholar] [CrossRef]
  9. Rosenfeld, D.; Lohmann, U.; Raga, G.B.; O’Dowd, C.D.; Kulmala, M.; Fuzzi, S.; Reissell, A.; Andreae, M.O. Flood or drought: How do aerosols affect precipitation? Science 2008, 321, 1309–1313. [Google Scholar] [CrossRef] [Green Version]
  10. Stocker, T.F.; Qin, D.; Plattner, G.K.; Tignor, M.M.; Allen, S.K.; Boschung, J.; Nauels, A.; Xia, Y.; Bex, V.; Midgley, P.M. Climate Change 2013: The Physical Science Basis. Contribution of Working Group I to the Fifth Assessment Report of IPCC the Intergovernmental Panel on Climate Change; Cambridge University Press: Cambridge, UK; New York, NY, USA, 2014; 1535p. [Google Scholar]
  11. Twomey, S. The influence of pollution on the shortwave albedo of clouds. J. Atmos. Sci. 1977, 34, 1149–1152. [Google Scholar] [CrossRef] [Green Version]
  12. Feingold, G.; Remer, L.; Ramaprasad, J.; Kaufman, Y. Analysis of smoke impact on clouds in Brazilian biomass burning regions: An extension of Twomey’s approach. J. Geophys. Res. Atmos. 2001, 106, 22907–22922. [Google Scholar] [CrossRef]
  13. Lihavainen, H.; Kerminen, V.M.; Remer, L. Aerosol–cloud interaction determined by both in situ and satellite data over a northern high-latitude site. Atmos. Chem. Phys. 2010, 10, 10987–10995. [Google Scholar] [CrossRef] [Green Version]
  14. Jia, H.; Ma, X.; Liu, Y. Exploring aerosol–cloud interaction using VOCALS-REx aircraft measurements. Atmos. Chem. Phys. 2019, 19, 7955–7971. [Google Scholar] [CrossRef] [Green Version]
  15. Padmakumari, B.; Maheskumar, R.; Harikishan, G.; Morwal, S.; Prabha, T.; Kulkarni, J. In situ measurements of aerosol vertical and spatial distributions over continental India during the major drought year 2009. Atmos. Environ. 2013, 80, 107–121. [Google Scholar] [CrossRef]
  16. Zhao, C.; Qiu, Y.; Dong, X.; Wang, Z.; Peng, Y.; Li, B.; Wu, Z.; Wang, Y. Negative aerosol–cloud re relationship from aircraft observations over Hebei, China. Earth Space Sci. 2018, 5, 19–29. [Google Scholar] [CrossRef] [Green Version]
  17. Kant, S.; Panda, J.; Rao, P.; Sarangi, C.; Ghude, S.D. Study of aerosol–cloud-precipitation-meteorology interaction during a distinct weather event over the Indian region using WRF-Chem. Atmos. Res. 2021, 247, 105144. [Google Scholar] [CrossRef]
  18. Radenz, M.; Bühl, J.; Seifert, P.; Baars, H.; Engelmann, R.; Barja González, B.; Mamouri, R.E.; Zamorano, F.; Ansmann, A. Hemispheric contrasts in ice formation in stratiform mixed-phase clouds: Disentangling the role of aerosol and dynamics with ground-based remote sensing. Atmos. Chem. Phys. Discuss. 2021, 21, 17969–17994. [Google Scholar] [CrossRef]
  19. Zheng, X.; Xi, B.; Dong, X.; Wu, P. Environmental Effects on Aerosol–cloud Interaction in non-precipitating MBL Clouds over the Eastern North Atlantic. Atmos. Chem. Phys. Discuss. 2021, 22, 335–354. [Google Scholar] [CrossRef]
  20. Sarna, K.; Russchenberg, H.W. Ground-based remote sensing scheme for monitoring aerosol–cloud interactions. Atmos. Meas. Tech. (Online) 2016, 9, 1039–1050. [Google Scholar] [CrossRef]
  21. Mamouri, R.E.; Ansmann, A. Potential of polarization lidar to provide profiles of CCN-and INP-relevant aerosol parameters. Atmos. Chem. Phys. 2016, 16, 5905–5931. [Google Scholar] [CrossRef] [Green Version]
  22. Jimenez, C.; Ansmann, A.; Engelmann, R.; Donovan, D.; Malinka, A.; Seifert, P.; Wiesen, R.; Radenz, M.; Yin, Z.; Bühl, J.; et al. The dual-field-of-view polarization lidar technique: A new concept in monitoring aerosol effects in liquid-water clouds–case studies. Atmos. Chem. Phys. 2020, 20, 15265–15284. [Google Scholar] [CrossRef]
  23. Rosenfeld, D.; Sherwood, S.; Wood, R.; Donner, L. Climate effects of aerosol–cloud interactions. Science 2014, 343, 379–380. [Google Scholar] [CrossRef]
  24. Hänel, G. The properties of atmospheric aerosol particles as functions of the relative humidity at thermodynamic equilibrium with the surrounding moist air. In Advances in Geophysics; Elsevier: Amsterdam, The Netherlands, 1976; Volume 19, pp. 73–188. [Google Scholar]
  25. Zieger, P.; Fierz-Schmidhauser, R.; Weingartner, E.; Baltensperger, U. Effects of relative humidity on aerosol light scattering: Results from different European sites. Atmos. Chem. Phys. 2013, 13, 10609. [Google Scholar] [CrossRef] [Green Version]
  26. Köhler, H. The nucleus in and the growth of hygroscopic droplets. Trans. Faraday Soc. 1936, 32, 1152–1161. [Google Scholar] [CrossRef]
  27. Petters, M.; Kreidenweis, S. A single parameter representation of hygroscopic growth and cloud condensation nucleus activity. Atmos. Chem. Phys. 2007, 7, 1961–1971. [Google Scholar] [CrossRef] [Green Version]
  28. Pinsky, M.; Mazin, I.; Korolev, A.; Khain, A. Supersaturation and diffusional droplet growth in liquid clouds: Polydisperse spectra. J. Geophys. Res. Atmos. 2014, 119, 12872–12887. [Google Scholar] [CrossRef]
  29. Gasteiger, J.; Wiegner, M. MOPSMAP v1. 0: A versatile tool for the modeling of aerosol optical properties. Geosci. Model Dev. 2018, 11, 2739–2762. [Google Scholar] [CrossRef] [Green Version]
  30. Pruppacher, H.R.; Klett, J.D. Microphysics of clouds and precipitation. Nature 1980, 284, 88. [Google Scholar] [CrossRef]
  31. Bringi, V.N.; Chandrasekar, V. Polarimetric Doppler Weather Radar: Principles and Applications; Cambridge University Press: Cambridge, UK, 2001. [Google Scholar]
  32. Mészáros, A. On the concentration and size distribution of atmospheric sulfate particles under rural conditions. Atmos. Environ. (1967) 1978, 12, 2425–2428. [Google Scholar] [CrossRef]
  33. Hande, L.B.; Engler, C.; Hoose, C.; Tegen, I. Parameterizing cloud condensation nuclei concentrations during HOPE. Atmos. Chem. Phys. 2016, 16, 12059–12079. [Google Scholar] [CrossRef] [Green Version]
  34. Curtis, D.B.; Aycibin, M.; Young, M.A.; Grassian, V.H.; Kleiber, P.D. Simultaneous measurement of light-scattering properties and particle size distribution for aerosols: Application to ammonium sulfate and quartz aerosol particles. Atmos. Environ. 2007, 41, 4748–4758. [Google Scholar] [CrossRef]
  35. Tu, K.; Kanapilly, G. Generation and characterization of submicron ammonium sulfate and ammonium hydrogen sulfate aerosols. Atmos. Environ. (1967) 1978, 12, 1623–1629. [Google Scholar] [CrossRef]
  36. Pappalardo, G.; Amodeo, A.; Pandolfi, M.; Wandinger, U.; Ansmann, A.; Bösenberg, J.; Matthias, V.; Amiridis, V.; De Tomasi, F.; Frioud, M.; et al. Aerosol lidar intercomparison in the framework of the EARLINET project. 3. Raman lidar algorithm for aerosol extinction, backscatter, and lidar ratio. Appl. Opt. 2004, 43, 5370–5385. [Google Scholar] [CrossRef]
  37. Kroese, D.P.; Brereton, T.; Taimre, T.; Botev, Z.I. Why the Monte Carlo method is so important today. Wiley Interdiscip. Rev. Comput. Stat. 2014, 6, 386–392. [Google Scholar] [CrossRef]
  38. Guerrero, J.L. Técnica Lidar para la Caracterización Atmosférica Mediante Dispersión Elástica y Ramán. Ph.D. Thesis, Centro Andaluz del Medio Ambiente, Universidad de Granada, Granada, Spain, 2009. [Google Scholar]
  39. Rejano, F.; Titos, G.; Casquero-Vera, J.A.; Lyamani, H.; Andrews, E.; Sheridan, P.; Cazorla, A.; Castillo, S.; Alados-Arboledas, L.; Olmo, F.J. Activation properties of aerosol particles as cloud condensation nuclei at urban and high-altitude remote sites in southern Europe. Sci. Total Environ. 2021, 762, 143100. [Google Scholar] [CrossRef] [PubMed]
  40. Ervens, B.; Cubison, M.; Andrews, E.; Feingold, G.; Ogren, J.A.; Jimenez, J.L.; DeCarlo, P.; Nenes, A. Prediction of cloud condensation nucleus number concentration using measurements of aerosol size distributions and composition and light scattering enhancement due to humidity. J. Geophys. Res. Atmos. 2007, 112, D10S32. [Google Scholar] [CrossRef] [Green Version]
  41. Almeida, G.; Brito, J.; Morales, C.; Andrade, M.; Artaxo, P. Measured and modelled cloud condensation nuclei (CCN) concentration in S ao Paulo, Brazil: The importance of aerosol size-resolved chemical composition on CCN concentration prediction. Atmos. Chem. Phys. 2014, 14, 7559–7572. [Google Scholar] [CrossRef] [Green Version]
  42. Sauvageot, H.; Omar, J. Radar reflectivity of cumulus clouds. J. Atmos. Ocean. Technol. 1987, 4, 264–272. [Google Scholar] [CrossRef] [Green Version]
  43. Yau, M.K.; Rogers, R.R. A Short Course in Cloud Physics; Elsevier: Amsterdam, The Netherlands, 1996. [Google Scholar]
  44. Psichoudaki, M.; Nenes, A.; Florou, K.; Kaltsonoudis, C.; Pandis, S.N. Hygroscopic properties of atmospheric particles emitted during wintertime biomass burning episodes in Athens. Atmos. Environ. 2018, 178, 66–72. [Google Scholar] [CrossRef]
  45. Zhai, J.; Lu, X.; Li, L.; Zhang, Q.; Zhang, C.; Chen, H.; Yang, X.; Chen, J. Size-resolved chemical composition, effective density, and optical properties of biomass burning particles. Atmos. Chem. Phys. 2017, 17, 7481. [Google Scholar] [CrossRef] [Green Version]
  46. Dentener, F.; Kinne, S.; Bond, T.; Boucher, O.; Cofala, J.; Generoso, S.; Ginoux, P.; Gong, S.; Hoelzemann, J.; Ito, A.; et al. Emissions of primary aerosol and precursor gases in the years 2000 and 1750, prescribed data-sets for AeroCom. Atmos. Chem. Phys. 2006, 6, 4321–4344. [Google Scholar] [CrossRef] [Green Version]
  47. Remer, L.; Kaufman, Y.; Holben, B.; Thompson, A.; McNamara, D. Biomass burning aerosol size distribution and modeled optical properties. J. Geophys. Res. Atmos. 1998, 103, 31879–31891. [Google Scholar] [CrossRef] [Green Version]
  48. Keil, A.; Haywood, J.M. Solar radiative forcing by biomass burning aerosol particles during SAFARI 2000: A case study based on measured aerosol and cloud properties. J. Geophys. Res. Atmos. 2003, 108, 8467. [Google Scholar] [CrossRef]
  49. Denjean, C.; Cassola, F.; Mazzino, A.; Triquet, S.; Chevaillier, S.; Grand, N.; Bourrianne, T.; Momboisse, G.; Sellegri, K.; Schwarzenboeck, A.; et al. Size distribution and optical properties of mineral dust aerosols transported in the western Mediterranean. Atmos. Chem. Phys. 2016, 16, 1081–1104. [Google Scholar] [CrossRef] [Green Version]
  50. D’Almeida, G.A.; Koepke, P.; Shettle, E.P. Atmospheric Aerosols: Global Climatology and Radiative Characteristics; A Deepak Pub: Hampton, VA, USA, 1991. [Google Scholar]
  51. Yuan, T.; Li, Z.; Zhang, R.; Fan, J. Increase of cloud droplet size with aerosol optical depth: An observation and modeling study. J. Geophys. Res. Atmos. 2008, 113, D04201. [Google Scholar] [CrossRef]
  52. Dusek, U.; Frank, G.; Hildebrandt, L.; Curtius, J.; Schneider, J.; Walter, S.; Chand, D.; Drewnick, F.; Hings, S.; Jung, D.; et al. Size matters more than chemistry for cloud-nucleating ability of aerosol particles. Science 2006, 312, 1375–1378. [Google Scholar] [CrossRef] [PubMed] [Green Version]
  53. Carslaw, K.; Lee, L.; Reddington, C.; Pringle, K.; Rap, A.; Forster, P.; Mann, G.; Spracklen, D.; Woodhouse, M.; Regayre, L.; et al. Large contribution of natural aerosols to uncertainty in indirect forcing. Nature 2013, 503, 67–71. [Google Scholar] [CrossRef] [PubMed]
  54. Regayre, L.; Pringle, K.; Booth, B.; Lee, L.; Mann, G.; Browse, J.; Woodhouse, M.; Rap, A.; Reddington, C.; Carslaw, K. Uncertainty in the magnitude of aerosol–cloud radiative forcing over recent decades. Geophys. Res. Lett. 2014, 41, 9040–9049. [Google Scholar] [CrossRef]
  55. Intergovernmental Panel on Climate Change. Climate change 2007: The physical science basis. Agenda 2007, 6, 333. [Google Scholar]
  56. Feingold, G.; Eberhard, W.L.; Veron, D.E.; Previdi, M. First measurements of the Twomey indirect effect using ground-based remote sensors. Geophys. Res. Lett. 2003, 30, 1287. [Google Scholar] [CrossRef] [Green Version]
  57. Raghavan, S. Radar Meteorology; Springer Science & Business Media: Berlin/Heidelberg, Germany, 2013; Volume 27. [Google Scholar]
  58. Mei, F.; Setyan, A.; Zhang, Q.; Wang, J. CCN activity of organic aerosols observed downwind of urban emissions during CARES. Atmos. Chem. Phys. 2013, 13, 12–155. [Google Scholar] [CrossRef] [Green Version]
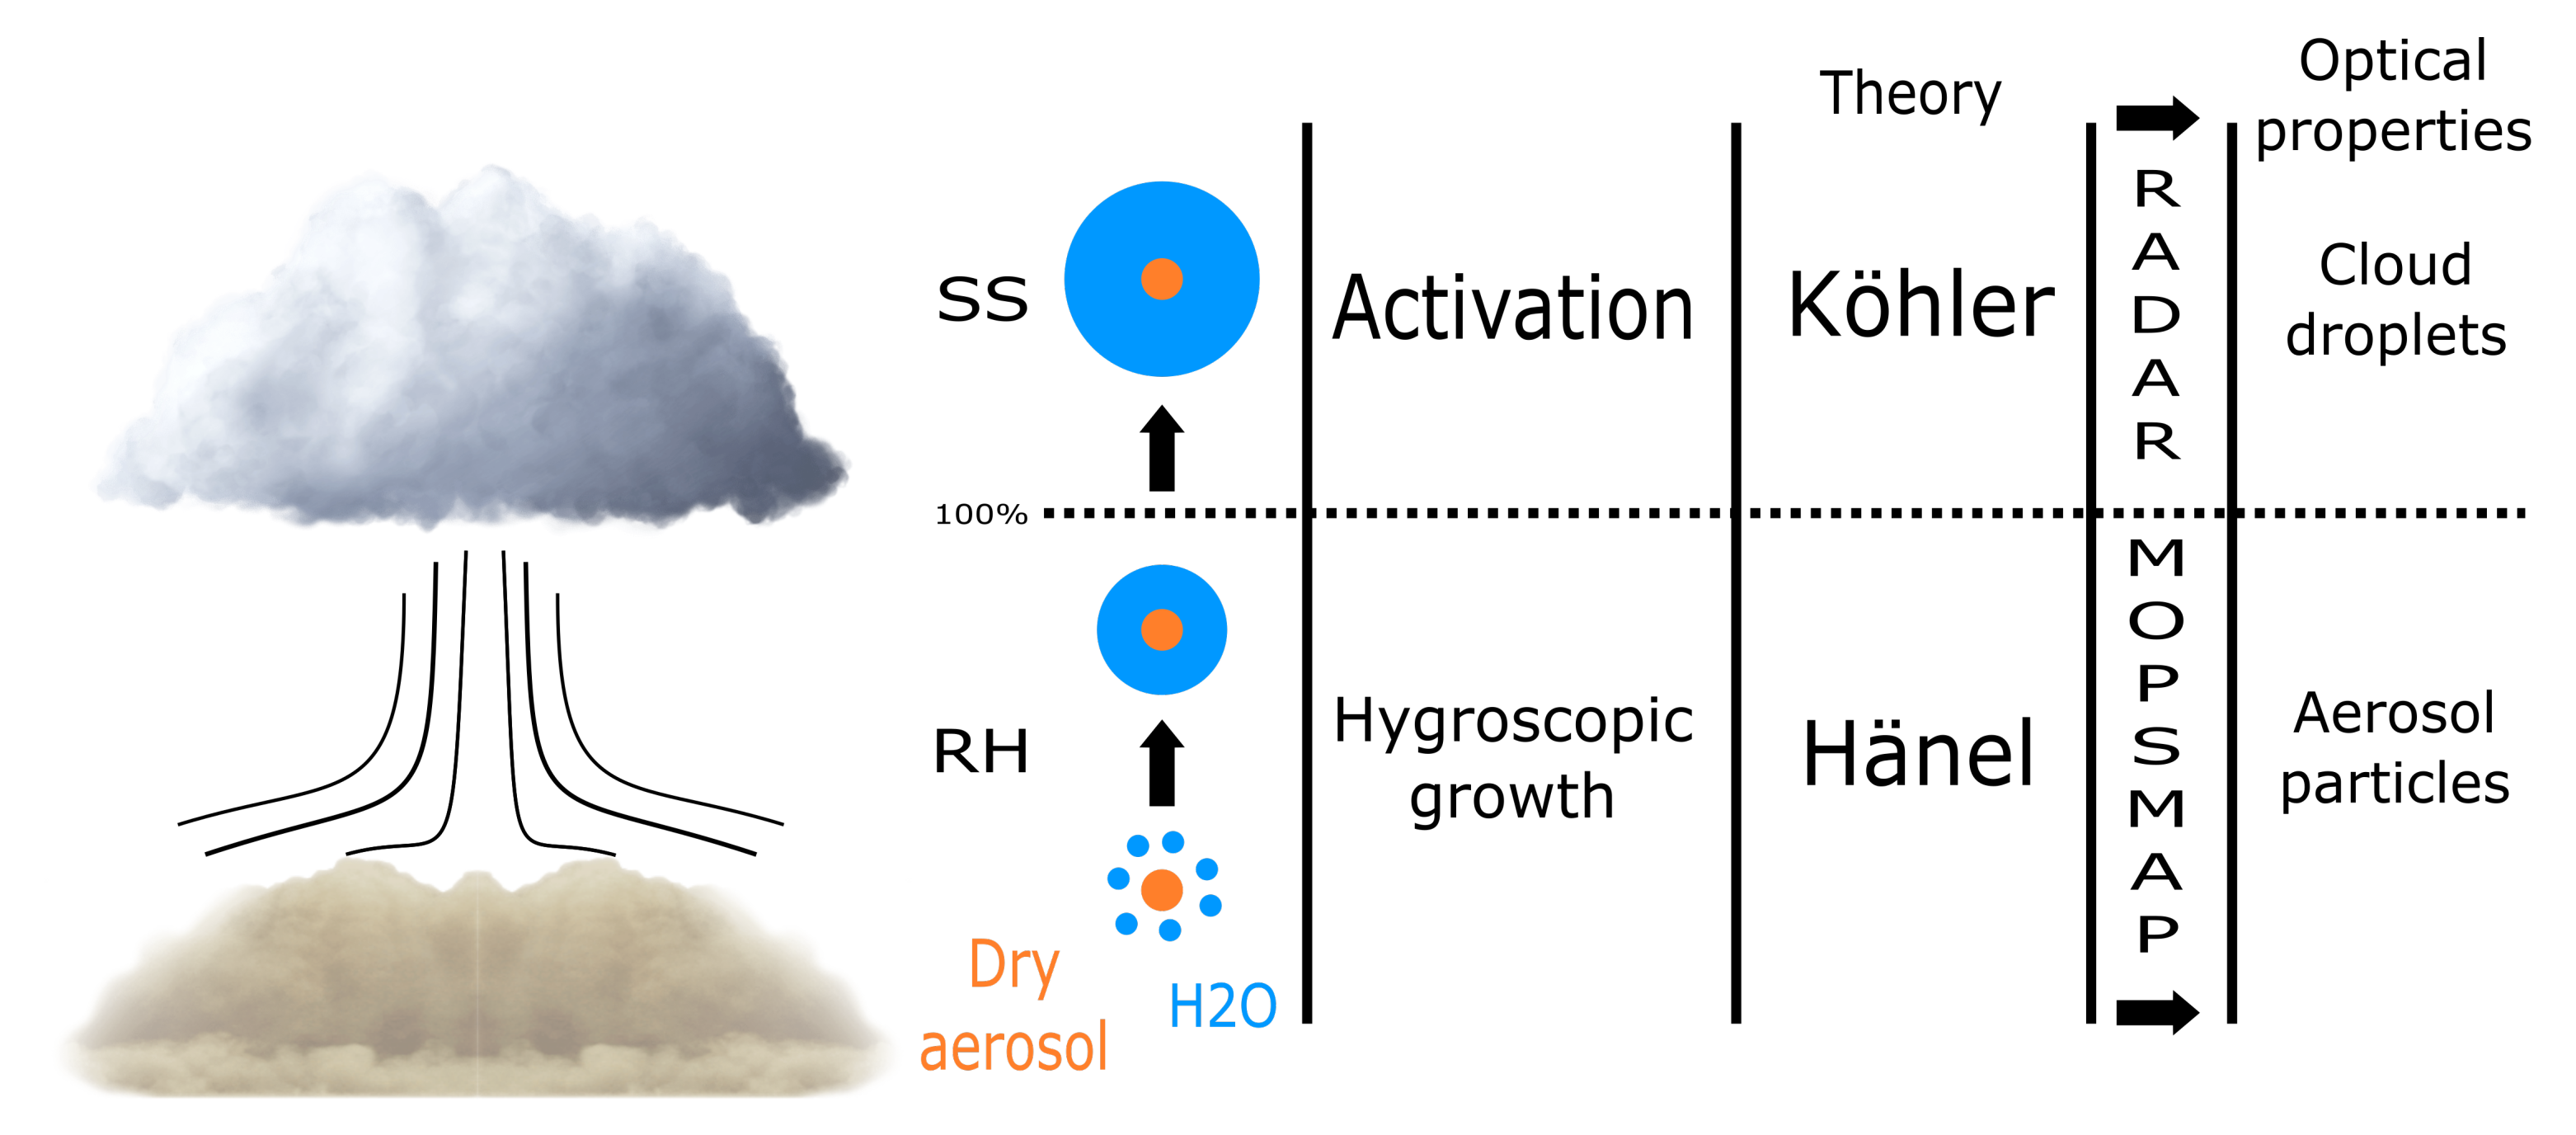
Figure 1. Simulation scheme (left to right columns): The ascent of the dry air parcel, cloud formation, atmospheric process and theories, retrieval of aerosol and cloud optical properties from the PSD and DSD, respectively; and generation of lidar (aerosol and cloud) and radar (cloud) signals.
Remotesensing 14 01333 g001
Figure 2. (a) Relative humidity (RH), (b) effective radius and attenuated backscatter coefficient ( β a t t ) (c) profiles retrieved using LARSS with standard atmospheric conditions at surface (298.15 K, 101.325 kPa, and R H = 30 % ).
Remotesensing 14 01333 g002
Figure 3. (a) Supersaturation (SS), (b) droplet effective radius ( D r e f f ) and (c) backscatter attenuated ( β a t t ) profiles retrieved from LARSS within the cloud.
Remotesensing 14 01333 g003
Figure 4. Dependence between l o g ( N a ) and l o g ( N D ) (left), between l o g ( N a ) and l o g ( r e f f ) (center), and between l o g ( Z e ) and l o g ( β ) (right) at three different heights varying the initial number of aerosol for the accumulation mode ammonium sulfate using ten iterations. Input parameters of Table 1.
Remotesensing 14 01333 g004
Figure 5. Monte Carlo technique scheme showing the process to derive ACI uncertainty from input parameter uncertainties ( P i ± Δ P i ) .
Remotesensing 14 01333 g005
Figure 6. Δ A C I r e f f β and Δ A C I r e f f A O D with respect to the number of simulations (N).
Remotesensing 14 01333 g006
Figure 7. AF of the aerosol in Granada (UGR) and Sierra Nevada (SNS) for different maximum SS.
Remotesensing 14 01333 g007
Figure 8. A C I N d , A C I r e f f (based in β ) and radar reflectivity factor ( Z e ) of ammonium sulfate, where the red dashed line marks the height at which the minimum radar sensitivity is reached.
Remotesensing 14 01333 g008
Figure 9. Aerosol cloud interaction index ( A C I N d and A C I r e f f ) for different aerosol types, as a function of height, according to the legend.
Remotesensing 14 01333 g009
Figure 10. Aerosol cloud interaction index ( A C I N d and A C I r e f f ) for different mixtures of two aerosol types, as a function of height, according to the legend.
Remotesensing 14 01333 g010
Figure 11. A C I N d , A C I r e f f for different mixtures of three and four aerosol types according to the legend.
Remotesensing 14 01333 g011
Figure 12. Correlation coefficients ( R 2 A C I ) and variability ( Δ ACI) for A C I N d β and A C I r e f f β as a function of the fluctuation of the aerosol modal radius at surface ( r m , d r y ) using LARSS.
Remotesensing 14 01333 g012
Figure 13. Correlation coefficients ( R 2 A C I ) and variability ( Δ ACI) for A C I N d β and A C I r e f f β as a function of the fluctuation of the aerosol modal radius at the CBH ( r m , w e t ) using LARSS.
Remotesensing 14 01333 g013
Figure 14. Correlation coefficients ( R 2 A C I ) and variability ( Δ ACI) for A C I N d β and A C I r e f f β as a function of the fluctuation of the updraft velocity (w) using LARSS.
Remotesensing 14 01333 g014
Figure 15. A C I R s proposal for different cases according to the legend using LARSS.
Remotesensing 14 01333 g015
Figure 16. Relation between the A C I N d and A C I r e f f with the A C I R s considering ACI values where Z e greater than 60   d B .
Remotesensing 14 01333 g016
Figure 17. Relation between the A C I r e f f with the A C I R s for different cases with AE from 0.6 to 1.4 ( Z e 60 dB).
Remotesensing 14 01333 g017
Table 1. Initial parameters used for ammonium sulfate ([32,33,34,35]).
Atmospheric
properties
SpecieAmmonium
sulfate
Atmospheric
conditions
Temperature
[ T o ] (K)

298
Number
concentration
[ N a ] ( # 10 8 / m 3 )
5.0
Minimun radius
( μ m )
0.01 Pressure
[ e o ] ( kPa )
101
Modal radius
( μ m )
0.1 Updraft
[ w ] ( m / s )
2
Maximun radius
( μ m )
0.5 Water-vapor
ratio [ q v ]
8
PSD standard
deviation [ σ ]
1.6 Instrumental
parameters
Lidar
wavelength
( n m )
355
Hygroscopicity
parameter [ κ ]
0.51
Density
( g / c m 3 )
1.77 Radar
wavelength
( m m )
3.18
Refractive
index
1.448 +
i 7.49 × 10 6
Table 2. A C I N d , A C I r e f f , and A C I R s values for different height according to the slope of Figure 4.
Height (m)100120140
A C I N d 0.97 ± 0.040.92 ± 0.040.81 ± 0.04
Height (m)260280300
A C I r e f f 0.17 ± 0.010.20 ± 0.010.21 ± 0.01
Height (m)300320340
A C I R s 0.59 ± 0.030.61 ± 0.030.64 ± 0.03
Table 3. ACI uncertainty calculated by the Monte Carlo technique.
Uncertainty
h A C I R s A C I r e f f A C I N d
10 0.05 0.020 0.07
20 0.04 0.016 0.05
30 0.03 0.011 0.04
40 0.03 0.014 0.05
Table 4. Atmospheric and cloud parameter used for LARSS comparison.
Atmospheric
aerosol
properties
Measurement locationUGRSNS
Number concentration
[ N d ] ( # 10 8 / m 3 )
13027
Minimun radius
( μ m )
0.0120.012
Modal radius
[ D r m o d ] ( μ m )
0.0450.062
Maximun radius
( μ m )
0.5140.514
Hygroscopicity parameter
[ κ ]
0.1860.198
Density
( g / c m 3 )
1.762.08
Refractive index1.51
+0.005i
1.51
+0.005i
Cloud
properties
Supersaturation
[ S S ] (%)
0.20.25
Activation-related
properties
CCN concentration
( # 10 8 / m 3 )
10.064.13
Activation fraction [ A F ] 0.0770.152
Table 5. LARSS monomodal implemented cases.
CaseAerosol TypeAerosol Mode
A a Ammonium sulfateAccumulation
B a Biomass burningAccumulation
D a DustAccumulation
D c DustCoarse
Table 6. Initial parameters used for the different aerosol types. Source: α Mészáros [32], β Tu and Kanapilly [35], γ D’Almeida et al. [50], δ Remer et al. [47], ϵ Keil and Haywood [48], ζ Dentener et al. [46], η Curtis et al. [34], θ Denjean et al. [49], ι Hande et al. [33], λ Zhai et al. [45], and μ Psichoudaki et al. [44].
Atmospheric
properties
SpecieAmmonium
sulfate [ A a ]
Burning
Biomass [ B a ]
Dust
Accumulation [ D a ]
Dust
Coarse [ D c ]
Atmospheric
conditions
Temperature
[ T o ] (K)
298
Number
concentration
[ N a ] ( # 10 8 / m 3 )
α 5.00 ϵ 18.90 ζ 7.00 ζ 0.35
Minimun radius
( μ m )
α 0.01 δ 0.05 ζ 0.05 ζ 0.50Pressure
[ e o ] ( kPa )
101
Modal radius
( μ m )
β 0.10 δ 0.14 ζ 0.20 ζ 1.30Updraft
[ w ] ( m / s )
2
Maximun radius
( μ m )
α 0.5 δ 0.5 ζ 0.5 ζ 6.0Water-vapor
ratio [ q v ] ( g / k g )
8
Standard
deviation [ σ ]
ι 1.6 γ 1.3 ι 1.59 ι 2.00Instrumental
parameters
Lidar
wavelength
( n m )
355
Hygroscopicity
parameter [ κ ]
ι 0.51 μ 0.22 ι 0.14 ι 0.14
Density
( g / c m 3 )
ι 1.77 λ 1.15 ι 2.60 ι 2.60Radar
wavelength
( m m )
3.18
Refractive
index
η 1.448 +
i 7.49 × 10 6
δ 1.520 +
i 0.025
θ 1.530 +
i 0.008
θ 1.530 +
i 0.008
Table 7. Fluctuation range of each parameter to retrieve the ACI index based in the backscatter coefficient ( β ) or the aerosol optical depth ( A O D ) with a variability lower than 10 % , 20 % and 30 % . Parameters are sorted according to their influence on A C I r e f f uncertainty (Up, higher influence). R 2 remains above 0.6 for all parameters, except for hygroscopicity parameter at CBH ( R 2 = 0.31 ) and the updraft velocity ( R 2 = 0.34 ).
ACI Index Variability
ACI Based on<10%<20%<30%
Parameter
fluctuation
(%)
Refractive index β 135
AOD152435
PSD standard deviation at surface β 4610
AOD61016
Dry modal radius at surface β 71316
AOD131618
Wet modal radius at CBH β 151720
AOD
Dry maximum radius at surface β 465763
AOD 636567
Hygroscopicity parameter at CBH β 568794
AOD
Updraft β 5995119
AOD
Wet maximum radius at CBH β 74144178
AOD
Hygroscopicity parameter at surface β 82135216
AOD
Publisher’s Note: MDPI stays neutral with regard to jurisdictional claims in published maps and institutional affiliations.