Abstract
The Himalayan, Karakoram, and Hindu Kush (HKH-TMHA) are the three main mountain ranges in the high-mountain Asia region, covering the China–Pakistan Economic Corridor (CPEC). In this study, we identified glacial lakes in the HKH-TMHA region based on multitemporal Landsat images taken from 1990 to 2020. We analyzed the spatial distribution and evolution of glacial lakes in the HKH-TMHA region from the perspective of their elevation, size, and terrain aspect; then, we described their temporal changes. The results showed that approximately 84.56% of the glacial lakes (84.1% of the total lake area) were located at elevations between 4000 m and 5500 m, and glacial lakes with areas ranging from 0.01–0.5 km2 accounted for approximately 95.21% of the number and 63.01% of the total area of glacial lakes. The number (38.64%) and area (58.83%) of south-facing glacial lakes were largest in HKH-TMHA and expanded significantly over time. There were 5835 (664.84 ± 89.72 km2) glacial lakes in 1990; from 1990 to 2020, the number of glacial lakes in the HKH-TMHA region increased by 5974 (408.93 km2) in total; and the annual average increase in the area of glacial lakes reached 13.63 km2 (11.15%). In 2020, the total number of glacial lake reached to 9673 (899.66 ± 120.63 km2). In addition, most glacial lakes were located in the Eastern Himalayan, China, and the Indus Basin. Based on the precipitation and temperature analyses performed in our study area, we found inconsistent climate characteristics and changes in the three mountain ranges. In general, the daily precipitation (temperature) increased by 1.0766 mm (1.0311 °C), 0.8544 mm (0.8346 °C), and 0.8245 mm (−0.1042 °C) on the yearly, summer, and winter scales, respectively. Glacial melting and climate change are common contributors to glacial lake expansion. The investigation of glacial lakes in this region can provide basic supporting data for research on glacial lake-related disasters, land cover, and climate change in the high-mountain Asia region.
1. Introduction
Glacial lakes are one of the most active elements of the cryosphere system, are extremely sensitive to climate change, and can be used as indirect indicators of regional glacier changes, regional water cycles, and climate change [1,2]. High-mountain Asia has the world’s largest volume of glaciers among both low-latitude and high-altitude regions, thus forming the region with one of the largest glacial lake densities in the world. In recent years, glaciers in high-mountain Asia regions have retreated substantially on a large scale beyond the context of global warming [3,4,5,6], and the negative mass balances of glaciers have increased [7,8,9]. Changes in glaciers such as Hamtah (−1.2 m/y w.e., 2001–2006) [10,11], AX010 (−0.63 m/y w.e., 1996–1999) [10,11] and Multiple (−0.30 m/y w.e., 1962–2005) [12] have led to a series of serious environmental disasters, such as reductions in freshwater resources, glacier-snow losses, and glacial lake outburst floods (GLOFs) [13,14]. Glacial mass losses and retreat provide both the main water source and the space required for the expansion of glacial lakes, thus leading to environmental changes that can alter the water resources and disaster risks associated with GLOFs; these factors have led to the repeated formation of inventories and assessments of glacial lakes in this region [6,7,8]. On the one hand, glacial lakes represent the water supply for many downstream rivers and lakes and can thus provide basic needs for residents living in the regions surrounding these rivers, agricultural irrigation, and industrial production. On the other hand, many disaster events, such as avalanches, GLOFs, glacial mudslides, and other disasters, may occur due to the substantial retreat of glaciers and the subsequent expansion of glacial lakes, and these events can cause huge losses to the natural environment, people’s lives, and local economic development [4,15,16]. Therefore, long-term mapping and dynamic monitoring research on glacial lakes in the Himalayan, Karakoram, and Hindu Kush (HKH-TMHA) region is of great significance for understanding glacier-related hazards and water resources. The derived results can also be used to assess the risk levels of glacial lake outburst floods (GLOFs) and for disaster prevention and management.
However, rigorous field-based surveys of glacial lakes in high-mountainous regions are time consuming, laborious, and restrictive, and remote sensing techniques have been the primary method used to monitor glacial lakes due to their advantages, including their appropriate spatial resolutions, long-term coverage, and wide monitoring ranges [17,18]. Researchers usually use satellite images, topographic maps, and aerial photographs to delineate glacial lake boundary data based on visual interpretation [19,20]. For example, Wang, et al. [21] detected glacial lakes within a 10 km buffer zone around glacial-covered areas in western China in 2015 based on 158 Landsat OLI image scenes, the Second Glacier Inventory Dataset of China, Shuttle Radar Topography Mission (SRTM) digital elevation data, and Google Earth image data. Visual interpretation method can be used to accurately delineate glacier lake boundaries, but these methods are time-consuming, laborious, costly, and the corresponding subjective factors are relatively large; thus, these methods are not suitable for mapping glacial lakes or conducting dynamic monitoring research in remote or large-scale regions. Thus, many automatic extraction methods have emerged for delineating water bodies, such as classification methods [22,23], threshold segmentation methods [24,25,26,27,28], machine learning methods [29,30,31,32], and other improved methods [33,34] (e.g., methods in which classification tree-based image segmentation and object-oriented spatial metrics are implemented to improve existing water body indices). However, it is still difficult to distinguish glacial lakes or their boundaries in some images due to the small sizes of lakes, lakes being shadowed by steep terrain, or lakes being ice-covered or snow-covered; these factors can change dramatically over a year or even over several months [32].
The Himalayan, Karakoram and Hindu Kush are the three typical mountain ranges in high-mountain Asia, and a large number of glacial lakes of different shapes and areas exist in these mountains. High-mountain Asia is a hotspot for researchers to study glacial lakes, especially the Himalayan [35,36,37,38], and researchers usually focus on the following three issues: the mapping and investigation of glacial lakes, the evolution of glacial lakes, and glacial lake outburst floods (GLOFs) [39]. Nie et al. [40] used a total of 348 Landsat-derived satellite images to map the spatial distribution of glacial lakes in the Himalayan from 1990 to 2015, and the research results showed that the Himalayan glacial lakes were mainly distributed at elevations between 4000 m and 5700 m a.s.l. The area of glacial lakes in the Himalayan expanded by approximately 14.1% from 1990 to 2015, and the total area of glacial lakes was 455.3 ± 72.7 km2 in 2015. Li et al. [41] selected the CPEC as the study area and used Landsat 8 OLI images as the main data source to delineate the extent of glacial lakes from 2016–2018 through the normalized water index threshold method, a slope analysis, and a manual rectification process. They delineated a total of 1341 glacial lakes in the CPEC from 2016 to 2018, with a total lake area of 109.76 ± 9.82 km2, and all the glacial lakes were distributed at elevations between 2220 m and 5119 m. Gardelle et al. [9] selected seven sites along the Himalayan, Hindu Kush, and Karakoram regions and then mapped the glacial lakes at each site using an automatic classification scheme in 1990, 2000 and 2009. The results indicated that the individual glacial lake size and total glacial lake amounts varied greatly from one study site to another; in addition, the research results showed that glacial lakes in India, Nepal, and Bhutan were larger and more numerous than those in Pakistan and Afghanistan, which may have been due to the differences in precipitation, temperature, and elevation among these countries. In addition, many recent studies have been devoted to mapping glacial lakes over similar regions of high-mountain Asia as that considered herein, and some recent studies have focused on characteristic analytics [42,43,44,45], while others have focused on glacial lake inventory data, lake extraction processes [46], or related GLOFs [47]. All of these studies analyzed different study periods. In this work, we compared the differences among these past studies in the following discussion chapter. Although glacial lake changes have been investigated in the HKH-TMHA region many times, most of these studies have been limited to part of the HKH-TMHA, to typical regions, or even to typical glacial lakes, and a long-time-series glacial lake inventory is thus lacking. Therefore, an in-depth understanding of the spatial distribution and change characteristics of glacial lakes in the HKH-TMHA region is necessary and could provide a strong scientific reference for the construction of the Sichuan–Tibet Railway and the development of the CPEC.
Above all, filling and updating the gaps in the inventory of glacial lakes in the HKH-TMHA region is a prerequisite of this study. We aim to extract glacial lakes on the HKH-TMHA from 1990 to 2020 based on a combination of automatic extraction method and visual interpretation method using Landsat Thermal Mapper (TM), Enhanced Thermal Mapper (ETM+), and Operational Land Imager (OLI) imagery. The objectives of this study are to (1) map the inventory of glacial lakes in the HKH-TMHA region from 1990 to 2020; (2) analyze glacial lake changes (number and area) in different regions and of different sizes, different elevations, and different terrain aspects; and (3) discuss the correlations between glacial lakes and regional climate change, glacier changes, water resources, and glacial lake disasters.
2. Study Area
The study area considered in this work (HKH-TMHA) covered the entire Himalayan (including the Eastern, Central, and Western Himalayan), Karakoram and Hindu Kush ranges, which trend northwest-southeast and converge in the CPEC (Figure 1). The HKH-TMHA region spans seven countries, including China, Pakistan, India, Afghanistan, Nepal, Bhutan, and Tajikistan, and forms a large cluster of mountains together with Tianshan Mountains and Kunlun Mountains; these regions are collectively known as the “Roof of the World”. The total area of the study area (25° N–39° N, 67° E–96° E) is 9.24 × 10⁵ km2, the highest elevation within the HKH-TMHA region is 8824 m, and the average elevation is approximately 4142.5 m. The HKH-TMHA region and its surrounding areas are known as the “Asian Water Tower”; many of the world’s major rivers and basins originate in the HKH-TMHA region, including the Yellow River, Yangtze River, Ganges River, Mekong River, Indus River, Salween River, and Irrawaddy River, passing through the Hamun Basin, Tarim Basin, Ganges Basin, Aral Sea Basin, Indus Basin, and Brahmaputra Basin. In addition, this region contains the second-largest concentration of glaciers in the world, excluding the two poles [48]. In terms of the climate conditions, the HKH-TMHA region is mainly dominated by the South Asian monsoon in summer and is significantly influenced by the westerly airflow in winter. Spring and autumn are transitional periods. The average annual precipitation in the Himalayan is approximately 1200 mm, while the precipitation total varies from 100 mm to 1000 mm in the Karakoram range. The temperatures are low year-round, especially in the Karakoram range, where temperatures remain below 0 °C most of the year. Moreover, the permafrost area on the Tibetan Plateau is approximately 1.05 × 10⁶–1.5 × 10⁶ km2 [49].

Figure 1.
The geographic location of the HKH-TMHA region.
Within the HKH-TMHA region, the Himalayan are approximately 2500 km long from east to west and represent an important barrier between the subcontinent of India and the Tibetan Plateau. The Himalayan have regional ice reserves of 3734.5 km3 [50], and most of the glaciers in these mountains are distributed on southern slopes. The Karakoram mountains contain the watershed between the Indus and Tarim Rivers. According to the statistics of the Second Glacier Inventory Dataset of China, the number of glaciers in the Karakoram region of China is 5316, covering an overall area of 5988.57 km2, and these mountains have the highest glacier coverage of the major mountains in the China region [51]. In the Hindu Kush mountains, a large number of modern glaciers have developed, and most of the mountainous regions of the Hindu Kush lie within Afghanistan and Pakistan.
3. Materials and Methods
3.1. Data Sources
3.1.1. Landsat Images
In consideration of data accessibility and image coverage factors, in our study, we selected Landsat images (including Landsat 5, 7, and 8 images) with a 30 m spatial resolution acquired by Landsat satellites launched by the National Aeronautics and Space Administration (NASA) as the main data sources for glacial lake inventory mapping. Landsat imagery is widely used to monitor surface features and elements due to its continuous monitoring, wide coverage, and free-downloading advantages [52,53,54]. All Landsat images used herein can be downloaded from the United States Geological Survey (USGS) (http://earthexplorer.usgs.gov/, accessed on 2 January 2021), and all are Level-1 Terrain-corrected (L1T) data products. These products have been accurately calibrated using ground control points and digital elevation model data, meaning they represent perfect scenes with no detected errors. The Landsat images used for this study were selected following three principles: (1) the cloud cover of a single Landsat image scene was below 10% if possible; (2) the acquisition times of the selected images were between June and November [46] (during this period of each year, the state of the glacial lake is relatively stable) as much as possible; and (3) for years with poor image quality or missing data, all available high-quality images were acquired primarily within ±2 years of the mapping years (for example, the circa-1990 data spanned from 1988 to 1992). One exception was made in our study for the period around 2005 due to the high cloud-cover frequency; we used 2008 data as a replacement. A total of 651 Landsat images were downloaded from the USGS for use in this study; these images were taken between 1990 and 2020.
3.1.2. Digital Elevation Model (DEM)
In this study, we used the version-2 Advanced Spaceborne Thermal Emission and Reflection Radiometer Global Digital Elevation Model (ASTER GDEM V2), which can be downloaded from Geospatial Data Cloud (http://www.gscloud.cn, accessed on 17 August 2021). The spatial resolution of ASTER GDEM V2 data is 30 m, and the data cover all land areas between 83° N and 83° S. These data are relatively complete within the study area, with no missing data. The DEM data were used to obtain the elevations of the glacial lakes and to calculate the hill shading, slope, and terrain aspect. Terrain information can be used to eliminate the influence of ice and mountain shadows when extracting glacial lakes, and we also used these data to investigate the spatial characteristics of glacial lakes in the HKH-TMHA region.
3.1.3. Glacier Inventory Datasets
Glacial data were used to generate buffer zones and determine the extents of glacial lakes. Some scholars believe that all lakes within 10 km of the nearest glacier terminus can be considered glacial lakes, and we determined the extent of glacial lakes based on this method in this study [44,46]. The glacier datasets used in this research included (i) version 6.0 of the Randolph Glacier Inventory (RGI 6.0) [55], which can be accessed from the Global Terrestrial Glacier Monitoring Program (http://www.glims.org, accessed on 20 February 2021), and (ii) the Second Glacier Inventory Dataset of China provided by the National Cryosphere Desert Data Center (http://www.ncdc.ac.cn, accessed on 20 February 2021) [56]. The RGI 6.0 data were also used in this study to derive the mountain boundaries in the HKH-TMHA region.
3.1.4. Meteorological Datasets
The meteorological data were provided by the National Oceanic and Atmospheric Administration (NOAA) Climate Prediction Center (CPC) (https://psl.noaa.gov/, accessed on 16 November 2021): (i) the temperature data were the global surface monthly average temperature data product GHCN_CAMS Gridded 2-m Temperature (Land) [57] data obtained during the 1948–2021 period at a spatial resolution of 0.5° × 0.5° and a spatial coverage range of 89.75 S–89.75 N, 0.25 E–359.75 E; (ii) the utilized precipitation data were the global daily precipitation data product called the CPC Global Unified Gauge-Based Analysis of Daily Precipitation [58,59,60] from 1979 to the present, and these data had a spatial resolution of 0.5° × 0.5° and a spatial coverage of 89.75 N–89.75 SN, 0.25 E–359.75 E. In our study, we calculated the average annual daily temperature, average daily summer temperature, average daily winter temperature, average annual daily precipitation, average daily summer precipitation, and average daily winter precipitation based on the data listed above and then analyzed the relation between glacial lakes and climate change.
3.1.5. Other Datasets
The other utilized data included (i) statistical text information obtained from the literature; (ii) Google Earth high-resolution images; (iii) basin boundaries and national boundary vector data; and (iv) GLOFs data from related research. These data were used as auxiliary data for the extraction and analysis of glacial lakes in the HKH-TMHA region.
3.2. Methods
3.2.1. Glacial Lake Identification Method
Because the extent of the HKH-TMHA region is extremely large, it is impractical to manually delineate the boundaries of the glacial lakes in this region. Therefore, we combined an automatic lake extraction method and visual interpretation method to derive glacial lake boundaries in the HKH-TMHA region from 1990 to 2020. The method used to identify glacial lakes mainly included three steps: data processing, lake extraction, and glacial lake filtration. The specific process is described below (Figure 2).
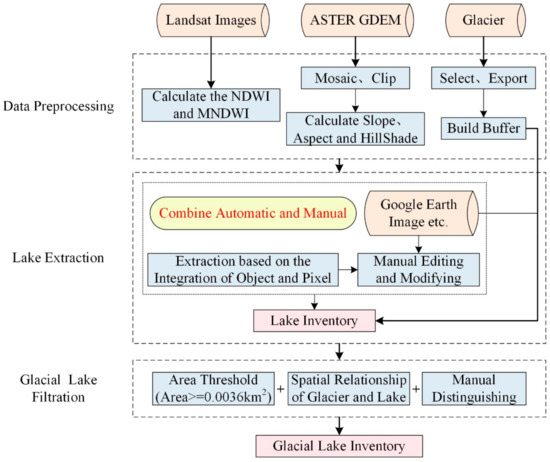
Figure 2.
Flow chart of glacial lake extraction process utilized in this study.
Step 1: Data processing. This step consisted of three parts: (1) The first step involved the processing of the remote sensing images. Since the Landsat image data products were accurately calibrated using ground control points and digital elevation model data, we mainly performed image enhancement, clipping, and mosaicking operations on the images and did not perform further correction processing on the images. In addition, we also calculated the related indices of the images. The water indices were designed to enhance the discrimination ability between water bodies and other natural features. In this study, we investigated two water indices and a snow index: the normalized difference water index (NDWI) (Equation (1)) proposed by McFeeters [24], the improved normalized water index (MNDWI) (Equation (2)) proposed by Xu [28], and the normalized difference forest snow index (NDFSI) [61] (Equation (3)). These indices were also used in the following glacial lake extraction step. (2) The second step involved the processing of the DEM data. These DEM data were used to obtain the elevations of the glacial lakes and to calculate the hill shading, slope, and terrain aspect of each lake. These terrain parameters information were then used to detect mountain shadows, identify ice/snow and extract glacial lakes. (3) The third step involved the processing of the glacier data. First, we extracted glacier outlines within the HKH-TMHA region (regions 13, 14, and 15 of RGI 6.0 and part of the Second Glacier Inventory Dataset of China). Then, we built 10 km buffers surrounding the selected glacier outlines; the glacial lakes considered herein should be within these extent ranges. The indices used herein can be expressed as follows:
where green, NIR, and SWIR are the green band, near-infrared band, and shortwave infrared band, respectively, representing bands 2, 4, and 5, respectively, of Landsat TM and Landsat ETM+ and bands 3, 5, and 6, respectively, of Landsat OLI.
Step 2: Lake extraction. In this study, the lake extents from 1990–2020 were extracted using an automatic lake extraction method [62] (the lake extraction method was based on the integration of an object-oriented approach and a watershed algorithm) and a visual interpretation method. The automatic lake extraction method included three steps: (1) first, the water index differences of typical natural features (including pure water, mixed water, mountain shadow, ice/snow, and bare land areas) and water bodies were analyzed, and an optimal threshold was found; (2) second, a multiresolution segmentation algorithm was employed to segment the images into objects, then the upper and lower threshold limits (of the water index, NIR, slope, etc.) were set, and the target images were segmented into a certain foreground, certain background, and unknown regions; (3) finally, the lake boundaries were determined and the unknown regions were refined using the watershed algorithm; this procedure can reduce the omission of water pixels. The above procedures had to be performed image by image. A visual interpretation was conducted after extracting all the lakes. We overlapped all the lake shapefiles with Landsat images and Google Earth high-resolution images, removed the overlapping lake regions and misclassified lake regions, and delineated the small lakes that were not recognized. Finally, all the lakes identified in the same periods from 1990 to 2020 were merged, and lake inventory data representing the HKH-TMHA region were finally obtained.
Step 3: Glacial lake filtration. Many definitions of glacial lakes exist; these definitions are based on different perspectives and research objectives, but all definitions are inseparable from the leading role played by glaciers in the formation of and changes in glacial lakes [63,64,65]. In this study, we referred to Yao’s definition of a glacial lake: a glacial lake is a natural water body supplied mainly by water sourced from modern glacier melting or formed in the moraine depression of a glacier [65]; then, we formulated extraction criteria of glacial lakes. A lake that is to be considered a glacial lake must satisfy the following conditions: (1) the area of the glacial lake must be greater than or equal to 0.0036 km2; that is, the smallest measurement unit of a glacial lake was set to four pixels; (2) the glacial lakes considered in our study should be within 10 km of the selected glacier outlines; and (3) when comparing the glacial lake remote sensing interpretation marks while extracting the glacial lake boundaries, all glacial lake boundaries should be as close as possible to the pixel contour line. In our study, the lakes that satisfied all the conditions mentioned above were recorded as glacial lakes.
3.2.2. Accuracy Assessment
The glacial lake extraction errors analyzed in this study mainly resulted from the visual interpretation process, including the quality of Landsat images (such as their spatial resolution, cloud coverage, temporal resolution, and mountain shadows) and the subjective judgment of the interpreter [66,67]. Therefore, we had to carry out corresponding error assessment work. We mainly considered the relationship between the area of a glacial lake and the spatial resolution of the image using the method proposed by Hanshaw and Bookhagen [68]. They assumed that the error in a glacial lake area caused by the manual interpretation process conforms to a Gaussian distribution; thus, the area error can be calculated by counting the number of pixels around the edge of each glacial lake. The relevant equation is as follows [68]:
where Error(1σ) is the area error of a single glacial lake (km2), G is the spatial resolution of the relevant Landsat image (here, G is 30 m), P is the perimeter of a single glacial lake (m), 0.6872 is the correction coefficient (that is, approximately 69% of peripheral pixels are subjected to area errors), E is the relative error of a single glacial lake, and A is the total area of a single glacial lake. Then, we calculated the accumulated area error within the study area in the study period (1990–2020) based on the error propagation theory; the formula is as follows:
where ET is the combined area error of all glacial lakes in the study area during the study period, i is the serial number of the specific analyzed glacial lake in the study area, and a is the area error of the single glacial lake.
Table 1 shows the area error and average relative error of all glacial lakes identified in the HKH-TMHA region from 1990 to 2020. We found that the relative error of the glacial lakes in the HKH-TMHA region ranged from 1.10% to 68.73%, and glacial lakes of different sizes had different relative errors. When the areas of glacial lakes were <0.01 km2, 0.01–005 km2, 0.05–0.1 km2, 0.1–0.5 km2, 0.5–1 km2, 1–5 km2, 5–10 km2, and >10 km2, the relative error ranges were 41.89–68.73%, 18.48–54.65%, 13.08–33.97%, 6.73–35.15%, 5.08–14.70%, 2.17–10.66%, 1.90–5.28%, and 1.10–4.26%, respectively. We found that the relative error of the glacial lakes decreased as the area of the glacial lakes increased. Then, we fitted the relative error of the glacial lakes to the area of each lake and found an exponential relationship between these variables (Figure 3).

Table 1.
Glacial lake area errors and average relative errors in the HKH-TMHA region from 1990–2020.

Figure 3.
Relationship between the areas and relative errors of glacial lakes.
In addition, we also carried out a comparative experiment to verify the lake-mapping capabilities based on our method with the object-oriented method by using Landsat TM, ETM+, and OLI and selected a local region and a single lake to display the extraction results of lake boundaries, respectively. From Figure 4, we found that the lake boundaries extracted by our method are almost indistinguishable from the actual lake boundaries, even better than the current mainstream object-oriented method. Therefore, compared with the object-oriented method, the method in our article can delineate the actual boundary of lakes more accurately. In Figure 5, we show the lake extraction results based on the three Landsat (TM, ETM+, and OLI) images using this method, and we can see that lakes mapped by this method have clear boundaries on the remote sensing images obtained by the three different sensors. That is, this method is suitable for the extraction of lakes from different series of Landsat images.

Figure 4.
Lake extraction results based on different methods: (a,d) True color image, (b,e) lake extraction results based on object-oriented method, (c,f) this method.
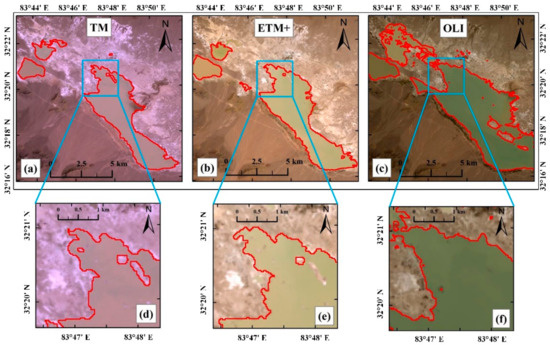
Figure 5.
Lake extraction results based on Landsat TM, ETM+, and OLI: (a,d) Lake extraction results based on Landsat TM, (b,e) Lake extraction results based on Landsat ETM+, (c,f) Lake extraction results based on Landsat OLI.
4. Results
4.1. Spatial Distribution of Glacial Lakes at Different Elevations
Simple normal distinctions were identified in the distributions of and changes in glacial lakes at different elevations over the entire HKH-TMHA range. In this study, the elevations of all glacial lakes were divided into eight sections at 500 m intervals. The eight elevation categories were 2000–2500 m, 2500–3000 m, 3000–3500 m, 3500–4000 m, 4000–4500 m, 4500–5000 m, 5000–5500 m, and above 5500 m; then, we counted the number and area of glacial lakes in these different elevation categories in the entire HKH-TMHA region and in other subregions. Regarding the entire HKH-TMHA region, the glacial lakes in this region were mainly distributed between 4000 m and 5500 m a.s.l. In the past 30 years (from 1990–2020), the area and number of the mapped glacial lakes ranging in elevation from 4000 m to 5500 m accounted for more than 83% of the identified lakes and exhibited a “three-peak” distribution pattern, while the peak elevation range in glacial lakes identified in 2020 was 4500–5000 m (Figure 6).
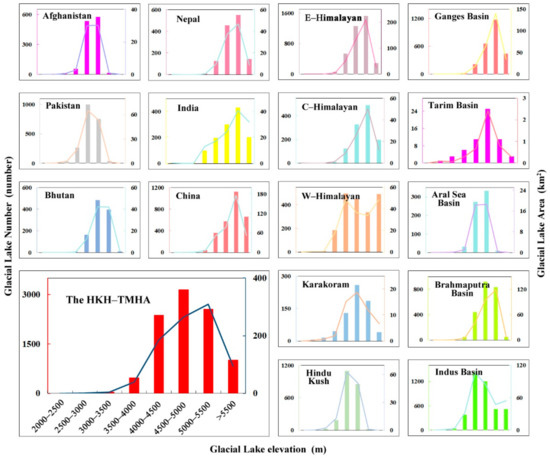
Figure 6.
Elevational distribution of glacial lakes in the analyzed mountains, countries, and basins in 2020 (here, histograms represent glacial lake number, and solid line charts represent glacial lake area; the values of the x axis are 2000–2500, 2500–3000, 3000–3500, 3500–4000, 4000–4500, 4500–5000, 5000–5500, and >5500 m from left to right, respectively.).
Figure 6 shows that in 2020, glacial lakes in different regions across the entire HKH-TMHA region showed different elevational distributions, while the number and area of lakes showed similar distribution patterns in specific regions. In the Eastern and Central Himalayan, the number of glacial lakes maintained a consistent spatial contribution among different elevation ranges, and glacial lakes were mainly distributed above 4000 m, with a peak elevation range of 5000–5500 m. The number and area of glacial lakes in the Western Himalayan showed a “bimodal” distribution pattern; the majority of glacial lakes were distributed in the elevation zone from 4000 m to 4500 m and above 5500 m. The glacial lakes in the Hindu Kush and Karakoram ranges both exhibited “single-modal” distributions; the peak elevation interval of the former mountain range was 4000–4500 m, and that of the latter mountain range was 4500–5000 m. Among the seven countries within the HKH-TMHA range, including China, Pakistan, India, Tajikistan, Afghanistan, Nepal, and Bhutan, almost no glacial lakes were identified within the region of Tajikistan. Among the other six countries, China had the largest number of glacial lakes, and the glacial lakes in this country were mainly distributed at elevations of 5000–5500 m. In 2020, the number and area of glacial lakes in this region accounted for 28.1 and 43.6%, respectively, of the overall number and area of glacial lakes. In addition, the glacial lakes of Nepal and India were mostly located between 5000 m and 5500 m in elevation. Bhutan had the lowest proportion of glacial lakes, accounting for 11.01% of the number and 10.93% of the area of glacial lakes; in this country, glacial lakes were mostly distributed between elevations of 4500 m and 5000 m, similarly to Afghanistan. Second only to China, Pakistan had 2097 (140.95 km2) glacial lakes in 2020, most of which lied within the elevation interval of 4000–4500 m. Among all the basins spanned by the HKH-TMHA region, glacial lakes were mainly distributed in the Indus Basin in 2020, followed by the Brahmaputra Basin, while the Tarim Basin contained the fewest glacial lakes (apart from the Hamun Basin). The number and area of glacial lakes in these five basins all presented single-peak elevational distribution patterns.
The glacial lake changes also exhibited elevational distribution differences in the HKH-TMHA region from 1990 to 2020 (Figure 7). None of the glacial lakes within the 2000–2500 m elevation range increased in area, while the glacial lake areas in the other seven elevation ranges all positively increased. The maximum expansion frequency of glacial lakes was observed at elevations between 4000 m and 5500 m. The total number of glacial lakes increased by 4948 from 1990 to 2020, and the elevation range corresponding to the peak increase was 4500–5000 m; in this interval, the number of glacial lakes increased by 1922 (accounting for 38.84% of the total number). The zone in which the greatest glacial lake area increase occurred was between 5000 m and 5500 m; these lakes expanded a total of 138.45 km2 over the 30 years of study.

Figure 7.
Changes in the number and area of glacial lakes at different elevations in the HKH-TMHA region from 1990 to 2020. (a) number, (b) area.
4.2. Spatial Distributions of Glacial Lakes in Various Size Classes
The sizes (referring to the area of individual glacial lakes) of the glacial lakes in the HKH-TMHA region were all greater than 0.0036 km2 (four pixels). In our study, we classified glacial lakes into eight different size categories (<0.01 km2, 0.01–0.05 km2, 0.05–0.1 km2, 0.1–0.5 km2, 0.5–1 km2, 1–5 km2, 5–10 km2, and >10 km2) according to the order of the glacial lake area from small to large. In the entire HKH-TMHA region, most glacial lakes were greater than 0.01 km2 and less than 0.5 km2 in size (the number of lakes within this size range accounted for 95.21% of the overall lake number, and the total area of these lakes accounted for 63.01% of the total lake area). Figure 8 shows the distribution characteristics of glacial lakes with different sizes in each region in the HKH-TMHA region in 2020. It can be seen that the number of glacial lakes with sizes between 0.01 km2 and 0.05 km2 was the largest in 2020, at 5659 lakes, while glacial lakes within the range of 0.1–0.5 km2 contributed most to the total area of glacial lakes (at 305.49 km2). Moreover, we found that the size of glacial lakes gradually decreased with increasing altitude except for individual glacial lakes with an area larger than 10 km2. Here, we believe that the higher the altitude, the lower the temperature; thus, the water bodies mostly exist in the form of glaciers, ice, and snow.
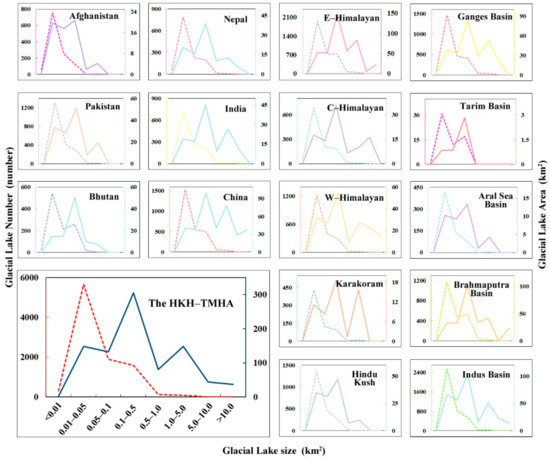
Figure 8.
Distribution of glacial lakes of different sizes in the mountains, countries, and basins in the study area in 2020 (here, dotted line charts represent glacial lakes number, and solid line charts represent glacial lakes area; the values of the x axis are <0.01, 0.01–0.05, 0.05–0.1, 0.1–0.5, 0.5–1.0, 1.0–5.0, 5.0–10.0 and >10.0 km2 from left to right, respectively).
Similarly, regional differences in the number and area of glacial lakes were identified, and glacial lakes of different sizes in different HKH-TMHA regions in 2020 had different spatial distribution patterns. The sizes of the glacial lakes with the greatest numbers in the Hindu Kush, Karakoram, Eastern Himalayan, Central Himalayan, and Western Himalayan regions all ranged from 0.01 km2 to 0.05 km2, and in each region, these lakes accounted for 61.68%, 63.53%, 53.44%, 59.62%, and 62.0% of the overall number of lakes. The sizes of the most common glacial lake area in the five mountains ranged from 0.1–0.5 km2; among them, the greatest concentration of glacial lakes was found in the Eastern Himalaya. The number of glacial lakes in this region was 1957 (accounting for 53.44% of the total number), and the cumulative area of these lakes was 52.67 km2 (accounting for 12.44% of the total area). Most glacial lakes within each country were concentrated within the 0.01–0.05 km2 size range, and the distribution characteristics of the number of glacial lakes of different sizes in Nepal, Pakistan, India, and China were almost the same. Glacial lakes larger than 5 km2 in area were found in single digits in these countries or even not at all. In addition, all countries had the most glacial lakes with areas in the range of 0.1–0.5 km2, while the total glacial lake size (0.01–0.05 km2) in Afghanistan was the second largest due to the number of glacial lakes within this interval in Afghanistan being relatively large. The total area of glacial lakes in all countries was the lowest in the interval in which the single-glacial-lake size was smaller than 0.01 km2. The spatial distribution of glacial lakes of various size classes in the five basins presented approximately the same patterns as those found in the countries. Therefore, we found that the distribution characteristics of glacial lakes with different sizes in 2020 in different mountains, different countries, and different basins were quite similar. The number and area of glacial lakes were mainly concentrated within the ranges of 0.01–0.05 km2 and 0.1–0.5 km2, respectively, and only slight differences in the corresponding proportions were found.
The glacial lakes of different sizes in the HKH-TMHA region experienced widespread number and area changes from 1990–2020 (Figure 9). Except for glacial lakes with area larger than 10 km2, the number and area of glacial lakes of other sizes all increased. The number of glacial lakes with sizes between 0.01 km2 and 0.05 km2 increased the most during the study period, with an overall increase in the number of lakes of 3804 and a total lake area increase of 95.7 km2; the fastest growth rate during the study period was identified from 1990–1995, during which time the number of glacial lakes increased by 1179 (and the total area increased by 31.9 km2). Glacial lakes with sizes ranging from 0.1–0.5 km2 increased the most; the total area of these glacial lakes increased by 141.38 km2, and the number increased by 745 during the study period. Over the last 30 years, only the area of glacial lakes larger than 10 km2 decreased, while the area of glacial lakes of other sizes either increased or remained stable.

Figure 9.
Changes in the number and area of glacial lakes of different sizes in the HKH-TMHA region from 1990 to 2020. (a) number, (b) area.
4.3. Spatial Distribution of Glacial Lakes with Different Terrain Aspects
In this work, glacial lakes were found to often form on slopes between 0° and 5° [69] and had approximately the same aspect as the terrain in which they were located. We divided the terrain aspects of glacial lakes into eight clockwise directions: north, northeast, east, southeast, south, southwest, west, and northwest. Figure 10 presents the distribution of (Figure 10c,d) and changes in (Figure 10a,b) glacial lakes with different aspects in the HKH-TMHA region from 1990 to 2020. We found that in each study period from 1990–2020, the glacial lakes with the largest number and area always faced south, and the average number of south-aspect glacial lakes in each period accounted for 38.64% of the total number of glacial lakes. The south aspect was followed by southwest-aspect glacial lakes and southeast-aspect glacial lakes, with average proportions of 24.03% and 20.36%, respectively. North-aspect glacial lakes were fewer in number, with the average number of north-facing glacial lakes accounting for only 0.08% of the total number of glacial lakes. In terms of glacial lake area, all glacial lakes in the HKH-TMHA region were mainly oriented to the south, followed by the southeast and the southwest, and the average area proportions of these glacial lakes area were 58.83%, 18.87%, and 15.83%, respectively. Aspects with lower average glacial lake proportions included the north, northwest, and northeast, with proportions of 0.02%, 0.41%, and 0.42%, respectively. The study also counted the number and area of glacial lakes facing different directions in the different mountains, basins, and countries within the study area and found that the distribution trends of the glacial lake number and area in each direction were roughly the same as the distribution trends found in the entire HKH-TMHA region.

Figure 10.
Distribution of glacial lakes with different terrain aspects in the HKH-TMHA region from 1990 to 2020: (a) Glacial Lake Number in 1990–2020, (b) Glacial Lake Area in 1990–2020, (c) Glacial Lake Number Change from 1990 to 2020, (d) Glacial Lake Area Change from 1990 to 2020.
Over the past 30 years, the number and area of glacial lakes with different orientations in the HKH-TMHA showed increasing trends. Specifically, the number of south-aspect and southeast-aspect glacial lakes increased by 1894 (accounting for 31.76% of the total number) and 1733 (29.06% of the total number), respectively (Figure 10c,d). The largest increases in glacial lake area were found for the southeast aspect and east aspect, with increases of 168.18 km2 (accounting for 41.15% of the total area) and 79.5 km2 (19.45% of the total area), respectively. Smaller increases were found for north-facing glacial lakes, with the number and area of these glacial lakes increasing by only 19 and 0.87 km2, respectively.
4.4. Distribution of and Changes in Glacial Lakes in the HKH-TMHA Region between 1990 and 2020
Across the glacial lake inventory of the entire HKH-TMHA region, the number and area of the glacial lakes can be seen to have increased continuously from 1990 to 2020 (Figure 11 and Figure 12). The number (area) of glacial lakes were 3699 (490.73 ± 54.80 km2), 5835 (664.84 ± 89.72 km2), 6880 (713.48 ± 78.60 km2), 7319 (751.48 ± 94.72 km2), 7739 (791.13 ± 99.71 km2), 8205 (806.13 ± 105.63 km2), and 9673 (899.66 ± 120.63 km2) in 1990, 1995, 2000, 2005, 2010, 2015, and 2020, respectively. Among these increases, glacial lakes experienced the largest widespread expansion from 1990 to 1995; during the period, the number of glacial lakes increased by 2136 (57.75%), and the area of glacial lakes increased by 174.11 km2 (35.48%). The second-largest increase occurred from 2015–2020, when the number and area of glacial lakes increased by 1468 (17.89%) and 93.54 km2 (11.6%), respectively. The smallest increase in the area of glacial lakes was observed between 2010 and 2015, when the area of glacial lakes increased by only 15 km2 (1.9%), and the period from 2005–2010 showed the smallest increase in the number of glacial lakes, with an increase of only 420 (5.74%) glacial lakes. To quantitatively describe the observed changes in glacial lakes in the study area, we used two indicators: the percentages of area change (PAC) and the annual percentage of area change (APAC) (Table 2). Table 2 shows that from 1990–1995, glacial lakes in the study area changed most rapidly, with a PAC of 35.48% and an APAC of 6.26%. From 2010–2015, the APAC of glacial lakes was smallest (0.38%), and we believe that most glacial lakes expanding during this period were small in size.
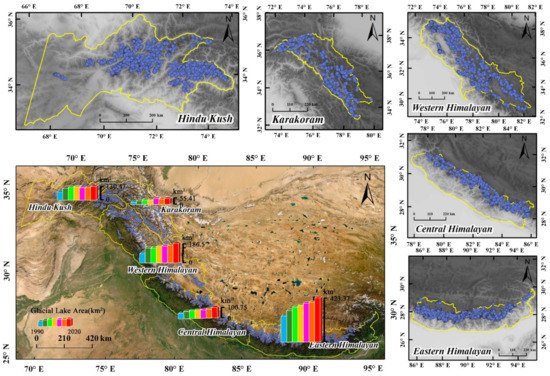
Figure 11.
Distribution of glacial lakes in 2020 and area change from 1990 to 2020 in five mountain ranges.
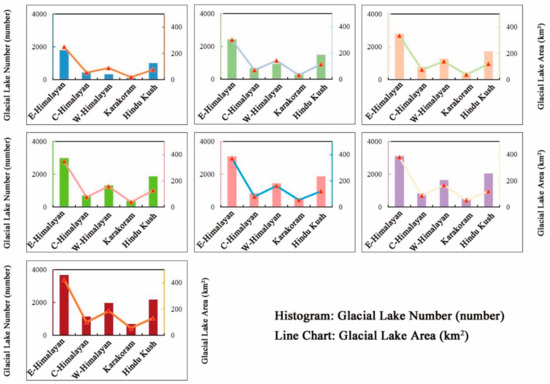
Figure 12.
Glacial lake histograms and line chart areas in five mountain ranges from 1990 to 2020.
Table 2.
PAC and APAC values of glacial lakes in each period from 1990 to 2020.
From the perspective of the spatial distribution of glacial lakes in the HKH-TMHA region, glacial lakes showed distinct spatial heterogeneity among the three mountain ranges of the HKH-TMHA region (Figure 13). Over the past 30 years, glacial lakes have been mainly distributed in the Himalayan, especially the Eastern Himalayan. In 2020, the area of glacial lakes in the Eastern Himalayan accounted for 37.86% of the total area of glacial lakes in the HKH-TMHA region, with 3662 glacial lakes with a total area of 423.37 ± 45.67 km2 (Table 3). Next, the area of glacial lakes in the Western Himalayan accounted for 20.73% (186.50 ± 24.68 km2) of the total area. There were 2192 (130.47 ± 27.34 km2) glacial lakes in the Hindu Kush, which accounted for 14.5% of the total glacial lake area in the HKH-TMHA region. The Central Himalayan had 1149 (85.01 ± 14.33 km2) glacial lakes, and the Karakoram had the sparsest concentration of glacial lakes, with a glacial lake area of only 55.41 ± 8.48 km2, accounting for only 7.03% of the total area.
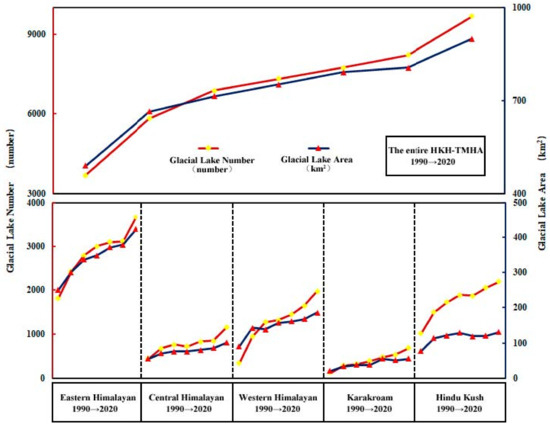
Figure 13.
Changes in glacial lake number and area in five mountain ranges from 1990 to 2020.
Table 3.
Number and area (km2) of glacial lakes in five mountain ranges from 1990 to 2020.
From the perspective of the change trends of glacial lakes, among the entire HKH-TMHA region, only the glacial lakes in the Eastern Himalayan experienced steady growth. The glacial lakes in the other four regions showed fluctuating growth trends. In the 1995–2000 period, the number of glacial lakes in the Western Himalayan increased by 337 (35.85%) (Table 4), while the area of glacial lakes in this region decreased by 4.58 km2 (−3.21%). The number of glacial lakes was reduced by 37 (−4.88%) and the area was reduced by 0.32 km2 (−0.42%) from 2000 to 2005 in the Central Himalayan. During the period from 2005–2010, the number of glacial lakes decreased by 10 (−0.53%) and their area decreased by 9.13 km2 (−7.11%) in the Hindu Kush. In Karakoram, the changes in the number and area of glacial lakes were not synchronized between 2010 and 2015; the number of glacial lakes increased by 56 (11.72%), while the area decreased by 4.81 km2 (−8.69%).
Table 4.
Number and area (km2) changes in glacial lakes in five mountain ranges from 1990 to 2020.
From the perspective of the change rate of glacial lakes, the change trends of glacial lakes in the Eastern Himalayan, Western Himalayan, and Hindu Kush were broadly similar over the past 30 years, while the growth rates of glacial lakes in the Central Himalayan and Karakoram were flat. The growth rates of the glacial lake area in the five mountains were 5.82 km2 per year (Eastern Himalayan), 3.27 km2 per year (Western Himalayan), 1.79 km2 per year (Hindu Kush), 1.57 km2 per year (Central Himalayan), and 1.18 km2 per year (Karakoram) in descending order. The average growth rate of the glacial lake area in the entire HKH-TMHA region was 13.63 km2 per year.
4.5. Climate Change Driving Glacial Lake Changes
Glacial lake changes are indicators of climate fluctuations and simultaneously produce feedback effects with climate change. Temperature and precipitation are the two main climatic factors that may influence changes in glacial lakes on the Tibetan Plateau [70,71,72]. In this study, we analyzed the temporal trends of the annual average daily precipitation, summer average daily precipitation, winter average daily precipitation, annual average daily temperature, summer average daily temperature, and winter daily average temperature over the entire HKH-TMHA region and in three mountain ranges from 1990 to 2020.
In general, the daily precipitation (annual average precipitation, summer average precipitation, and winter average precipitation) in the entire HKH-TMHA region and the three mountain ranges showed increasing trends based on CPC Global Precipitation gridded data (Figure 14) from 1990 to 2020, during which time consistent trends were maintained in the number and area of glacial lakes, and the summer daily precipitation was slightly higher than the annual daily precipitation, while the winter daily precipitation was lowest. We found inconsistent changes in precipitation in the three mountain ranges. The daily precipitation decreased in northwestern Karakoram, southeastern Western Himalayan, and the central Eastern Himalayan from 1990 to 2020 except in winter. The key driving factor was the weakening of the Indian monsoon [5,73], while the daily precipitation in the other regions increased (Figure 15). In total, the annual daily precipitation increased by 0.8544 mm, the summertime daily precipitation increased by 1.0766 mm, and the winter daily precipitation increased by 0.8244 mm over the entire HKH-TMHA region over the 30 years of study.
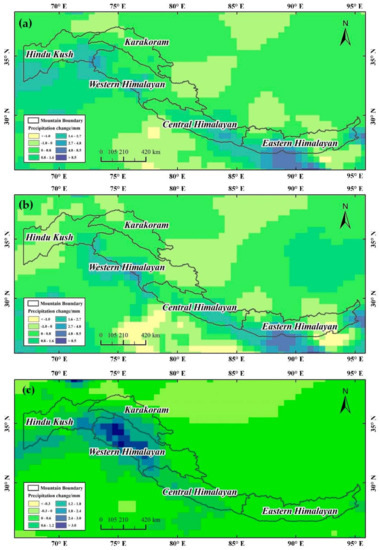
Figure 14.
Precipitation changes for in the HKH-TMHA region: (a) changes in annual daily precipitation, (b) changes in summertime daily precipitation, and (c) changes in wintertime daily precipitation.
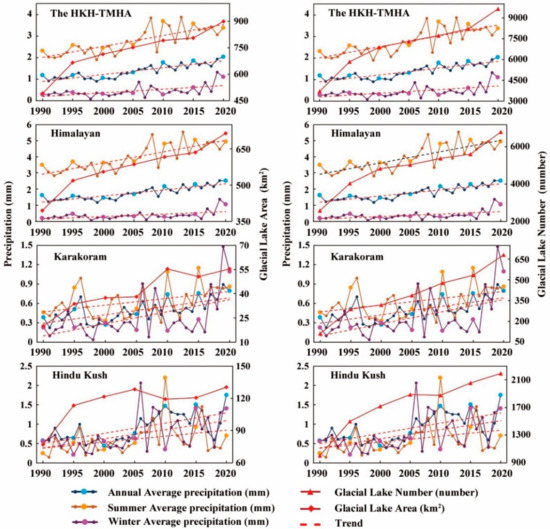
Figure 15.
Time series of daily average precipitation.
In the study area, the mean warming rate was 1.0311 °C/30a, the summertime warming rate was 0.8346 °C/30a, and the wintertime warming rate was –0.1042 °C/30a; in contrast, in the Karakoram, the temperature decreased by 0.9614 °C/30a in summer, while the temperature in the other mountain ranges all increased, especially in the Eastern Himalayan (Figure 16). The temperature in the three mountain ranges were also quite different (Figure 17); Karakoram had the lowest temperature (−12.4283 °C in 2020), while the temperature of the Hindu Kush was highest (3.0239 °C in 2020). It is worth mentioning that the spatial variations in temperature in these three mountains presented the same trends no matter whether the year, summer, or winter was considered.
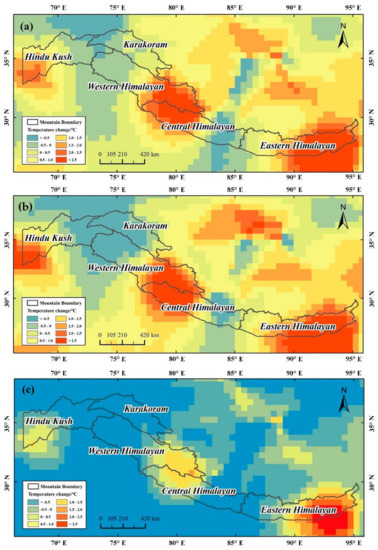
Figure 16.
Temperature changes in the HKH-TMHA region: (a) changes in the annual daily temperature, (b) changes in the summertime daily temperature, and (c) changes in the wintertime daily temperature.
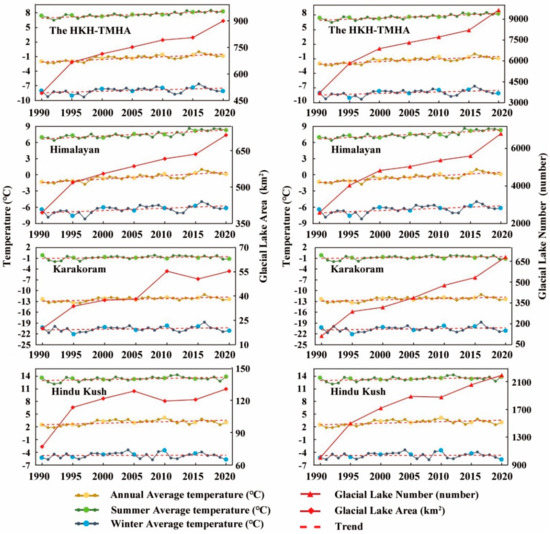
Figure 17.
Time series of daily average temperatures.
Thus, we believe that these temperature rises contributed to the expansion of glacial lakes more than the increased precipitation in the Himalayan, especially in the Eastern Himalayan, and this has been reported in many previous studies [42,74]. Temperature and precipitation were also the main factors controlling glacial lake changes in other regions of the HKH-TMAH region.
5. Discussion
5.1. Glacial Lake Changes and Glaciers
The spatial distribution and dynamic changes in glaciers play primary roles in the evolution of glacial lakes [75,76], which in this work, were limited to glacier-fed lakes, especially small glacial lakes. Non-glacier-fed lakes are mainly influenced by regional precipitation, temperature, evapotranspiration, and human factors and are not restricted by glacier changes [77]. Recent research results have shown that during the 1960–2010 period, the area of glaciers in the high-mountain regions of Asia presented a retreating trend with a relatively slow retreat rate of only 0.54%/year [78]. Since the 1990s, the retreat rate of glaciers in different mountain ranges has accelerated significantly [79], and during the same period, researchers have found that the number and area of glacial lakes have increased rapidly [5,9,43,80]. For example, related studies have pointed out that the area of the Ngozumpa glacial lakes in the Himalayan in Nepal had been expanding at a rate of 10% per year since 2001 and reached a total area of 0.3 km2 in 2009; these researchers stated that the main reason for this rapid expansion of glacial lakes was the rapid melting and retreat of glaciers and the break-up of glacial ice tongues [81]. In 2010, glacial lakes directly supplied by modern glacial meltwater in the high-mountain Asia region accounted for 78% of all glacial lakes and 83% of the total area of all glacial lakes [43,82]. Thus, glaciers are the leading factor affecting changes in glacial lakes, and these factors are mutually restrictive.
5.2. Glacial Lakes, Water Resources and Disasters
The majority of glacial lake water bodies come from glacial meltwater. In the context of global warming, glaciers have continued to shrink, and glacial lakes have shown an areal expansion and water level rise trends due to the continuous injection and retention of glacial meltwater. In fact, this process has reduced the water resource losses caused by glacial melting to a certain extent, as this water is temporarily stored in glacial lakes, thus adjusting the cyclic process of glacier water resources in alpine regions. Therefore, glacial lakes are also a special kind of important freshwater resource. Wang et al. [83] summarized the impacts of glacial meltwater on the hydrological effects of glacial lakes in the mountainous cryosphere and found that glacial meltwater is retained in glacial lakes to some extent and that this impeded the loss of regional glacier water resources.
However, glacial lakes are not only a water source but also a source of several natural disasters, such as flash floods and debris flow hazards. Due to the consequential melting of glaciers in recent years, the number of glacial lakes has continued to increase, and the area of these lakes has expanded rapidly. The accumulating water makes it difficult to sustain the considerable increasing water volume for with regards to the structure and soil conditions of the original glacial lakes, and this may cause GLOFs. Relevant investigation results have shown that since the 20th century, 37 GLOFs have been observed in 33 glacial lakes in Tibet [84]. In 1954, the Sangwang Co outburst in Kangmar County caused serious losses in Gyangze County and Shigatse City; more than 20,000 people were affected, and 400 people died in total [85]. During our study period, from 2000–2010, the highest incidence of GLOFs was observed in Tibet, with a total of nine GLOFs. For example, on 5 July 2013, the Ranzerancuo Lake burst due to persistent high temperatures and heavy rainfall [85]. A latest review showed that since the 20th century, a total of 277 GLOFs have occurred in high-mountain Asia [86]. Therefore, as sudden, large-scale, and destructive natural disasters, GLOFs often cause heavy losses of life and property in downstream areas and people and have thus become a popular issue of concern among researchers.
5.3. Comparisons with Recent Related Studies
Many long-term glacial lake investigations have been conducted in high-mountain Asia and in other mountainous regions of the world, but these studies rarely consider entire mountain ranges and often focus on short study periods. Table 5 provides a list of references that address the issue of glacial lake research in high-mountain regions.
Table 5.
Previous glacial lake studies conducted in high-mountain regions.
Glacial lake inventories of HMA were created by Chen et al. [44], Wang et al. [46], and Zhang et al. [42]. The coverage extents of the study regions considered in these works were similar, and the study periods overlapped, but their results were different. A total glacial lake area of 1635.94 km2 was recorded by Chen et al. [44] in 2017, an area of 2080.12 ± 2.28 km2 was reported by Wang et al. [46] in 2018, and an area of 1577.38 ± 288.82 km2 was found by Zhang et al. [42] in 2016. Chen et al. [77] and Zhang et al. [42] set the minimum glacial lake area to 0.0081 km2, while Wang et al. [46] set the minimum area to 0.0054 km2. Therefore, Wang et al. [46] obtained a larger overall glacial lake area. In addition, they recorded glacial lakes in the same buffer zone as that considered herein (within 10 km of modern glacial-covered areas).
The Third Pole and HKH are also hotspots for glacial lake research. Zhang and Yao et al. [43] mapped glacial lakes in the Third Pole in 1990, 2000, and 2010 and found that glacial lakes (>0.003 km2) covered areas of 553.9 ± 90, 581.2 ± 97, and 682.4 ± 110 km2, respectively, in these years. Maharjan et al. [45] extracted glacial lakes in a similar region of the HKH in 2005; they also set 0.003 km2 as the minimum glacial lake area and reported that the total area covered by these glacial lakes was 1444 km2. The glacial lake area of Maharjan et al. [45] in 2005 was larger than that of Zhang and Yao et al. [43] in 2010, possibly because of their different glacial lake inventory extents, extraction methods, and human subjective factors.
From the comparisons above, it is worth noting that the methods used to determine glacial lake boundaries are still controversial. The minimum glacial lake area and inventory extent are the main bases researchers refer to, and researchers delineate glacial lakes according to their research purposes and understandings. Therefore, even in the same region, different glacial lake areas can be reported during the same period. Thus, it is urgent to determine a standard for delineating the boundaries of glacial lakes, and this will be the focus of future research work.
5.4. Factors Influencing Lake Extraction in This Study
Due to the particularity of the geographic environment where glacial lakes are located, it is more difficult to extract glacial lake from images than ordinary lakes; for that, there are many factors, such as hill shade, ice-snow, clouds, etc., can interfere with the extraction of glacial lakes.
In our study, during the process of mapping the glacial lakes, we also encountered particular problems, which may influence lake extraction. For the image data we used, its acquisition time, sensors, and cloud cover all contribute to lake mapping. Glacial lakes show different states on remote sensing images of different times, which increases the difficulty of glacial lake extraction; researchers will try to select images when the state of the glacial lake is relatively stable for mapping, and here, the selected images were between June and November. Our study used images obtained by Landsat TM, ETM+, and OLI, and glacial lakes present different spectral characteristics on the three images, making the optimal thresholds for lake extraction different. In addition, we selected images with less than 10% cloud cover. For the ASTER GDEM, which is really a multi-temporal product. Thus, the terrain parameters derived from DEM cannot represent the real-time topography in our study area because those will change over time. However, the terrain changes very slowly [90,91,92], and the changes are limited, which could also bring limited uncertainty about the extraction of the glacial lake. For the method we used in the data processing step, we did not radiometrically calibrate our data, which mainly can cause slight differences in the optimal threshold and then may bring slight mapping errors. The function of radiation calibration is to eliminate the error of the sensor itself and convert the recorded DN value into the Top of Atmosphere Reflectance (TOA), which can reflect the true spectral characteristics of ground features. All in all, we should not neglect this and should pay attention to every process in future research work. In the lake extraction step, we removed part of the effect of hill shading on lake extraction as much as possible by using hill shade. For this part, we should pay attention to the cast shadow and umbra, as both of them compromise terrain shadow. Their formation mechanism and condition are different, which may have different effects on glacial lake extraction. Therefore, in our future research, we can regard this as a research key point to improve and optimize the glacial lake extraction method.
6. Conclusions
In this study, we obtained the most recent complete inventory of glacial lakes in the HKH-TMHA region from 1990 to 2020 based on Landsat images with a combination of automatic and visual interpretation method. Additionally, the spatial heterogeneity of the number and area of glacial lakes in the entire HKH-TMHA region were revealed from several perspectives.
The results showed that glacial lakes with sizes between 0.01 km2 and 0.05 km2 in the study area accounted for 55% of the total number of glacial lakes in each study period on average, and the average percentage of glacial lakes with areas of 0.1–0.5 km2 was the largest, accounting for 34.8% of the total glacial lake area. Almost one-third of the glacial lakes in the HKH-TMHA region were located at elevations from 4500 m–5000 m, and we found that glacial lakes expanded to higher-elevation regions (above 4000 m a.s.l.) throughout the study period. Additionally, the aspects of glacial lakes with the largest number and area were always south, and this type of glacial lake increased the most from 1990 to 2020. Moreover, the glacial lakes in the HKH-TMHA region experienced rapid expansion between 1990 and 2020; glacial lakes increased from 5835 (664.84 ± 89.72 km2) in 1990 to 9673 (899.66 ± 120.63 km2) in 2020 and there were 5974 (408.93 km2) totally increased glacial lakes. During the study period, glacial lakes were mainly concentrated in the Eastern Himalayan, the Chinese region of the study area and the Indus Basin. Then, climate change in this study was also analyzed, and we believe that temperature rises contributed to the expansion of glacial lakes more than the increased precipitation. In addition, glaciers, water resources, and disasters were all discussed, and we believe that all of the factors mentioned are related to glacial lake changes. Moreover, we concluded the factors during lake extraction in our study, all of which influence the mapping process.
In this research, we obtained the newest glacial lake inventory of the HKH-TMHA region, and these results can provide basic data and scientific references for related research on GLOFs and water resource monitoring.
Author Contributions
Conceptualization, W.L., W.W. and X.G.; methodology, W.L., X.W. and W.W.; data processing, W.L. and R.W.; experiment and analysis, W.L. and X.W.; writing, W.L. and W.W.; funding acquisition, X.G., X.W. All authors contributed to the editing and reviewing of this manuscript. All authors have read and agreed to the published version of the manuscript.
Funding
This research was funded by the Strategic Priority Research Program (Class A) of the Chinese Academy of Sciences, grant number XDA23090503; Research on Ice-Snow Damage Assessment of Forest Vegetation in Northern Guangxi based on GIS and RS, grant number 2022KY0382.
Institutional Review Board Statement
No applicable.
Informed Consent Statement
No applicable.
Data Availability Statement
The data presented in this study are available on request from the corresponding author.
Acknowledgments
The authors wish to thank the editor of this journal, anonymous reviewers during the revision process and all the authors contributed to this article.
Conflicts of Interest
The authors declare no conflict of interest.
References
- Harrison, S.; Kargel, J.S.; Huggel, C.; Reynolds, J.; Shugar, D.H.; Betts, R.A.; Emmer, A.; Glasser, N.; Haritashya, U.K.; Klimeš, J.; et al. Climate change and the global pattern of moraine-dammed glacial lake outburst floods. Cryosphere 2018, 12, 1195–1209. [Google Scholar] [CrossRef] [Green Version]
- Yao, T. Glacial fluctuations and its impacts on lakes in the southern Tibetan Plateau. Chin. Sci. Bull. 2010, 55, 2071. [Google Scholar] [CrossRef] [Green Version]
- Dahe, Q.; Cunde, X.; Yongjian, D.; Tandong, Y.; Lingen, B.; Jiawen, R.E.N.; Ninglian, W.; Shiyin, L.; Lin, Z. Progress on cryospheric studies by international and Chinese communities and perspectives. J. Appl. Meteor. Sci. 2006, 17, 649–656. [Google Scholar]
- Wang, Z.T.; Su, H.C. Glaciers in the world and china: Distribution and their significance as water resources. J. Glaciol. Geocryol. 2003, 25, 498–503. [Google Scholar]
- Wang, W.; Xiang, Y.; Gao, Y.; Lu, A.; Yao, T. Rapid expansion of glacial lakes caused by climate and glacier retreat in the Central Himalayas. Hydrol. Proc. 2015, 29, 859–874. [Google Scholar] [CrossRef]
- Immerzeel, W.W.; Kraaijenbrink, P.D.; Shea, J.M.; Shrestha, A.B.; Pellicciotti, F.; Bierkens, M.F.; de Jong, S.M. High-resolution monitoring of Himalayan glacier dynamics using unmanned aerial vehicles. Remote Sens. Environ. 2014, 150, 93–103. [Google Scholar] [CrossRef]
- Gärtner-Roer, I.; Nussbaumer, S.U.; Hüsler, F.; Zemp, M. Worldwide Assessment of National Glacier Monitoring and Future Perspectives. Mt. Res. Dev. 2019, 39, 1–11. [Google Scholar] [CrossRef]
- Zemp, M. Glacier monitoring tracks progress in limiting climate change. Nature 2019, 576, 39. [Google Scholar] [CrossRef] [Green Version]
- Gardelle, J.; Arnaud, Y.; Berthier, E. Contrasted evolution of glacial lakes along the Hindu Kush Himalaya mountain range between 1990 and 2009. Glob. Planet. Chang. 2011, 75, 47–55. [Google Scholar] [CrossRef] [Green Version]
- WGMS. Fluctuations of Glaciers 2000–2005, Volume IX. ICSU (FAGS)/IUGG (IACS)/UNEP/UNESCO/WMO; World Glacier Monitoring Service: Zurich, Switzerland, 2008. [Google Scholar]
- Zemp, M.; Hoelzle, M.; Haeberli, W. Six decades of glacier mass-balance observations: A review of the worldwide monitoring network. Ann. Glaciol. 2009, 50, 101–111. [Google Scholar] [CrossRef] [Green Version]
- Kulkarni, A.V.; Rathore, B.P.; Alex, S. Monitoring of glacial mass balance in the Baspa basin using accumulation area ratio method. Curr. Sci. 2004, 86, 185–190. [Google Scholar]
- Lutz, A.F.; Immerzeel, W.W.; Shrestha, A.B.; Bierkens, M.F.P. Consistent increase in High Asia’s runoff due to increasing glacier melt and precipitation. Nat. Clim. Chang. 2014, 4, 587–592. [Google Scholar] [CrossRef] [Green Version]
- Zhang, Y.; Liu, S.Y.; Wang, X. A dataset of spatial distribution of degree-day factors for glaciers in High Mountain Asia. China Sci. Data 2019, 4, 141–151. [Google Scholar]
- Huggel, C.; Kääb, A.; Schneider, J.F. Climate and Geomorphic Risks in High-Mountain Environments: Glacier Hazards, Permafrost Hazards, and Glacier Lake Outburst Floods in Mountain Areas: Processes, Assessment, Prevention, Mitigation; Vienna, Austria, 10–13 November 2009. Eos 2010, 91, 103. [Google Scholar] [CrossRef] [Green Version]
- Wang, X.; Liu, S.; Ding, Y.; Guo, W.; Jiang, Z.; Lin, J.; Han, Y. An approach for estimating the breach probabilities of moraine-dammed lakes in the Chinese Himalayas using remote-sensing data. Nat. Hazards Earth Syst. Sci. 2012, 12, 3109–3122. [Google Scholar] [CrossRef] [Green Version]
- Rundquist, D.C.; Lawson, M.P.; Queen, L.P.; Cerveny, R.S. The relationship between summer-season rainfall events and lake-surface area1. Jawra J. Am. Water Resour. Assoc. 1987, 23, 493–508. [Google Scholar] [CrossRef]
- Racoviteanu, A.E.; Arnaud, Y.; Williams, M.W.; Ordoñez, J. Decadal changes in glacier parameters in the Cordillera Blanca, Peru, derived from remote sensing. J. Glaciol. 2008, 54, 499–510. [Google Scholar] [CrossRef] [Green Version]
- Watanabe, T.; Lamsal, D.; Ives, J.D. Evaluating the growth characteristics of a glacial lake and its degree of danger of outburst flooding: Imja Glacier, Khumbu Himal, Nepal. Nor. Geogr. Tidsskr. Nor. J. Geogr. 2009, 63, 255–267. [Google Scholar] [CrossRef]
- Allen, S.; Owens, I.; Sirguey, P. Satellite remote sensing procedures for glacial terrain analyses and hazard assessment in the Aoraki Mount Cook region, New Zealand. N. Z. J. Geol. Geophys. 2008, 51, 73–87. [Google Scholar] [CrossRef] [Green Version]
- Yang, C.D.; Wang, X.; Wei, J.F.; Liu, S.Y. A dataset of glacial lake inventory of West China in 2015. Chin. Sci. Data 2018, 3, 36–44. [Google Scholar]
- Doxaran, D.; Froidefond, J.-M.; Lavender, S.; Castaing, P. Spectral signature of highly turbid waters: Application with SPOT data to quantify suspended particulate matter concentrations. Remote Sens. Environ. 2002, 81, 149–161. [Google Scholar] [CrossRef]
- Frohn, R.C.; Henneth, K.M.; Eisner, W.R. Satellite remote sensing classification of thaw lakes and drained thaw lake basins on the North Slope of Alaska. Remote Sens. Environ. 2005, 97, 116–126. [Google Scholar] [CrossRef]
- McFeeters, S.K. The use of the Normalized Difference Water Index (NDWI) in the delineation of open water features. Int. J. Remote Sens. 1996, 17, 1425–1432. [Google Scholar] [CrossRef]
- Bhardwaj, A.; Singh, M.K.; Joshi, P.K.; Singh, S.; Sam, L.; Gupta, R.D.; Kumar, R. A lake detection algorithm (LDA) using Landsat 8 data: A comparative approach in glacial environment. Int. J. Appl. Earth Obs. Geoinf. 2015, 38, 150–163. [Google Scholar] [CrossRef]
- Frey, H.; Huggel, C.; Paul, F.; Haeberli, W. Automated detection of glacier lakes based on remote sensing in view of assessing associated hazard potentials. Grazer Schr. Der Geogr. Und Raumforsch. 2010, 45, 261–272. [Google Scholar]
- Mitkari, K.V.; Arora, M.K.; Tiwari, R.K. Extraction of Glacial Lakes in Gangotri Glacier Using Object-Based Image Analysis. IEEE J. Sel. Top. Appl. Earth Obs. Remote Sens. 2017, 10, 5275–5283. [Google Scholar] [CrossRef]
- Xu, H. Modification of normalised difference water index (NDWI) to enhance open water features in remotely sensed imagery. Int. J. Remote Sens. 2006, 27, 3025–3033. [Google Scholar] [CrossRef]
- Wangchuk, S.; Bolch, T. Mapping of glacial lakes using Sentinel-1 and Sentinel-2 data and a random forest classifier: Strengths and challenges. Sci. Remote Sens. 2020, 2, 100008. [Google Scholar] [CrossRef]
- Belgiu, M.; Drăguţ, L. Random forest in remote sensing: A review of applications and future directions. ISPRS J. Photogramm. Remote Sens. 2016, 114, 24–31. [Google Scholar] [CrossRef]
- Zhang, M.M.; Zhao, H.; Chen, F.; Zeng, J.Y. Evaluation of effective spectral features for glacial lake mapping by using Landsat-8 OLI imagery. J. Mt. Sci. 2020, 17, 2707–2723. [Google Scholar] [CrossRef]
- Bulley, H.N.N.; Bishop, M.P.; Shroder, J.F.; Haritashya, U.K. Integration of classification tree analyses and spatial metrics to assess changes in supraglacial lakes in the Karakoram Himalaya. Int. J. Remote Sens. 2012, 34, 387–411. [Google Scholar] [CrossRef]
- Li, J.L.; Sheng, Y.W.; Luo, J.C. Automatic extraction of himalayan glacial lakes with remote sensing. J. Remote Sens. 2011, 15, 29–43. [Google Scholar]
- Li, Y.C.; Zhang, J.; Liu, C.L. Extraction method of alpine small glacial lake in Qianhu Mountain area of Yunnan province based on Sentinel-2 image. Sci. Cartogr. Geogr. 2021, 46, 114–120. [Google Scholar]
- Rounce, D.R.; Watson, C.S.; McKinney, D.C. Identification of hazard and risk for glacial lakes in the Nepal Himalaya using satellite imagery from 2000–2015. Remote Sens. 2017, 9, 654. [Google Scholar] [CrossRef] [Green Version]
- Liu, X.C.; Xiao, C.D. Preliminary Study of the Jiemayangzong Glacier and Lake Variations in the Source Regions of the Yarlung Zangbo River in 1974–2010. J. Glaciol. Geocryol. 2011, 33, 488–496. [Google Scholar]
- Li, Z.G.; Yao, T.D.; Ye, Q.H.; Tian, L.D.; Li, C.C. Monitoring glacial variations based on remote sensing in the Luozha region, eastern Himalayas, 1980–2007. Geogr. Res. 2011, 26, 836–846. [Google Scholar]
- Wang, X.; Liu, S.Y.; Yao, X.J.; Guo, W.Q.; Yu, P.C.; Xu, J.L. Glacier Lake Investigation and Inventory in the Chinese Himalayas Based on the Remote Sensing Data. Acta Geogr. Sin. 2010, 65, 29–36. [Google Scholar]
- Pan, M.; Cao, Y.G. Present status and perspectives of remote sensing survey of glacial lakes in High Asia. Remote Sens. Land Resour. 2021, 33, 1–8. [Google Scholar]
- Nie, Y.; Sheng, Y.; Liu, Q.; Liu, L.; Liu, S.; Zhang, Y.; Song, C. A regional-scale assessment of Himalayan glacial lake changes using satellite observations from 1990 to 2015. Remote Sens. Environ. 2017, 189, 1–13. [Google Scholar] [CrossRef] [Green Version]
- Li, D.; Shangguan, D.; Anjum, M.N. Glacial Lake Inventory Derived from Landsat 8 OLI in 2016–2018 in China–Pakistan Economic Corridor. ISPRS Int. J. Geo-Inf. 2020, 9, 294. [Google Scholar] [CrossRef]
- Zhang, M.; Chen, F.; Zhao, H.; Wang, J.; Wang, N. Recent Changes of Glacial Lakes in the High Mountain Asia and Its Potential Controlling Factors Analysis. Remote Sens. 2021, 13, 3757. [Google Scholar] [CrossRef]
- Zhang, G.; Yao, T.; Xie, H.; Wang, W.; Yang, W. An inventory of glacial lakes in the Third Pole region and their changes in response to global warming. Glob. Planet. Chang. 2015, 131, 148–157. [Google Scholar] [CrossRef]
- Chen, F.; Zhang, M.M.; Guo, H.D.; Allen, S.; Kargel, J.S.; Haritashya, U.K.; Watson, C.S. Annual 30 m dataset for glacial lakes in High Mountain Asia from 2008 to 2017. Earth Syst. Sci. Data 2021, 13, 741–766. [Google Scholar] [CrossRef]
- Maharjan, S.B.; Mool, P.K.; Lizong, W.; Xiao, G.; Shrestha, F.; Shrestha, R.B.; Khanal, N.R.; Bajracharya, S.R.; Shai, S.; Baral, P. The Status of Glacial Lakes in the Hindu Kush Himalaya—ICIMOD Research Report 2018/1; International Centre for Integrated Mountain Development (ICIMOD): Kathmandu, Nepal, 2018. [Google Scholar]
- Wang, X.; Guo, X.Y.; Yang, C.D.; Liu, Q.H.; Wei, J.F.; Zhang, Y.; Liu, S.Y.; Zhang, Y.L.; Jiang, Z.L.; Tang, Z.G. Glacial lake inventory of high-mountain Asia in 1990 and 2018 derived from Landsat images. Earth Syst. Sci. Data 2020, 12, 2169–2182. [Google Scholar] [CrossRef]
- Zheng, G.X.; Allen, S.K.; Bao, A.M.; Ballesteros-Cánovas, J.A.; Huss, M.; Zhang, G.Q.; Li, J.L.; Yuan, Y.; Jiang, L.L.; Yu, T.; et al. Increasing risk of glacial lake outburst floods from future Third Pole deglaciation. Nat. Clim. Chang. 2021, 11, 411–417. [Google Scholar] [CrossRef]
- Immerzeel, W.W.; Bierkens, M.F.P. Seasonal prediction of monsoon rainfall in three Asian river basins: The importance of snow cover on the Tibetan Plateau. Int. J. Clim. 2009, 30, 1835–1842. [Google Scholar] [CrossRef]
- Ran, Y.H.; Li, X.; Cheng, G.D.; Zhang, T.J.; Wu, Q.B.; Jin, H.J.; Jin, R. Short Communication Distribution of Permafrost in China: An Overview of Existing Permafrost Maps. Permafr. Periglac. Proc. 2012, 23, 322–333. [Google Scholar] [CrossRef]
- Qin, D.H. Map of Glacier Resources in the Himalayas; Science Press: Beijing, China, 1999. [Google Scholar]
- Liu, S.Y.; Yao, X.J.; Guo, W.Q.; Xu, J.L.; Shangguan, D.H.; Wei, J.F.; Bao, W.J.; Wu, L.Z. The contemporary glaciers in China based on the Second Chinese Glacier Inventory. Acta Geogr. Sin. 2015, 70, 3–16. [Google Scholar]
- Sexton, J.O.; Song, X.-P.; Huang, C.; Channan, S.; Baker, M.E.; Townshend, J.R. Urban growth of the Washington, D.C.–Baltimore, MD metropolitan region from 1984 to 2010 by annual, Landsat-based estimates of impervious cover. Remote Sens. Environ. 2013, 129, 42–53. [Google Scholar] [CrossRef]
- Song, X.P.; Sexton, J.O.; Huang, C.Q.; Channan, S.; Townshend, J.R. Characterizing the magnitude, timing and duration of urban growth from time series of Landsat-based estimates of impervious cover. Remote Sens. Environ. 2016, 175, 1–13. [Google Scholar] [CrossRef]
- Xue, X.J.; Liu, H.P.; Mu, X.D.; Liu, J.X. Trajectory-based detection of urban expansion using Landsat time series. Int. J. Remote Sens. 2014, 35, 1450–1465. [Google Scholar] [CrossRef]
- Arendt, A.; Bliss, A.; Bolch, T.; Cogley, J.; Gardner, A.; Hagen, J.-O.; Hock, R.; Huss, M.; Kaser, G.; Kienholz, C. Ran-Dolph Glacier Inventory-A Dataset of Global Glacier Outlines: Version6.0: Technical Report, Global Land Ice Measure-Ments from Space; RGI Consortium: Boulder, CO, USA, 2017. [Google Scholar]
- Liu, S.Y.; Guo, W.Q.; Xu, J.L. The Second Glacial Catalogue Data Set of China (v1.0); National Cryosphere Desert Data Center: Lanzhou, China, 2019. [Google Scholar]
- Fan, Y.; van den Dool, H. A global monthly land surface air temperature analysis for 1948–present. J. Geophys. Res. Atmos. 2008, 113, 01103. [Google Scholar] [CrossRef]
- Xie, P.P.; Yatagai, A.; Chen, M.Y.; Hayasaka, T.; Fukushima, Y.; Liu, C.M.; Yang, S. A Gauge-Based Analysis of Daily Precipitation over East Asia. J. Hydrometeorol. 2007, 8, 607–626. [Google Scholar] [CrossRef]
- Chen, M.Y.; Shi, W.; Xie, P.P.; Silva, V.B.S.; Kousky, V.E.; Higgins, R.W.; Janowiak, J.E. Assessing objective techniques for gauge-based analyses of global daily precipitation. J. Geophys. Res. Earth Surf. 2008, 113, 04110. [Google Scholar] [CrossRef]
- Chen, M.Y.; Xie, P.P. CPC unified gauge-based analysis of global daily precipitation. In Proceedings of the Western Pacific Ge-ophysics Meeting, Cairns, Australia, 29 July–1 August 2008. [Google Scholar]
- Wang, X.Y.; Wang, J.; Jiang, Z.Y.; Li, H.Y.; Hao, X.H. An Effective Method for Snow-Cover Mapping of Dense Conif-erous Forests in the Upper Heihe River Basin Using Landsat Operational Land Imager Data. Remote Sens. 2015, 7, 17246–17257. [Google Scholar] [CrossRef] [Green Version]
- Li, W.P.; Wang, W.; Gao, X.; Wu, Y.M.; Wang, X.C.; Liu, Q. A lake extraction method in mountainous regions based on the integration of object-oriented approach and watershed algorithm. J. Geo-Inf. 2021, 23, 1272–1285. [Google Scholar]
- Mool, P.; Wangda, D.; Bajracharya, S.R. Inventory of Glaciers, Glacial Lakes and Glacial Lake Outburst Floods: Monitoring and Early Warning Systems in the Hindu Kush-Himalayan Region, Bhutan; ICIMOD: Kathmandu, Nepal, 2001. [Google Scholar]
- Qin, D.H. Glossary of Cryosphere Science; China Meteorological Press: Beijing, China, 2014. [Google Scholar]
- Yao, X.J.; Liu, S.Y.; Han, L.; Sun, M.P.; Zhao, L.L. Definition and classification system of glacial lake for inventory and hazards study. J. Geogr. Sci. 2018, 28, 193–205. [Google Scholar] [CrossRef] [Green Version]
- Hall, D.K.; Bayr, K.J.; Schoner, W.; Bindschadler, R.A.; Chien, J.Y.L. Consideration of the errors inherent in mapping historical glacier positions in Austria from the ground and space (1893–2001). Remote Sens. Environ. 2003, 86, 566–577. [Google Scholar] [CrossRef]
- Salerno, F.; Thakuri, S.; D’Agata, C.; Smiraglia, C.; Manfredi, E.C.; Viviano, G.; Tartari, G. Glacial lake distribution in the Mount Everest region: Uncertainty of measurement and conditions of formation. Glob. Planet. Chang. 2012, 92–93, 30–39. [Google Scholar] [CrossRef]
- Hanshaw, M.N.; Bookhagen, B. Glacial areas, lake areas, and snow lines from 1975 to 2012: Status of the Cordillera Vilcanota, including the Quelccaya Ice Cap, northern central Andes, Peru. Cryosphere 2014, 8, 359–376. [Google Scholar] [CrossRef] [Green Version]
- Frey, H.; Haeberli, W.; Linsbauer, A.; Huggel, C.; Paul, F. A multi-level strategy for anticipating future glacier lake for-mation and associated hazard potentials. Nat. Hazards Earth Syst. Sci. 2010, 10, 339–352. [Google Scholar] [CrossRef] [Green Version]
- Wang, X.; Siegert, F.; Zhou, A.G.; Franke, J. Glacier and glacial lake changes and their relationship in the context of climate change, Central Tibetan Plateau 1972–2010. Glob. Planet. Chang. 2013, 111, 246–257. [Google Scholar] [CrossRef]
- Yang, K.; Lu, H.; Yue, S.Y.; Zhang, G.Q.; Lei, Y.B.; La, Z.; Wang, W. Quantifying recent precipitation change and pre-dicting lake expansion in the Inner Tibetan Plateau. Clim. Chang. 2018, 147, 149–163. [Google Scholar] [CrossRef]
- Zhu, L.P.; Lu, X.M.; Wang, J.B.; Peng, P.; Kasper, T.; Daut, G.; Haberzettl, T.; Frenzel, P.; Li, Q.; Yang, R.M.; et al. Climate change on the Tibetan Plateau in response to shifting atmospheric circulation since the LGM. Sci. Rep. 2015, 5, 13318. [Google Scholar] [CrossRef] [PubMed]
- Wu, B.Y. Weakening of Indian Summer Monsoon in Recent Decades. Adv. Atmos. Sci. 2005, 22, 21–29. [Google Scholar]
- Bolch, T.; Kulkarni, A.; Kaab, A.; Huggel, C.; Paul, F.; Cogley, G.; Frey, H.; Kargel, J.S.; Fujita, K.; Scheel, M.; et al. The State and Fate of Himalayan Glaciers. Science 2012, 336, 310–314. [Google Scholar] [CrossRef] [Green Version]
- Luo, W.; Zhang, G.Q.; Chen, W.F.; Xu, F.L. Response of glacial lakes to glacier and climate changes in the western Nyainqentanglha range. Sci. Total Environ. 2020, 735, 139607. [Google Scholar] [CrossRef]
- Liu, J.J.; Cheng, Z.L.; Su, P.C. The relationship between air temperature fluctuation and Glacial Lake Outburst Floods in Tibet, China. Quat. Int. 2014, 321, 78–87. [Google Scholar] [CrossRef]
- Guo, C.K. The Change of Glacial Lakes and Its Influence in Everest Region. Master’s Thesis, Hunan University of Science and Technology, Xiangtan, China, 2017. [Google Scholar]
- Cogley, G.J. Glacier shrinkage across High Mountain Asia. Ann. Glaciol. 2016, 57, 41–49. [Google Scholar] [CrossRef] [Green Version]
- Yao, T.D.; Thompson, L.; Yang, W.; Yu, W.S.; Gao, Y.; Guo, X.J.; Yang, X.X.; Duan, K.Q.; Zhao, H.B.; Xu, B.Q.; et al. Different glacier status with atmospheric circulations in Tibetan Plateau and surroundings. Nat. Clim. Chang. 2012, 2, 663–667. [Google Scholar] [CrossRef]
- Zhang, G.Q.; Bolch, T.; Allen, S.; Linsbauer, A.; Chen, W.F.; Wang, W.C. Glacial lake evolution and glacier-lake inter-actions in the Poiqu River basin, central Himalaya, 1964–2017. J. Glaciol. 2019, 65, 347–365. [Google Scholar] [CrossRef] [Green Version]
- Thompson, S.S.; Benn, D.I.; Dennis, K.; Luckman, A. A rapidly growing moraine-dammed glacial lake on Ngozumpa Glacier, Nepal. Geomorphology 2012, 145–146, 1–11. [Google Scholar] [CrossRef]
- Wang, X.; Ding, Y.J.; Liu, S.Y.; Jiang, L.H.; Wu, K.P.; Jiang, Z.L.; Guo, W.Q. Changes of glacial lakes and implications in Tian Shan, central Asia, based on remote sensing data from 1990 to 2010. Environ. Res. Lett. 2013, 8, 044052. [Google Scholar] [CrossRef]
- Wang, X.; Ding, Y.J.; Zhang, Y. The influence of glacier meltwater on the hydrological effect of glacial lakes in Mountain Cryosphere. J. Lake Sci. 2019, 31, 609–620. [Google Scholar]
- Liu, J.K.; Zhang, J.J.; Gao, B.; Li, Y.L.; Li, M.Y.; WuJin, D.J.; Zhou, L.X. An overview of glacial lake outburst flood in Tibet, China. J. Glaciol. Geocryol. 2019, 41, 1335–1347. [Google Scholar]
- Lv, R.R. Debris Flow and Environment in Tibet; University of Science and Technology Press: Chengdu, China, 1999; pp. 69–109. [Google Scholar]
- Zhang, T.G.; Wang, W.C.; Gao, T.G.; An, B.S.; Shang, X.X. Glacial lake outburst floods on the High Mountain Asia: A review. J Glaciol. Geocryol. 2022, 43, 1673–1692. [Google Scholar]
- Prakash, C.; Nagarajan, R. Glacial lake changes and outburst flood hazard in Chandra basin, North-Western Indian Himalaya. Geomat. Nat. Hazards Risk 2018, 9, 337–355. [Google Scholar] [CrossRef] [Green Version]
- Hanshaw, M.N.; Bookhagen, B. Glacial areas, lake areas, and snowlines from 1975 to 2012: Status of the Cordillera Vilcanota, including the Quelccaya Ice Cap, northern central Andes, Peru. Cryosphere Discuss. 2013, 7, 573–634. [Google Scholar]
- Ma, J.S.; Song, C.Q.; Wang, Y.J. Spatially and Temporally Resolved Monitoring of Glacial Lake Changes in Alps During the Recent Two Decades. Front. Earth Sci. 2021, 9, 723386. [Google Scholar] [CrossRef]
- Casu, F.; Manzo, M.; Lanari, R. A quantitative assessment of the SBAS algorithm performance for surface deformation retrieval from DInSAR data. Remote Sens. Environ. 2006, 102, 195–210. [Google Scholar] [CrossRef]
- Mora, O.; Mallorqui, J.J.; Broquetas, A. Linear and nonlinear terrain deformation maps from a reduced set of interferometric sar images. IEEE Trans. Geosci. Remote Sens. 2003, 41, 2243–2253. [Google Scholar] [CrossRef]
- Yu, X.Y. Improved SBAS Technology for Land Deformation Detection and Groundwater Application. Ph.D. Thesis, Central South University, Changsha, China, 2012. [Google Scholar]
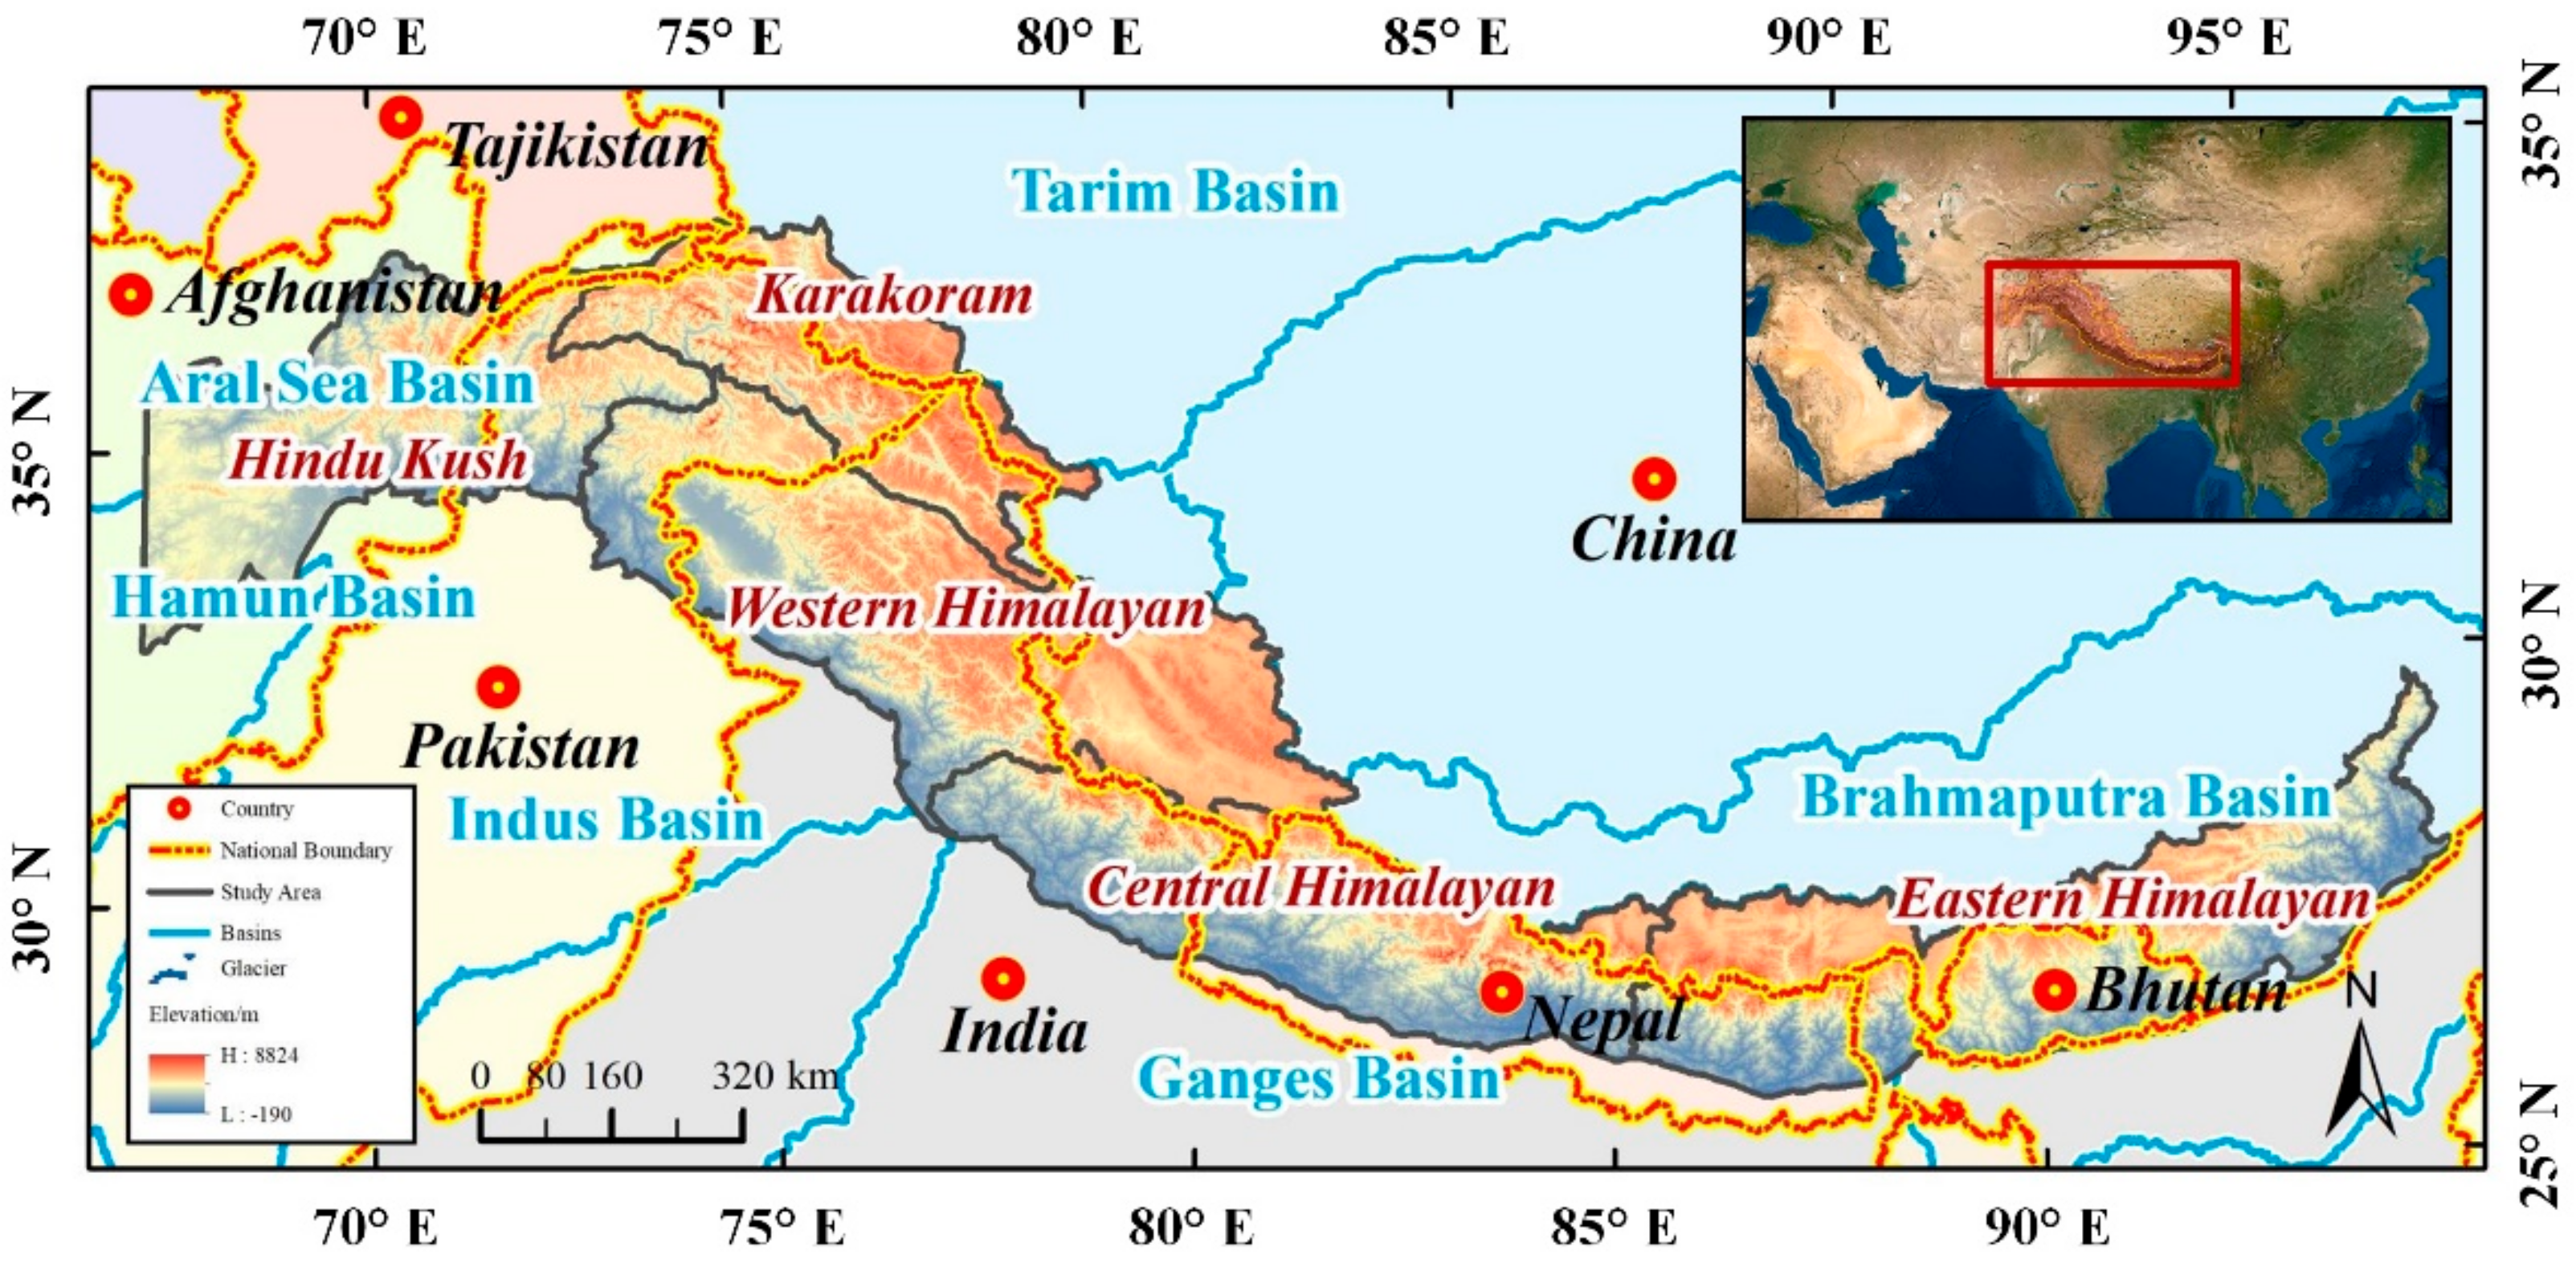
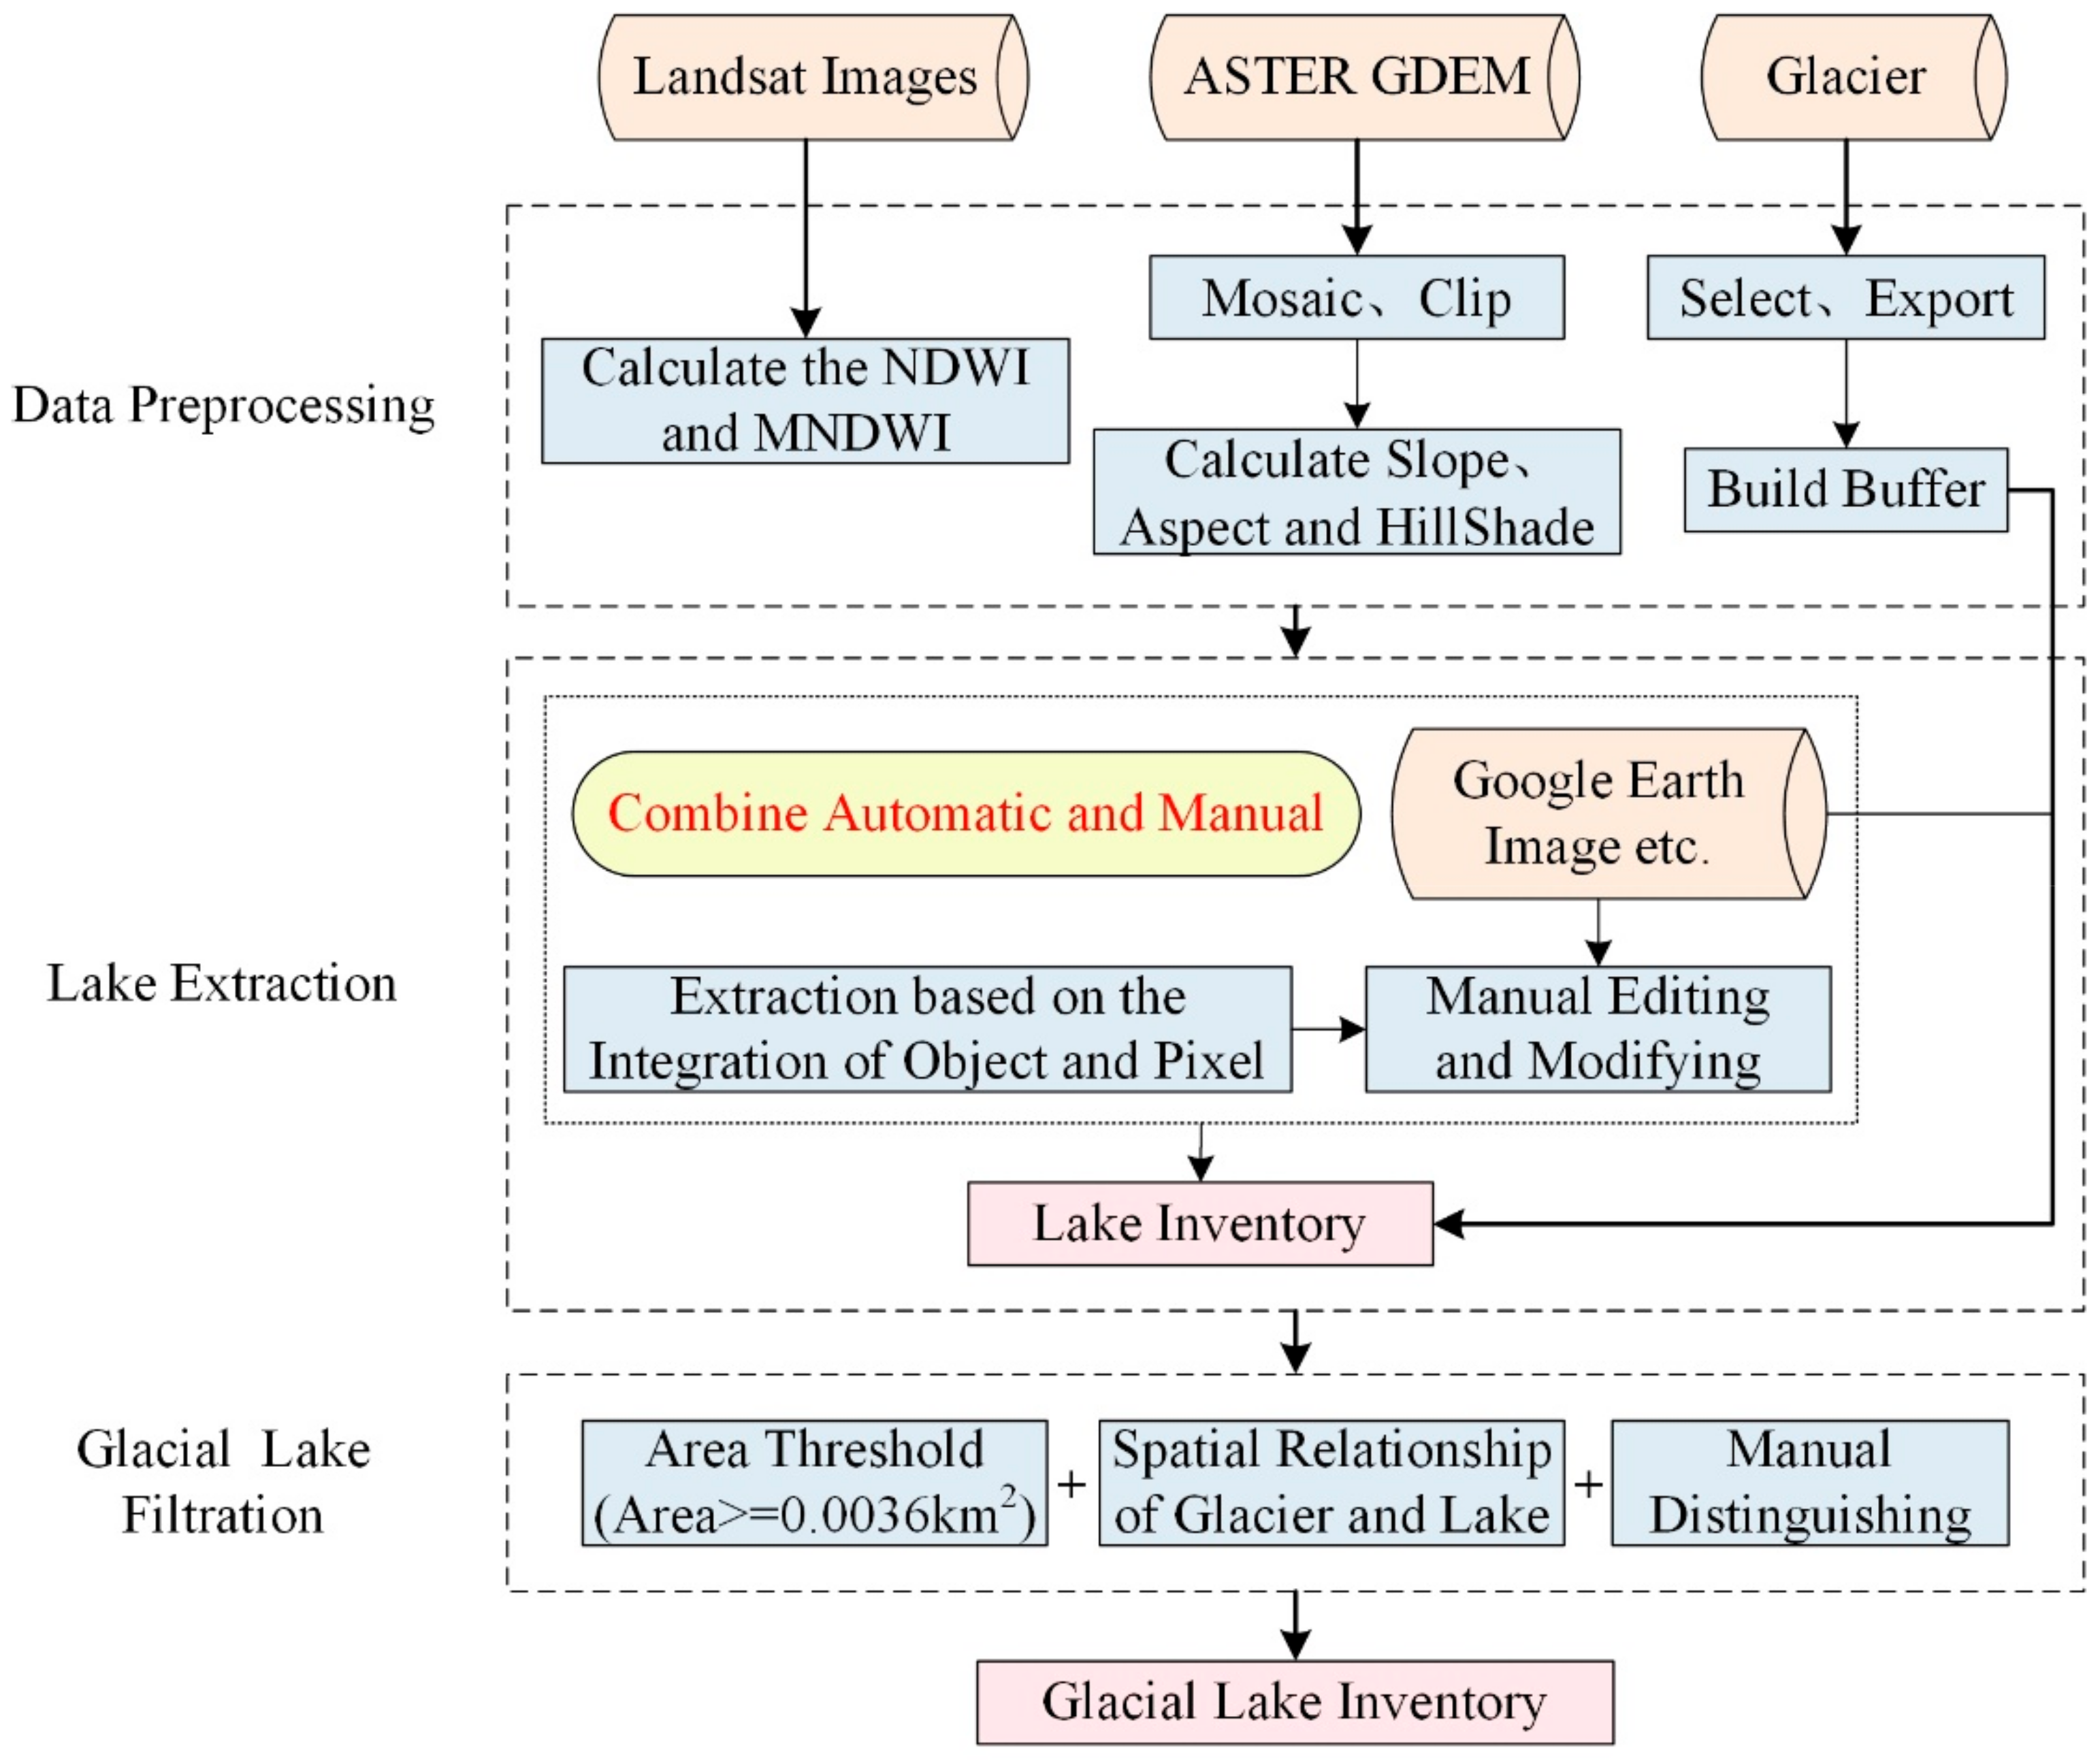
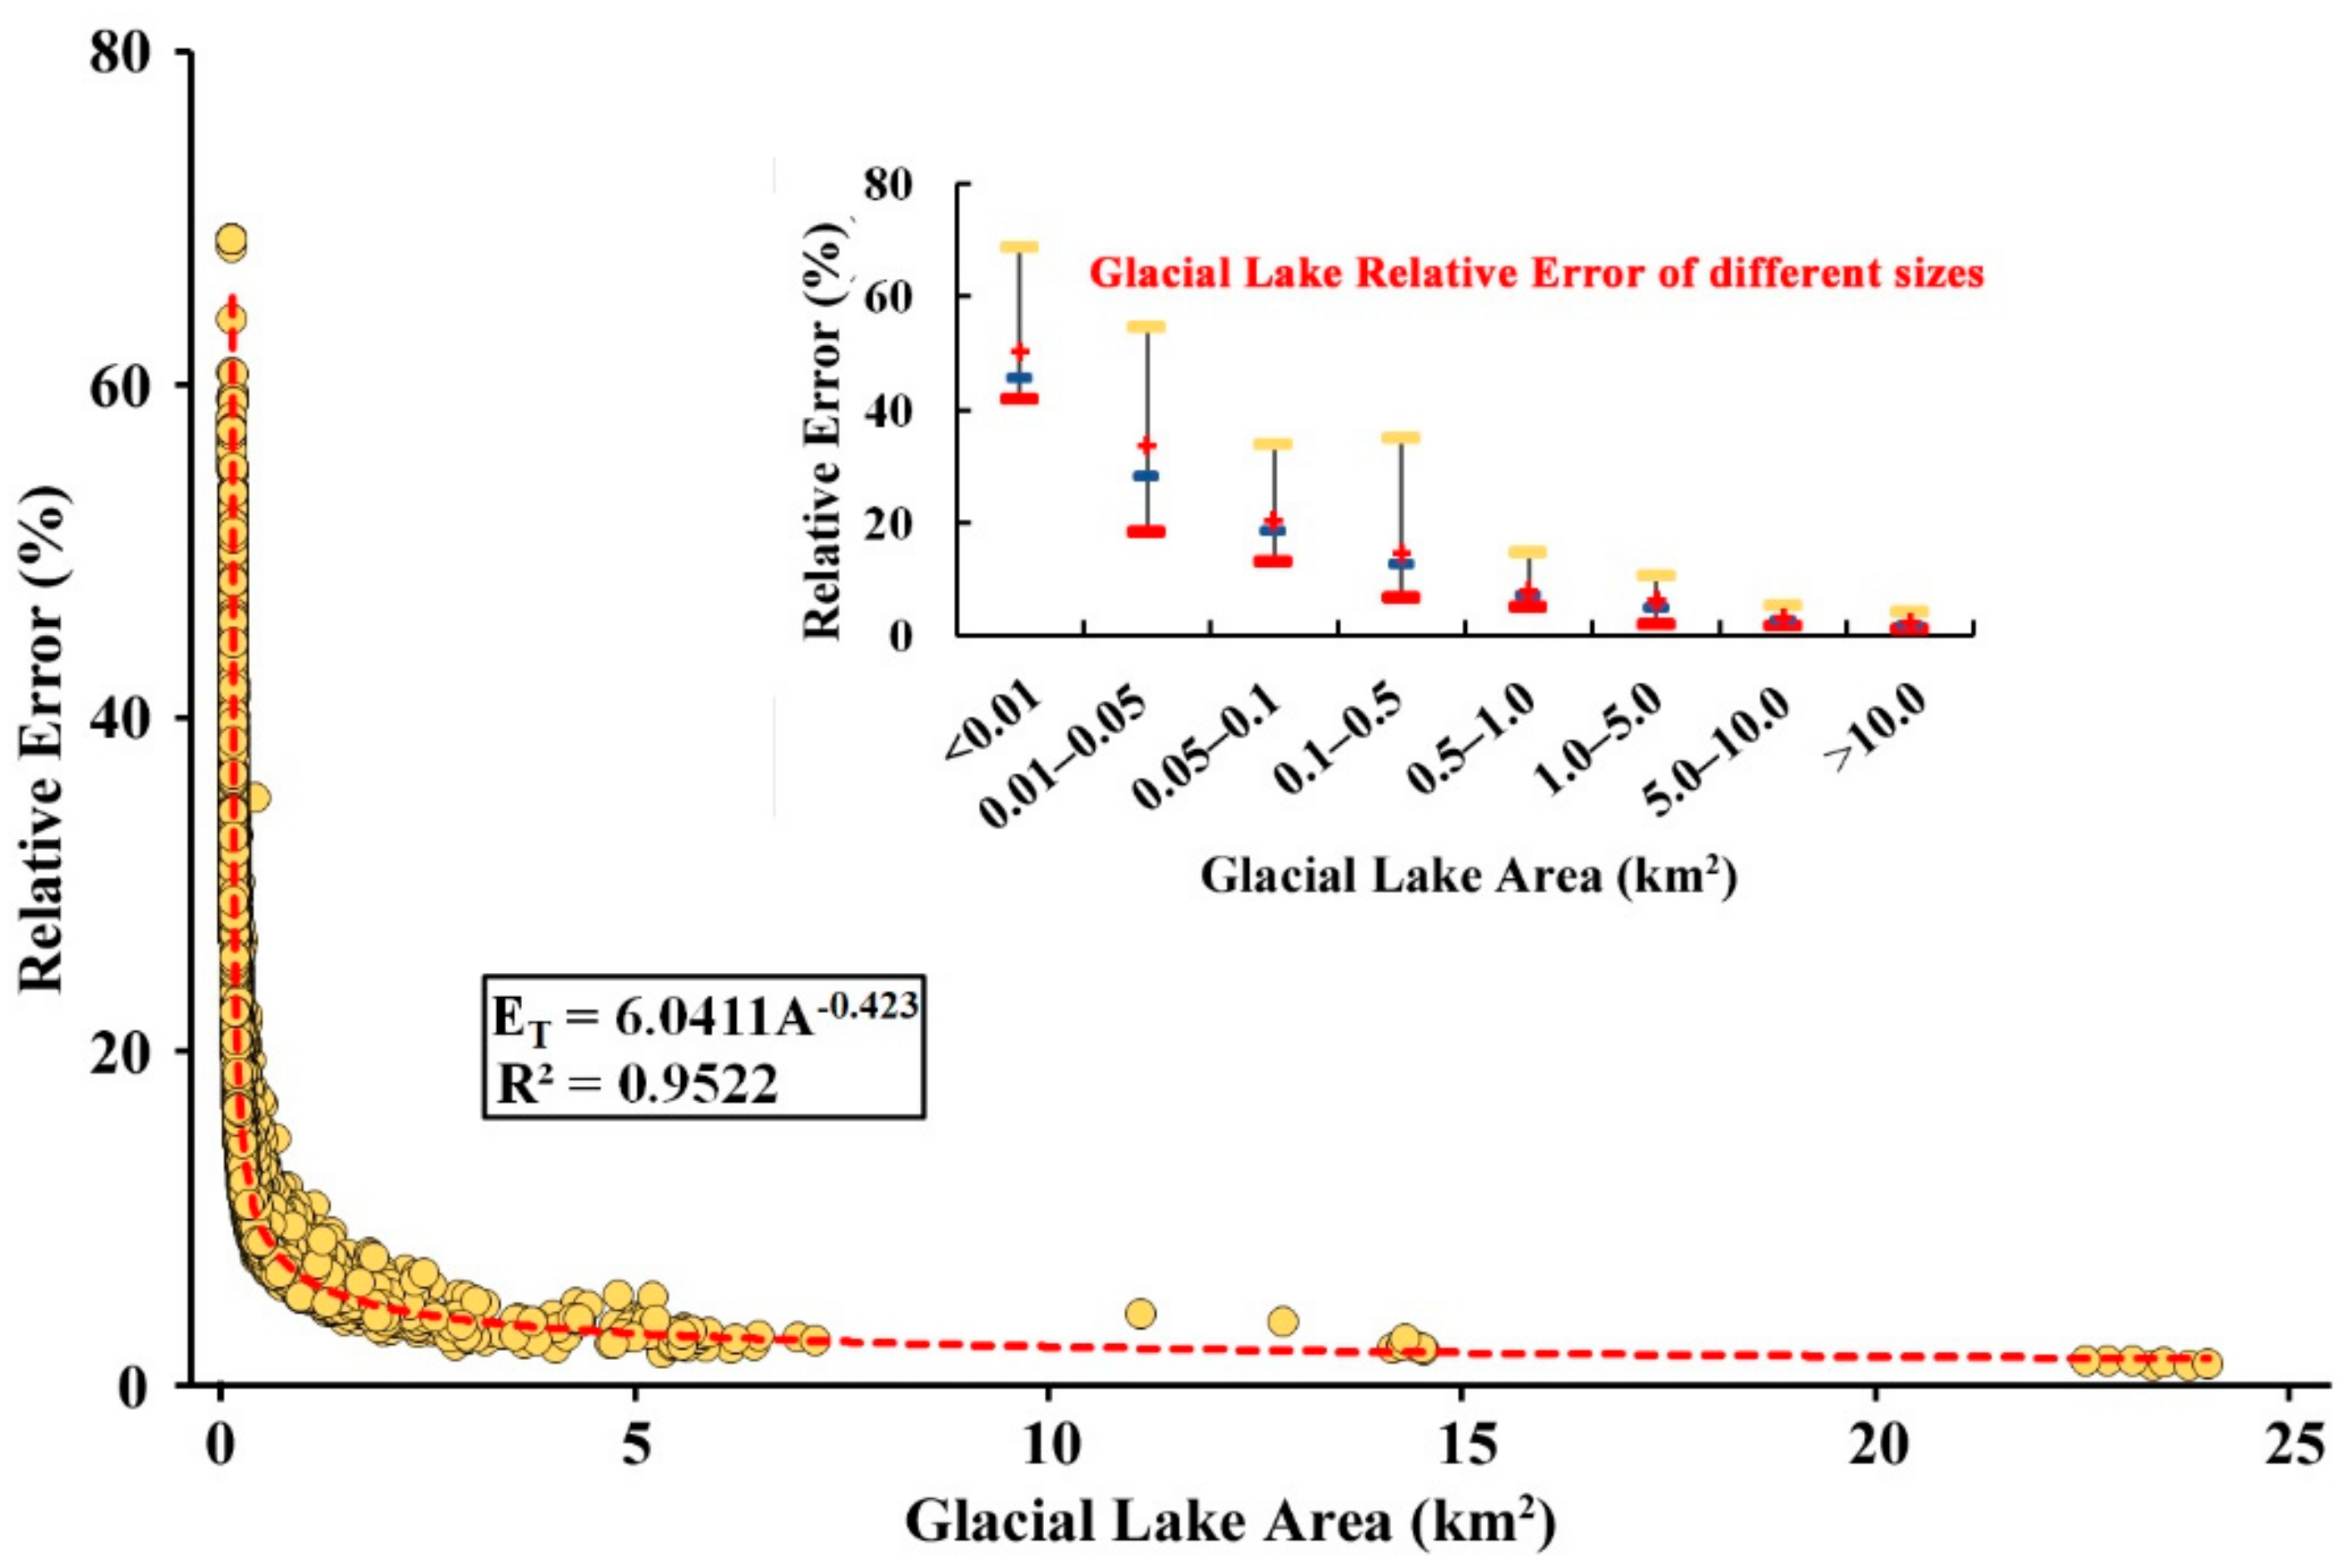
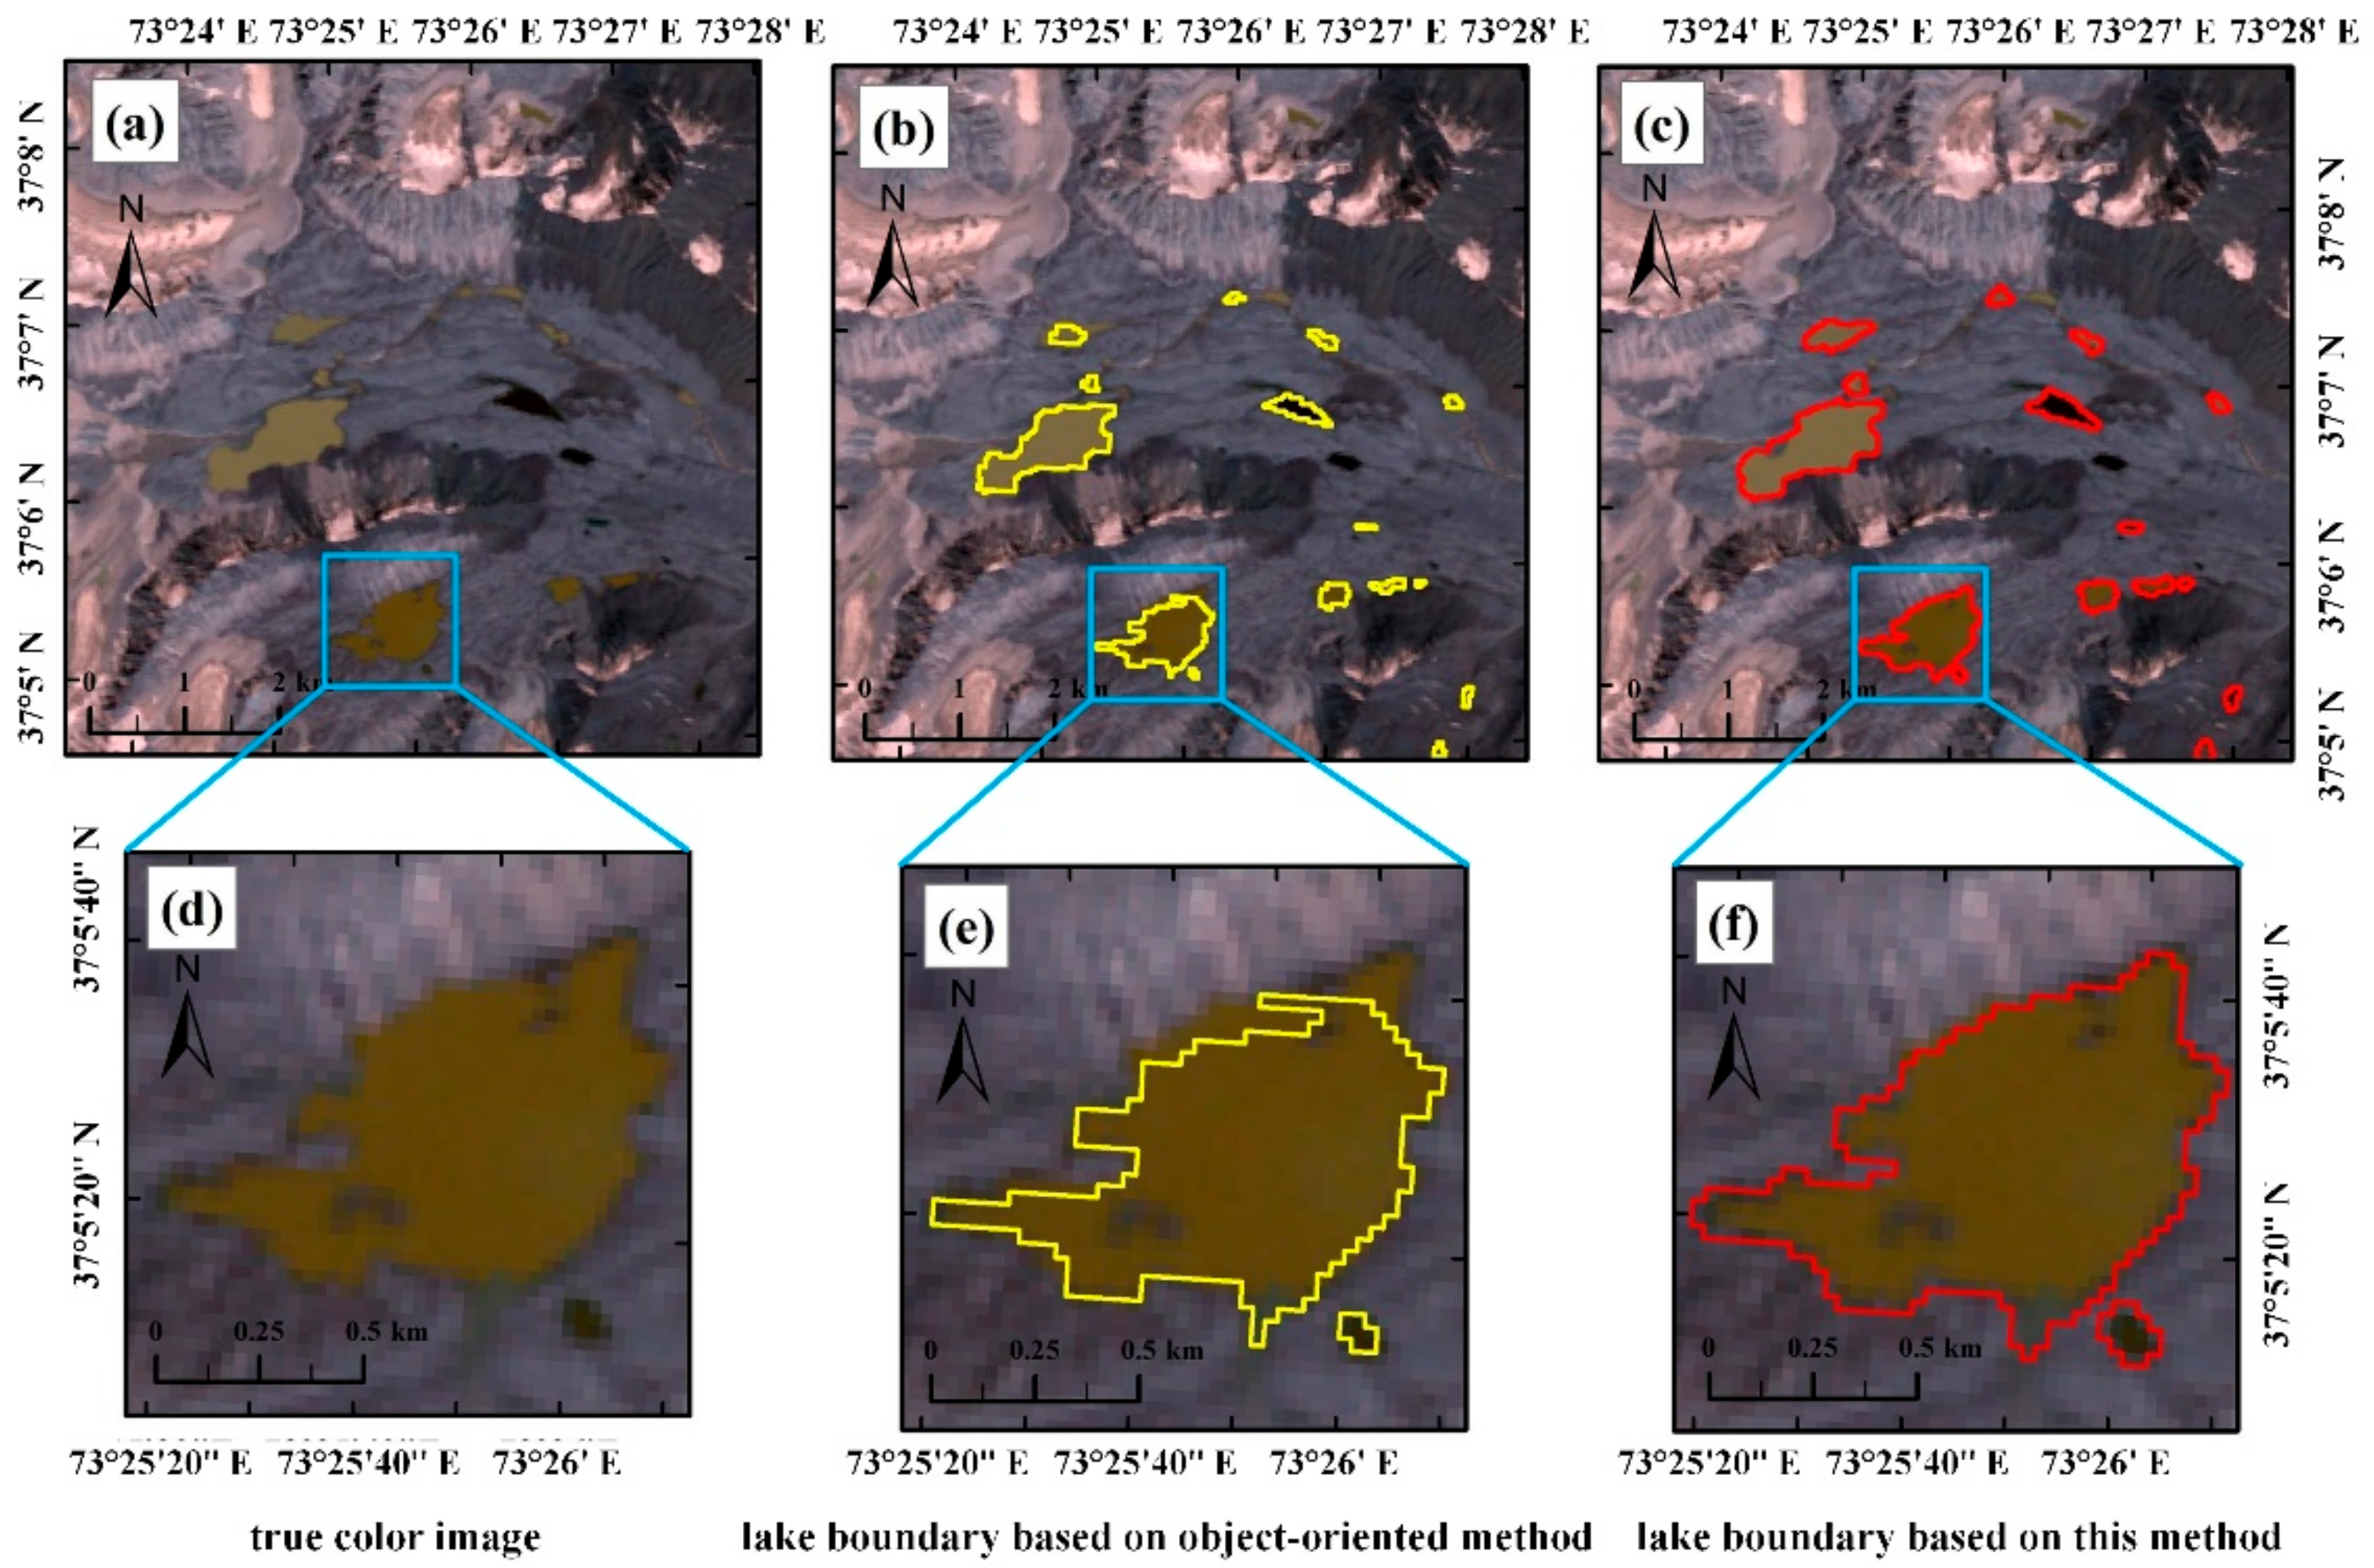


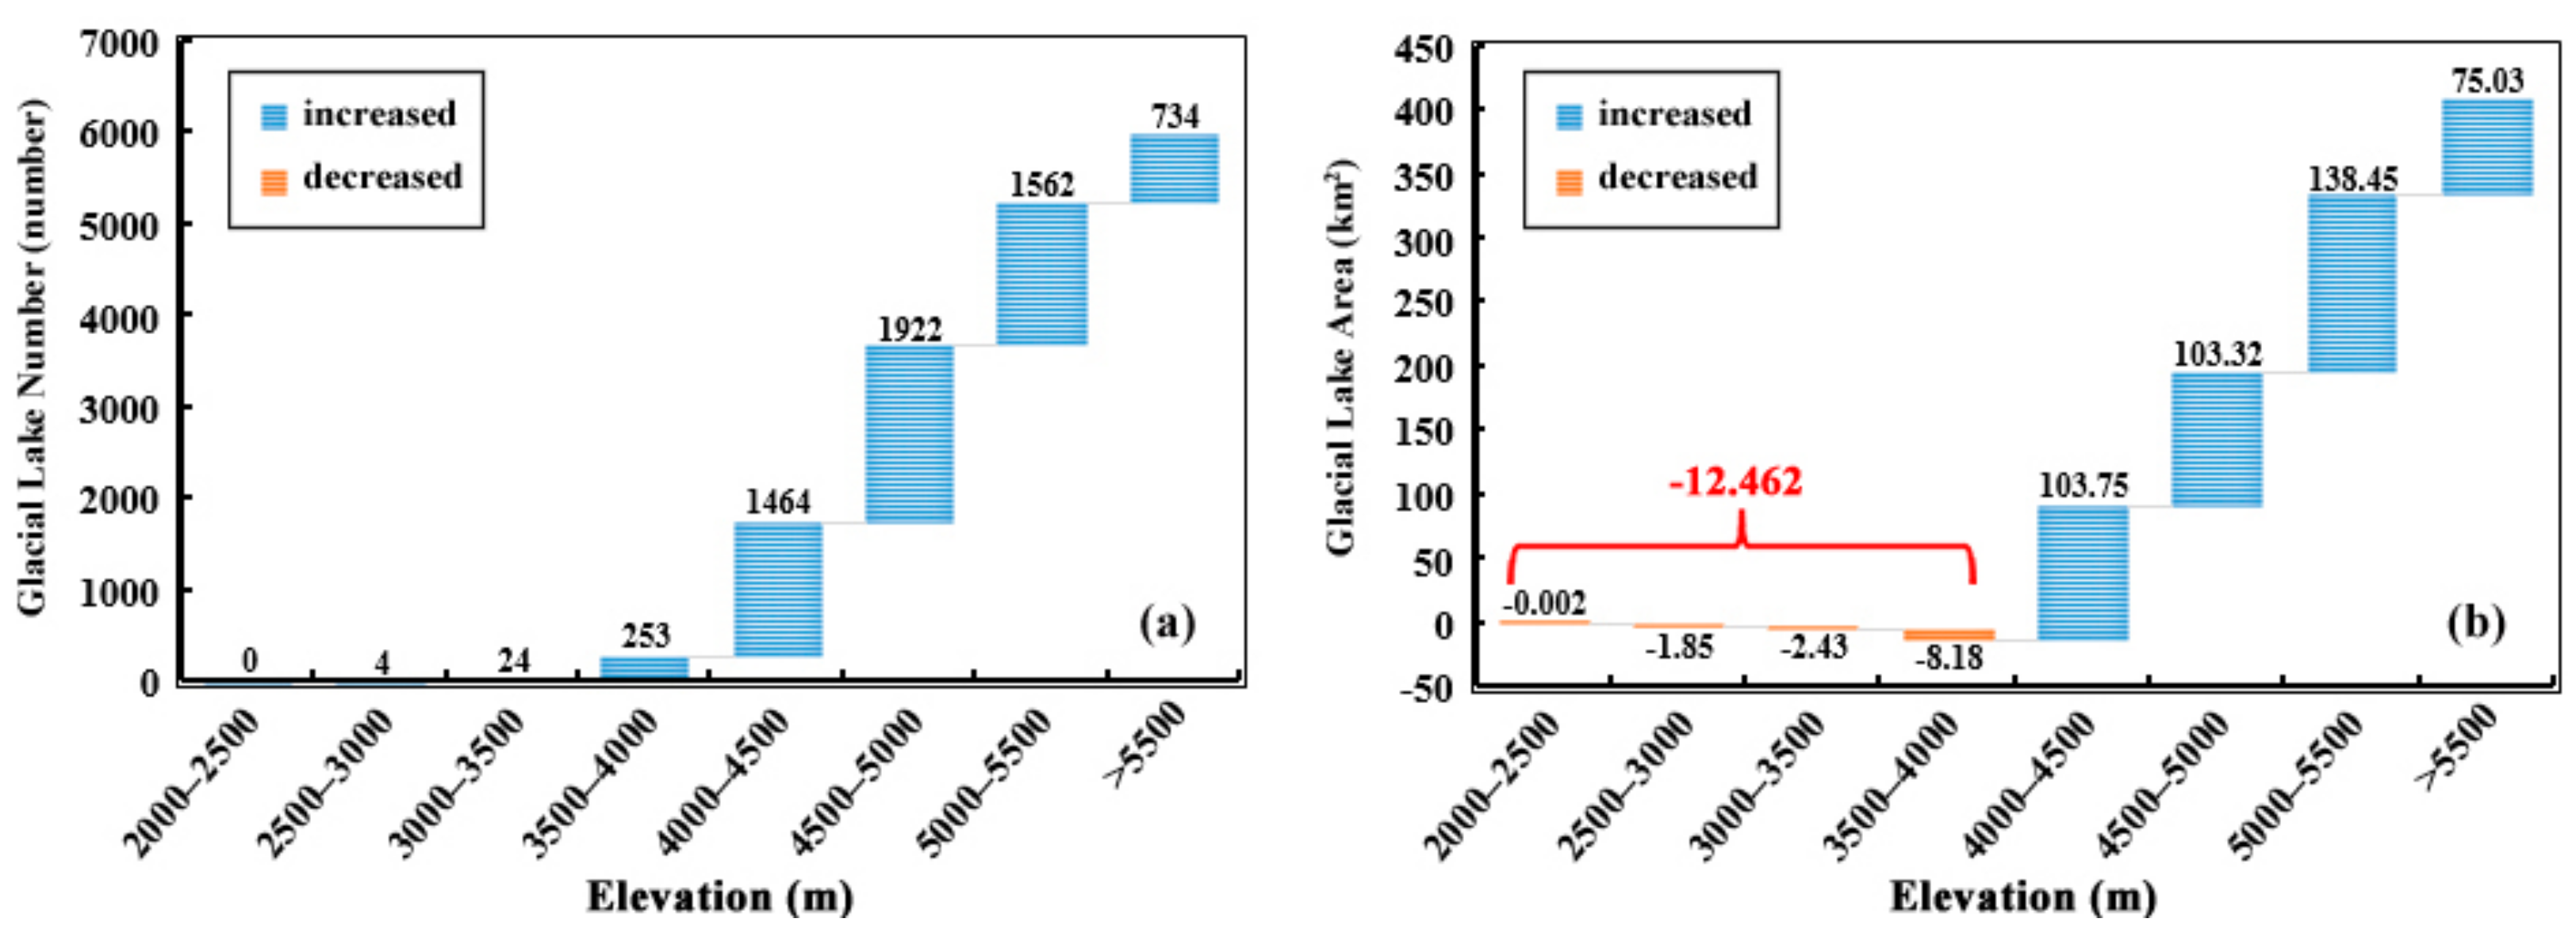
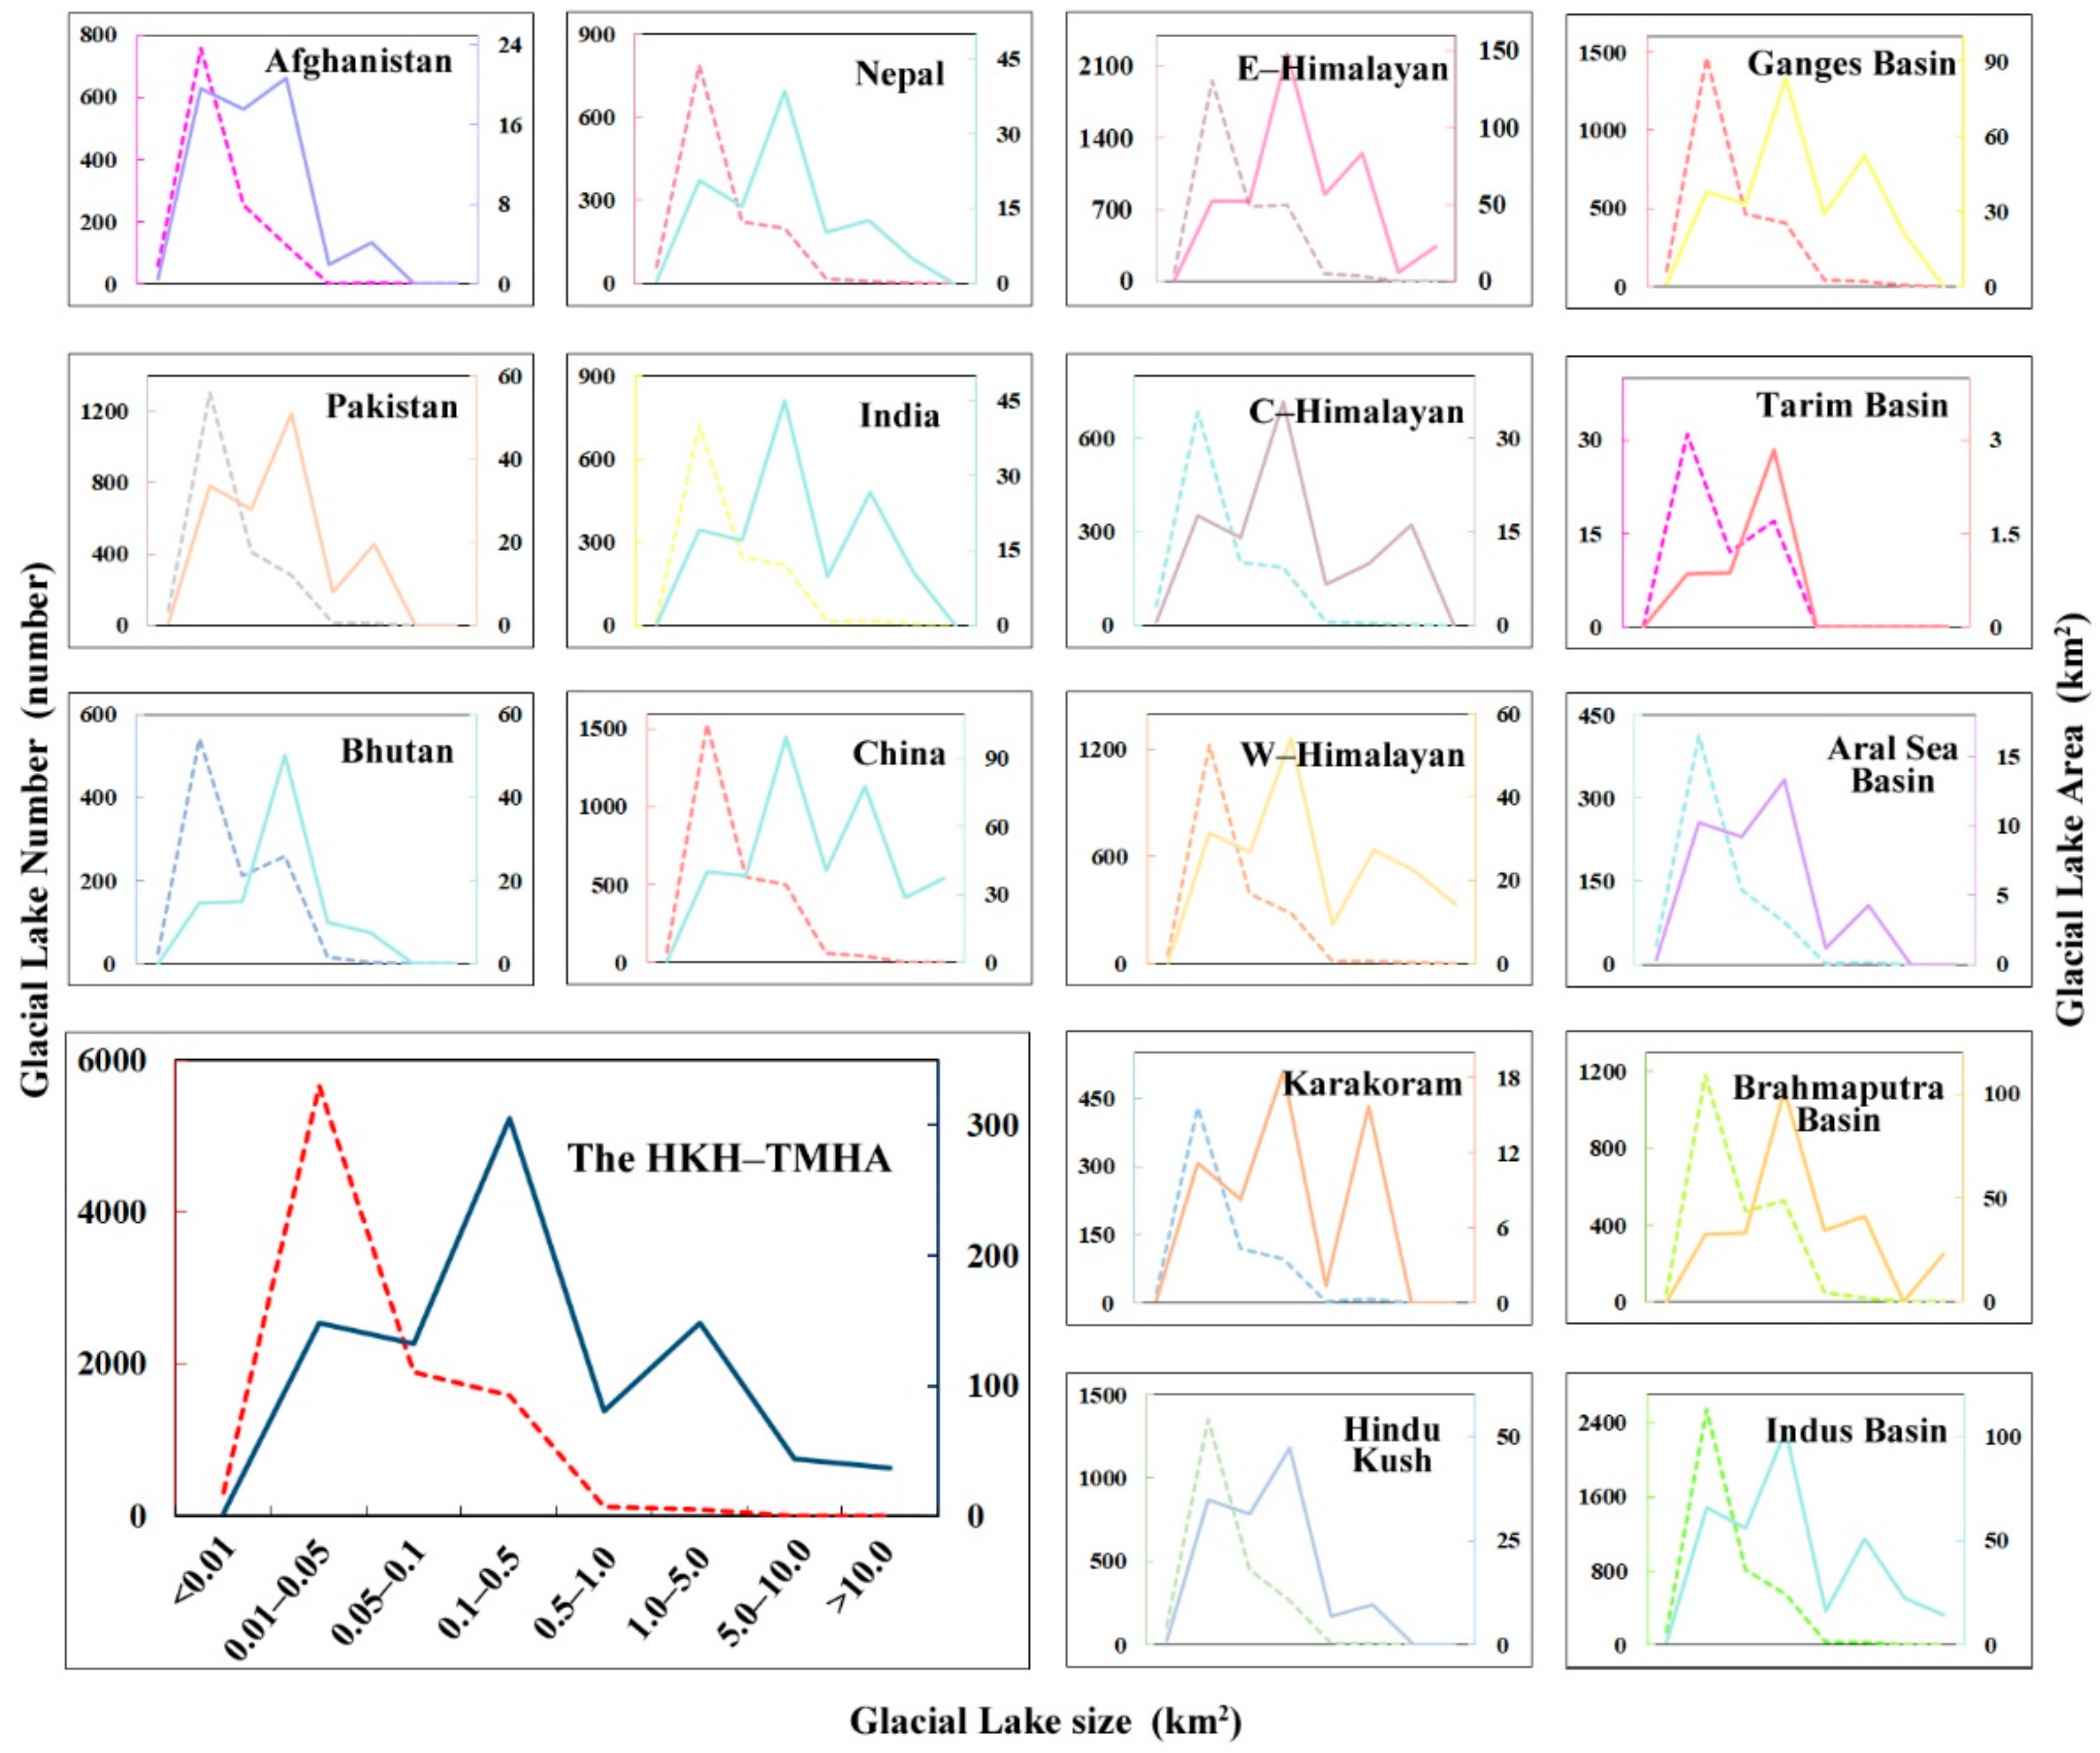
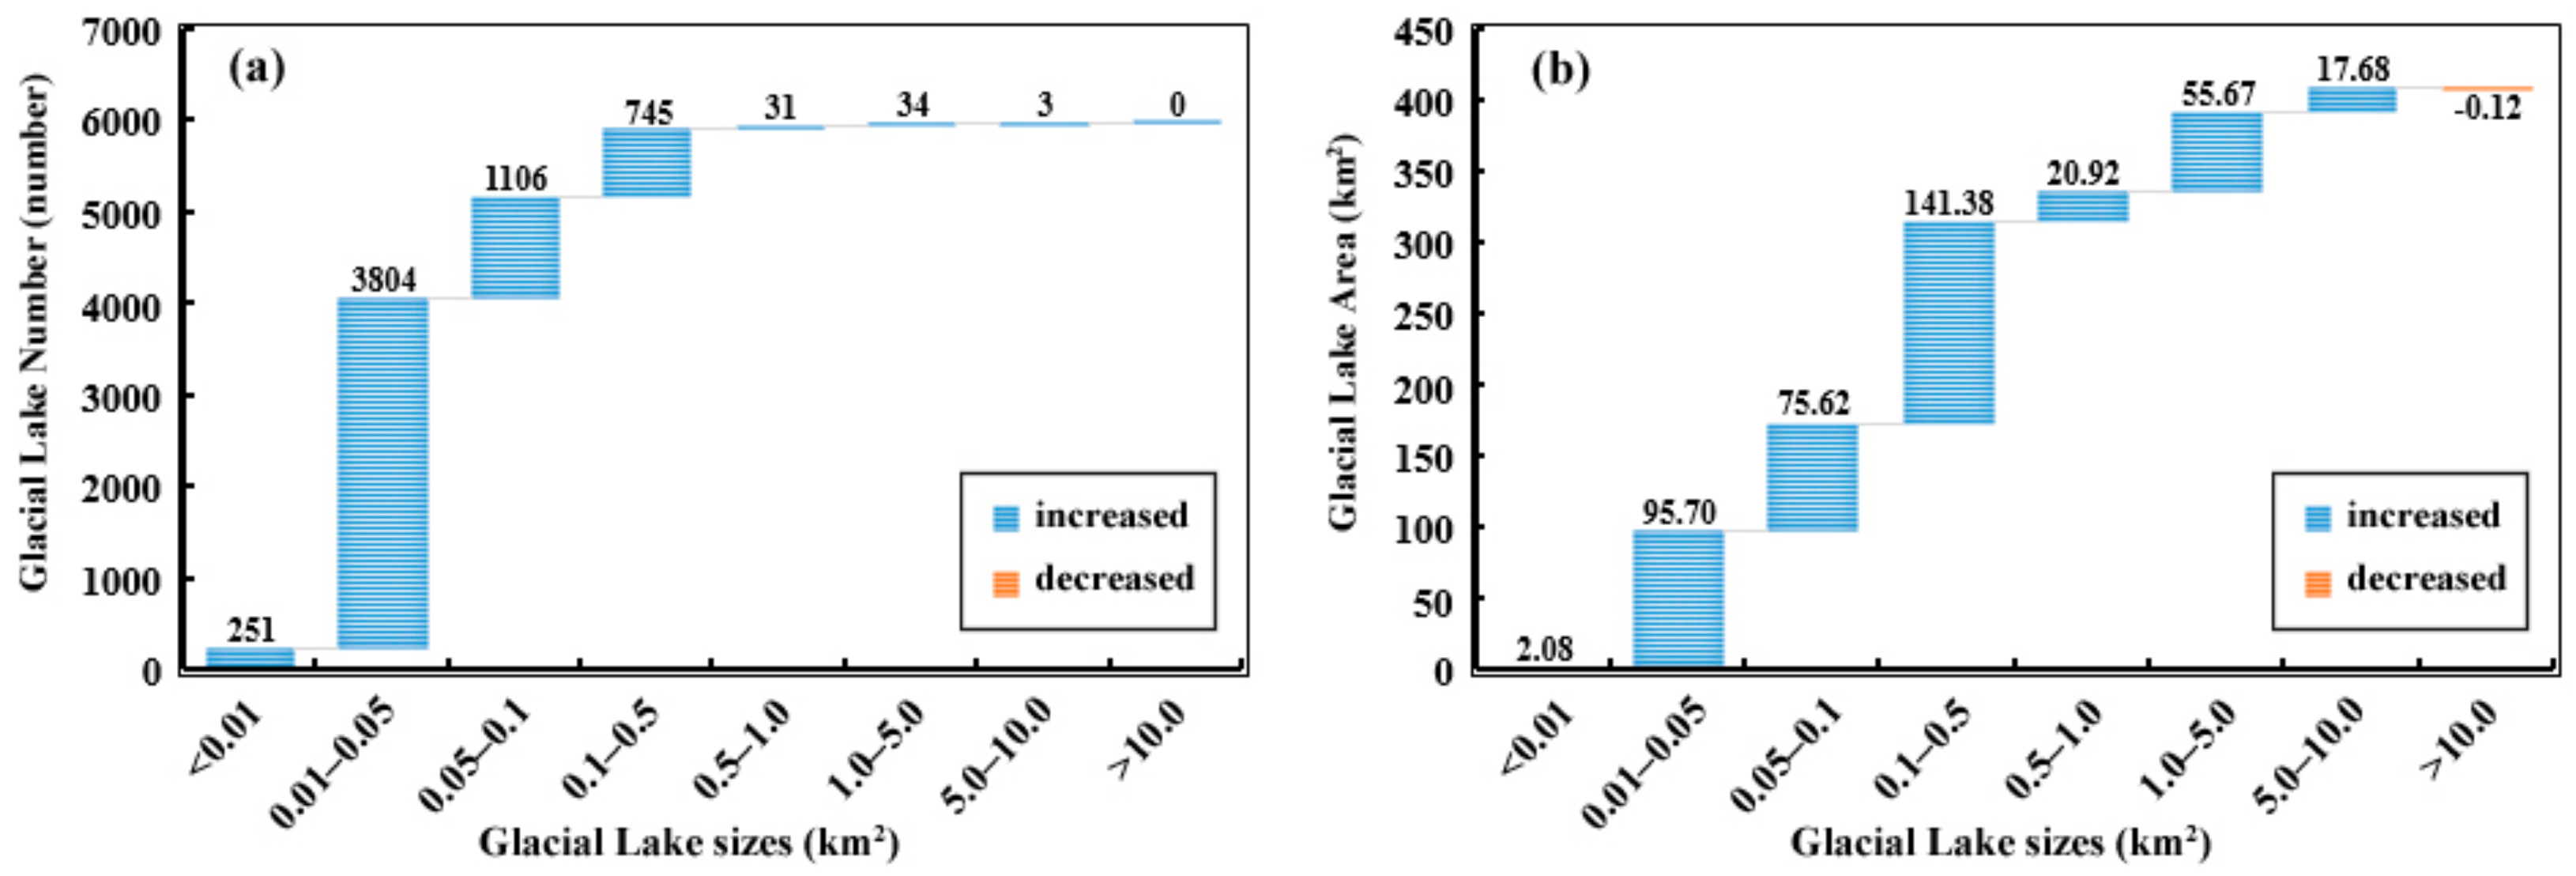
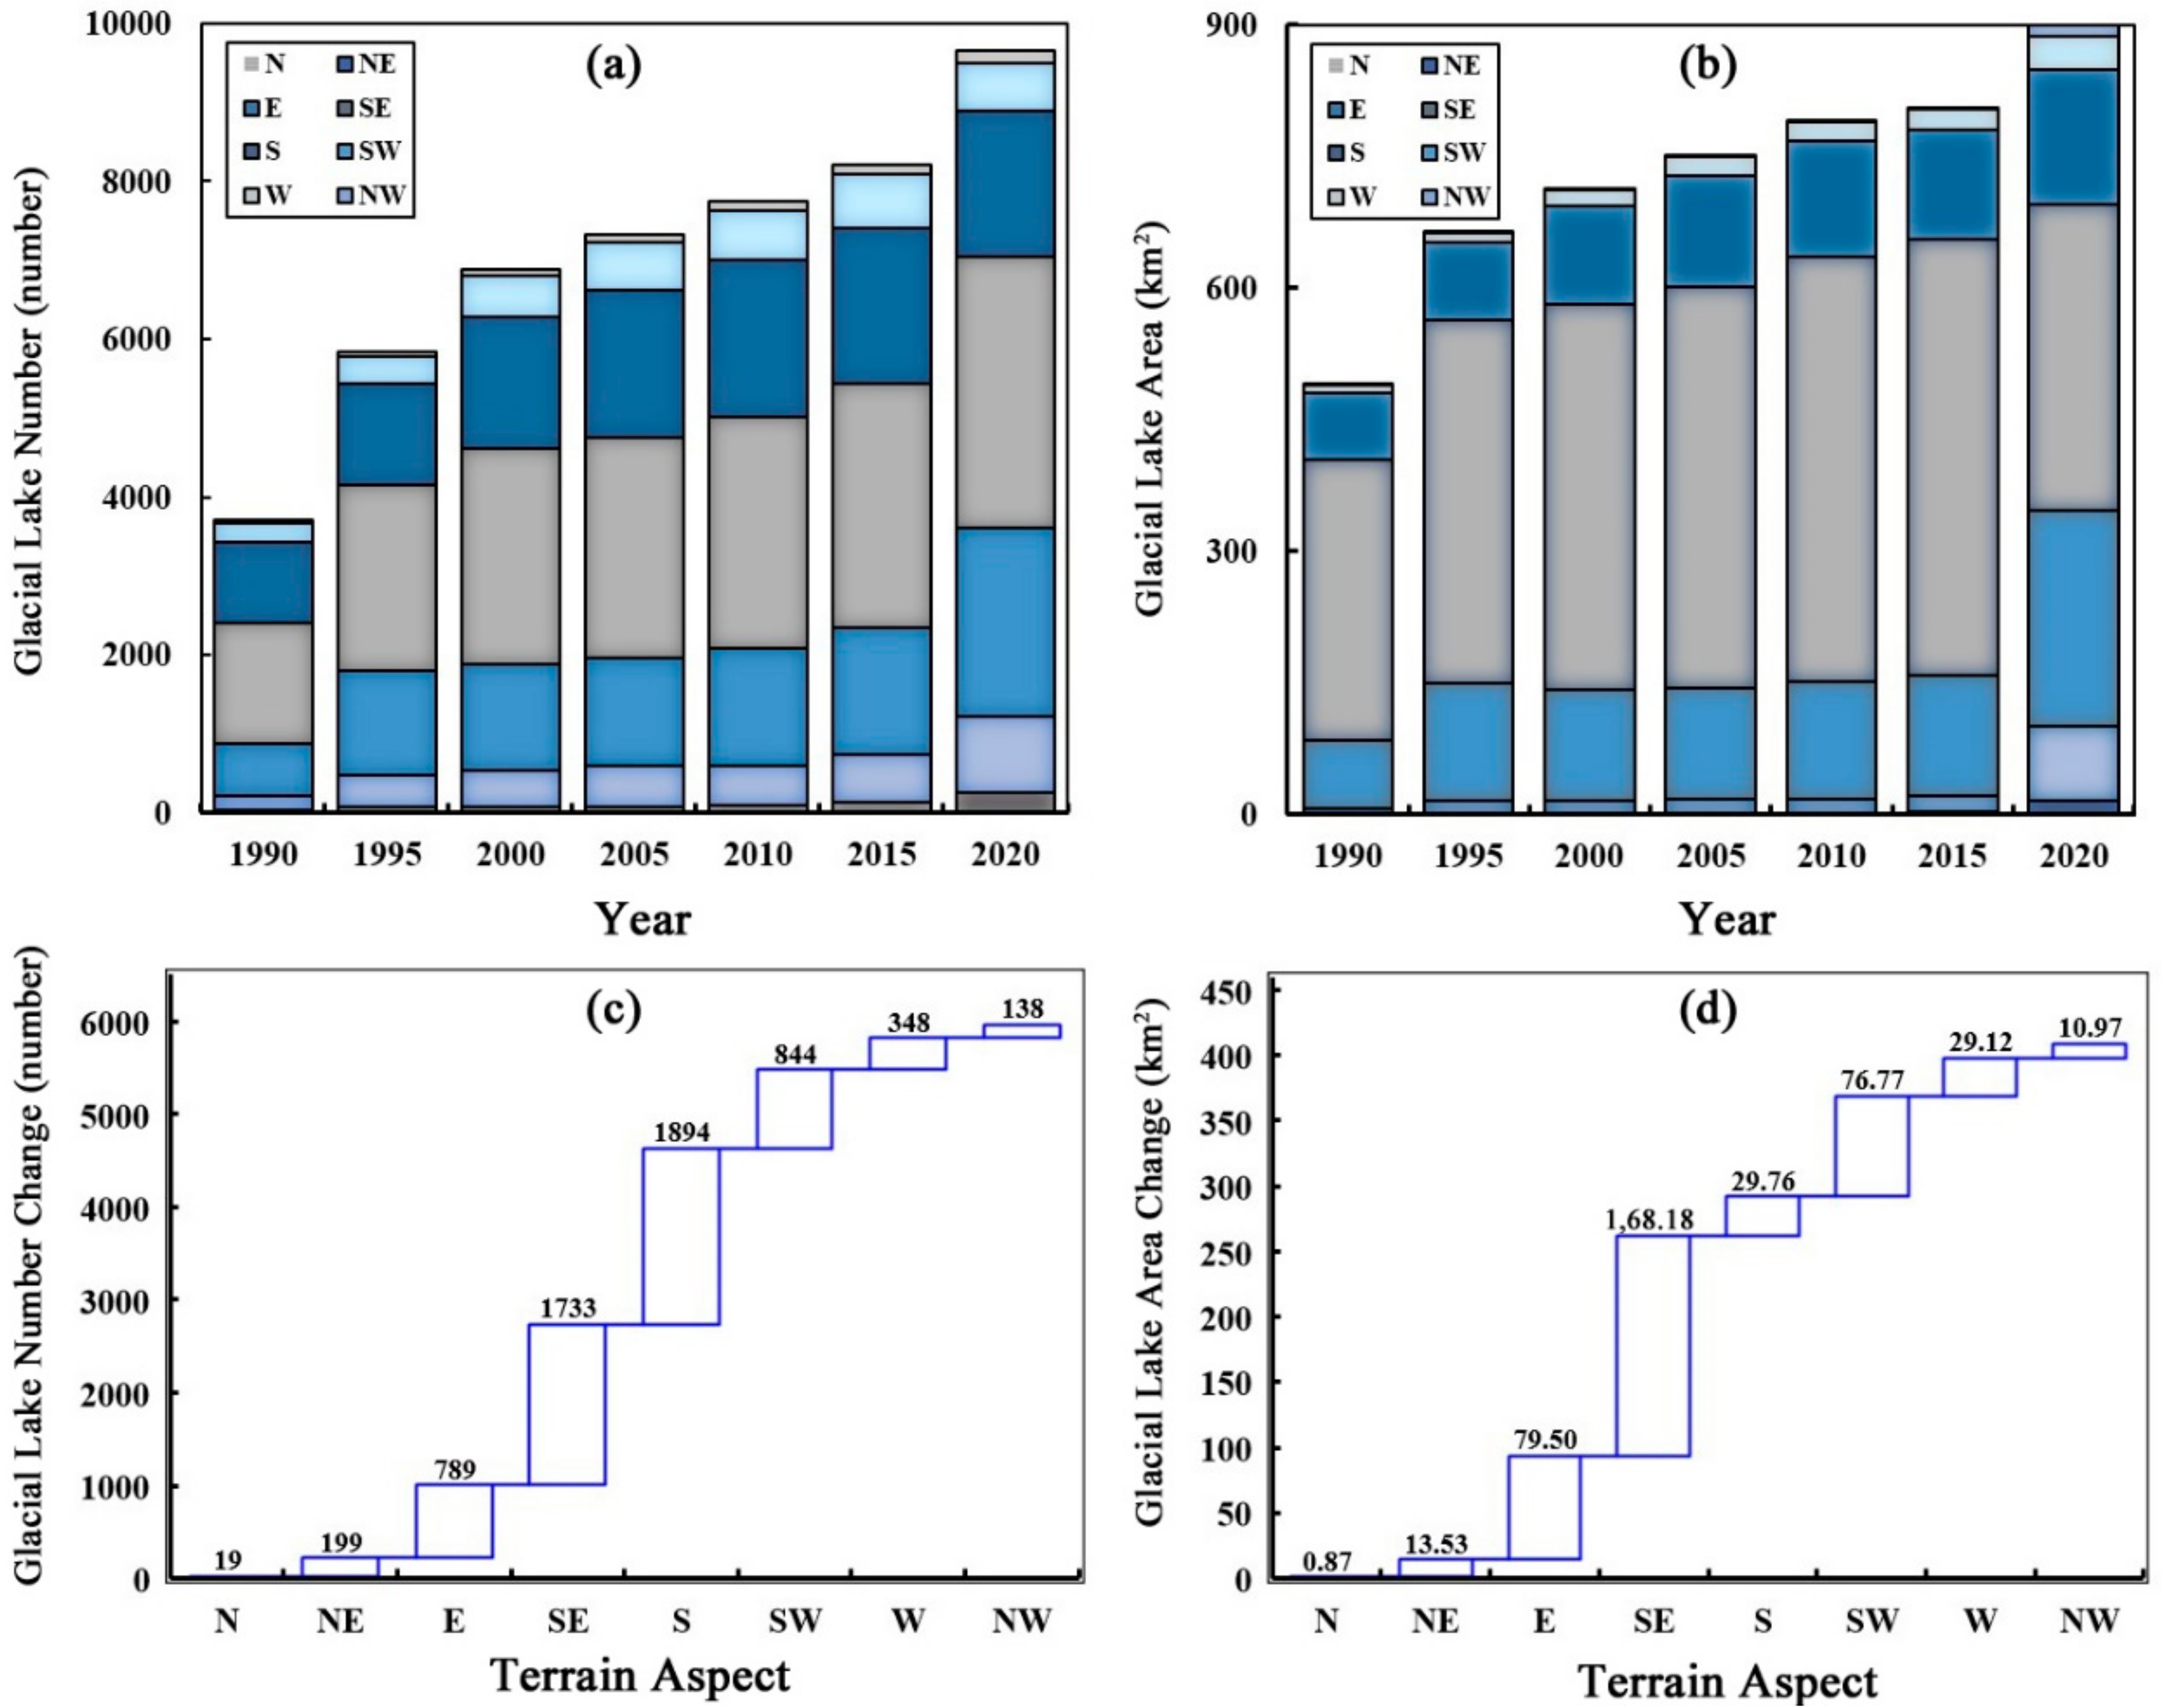
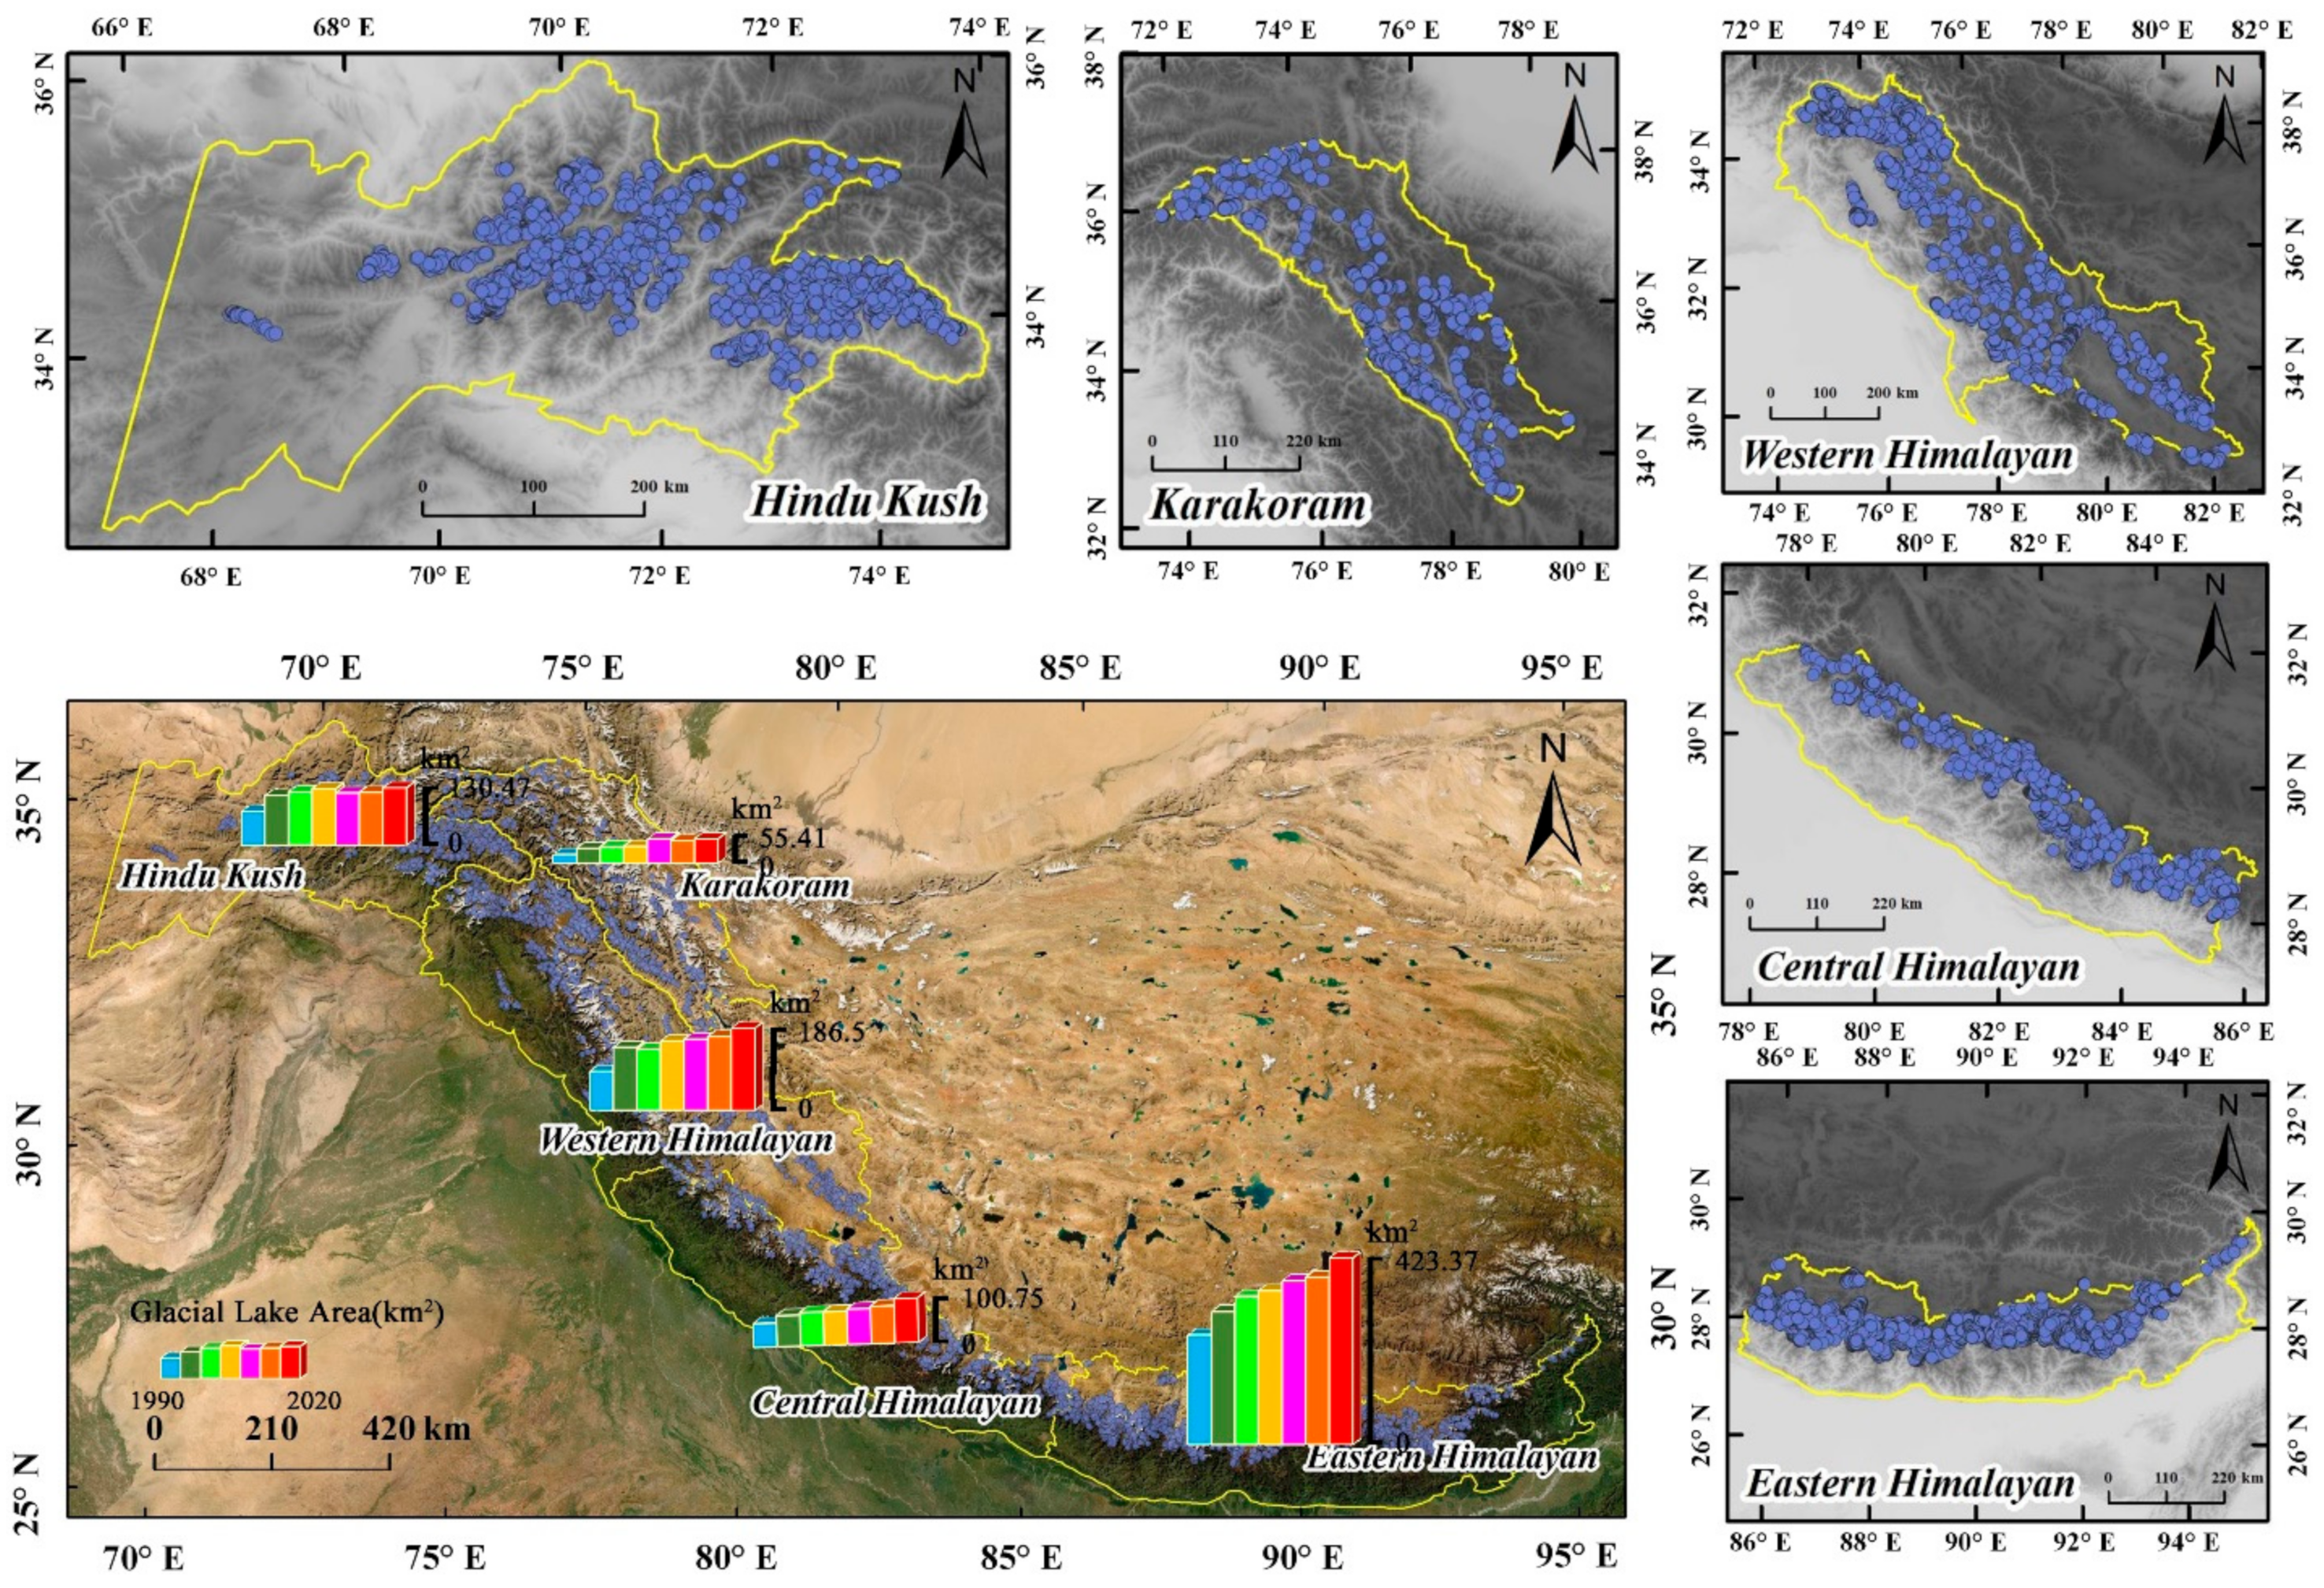
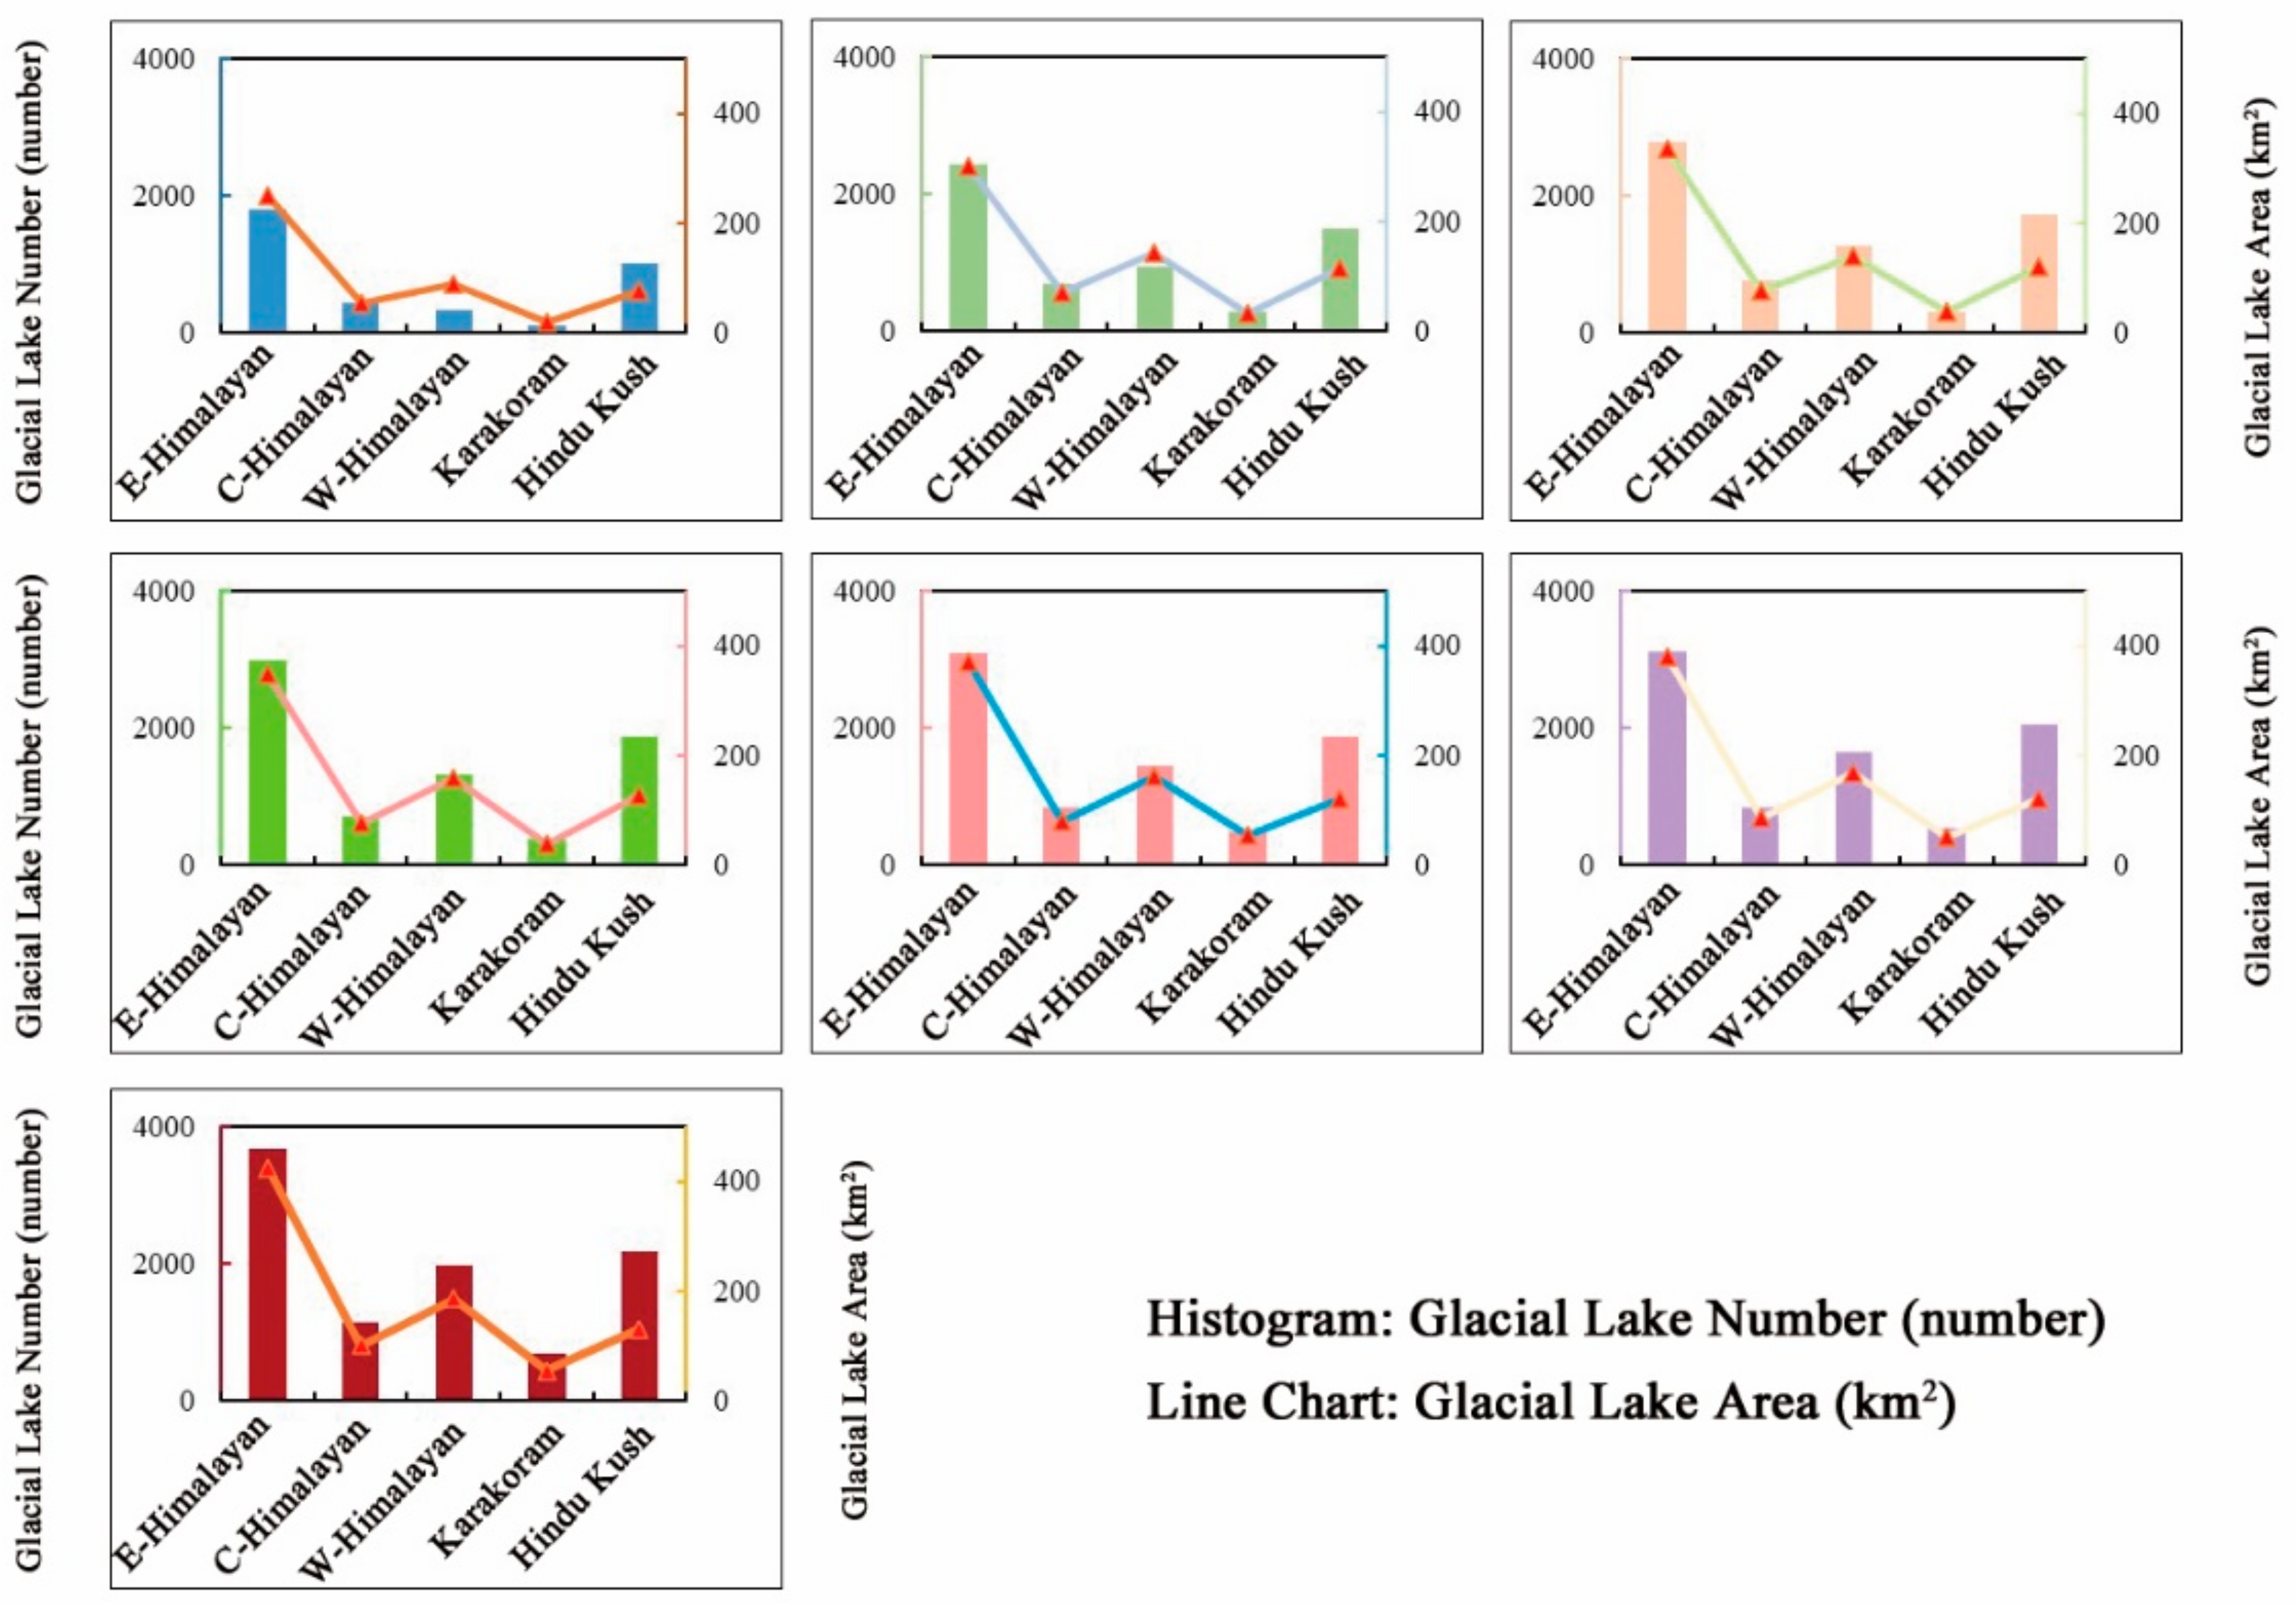


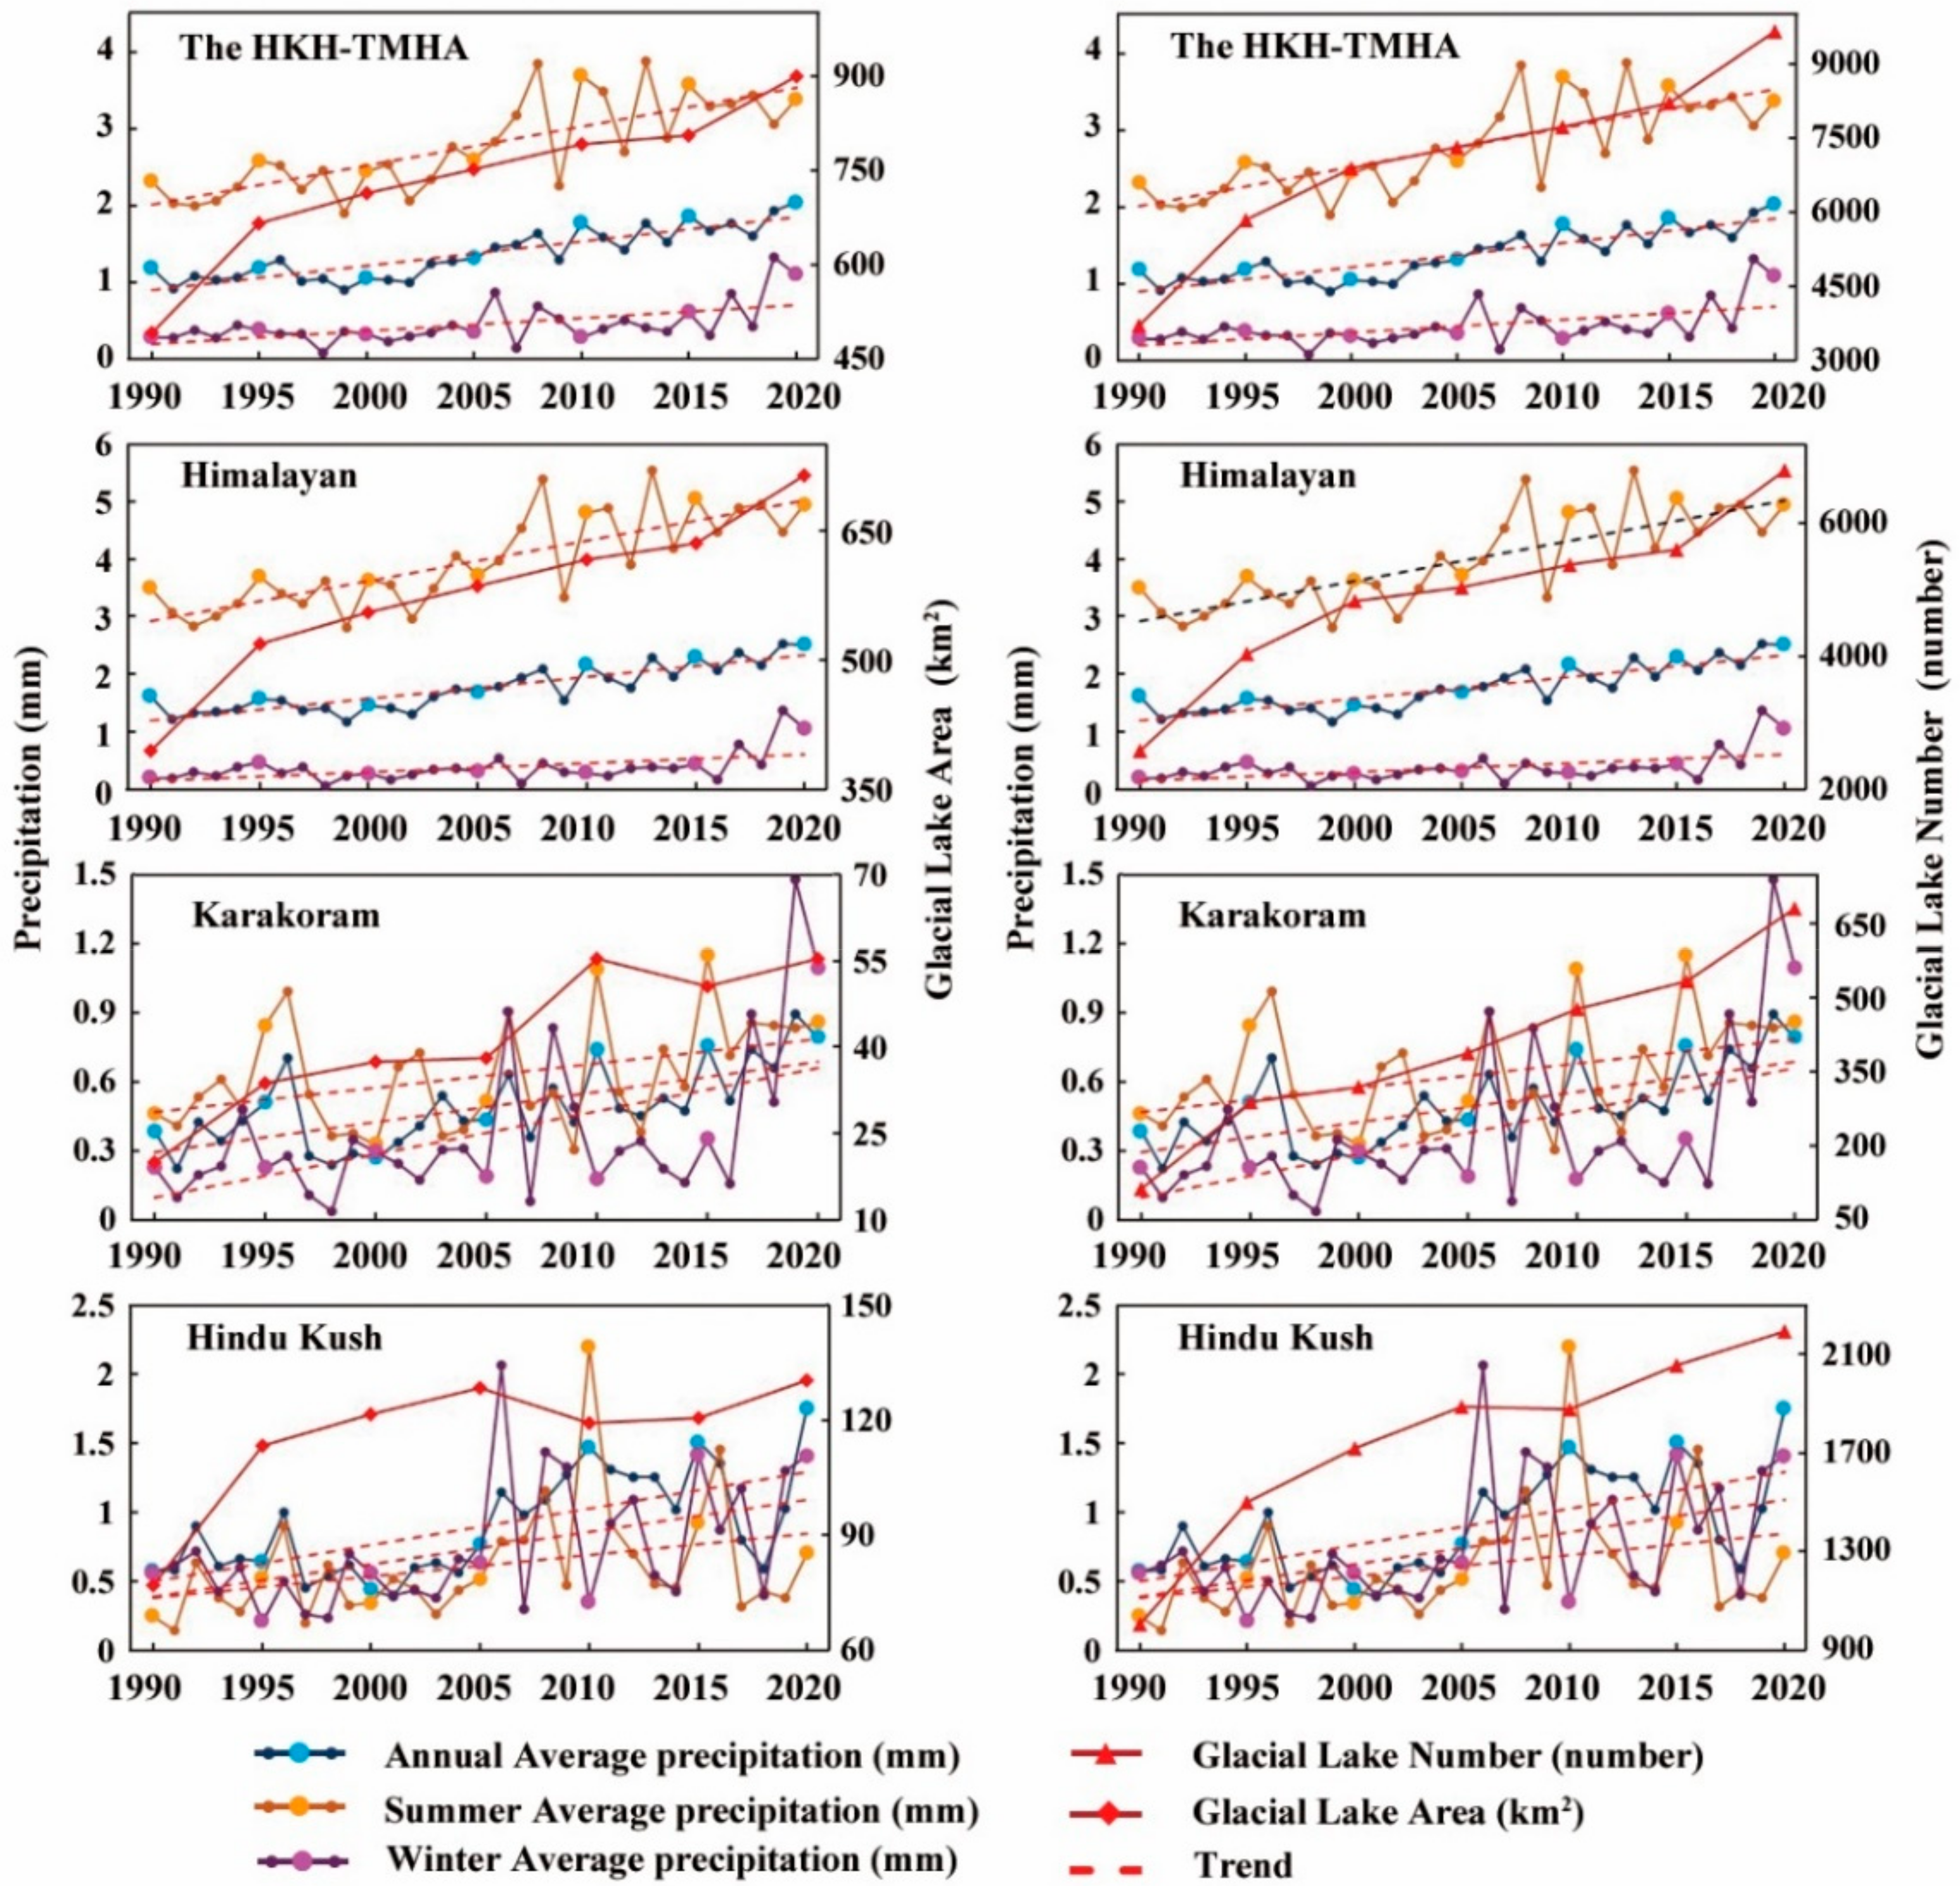
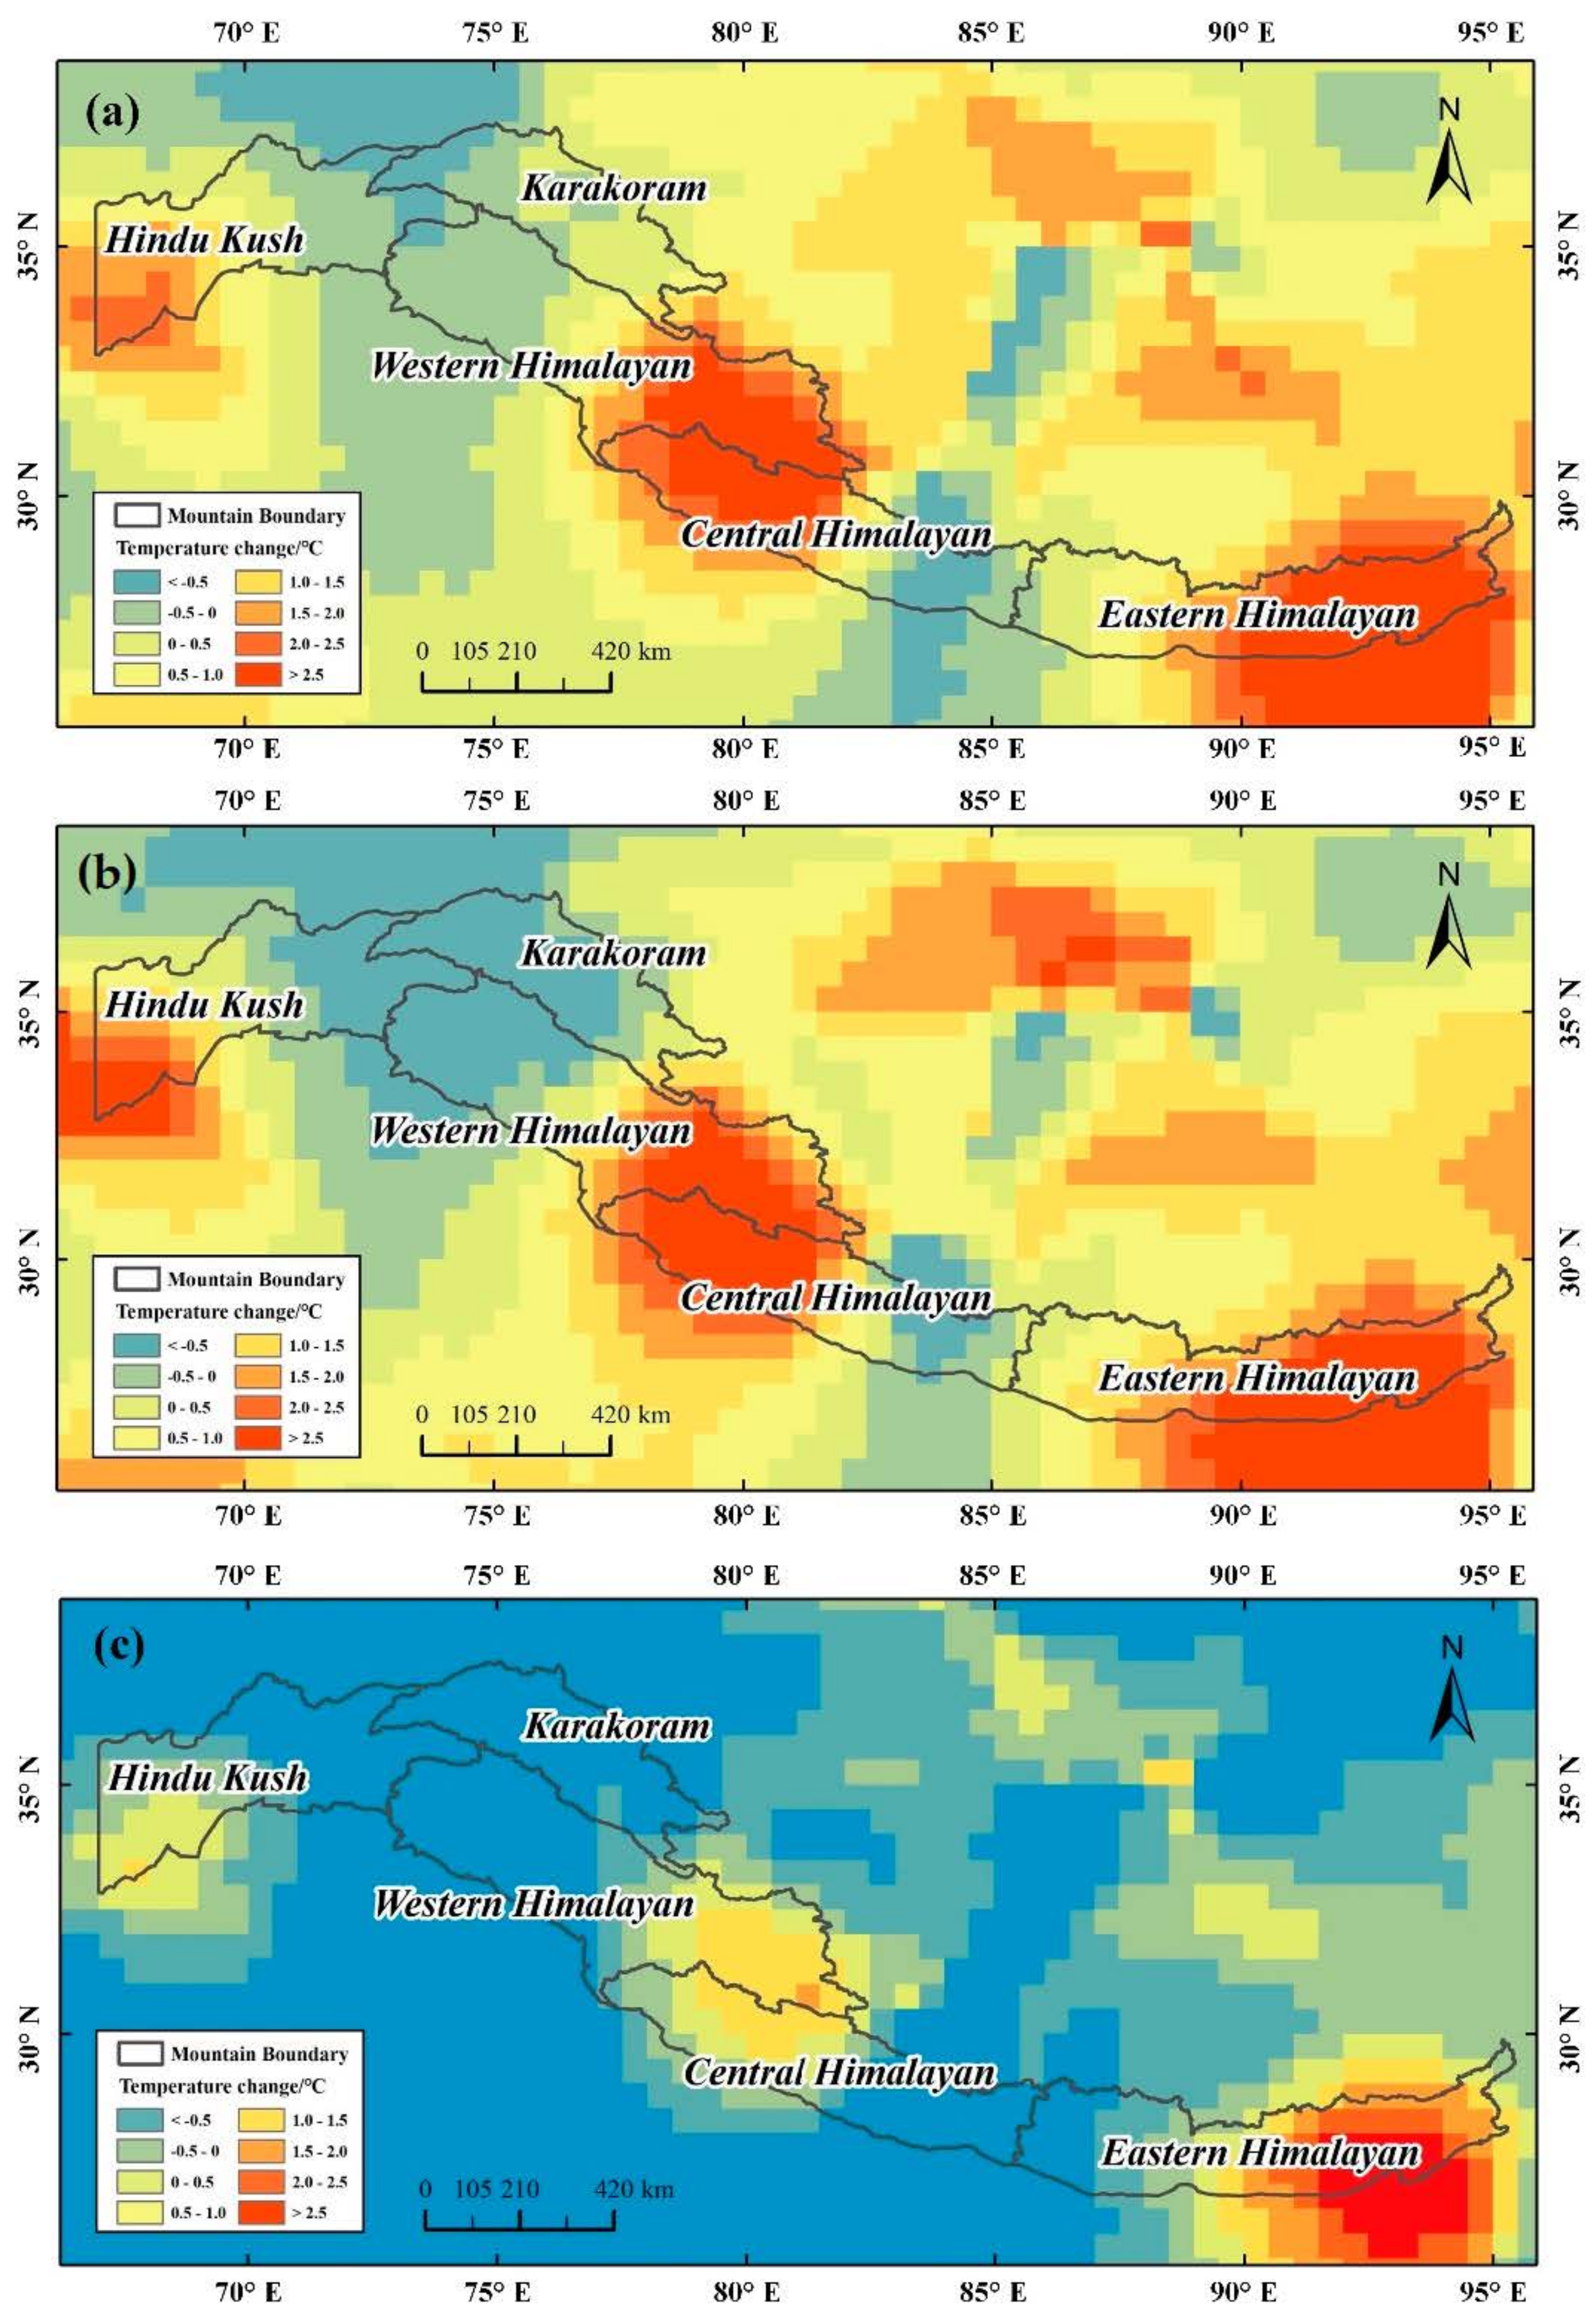
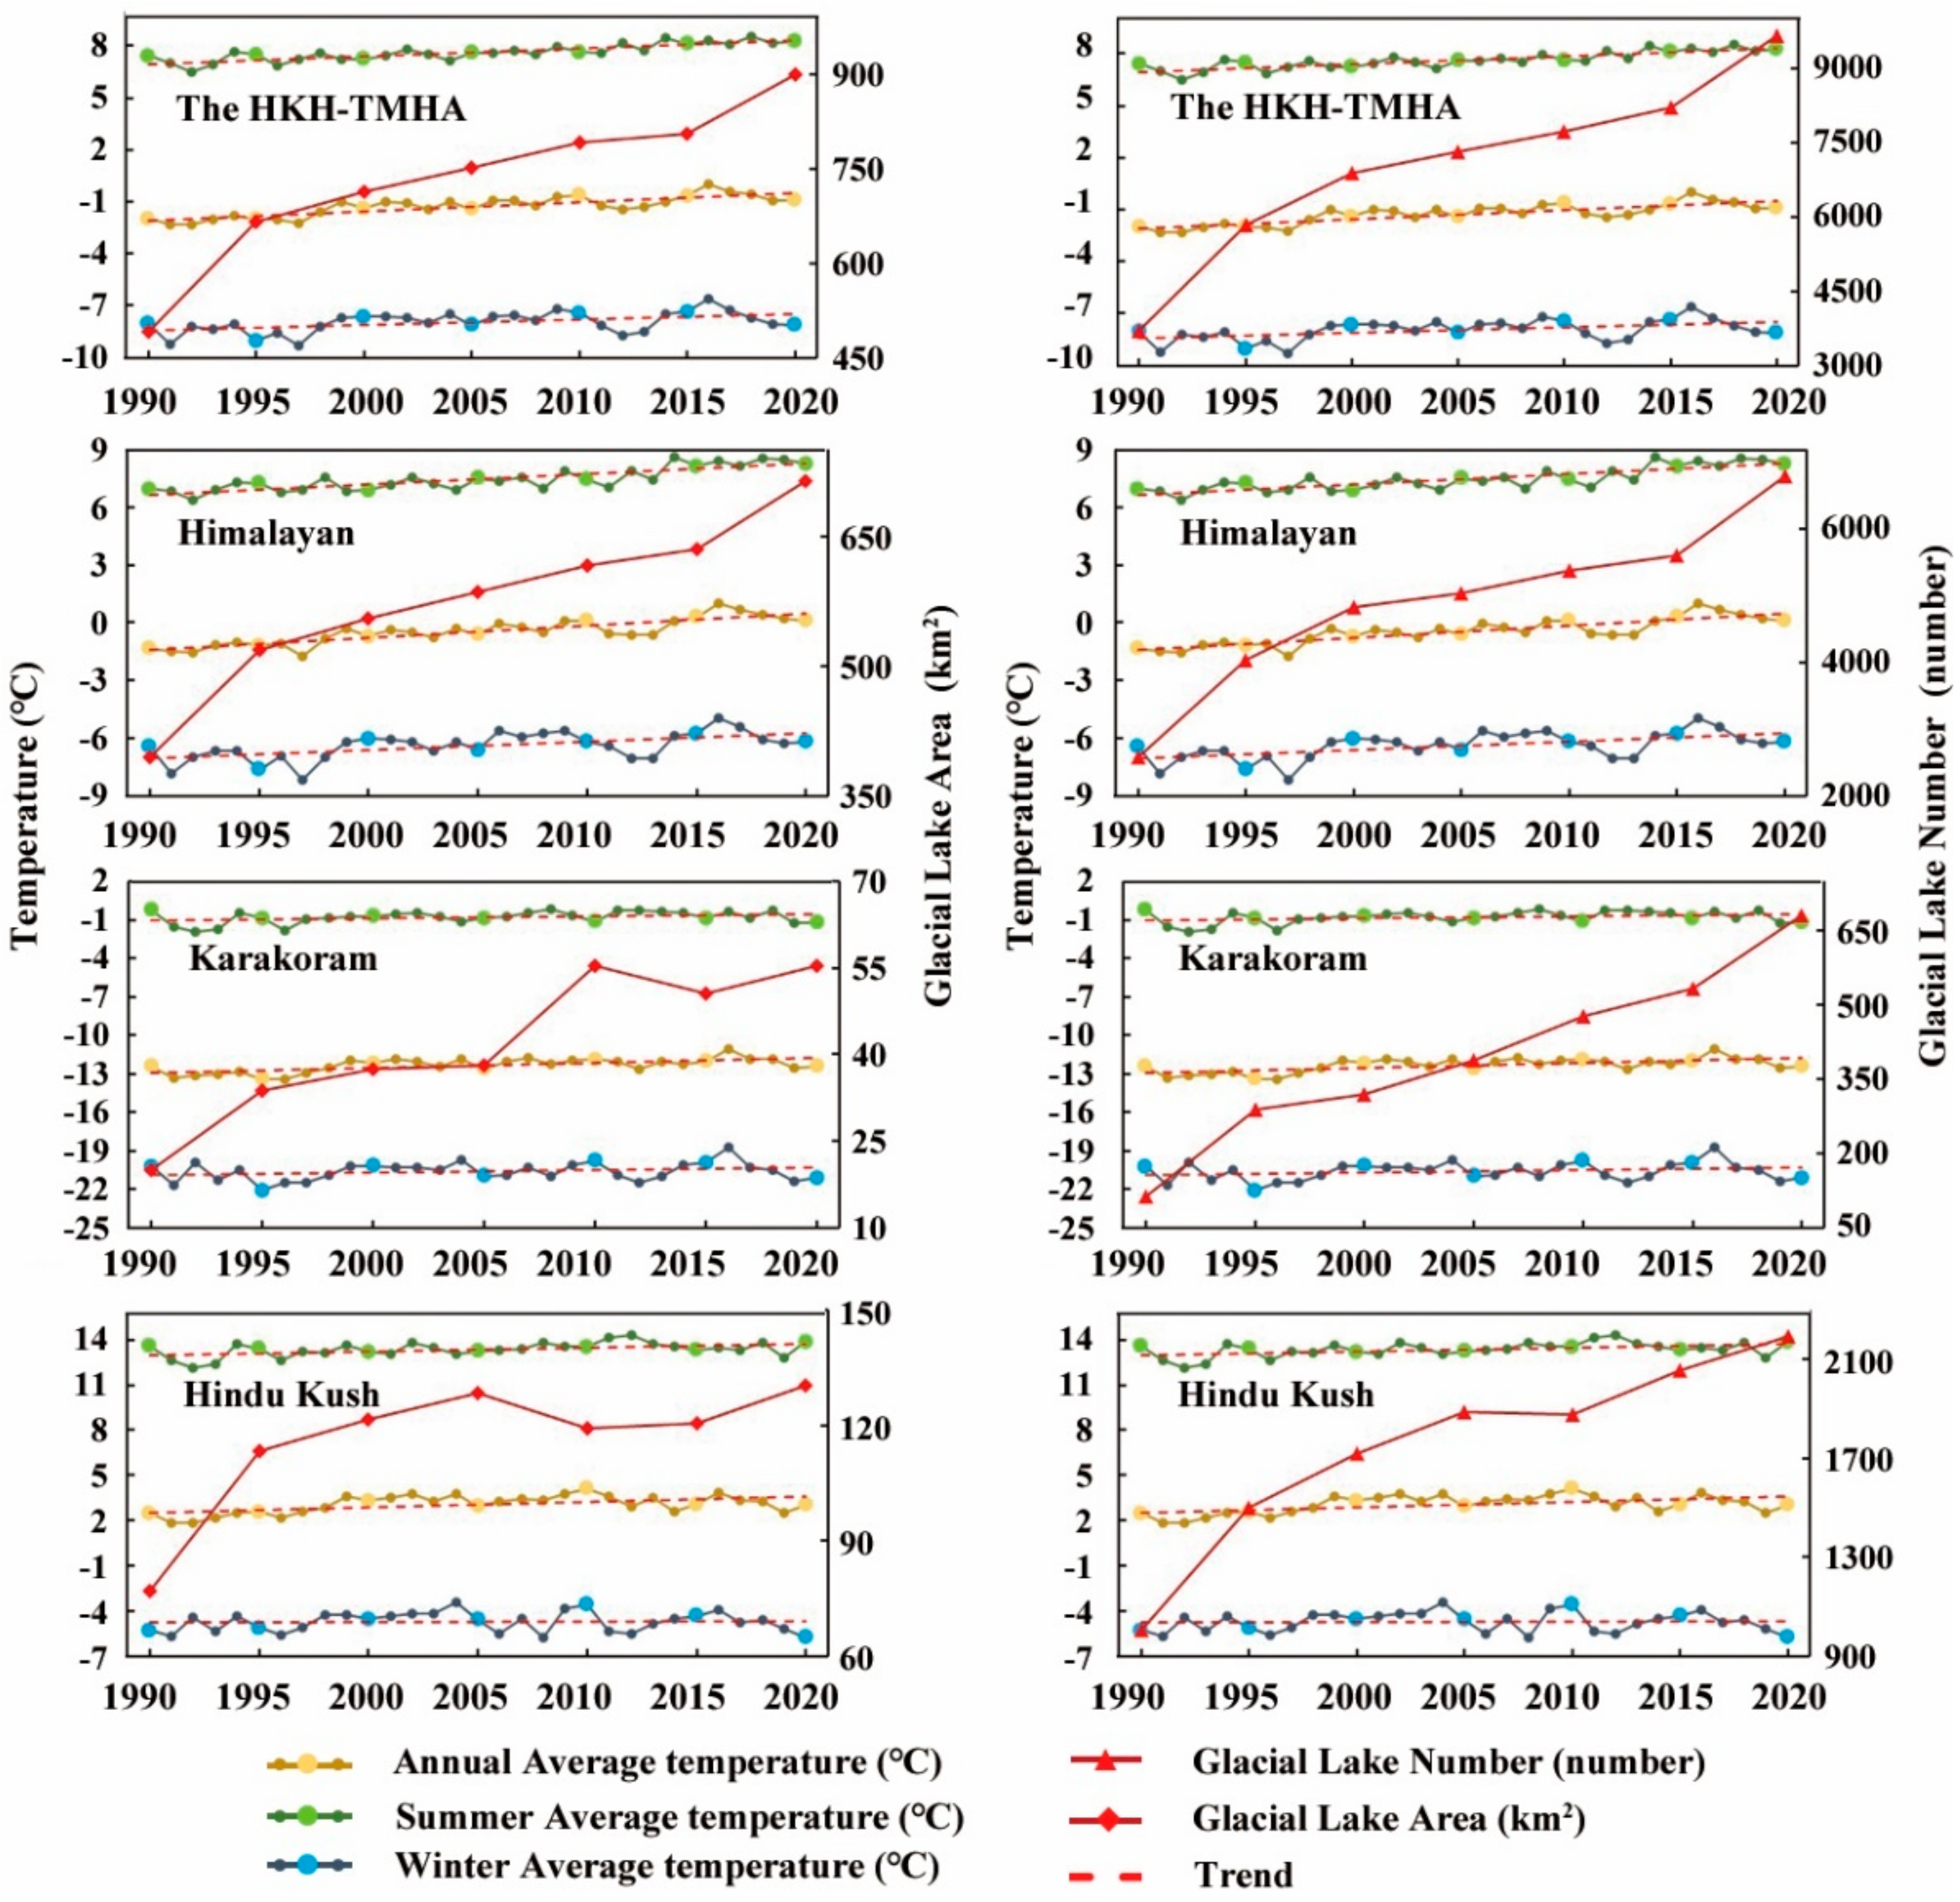
Publisher’s Note: MDPI stays neutral with regard to jurisdictional claims in published maps and institutional affiliations. |
© 2022 by the authors. Licensee MDPI, Basel, Switzerland. This article is an open access article distributed under the terms and conditions of the Creative Commons Attribution (CC BY) license (https://creativecommons.org/licenses/by/4.0/).