Communication

Coastal Topo-Bathymetry from a Single-Pass Satellite Video: Insights in Space-Videos for Coastal Monitoring at Duck Beach (NC, USA)

by
Rafael Almar
1,*,
Erwin W. J. Bergsma
2,
Katherine L. Brodie
3,
Andrew Spicer Bak
3,
Stephanie Artigues
2,
Solange Lemai-Chenevier
2,
Guillaume Cesbron
1 and
Jean-Marc Delvit
2
1
LEGOS (IRD/CNRS/Toulouse University/CNES), 14 Av. Edouard Belin, 31400 Toulouse, France
2
EOlab, Centre National d’Etudes Spatiales (CNES), 18 Av. Edouard Belin, 31400 Toulouse, France
3
U.S. Army Engineer Research and Development Center, Coastal and Hydraulics Laboratory, 1261 Duck Rd, Duck, NC 27949, USA
*
Author to whom correspondence should be addressed.
Remote Sens. 2022, 14(7), 1529; https://doi.org/10.3390/rs14071529
Submission received: 31 January 2022 / Revised: 25 February 2022 / Accepted: 16 March 2022 / Published: 22 March 2022

Abstract

:
At the interface between land and sea, the shoreface of sandy coasts extends from the dune (up to tens of meters above the sea level) to below the depth of the closure (often tens of meters below sea level). This is a crucial zone to monitor in order to reduce the uncertainty associated with forecasting the impact of storms and climate change on the coastal zone. At the same time, monitoring the dynamic interface between land and sea presents a traditional challenge for both in situ and remote sensing techniques. Here, we show the potential of using a video from a metric optical satellite sensor to estimate the emerged topography and submerged bathymetry over a single-pass. A short sequence (21 s, 10 Hz) of satellite-images was acquired with the Jilin-1/07 satellite covering the area in the vicinity of the Field Research Facility (FRF) at Duck (North Carolina, USA). The FRF site is regularly monitored with traditional surveys. From a few satellite images, the topography is reconstructed using stereo-photogrammetry techniques, while the bathymetry is inversed using incident waves through time-series spatio-temporal correlation techniques. Finally, the topography and bathymetry are merged into a seamless coastal digital elevation model (DEM). The satellite estimate shows a good agreement with the in situ survey with 0.8 m error for the topography and 0.5 m for the bathymetry. Overall, the largest discrepancy (more than 2 m) is obtained at the foreshore land–water interface due to the inherent problems of both satellite methods. A sensitivity analysis shows that using a temporal approach becomes beneficial over a spatial approach when the duration goes beyond a wave period. A satellite-based video with a duration of typically tens of seconds is beneficial for the bathymetry estimation and is also a prerequisite for stereo-based topography with large base-over-height ratio (characterizes the view angle of the satellite). Recommendations are given for future missions to improve coastal zone optical monitoring with the following settings: matricial sensors (potentially in push-frame setting) of ∼100 km2 scenes worldwide; up to a monthly revisit to capture seasonal to inter-annual evolution; (sub)meter resolution (i.e., much less than a wavelength) and burst of images with frame rate >1 Hz over tens of seconds (more than a wave period).

1. Introduction

Coastal morphology continuously evolves in response to waves and currents. This evolution can be dynamic—a single storm can drastically reshape the coast, but only a tiny fraction of the world’s coasts are intensively surveyed by hydrographic and geographic national services (less than 1% of the continental shelf each year) to quantify these changes. As a result, nautical charts and Digital Elevation Models (DEMs) are often decades old [1,2,3]. This leads to uncertainty in forecasting the impact of storms and climate change [4,5]. Recent literature suggests that a well calibrated model and representative pre-storm bathymetry and up-to-date satellite bathymetry [6], even at a first order, can provide adequate coastal waves and erosion forecasts. In addition, bathymetry has been shown to be important for modeling wave runup accurately [7] and identifying erosional hotspot locations [8]. The characterization of physical properties of the coastal zone [9,10] is thus needed for hazard assessments such as flooding and erosion.
Conventional coastal monitoring with in situ measurements (DGPS for topography and echosounder on small boats for nearshore bathymetry) are reliable but sparse in time and are often limited to focused locations. More recent approaches with drones [11,12,13] and video-based techniques [14,15,16] can provide a more efficient collection approach but are also limited locally. DEMs derived from remote sensing techniques, such as airborne LiDAR (Light Detection and Ranging), are one of the solutions to obtain these data [17] at a larger spatial scale with a good accuracy, but these airborne LiDAR acquisitions remain limited in revisit rate (to yearly at best), such as in the Litto3D french national initiative [18] or the Coastal Zone Imaging Lidar (CZMIL) used within the United States’ National Coastal Mapping Program [19]. However, to fully understand beach-morphodynamics at local to regional scales and produce accurate estimates of coastal change, particularly the exchange of sediment between the sub-aerial and submerged shoreface [20], more frequent observation over long timescales is required.
Alternatively, optical satellites are becoming more and more effective tools for monitoring coastlines, with the ability to reach anywhere in the world with increasing revisit times and spatial resolution [3,21,22]. The potential to use these satellites for monitoring the rapid evolution of our coasts, such as the impact of a storm on beach erosion at a regional scale [4,5], abound. Until recently, the attention of the coastal community on satellite earth observations was mainly focused on exploiting single images for shoreline mapping and image classification [23]. However, new missions provide the opportunity for bursts of images (or bands) and even minute-long videos to be collected of the coastal zone. Optical satellites such as Pléiades (CNES/Airbus) deliver high-resolution imagery at any place worldwide. Compared with regular “snapshot” missions, such as Landsat and Sentinel-2, which allow covering only bathymetry, multi-frame images or videos also offer the novel opportunity to derive both topography (from multiple views of the same region) and bathymetry DEMs (from multiple views of the dynamic wave field) during a single pass [24,25,26,27]. This is a game changer for monitoring coastal changes, unlocking a wide variety of applications as it brings to satellite earth observation the third vertical dimension, the relief.
By analyzing stereoscopic pairs of images [28], it is possible to monitor the topography of large coastal areas with submetric vertical errors. Examples using the Pleiades mission are given in [24,26,29].Coastal satellite-derived bathymetry can be achieved thanks to two approaches [4,30]: methods based on the radiative transfer of light in water, and methods based on the influence of bathymetry on waves. Each method/sensor comes with its own strengths, limitations, and scope of applications. Specifically, methods based on the radiative transfer perform better in clear and calm waters, whereas techniques based on water depth inversion from wave kinematics require waves [31,32,33,34,35,36]. Bathymetric inversion codes developed from the wave dispersion relationship make use of the temporal information contained in the spatial images and have been applied to different satellite observations: IKONOS [31], WorldView-2 (McCarthy 2010), SPOT5/6 [34], Sentinel-2 [35], Venµs [27], and Pleiades [25,32]. With the increasing ability to collect video from space, wave-based bathymetry estimates may be able to achieve higher accuracy compared to prior paired-image approaches (e.g., [37]). With higher accuracy, space-based bathymetry estimates may prove useful in monitoring morphological evolution of our coasts, including storm-induced change.
Accurate monitoring of the land–sea interface [21,27] is paramount for developing a robust understanding of coastal change, identifying relationships between shoreface sediment supply and beach recovery [20], and enabling accurate coastal flooding predictions [38]. In this work, we demonstrate how combined stereo photogrammetry and wave-based bathymetry inversion algorithms can be applied to satellite-based videos of the coast to generate seamless coastal topography-bathymetry DEMs.

2. The Satellite Video Acquisition, Pre-Processing and Ground Truth

A 21 s video with an average frame rate of 10 Hz (215 frames) and near metric (1.3 m) resolution over a 50 km2 area was acquired by a Jilin satellite on 7 June 2020 at Duck (North Carolina, USA), in the vicinity of the U.S. Army Engineer Research and Development Center’s Field Research Facility (FRF)—Figure 1. The FRF site is regularly monitored by traditional means and provides high-quality topo-bathymetric surveys from unique amphibious vehicles [39].
Images in Level 1C are first orthorectified and secondly co-registered. For the orthorectification, the Rational Polynomial Coefficient (RPC), delivered with the image, provides a relationship between the satellite image coordinates and the ground coordinates. The planimetric coordinates are referenced using the NASA AMES Stereo Pipeline software (ASP, [40]) with respect to the ellipsoides, and the images are subsequently orthorectified. A co-registration algorithm is applied after to remove altitude-dependent and sensor-specific issues [41] (Figure 1a). This algorithm [42] is developed based on the method of Nuth and Kääb [41] and is a robust analytical solution that is based on the pairs elevation difference residuals, and the study site aspect and slope to correct bias and errors between the DEMs. This co-registration is carried out with the first image in the sequence as reference. The drift observed (~140 pixels) is largely corrected by this co-registration (Figure 1).
The viewfield includes the FRF (Figure 1a). The FRF is a coastal observatory, providing publicly available observations of waves (hourly), tide (every 6-min), and topo-bathymetrical data (monthly) (https://frfdataportal.erdc.dren.mil, accessed on 28 January 2022). During the acquisition, moderate waves of a height of 1.3 m with a rather short period (7 s) were traveling from the South East (120°), which are similar to the yearly average waves conditions of 1.1 m height with 8.4 s [43]. Tide elevations during the satellite video were 0.21 m.

3. Methods to Compute Topography and Bathymetry

The aerial topography computed in this paper is derived from the sensor-level Jilin images using a stereo photogrammetry approach. Two 2 m resolution DEMs are produced using both AMES Stereo Pipeline ASP (NASA) software [40,44] and CARS (CNES) [45,46] using the first and the last image of the sequence.
The workflow of these methods is as follows. The geometric model (described as RPC) can be first refined by the least-squares polynomial fit based on homologous points computation and a coarse DTM (SRTM). Here, this refined RPC was tested as input for CARS. Before performing stereo correlation, the disparity map is computed in epipolar geometry for each pair of images, then the disparity maps for all the stereo pairs are converted to a set of homologous points. The DSM is then computed. The default stereo algorithm in ASP is block matching with various approaches for subsequent subpixel refinement. CARS uses the following: the 3D points can be deduced by the intersection of 3D lines (the 3D lines are computed from homologous points in each image and the associated geometric model).
Finally, the DSM is obtained by rasterizing the previous 3D point cloud.
The bathymetry is computed using the approach developed in [36] based on the Radon Transform [47]. Consistent with the method presented in [36,48], wave propagation is derived from correlation analyses between lagged signals. The time lag d p h a is chosen such that the waves can propagate an observable distance, usually less than a wavelength. d p h a is typically 1–3 s, which provides sufficient time for wave propagation to be captured at a certain celerity C for a given spatial resolution d x while staying lower than a period T (to not overpass the next wave). Two approaches are tested here: temporal (between d p h a lagged timeseries) and spatial (between frames separated by d p h a ). The temporal approach is more suitable for data with a high temporal resolution (large number of frames) and/or low spatial resolution, whereas the spatial approach is more suitable for small numbers of frames and a high spatial resolution. A sensitivity analysis of the performances for the two methods on the number of frames in the sequence and other parameters are provided in Section 4.
For the temporal correlation approach, a cross-correlation analysis is conducted between the time-series of pixel intensity at a single location and the time-series of pixel intensities from neighboring pixels over a certain distance, typically a wavelength. For the spatial correlation approach, a cross-correlation analysis is conducted between windowed image frames, lagged by d p h a , and then aggregated over the whole time series. Both correlation approaches produce a correlation matrix (Figure 2), which can then be analyzed to extract wave celerity and direction, following [36,48], and briefly described below.
The peak direction θ of waves is determined in the Radon (polar) space from the maximum variance. Along this direction, the wavelength (i.e., using zero crossing method or peak detection) and celerity (position of the first peak from ρ = 0 , the radius from the center of the computation window) are extracted. Water depth is then inverted using the linear wave dispersion relationship. This is repeated along the alongshore- and cross-shore directions with a given computation resolution; here, 5 m has been chosen arbitrarily as finer scale features intrinsically cannot be captured anyway. From the computed water depth, the bathymetry is estimated from the mean sea level accounting for the tide level (here, 0.21 m).
The bathymetry and the topography, now in the same vertical datum (mid-tide or mean sea level), are finally on the same 5 m grid.

4. Results

4.1. Coastal Topo-Bathymetry Continuum from Satellite Videos

Figure 3 shows the surveyed and satellite-derived topo-bathymetry.
Regarding the topography, the satellite-derived DEM from CARS shows an average offset of −3.49 m with survey. Interestingly, not using refined RPC in ASP gives an average offset of −16.7 m. This is similar to other global satellite DEMs (i.e., SRTM, CoastDEM, AW3D30), which are also floating in vertical and need a local vertical referencing using ground control points or accurate satellite referencing (such as those provided by IceSat missions 1 [49] and 2 [50]) for further use for temporal monitoring (quantification of morphological change) and flooding risk assessment [9]. Here, the RMSE (Root Mean Square Error) values are 0.8 m (R = 0.8) and 1.8 m (R = 0.2) for CARS and ASP, respectively. In particular, the upper part of the beach and dune top are well captured by CARS for this example. For the two satellite-derived DEMs, the aerial beach shoreface shows large discrepancies due to the lack of texture/features needed by such stereoscopic approaches and the presence of wave-induced swash motion. Of note, the applications of ASP and CARS for coastal topography are given as an illustration, and we do not intend to provide conclusions on their performance with a single application. A further detailed analysis would be required for a complete assessment of their performances with diverse conditions. The RMSEs on topography from a satellite found here are within the range of those obtained at other sites with similar settings/environments (0.5 to 2 m [21,26,29]).
Regarding the bathymetry, the comparison shows a general, good agreement with similar sub-metric RMSE (0.51 m) obtained with shore-based video systems [51] and drones [13] at this site and with other studies using different satellite missions (i.e., VENµS, [27]). The satellite-derived bathymetry accurately estimates the alongshore-averaged offshore slope, the position of the nearshore sandbar, and shoreline slope (Figure 3c), with increasing scatter beyond 8 m. The satellite-derived bathymetry slightly underestimates water depth on the inner side of the sandbar, which could be related to nonlinear wave behavior or noise due to the presence of the shoreline in the cross-correlation windows. The overall range of error complies with the highest standards of the International Hydrographic Organization (IHO) [1]; however, this approach still needs to be tested and replicated for different conditions and at other sites.

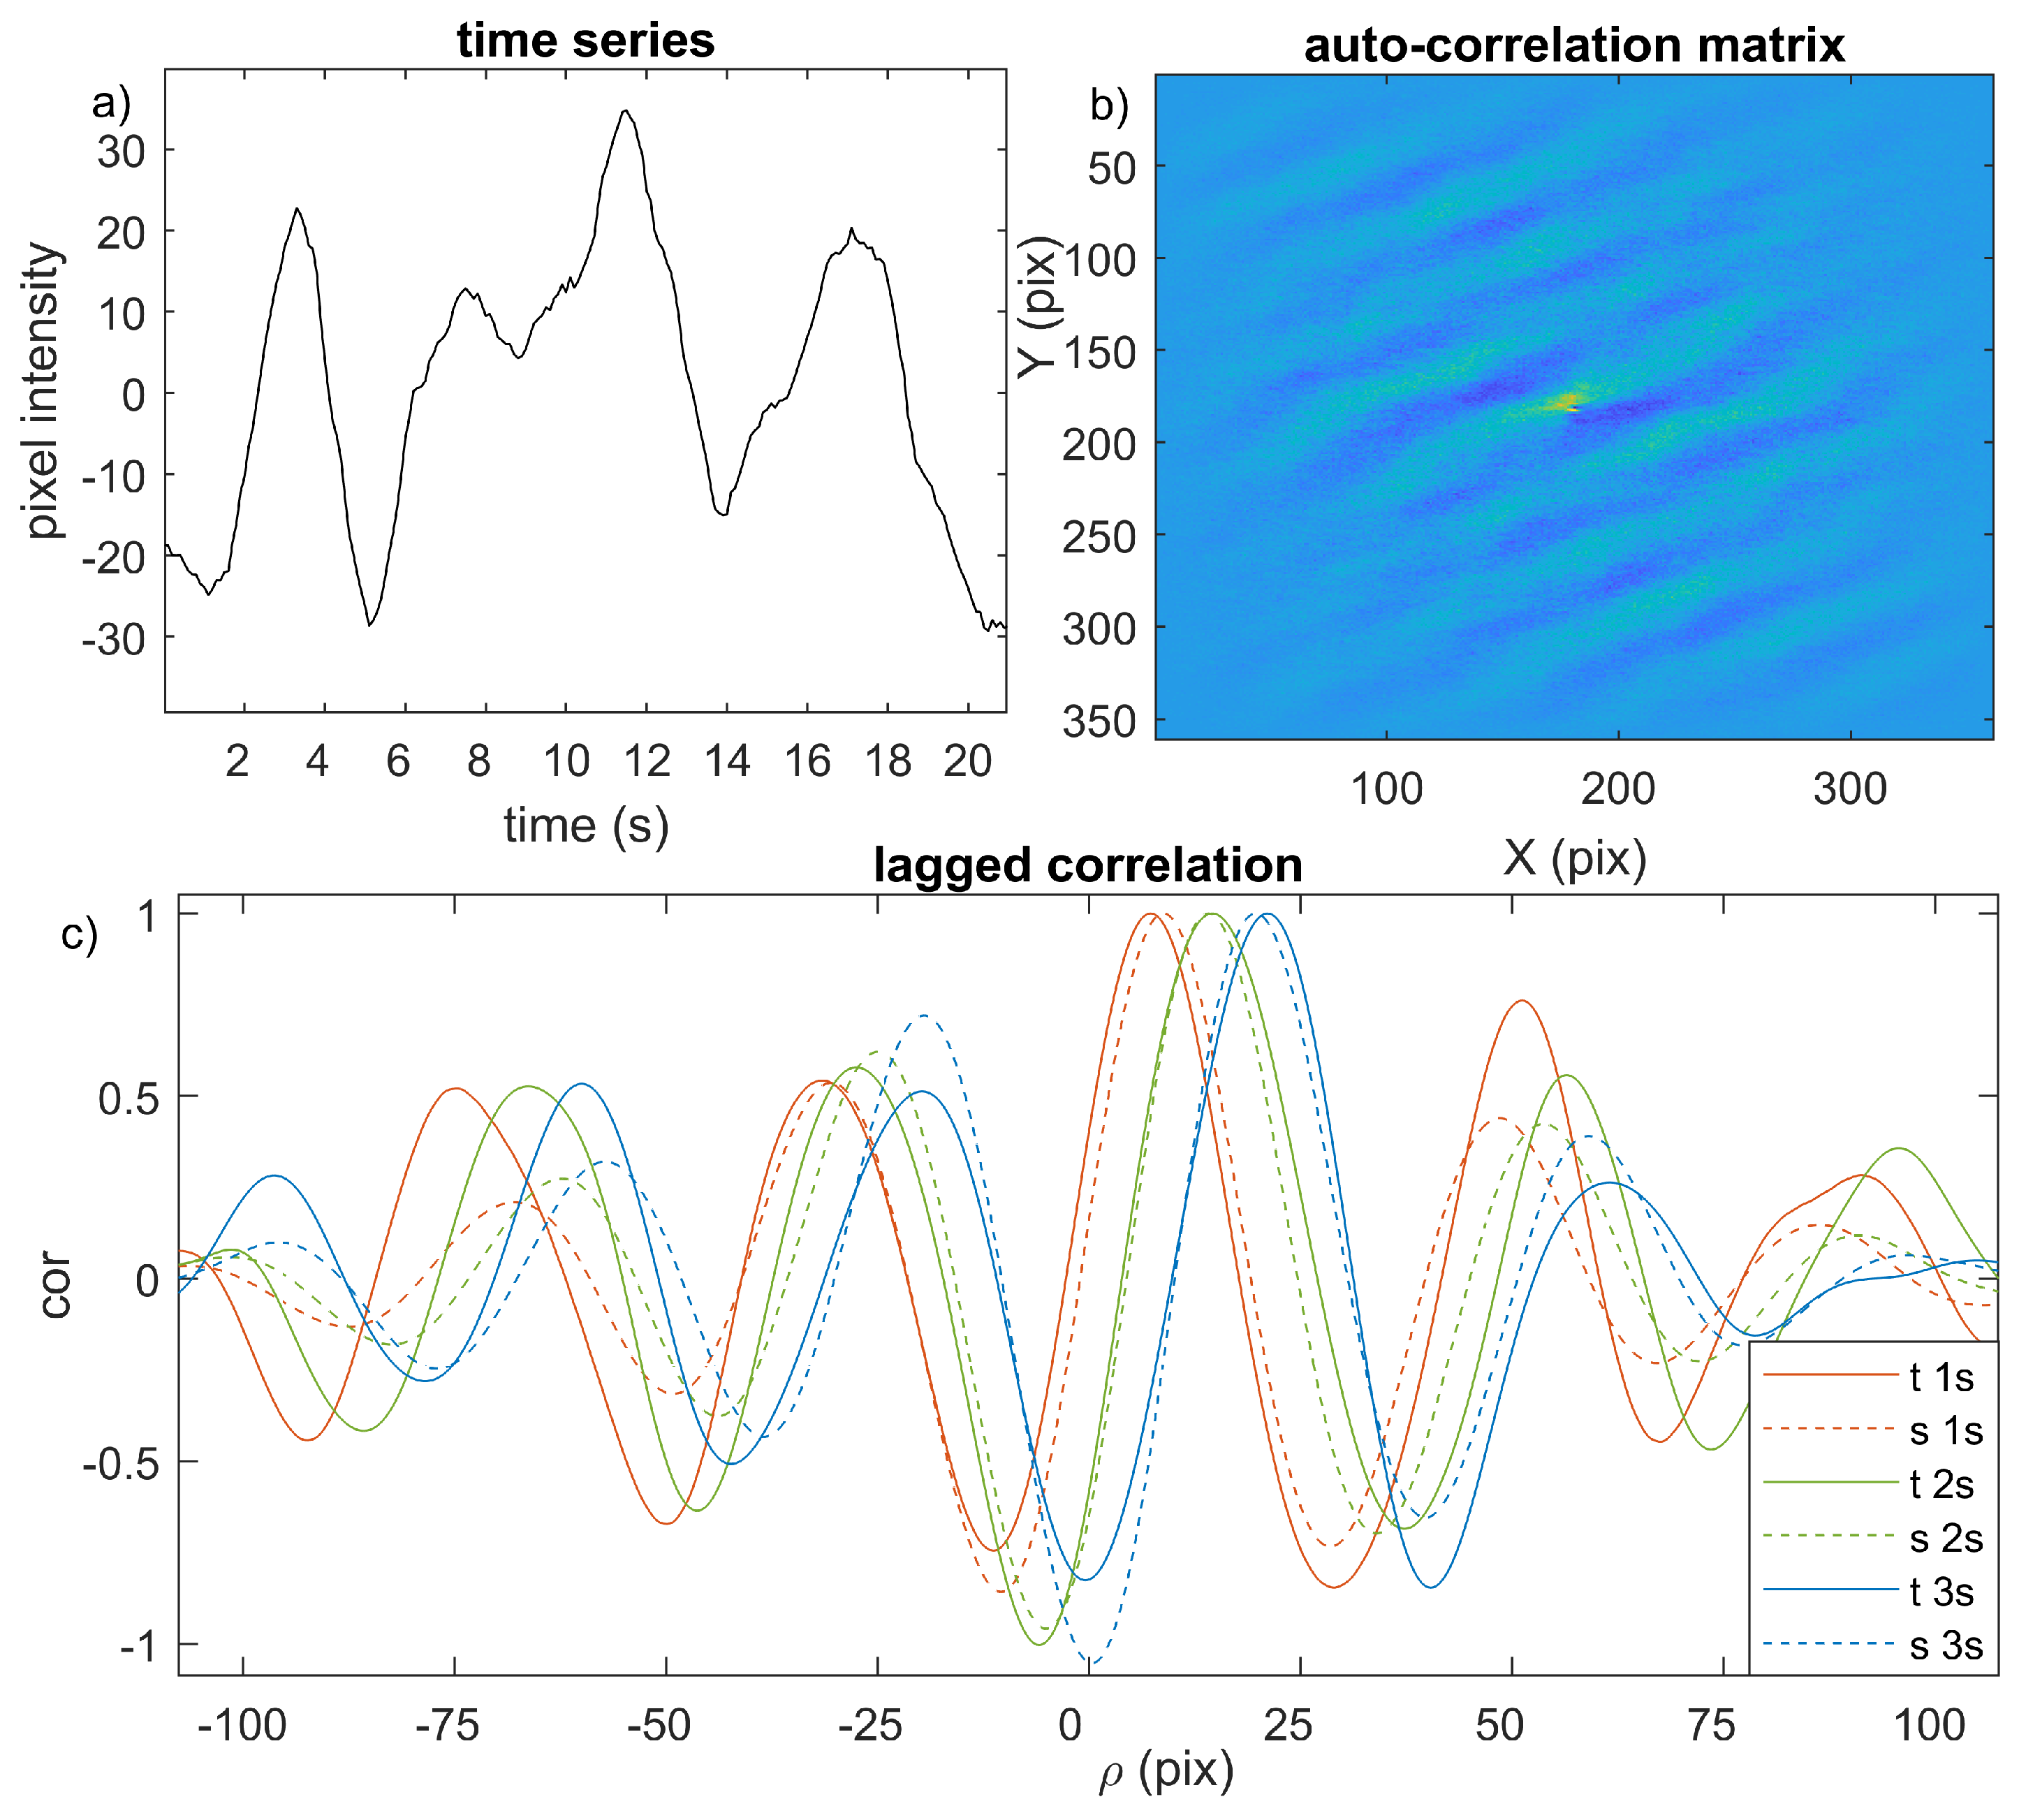
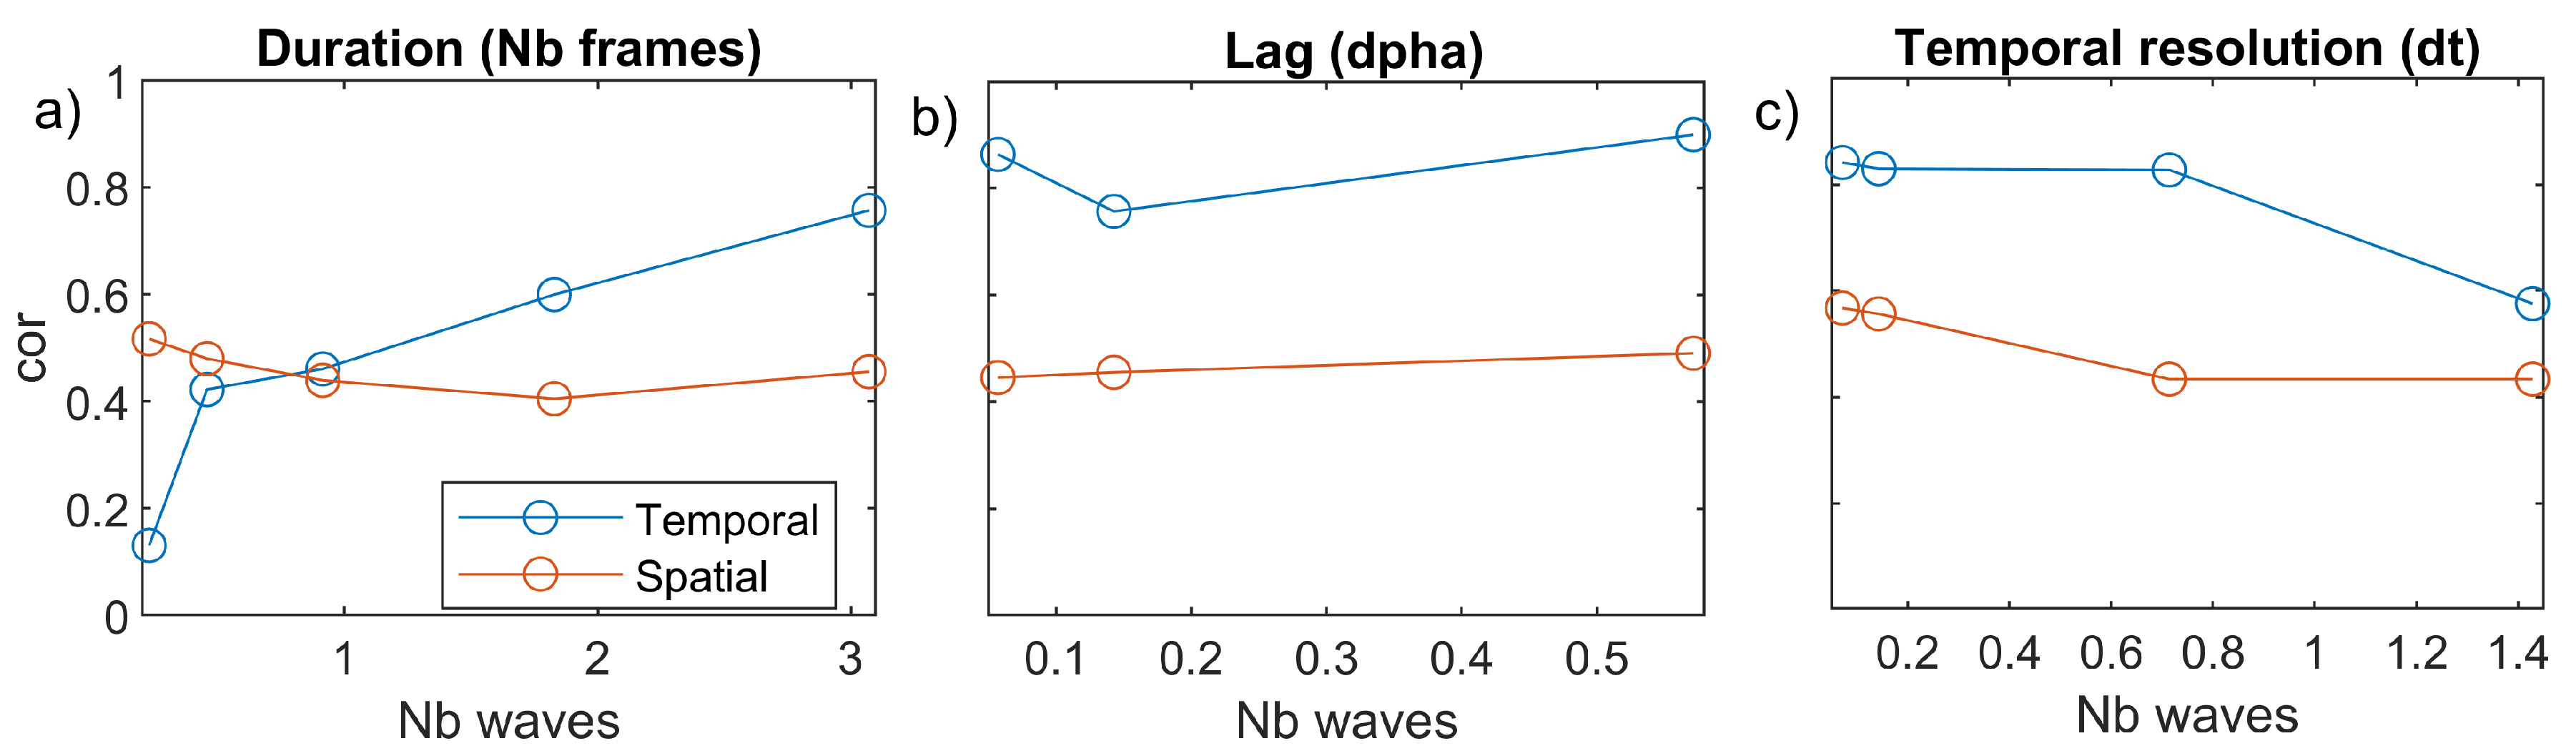
4.2. Temporal Versus Spatial Approaches in Retrieving Wave Kinematics to Inverse Bathymetry from Satellite Videos

To derive wave characteristics, the temporal correlation method presented by [36] (originally using Pleiades-Airbus/CNES-sub-metric 12-images sequence with frame rate around 8 s) is used in the application presented in Figure 3. Here, we also compute the bathymetry with the spatial approach (see Section 3). Contrary to the integrative approach of the temporal method where all the frames are used in once, paired correlation is repeated over the time-series and a composite is obtained over the full video duration. When reducing the number of frames in the sequence, the performance of a spatial approach over pairs of images (such as using spectral approach in [35] on Sentinel-2 2 spectral bands) could overpass the temporal approach (such as with minute-long videos in [14,15,52,53,54,55]). This is tested here.
A sensitivity analysis is conducted on the bathymetry estimation performance with the temporal and spatial approaches used to derive the correlation matrix (see Section 3), together with the method parameter ( d p h a ), external video duration (number of frames), and temporal resolution. The results in Figure 4 show that using temporal information becomes beneficial compared with spatial information (here, windows of about 1 wavelength) from about 1 wave period. In other words, it is better to use the dimension that offers more information, either spatial or temporal. For long video sequences with a duration longer than T, methods based on a temporal approach are beneficial [14,15,53,54,55] and are thus recommended. The two approaches do not show a sensitivity to the lag between images d p h a in the sequence, as long as d p h a remains lower than T. The performance of the two approaches decreases with temporal resolution d t (of note, here d p h a was taken equal to d t when d t > T ), as long image sequences with d t (or/and d p h a ) give more time for waves to propagate, transform, and look different [56] and thus become harder to match.

5. Recommendations for Future Missions: Designing a Coastal-Oriented Mission

The wave-based approach for deriving bathymetry works well in conditions where colour-based approaches [57,58,59,60,61,62] can struggle, namely in turbid or optically deep water, which is most of the open coastline worldwide where waves are experienced [63]. For example, recent work has shown the success of applying a wave-based approach to generate global coastal bathymetry from Sentinel-2 using a similar method [37]. That effort demonstrated that wave-based bathymetry algorithms can be applied to the full diversity of coastal environments from sandy to rocky coasts, even in locations with complex bathymetric features.
Coastal morphology changes over a wide range of timescales, including storm events, seasonal and inter-annual variability, and even longer-term adaptation to changing environmental conditions that can effect the incoming wave regime [52,64,65], as well as human intervention. Despite their high potential, satellite-derived coastal DEMs from sequences of image frames have only been applied to localized space and time domains, and further efforts are needed to apply these approaches to map nearshore topo-bathymetry and its time-evolution at a larger scale [2,5,66].
Questions of trade-off in the combination of the acquisition settings remain. The swath of Jilin is smaller than other missions, such as Pleaides and VENµS (and even more different than the 10,000 km2 of Sentinel-2), but Jilin videos offer a longer duration in time at an advantageous frame-rate: short compared to a wave period with dt/dx small compared with celerity. Satellite video at an even higher resolution, such as WorldView and Planet, focuses on an even smaller area despite proving longer videos [3,22]. Lastly, the revisit is important, regular 2-day revisits, such as VENµS phase 3 [27] (now daily in phase 5), offer the possibility of capturing topo-bathy changes despite lower performances (due to coarser resolution and reduced number of frames). The Sentinel-2 mission also offers a 5-day revisit but cannot produce as accurate bathymetry and topography [37,63]. When determining a roadmap (Figure 5) for future satellite missions designed to monitor the coastal zone, the following factors should be considered:
  • Swath: In general, the need for high-accuracy DEM is local—a few tens to hundreds of square kilometers, localized at the shoreline in shallow water where the bed evolves rapidly under the action of varying hydrodynamics;
  • Resolution: typically, there is no big constraint for the bathymetry retrieval where meters are sufficient but rather for the topography estimation, which directly depends on the pixel resolution;
  • Revisit: not necessarily daily to capture the event scale but typically monthly and seasonal evolution, which represents a reasonable target for coastal studies and management;
  • Video duration and frame rate: to capture wave kinematics, tens of seconds covering 2–3 waves (with periods ranging from 5 to 25 s typically) are a minimum to reduce the stochastic influence of the wave field in order to accurately inverse bathymetry. A long duration is also important to allow stereo photogrammetry on land (large base-over-height ratio typically −0.1, 0.2 give good results for flat areas, while small base-over-height ratio are better for steep areas), as in coastal zones dunes and beach generally present slopes of 0.01 to 0.1 [67]. The frame rate is important and should remain higher than 1 Hz, staying a small fraction of wave period.
Lastly, a push-frame acquisition strategy is recommended (when compared with push-broom sensors such as Sentinel-2, Pleiades, VENµS), as it introduces less bias for wave kinematics computation. Overall, both stereogrammetry and wave kinematics estimation require a good satellite geometry [27].

6. Conclusions

This study demonstrates the potential of using short (tens of seconds) satellite videos at the regional scale (~100 km2) to estimate coastal topo-bathymetry DEMs. As a difference with single images (such as multi-spectral Sentinel-2 over ~1 s), satellite video offers the possibility to monitor scenes with different view angles for topography estimation and wave propagation for bathymetry estimation. Topography is computed from (tri-)stereoscopic methods. Bathymetry is derived from wave kinematics calculated using the space–time correlation. The satellite-derived DEM shows good agreement (metric accuracy) when compared with ground truth, with sub-metric accuracy and maximal discrepancy at the shoreline. Two correlation approaches were evaluated for the wave kinematic algorithm, with a sensitivity analysis suggesting that the temporal approach becomes beneficial over a spatial approach when the duration goes beyond a wave period. Long periods of time (typically tens of seconds) are also a prerequisite for stereo-based topography. Recommendations are given for future missions to improve the monitoring of the crucial shoreface region with the following settings: push-frames of regional scenes worldwide; up to a monthly revisit rate to capture seasonal to inter-annual evolution; meters of resolution (i.e., much less than a wavelength) and burst of images with frame rates > 1 Hz over tens of seconds (ideally higher than a wave period).

Author Contributions

R.A. did the analyses and wrote the manuscript; E.W.J.B. participated to the ideas; K.L.B. and A.S.B. conducted field surveys, revised the manuscript at different stages and collaborated on the ideas; S.A., S.L.-C., G.C. and J.-M.D. participated to the elaboration of this study and satellite data acquisition and images. All authors have read and agreed to the published version of the manuscript.

Funding

We thank CNES EOLAB group for funding the Jilin acquisition through the R&T SPACEBAT maturation project.

Institutional Review Board Statement

Not applicable.

Informed Consent Statement

Not applicable.

Data Availability Statement

Not applicable.

Acknowledgments

We are indebted to everyone involved in the measurements, funding and program at the US Army Corps of Engineers Field Research Facility at Duck, in particular Nicolas Spore, for data collection tailored to this project. Funding support for measurements at the Field Research Facility were provided by the Coastal Field Data Collection Program and Coastal and Ocean Data Systems Programs. The Jilin video sequence was obtained from CG Satellite in 2020 (Distribution CG), acquired within the framework of a CNES agreement.

Conflicts of Interest

The authors declare no conflict of interest.

References

  1. Laporte, J.; Dolou, H.; Avis, J.; Arino, O. Thirty years of Satellite Derived Bathymetry: The charting tool that Hydrographers can no longer ignore. Int. Hydrogr. Rev. 2020, 25, 129–154. [Google Scholar]
  2. Wölfl, A.C.; Snaith, H.; Amirebrahimi, S.; Devey, C.W.; Dorschel, B.; Ferrini, V.; Huvenne, V.A.I.; Jakobsson, M.; Jencks, J.; Johnston, G.; et al. Seafloor Mapping—The Challenge of a Truly Global Ocean Bathymetry. Front. Mar. Sci. 2019, 6, 283. [Google Scholar] [CrossRef]
  3. Cesbron, G.; Melet, A.; Almar, R.; Lifermann, A.; Tullot, D.; Crosnier, L. Pan-European Satellite-Derived Coastal Bathymetry—Review, User Needs and Future Services. Front. Mar. Sci. 2021, 8, 1591. [Google Scholar] [CrossRef]
  4. Melet, A.; Teatini, P.; Le Cozannet, G.; Jamet, C.; Conversi, A.; Benveniste, J.; Almar, R. Earth observations for monitoring marine coastal hazards and their drivers. Sur. Geophys. 2020, 46, 1489–1534. [Google Scholar] [CrossRef]
  5. Benveniste, J.; Cazenave, A.; Vignudelli, S.; Fenoglio-Marc, L.; Shah, R.; Almar, R.; Andersen, O.; Birol, F.; Bonnefond, P.; Bouffard, J.; et al. Requirements for a Coastal Hazards Observing System. Front. Mar. Sci. 2019, 6, 348. [Google Scholar] [CrossRef] [Green Version]
  6. Matheen, N.; Harley, M.D.; Turner, I.L.; Splinter, K.D.; Simmons, J.A.; Thran, M.C. Bathymetric Data Requirements for Operational Coastal Erosion Forecasting Using XBeach. J. Mar. Sci. Eng. 2021, 9, 1053. [Google Scholar] [CrossRef]
  7. Lange, A.M.; Fiedler, J.W.; Becker, J.M.; Merrifield, M.A.; Guza, R. Estimating runup with limited bathymetry. Coast. Eng. 2022, 172, 104055. [Google Scholar] [CrossRef]
  8. Cohn, N.; Brodie, K.L.; Johnson, B.; Palmsten, M.L. Hotspot dune erosion on an intermediate beach. Coast. Eng. 2021, 170, 103998. [Google Scholar] [CrossRef]
  9. Almar, R.; Ranasinghe, R.; Bergsma, E.W.J.; Diaz, H.; Melet, A.; Papa, F.; Vousdoukas, M.; Athanasiou, P.; Dada, O.; Almeida, L.P.; et al. A global analysis of extreme coastal water levels with implications for potential coastal overtopping. Nat. Commun. 2021, 12, 3775. [Google Scholar] [CrossRef]
  10. Hooijer, A.; Vernimmen, R. Global LiDAR land elevation data reveal greatest sea-level rise vulnerability in the tropics. Nat. Commun. 2021, 12, 3592. [Google Scholar] [CrossRef]
  11. Bergsma, E.W.; Almar, R.; de Almeida, L.P.M.; Sall, M. On the operational use of UAVs for video-derived bathymetry. Coast. Eng. 2019, 152, 103527. [Google Scholar] [CrossRef]
  12. Angnuureng, D.B.; Jayson-Quashigah, P.N.; Almar, R.; Stieglitz, T.; Anthony, E.J.; Worlanyo Aheto, D.; Addo, K.A. Remote sensing application of shore-based video and unmanned aerial vehicles (Drones): Complementary tools for beach studies. Remote Sens. 2020, 12, 394. [Google Scholar] [CrossRef] [Green Version]
  13. Brodie, K.L.; Bruder, B.L.; Slocum, R.K.; Spore, N.J. Simultaneous Mapping of Coastal Topography and Bathymetry From a Lightweight Multicamera UAS. IEEE Trans. Geosci. Remote Sens. 2019, 57, 6844–6864. [Google Scholar] [CrossRef]
  14. Holman, R.A.; Plant, N.; Holland, T. cBathy: A Robust Algorithm For Estimating Nearshore Bathymetry. J. Geophys. Res. Oceans 2013, 118, 2595–2609. [Google Scholar] [CrossRef]
  15. Abessolo Ondoa, G.; Bonou, F.; Tomety, F.S.; Du Penhoat, Y.; Perret, C.; Degbe, C.G.E.; Almar, R. Beach Response to Wave Forcing from Event to Inter-Annual Time Scales at Grand Popo, Benin (Gulf of Guinea). Water 2017, 9, 447. [Google Scholar] [CrossRef] [Green Version]
  16. Holman, R.; Bergsma, E.W.J. Updates to and Performance of the cBathy Algorithm for Estimating Nearshore Bathymetry from Remote Sensing Imagery. Remote Sens. 2021, 13, 3996. [Google Scholar] [CrossRef]
  17. Le Mauff, B.; Juigner, M.; Ba, A.; Robin, M.; Launeau, P.; FATTAL, P. Coastal monitoring solutions of the geomorphological response of beach dune systemes using multio-temporal LiDAR datasets (Vendée coast, France). Geomorphology 2018, 304, 121–140. [Google Scholar] [CrossRef]
  18. Louvart, L.; Grateau, C. The Litto3D project. In Proceedings of the Europe Oceans 2005, Brest, France, 20–23 June 2005; Volume 2, pp. 1244–1251. [Google Scholar] [CrossRef]
  19. Tuell, G.; Barbor, K.; Wozencraft, J. Overview of the coastal zone mapping and imaging lidar (CZMIL): A new multisensor airborne mapping system for the US Army Corps of Engineers. In Proceedings of the Algorithms and Technologies for Multispectral, Hyperspectral, and Ultraspectral Imagery XVI, SPIE, Orlando, FL, USA, 5–8 April 2010; Volume 7695, pp. 226–233. [Google Scholar]
  20. Anthony, E.J.; Aagaard, T. The lower shoreface: Morphodynamics and sediment connectivity with the upper shoreface and beach. Earth-Sci. Rev. 2020, 210, 103334. [Google Scholar] [CrossRef]
  21. Turner, I.L.; Harley, M.D.; Almar, R.; Bergsma, E.W.J. Satellite optical imagery in coastal engineering. Coast. Eng. 2021, 167, 103919. [Google Scholar] [CrossRef]
  22. Anne, V.; Jan, J.; Antoine, M.; Thomas, J.; François-Régis, M.L. New Perspectives in the Monitoring of Marine Sedimentary Transport by Satellites—Advantage and Research Directions. In Estuaries and Coastal Zones in Times of Global Change; Springer: Berlin, Germany, 2020; pp. 789–808. [Google Scholar]
  23. Vos, K.; Harley, M.D.; Splinter, K.D.; Simmons, J.A.; Turner, I.L. Sub-annual to multi-decadal shoreline variability from publicly available satellite imagery. Coast. Eng. 2019, 150, 160–174. [Google Scholar] [CrossRef]
  24. Collin, A.; Hench, J.; Pastol, Y.; Planes, S.; Thiault, L.; Schmitt, R.; Holbrook, S.; Davies, N.; Troyer, M. High resolution topobathymetry using a Pleiades-1 triplet: Moorea Island in 3D. Remote Sens. Environ. 2018, 11, 109–119. [Google Scholar] [CrossRef]
  25. Almar, R.; Kestenare, E.; Boucharel, J. On the key influence of remote climate variability from Tropical Cyclones, North and South Atlantic mid-latitude storms on the Senegalese coast (West Africa). Environ. Res. Commun. 2019, 1, 071001. [Google Scholar] [CrossRef] [Green Version]
  26. Almeida, L.P.; Almar, R.; Bergsma, E.W.J.; Berthier, E.; Baptista, P.; Garel, E.; Dada, O.A.; Alves, B. Deriving High Spatial-Resolution Coastal Topography from Sub-meter Satellite Stereo Imagery. Remote Sens. 2019, 11, 590. [Google Scholar] [CrossRef] [Green Version]
  27. Bergsma, E.W.J.; Almar, R.; Rolland, A.; Binet, R.; Brodie, K.L.; Bak, A.S. Coastal morphology from space: A showcase of monitoring the topography-bathymetry continuum. Remote Sens. Environ. 2021, 261, 112469. [Google Scholar] [CrossRef]
  28. Tateishi, R.; Akutsu, A. Relative DEM production from SPOT data without GCP. Int. J. Remote Sens. 1992, 13, 2517–2530. [Google Scholar] [CrossRef]
  29. Taveneau, A.; Almar, R.; Bergsma, E.W.; Sy, B.A.; Ndour, A.; Sadio, M.; Garlan, T. Satellite-Based Beach Topography Evolution: An Application to Monitor Coastal Erosion at Saint Louis on the Langue de Barbarie sand spit (Senegal, West Africa). Remote Sens. 2022, in press. [Google Scholar]
  30. Salameh, E.; Frappart, F.; Almar, R.; Baptista, P.; Heygster, G.; Lubac, B.; Raucoules, D.; Almeida, L.P.; Bergsma, E.W.J.; Capo, S.; et al. Monitoring Beach Topography and Nearshore Bathymetry Using Spaceborne Remote Sensing: A Review. Remote Sens. 2019, 11, 2212. [Google Scholar] [CrossRef] [Green Version]
  31. Abileah, R. Mapping shallow water depth from satellite. In Proceedings of the ASPRS Annual Conference, Reno, NV, USA, 1–5 May 2006; pp. 1–7. [Google Scholar]
  32. Danilo, C.; Binet, R. Bathymetry estimation from wave motion with optical imagery: Influence of acquisition parameters. In Proceedings of the IEEE Transactions on Geoscience and Remote Sensing, Bergen, Norway, 10–14 June 2013; pp. 1–5. [Google Scholar]
  33. Danilo, C.; Farid, M. Wave period and coastal bathymetry using wave propagation on optical images. IEEE Trans. Geosci. Remote Sens. 2016, 54, 6307–6319. [Google Scholar] [CrossRef]
  34. Poupardin, A.; Idier, D.; de Michele, M.; Raucoules, D. Water Depth Inversion from a Single SPOT-5 Dataset. IEEE Trans. Geosci. Remote Sens. 2016, 119, 2329–2342. [Google Scholar] [CrossRef] [Green Version]
  35. Bergsma, E.W.J.; Almar, R.; Maisongrande, P. Radon-Augmented Sentinel-2 Satellite Imagery to Derive Wave-Patterns and Regional Bathymetry. Remote Sens. 2019, 11, 1918. [Google Scholar] [CrossRef] [Green Version]
  36. Almar, R.; Bergsma, E.W.J.; Maisongrande, P.; de Almeida, L.P.M. Wave-derived coastal bathymetry from satellite video imagery: A showcase with Pleiades persistent mode. Remote Sens. Environ. 2019, 231, 111263. [Google Scholar] [CrossRef]
  37. Almar, R.; Bergsma, E.W.J.; Thoumyre, G.; Baba, M.W.; Cesbron, G.; Daly, C.; Garlan, T.; Lifermann, A. Global Satellite-Based Coastal Bathymetry from Waves. Remote Sens. 2021, 13, 4628. [Google Scholar] [CrossRef]
  38. Muis, S.; Apecechea, M.I.; Dullaart, J.; de Lima Rego, J.; Madsen, K.S.; Su, J.; Yan, K.; Verlaan, M. A High-Resolution Global Dataset of Extreme Sea Levels, Tides, and Storm Surges, Including Future Projections. Front. Mar. Sci. 2020, 7, 263. [Google Scholar] [CrossRef]
  39. Forte, M.F.; Birkemeier, W.A.; Mitchell, J.R. Nearshore Survey System Evaluation; Technical Report; U.S. Army Engineer Research and Development Center ERDC-CHL Vicksburg United States: Vicksburg, MI, USA, 2017. [Google Scholar]
  40. Shean, D.; Alexandrov, O.; Moratto, Z.; Smith, B.; Joughin, I.; Porter, C.; Morin, P. An automated, open-source pipeline for mass production of digital elevation models (DEMs) from very-high-resolutioncommercial stereo satellite imagery. ISPRS J. Photogramm. Remote Sens. 2016, 116, 101–117. [Google Scholar] [CrossRef] [Green Version]
  41. Nuth, C.; Kääb, A. Co-registration and bias corrections of satellite elevation data sets for quantifying glacier thickness change. Cryosphere 2011, 5, 271–290. [Google Scholar] [CrossRef] [Green Version]
  42. McNabb, R. PyBob: A Python Package of Geospatial Tools; Version 0.25; Github: San Francisco, CA, USA, 2019. [Google Scholar]
  43. Larson, M.; Kraus, N.C. Temporal and spatial scales of beach profile change, Duck, North Carolina. Mar. Geol. 1994, 117, 75–94. [Google Scholar] [CrossRef]
  44. Beyer, R.A.; Alexandrov, O.; McMichael, S. The Ames Stereo Pipeline: NASA’s Open Source Software for Deriving and Processing Terrain Data. Earth Space Sci. 2018, 5, 537–548. [Google Scholar] [CrossRef]
  45. Youssefi, D.; Michel, J.; Sarrazin, E.; Buffe, F.; Cournet, M.; Delvit, J.; L’Helguen, C.; Melet, O.; Emilien, A.; Bosman, O. CARS: A photogrammetry pipeline using Dask graphs to construct a global 3D model. In Proceedings of the IGARSS 2020—2020 IEEE International Geoscience and Remote Sensing Symposium, Waikoloa, HI, USA, 26 September–2 October 2020; pp. 453–456. [Google Scholar]
  46. Michel, J.; Sarrazin, E.; Youssefi, D.; Cournet, M.; Buffe, F.; Delvit, J.; Emilien, A.; Bosman, J.; Melet, O.; L’Helguen, C. A new satellite imagery stereo pipeline designed for scalability, robustness and performance. ISPRS Ann. Photogramm. Remote Sens. Spat. Inf. Sci. 2020, 2, 171–178. [Google Scholar] [CrossRef]
  47. Almar, R.; Michallet, H.; Cienfuegos, R.; Bonneton, P.; Tissier, M.; Ruessing, G. On the use of the Radon Transform in studying nearshore wave dynamics. Coast. Eng. 2014, 92, 24–30. [Google Scholar] [CrossRef]
  48. Almar, R.; Bergsma, E.W.J.; Gawehn, M.A.; Aarninkhof, S.G.J.; Benshila, R. High-frequency temporal wave-pattern reconstruction from a few satellite images: A new method towards estimating regional bathymetry. J. Coast. Res. 2020, 95, 996–1000. [Google Scholar] [CrossRef]
  49. Yamazaki, D.; Ikeshima, D.; Tawatari, R.; Yamaguchi, T.; O’Loughlin, F.; Neal, J.C.; Sampson, C.C.; Kanae, S.; Bates, P.D. A high-accuracy map of global terrain elevations. Geophys. Res. Lett. 2017, 44, 5844–5853. [Google Scholar] [CrossRef] [Green Version]
  50. Magruder, L.; Neuenschwander, A.; Klotz, B. Digital terrain model elevation corrections using space-based imagery and ICESat-2 laser altimetry. Remote Sens. Environ. 2021, 264, 112621. [Google Scholar] [CrossRef]
  51. Holman, R.A.; Brodie, K.L.; Spore, N.J. Surf Zone Characterization Using a Small Quadcopter: Technical Issues and Procedures. IEEE Trans. Geosci. Remote Sens. 2017, 55, 2017–2027. [Google Scholar] [CrossRef]
  52. Bergsma, E.W.J.; Conley, D.C.; Davidson, M.A.; O’Hare, T.J.; Almar, R. Storm Event to Seasonal Evolution of Nearshore Bathymetry Derived from Shore-Based Video Imagery. Remote Sens. 2019, 11, 519. [Google Scholar] [CrossRef] [Green Version]
  53. Almar, R.; Cienfuegos, R.; Catalán, P.A.; Birrien, F.; Castelle, B.; Michallet, H. Nearshore bathymetric inversion from video using a fully non-linear Boussinesq wave model. In Proceedings of the 11th International Coastal Symposium, Szczecin, Poland, 9–14 May 2011. [Google Scholar]
  54. Bergsma, E.W.J.; Almar, R. Video-based depth inversion techniques, a method comparison with synthetic cases. Coast. Eng. 2018, 138, 199–209. [Google Scholar] [CrossRef]
  55. Gawehn, M.; de Vries, S.; Aarninkhof, S. A Self-Adaptive Method for Mapping Coastal Bathymetry On-The-Fly from Wave Field Video. Remote Sens. 2021, 13, 4742. [Google Scholar] [CrossRef]
  56. Almar, R.; Bonneton, P.; Senechal, N.; Roelvink, D. Wave Celerity From Video Imaging: A new method. In Proceedings of the 31st International Conference Coastal Engineering, Hamburg, Germany, 31 August–5 September 2008; pp. 1–14. [Google Scholar]
  57. Stumpf, R.P.; Holderied, K.; Sinclair, M. Determination of water depth with high-resolution satellite imagery over variable bottom types. Limnol. Oceanogr. 2003, 48, 547–556. [Google Scholar] [CrossRef]
  58. Lyzenga, D.R.; Malinas, N.P.; Tanis, F.J. Multispectral bathymetry using a simple physically based algorithm. IEEE Trans. Geosci. Remote Sens. 2006, 44, 2251–2259. [Google Scholar] [CrossRef]
  59. Lee, Z.; Hu, C.; Casey, B.; Shang, S.; Dierssen, H.; Arnone, R. Global Shallow-Water from Satellite Ocean Color Data. Eos 2010, 91, 429–430. [Google Scholar] [CrossRef] [Green Version]
  60. Hodúl, M.; Bird, S.; Knudby, A.; Chénier, R. Satellite derived photogrammetric bathymetry. ISPRS J. Photogramm. Remote Sens. 2018, 142, 268–277. [Google Scholar] [CrossRef]
  61. Caballero, I.; Stumpf, R.P. Retrieval of nearshore bathymetry from Sentinel-2A and 2B satellites in South Florida coastal waters. Estuarine Coast. Shelf Sci. 2019, 226, 106277. [Google Scholar] [CrossRef]
  62. Li, J.; Knapp, D.E.; Lyons, M.; Roelfsema, C.; Phinn, S.; Schill, S.R.; Asner, G.P. Automated Global Shallow Water Bathymetry Mapping Using Google Earth Engine. Remote Sens. 2021, 13, 1469. [Google Scholar] [CrossRef]
  63. Bergsma, E.W.J.; Almar, R. Coastal coverage of ESA’ Sentinel 2 mission. Adv. Space Res. 2020, 65, 2636–2644. [Google Scholar] [CrossRef]
  64. Karunarathna, H.; Horrillo-Caraballo, J.; Kuriyama, Y.; Mase, H.; Ranasinghe, R.; Reeve, D.E. Linkages between sediment composition, wave climate and beach profile variability at multiple timescales. Mar. Geol. 2016, 381, 194–208. [Google Scholar] [CrossRef] [Green Version]
  65. Thuan, D.H.; Almar, R.; Marchesiello, P.; Viet, N.T. Video sensing of nearshore bathymetry evolution with error estimate. J. Mar. Sci. Eng. 2019, 7, 233. [Google Scholar] [CrossRef] [Green Version]
  66. Mayer, L.; Jakobsson, M.; Allen, G.; Dorschel, B.; Falconer, R.; Ferrini, V.; Lamarche, G.; Snaith, H.; Weatherall, P. The Nippon Foundation—GEBCO Seabed 2030 Project: The Quest to See the World’s Oceans Completely Mapped by 2030. Geosciences 2018, 8, 63. [Google Scholar] [CrossRef] [Green Version]
  67. Komar, P. Beach Processes and Sedimentation, 2nd ed.; Prentice-Hall: Upper Saddle River, NJ, USA, 1998. [Google Scholar]
Figure 1. (a) Jilin video acquisition viewfield at Duck (USA) on 7 June 2020 with (b) an inset illustrating the co-registration between the first and last frame of the sequence using a spatial correlator. Red and green symbols stand for the captured displacement of homologous points. (c) Co-registration of images in the sequence (with reference the first image) showing the drift in Longitude and Latitude over time. (d,e) are the raw and co-registered image averages. The Jilin video sequence was obtained from a CG Satellite in 2020 (Distribution CG), acquired within the framework of a CNES agreement.
Remotesensing 14 01529 g001
Figure 2. Principle of the method employed. (a) Pixel intensity anomaly timeseries, (b) matrix of lagged correlation (at d p h a = 3 s), and (c) lagged correlation along the peak direction (in the Radon sinogram in polar space), with ρ the radius from the center of the computation window and different d p h a from 1 s to 3 s for the temporal and spatial versions.
Remotesensing 14 01529 g002
Figure 3. Topography-bathymetry seamless continuum. (a) Estimation from satellite (7 June 2020) from CARS for topography and the temporal correlation method for the estimated bathymetry and (b) surveyed (23 June 2020) bathymetry with (c) a comparison of the alongshore-averaged profile in local cross-alongshore coordinate system (video tower as cross-shore reference and mean sea level in vertical). The inset shows the alongshore dispersion of data points used to compute the alongshore-averaged profile. The profiles are averaged over the alongshore extent of the surveyed bathymetry visible in the panel (b). The common vertical datum is the mean sea level. The Jilin video sequence was obtained from CG Satellite in 2020 (Distribution CG), acquired within the framework of a CNES agreement.
Remotesensing 14 01529 g003
Figure 4. Sensitivity analysis of the temporal (blue) and spatial (red) versions of the correlation method to parameters: (a) to the number of frames in the video duration (here in terms of number of seen waves of a 7 s period, from 3 to 215 frames); (b) to the lag given to the waves to propagate (here in terms of a 7 s wave period, from 0.4 s, to 1 s, 4 s, and 10 s); and (c) to the temporal resolution dt (here in terms of a 7 s wave period).
Remotesensing 14 01529 g004
Figure 5. A review of current and future satellite video missions. Table and graphics showing the main optical video mission characteristics and lifetime, with some video duration versus ground sampling distance (GSD). (b,c) Present missions only from all the missions in (a). This table may contain incomplete and outdated information. Updated documentation can be found on satellite mission web pages.
Remotesensing 14 01529 g005
Publisher’s Note: MDPI stays neutral with regard to jurisdictional claims in published maps and institutional affiliations.

