Article

Study on Significance Enhancement Algorithm of Abnormal Features of Urban Road Ground Penetrating Radar Images

1
School of Mechanical Electronic and Information Engineering, China University of Mining and Technology (Beijing), Beijing 100083, China
2
Beijing Drainage Group Co., Ltd., Beijing 100044, China
*
Author to whom correspondence should be addressed.
Remote Sens. 2022, 14(7), 1546; https://doi.org/10.3390/rs14071546
Submission received: 22 February 2022 / Revised: 13 March 2022 / Accepted: 22 March 2022 / Published: 23 March 2022

Abstract

:
Currently, ground penetrating radar is the major technology for the detection of urban road collapses and disaster sources. Vehicle-mounted GPR collects tens of GB of data on site every day, but the present interpretation of abnormal regions detected by radar relies on manual interpretation with low process efficiency. The abnormal region images of GPR are different from the surrounding normal images. In terms of the features of abnormal regions in GPR images with an obvious brightness change and obvious directional characteristics, an abnormal region detection algorithm based on visual attention mechanism is proposed. Firstly, the complex background noise in the GPR images is suppressed by wavelet denoising and gamma transform, and the brightness and directional characteristics of the abnormal regions are enhanced. Secondly, by building a multi-scale image brightness and orientation feature pyramid model, the features of abnormal regions of interest are continuously enhanced, and the rapid screening of abnormal regions has been achieved. The effectiveness of the algorithm has been verified by actual tests on different types of abnormal radar image data.

Graphical Abstract

1. Introduction

Urban roads are important infrastructure for the national urban underground space development strategy. In recent years, the ground collapse accidents that occurred frequently on the urban road have been causing serious losses to the country, lives, and properties. Traditional detection techniques such as the core drilling method [1] and other destructive detection methods have a limited number of samples. The test is expensive and time consuming, and real-time interpretation of the results could not be guaranteed [2]. The act of drilling holes on the road surface will also cause irreversible damage to the road structure. Ground Penetrating Radar (GPR) is a non-destructive electromagnetic detection technology [3]. It transmits electromagnetic waves through a transmitter, and the receiver is like an echo listener to record the reflection of electromagnetic waves from the ground [4]. Based on these electromagnetic properties of different underground media (such as permittivity, conductivity, permeability, etc.), the reflected electromagnetic waves propagate along in different directions. When the electromagnetic characteristics of the underground medium change, the electromagnetic wave will accordingly produce reflection and refraction [5]. By processing and analyzing the echo received by the receiver, it is possible to infer the underground medium according to the waveform, intensity, echo time, etc., of the echo, location, structure, geometry, and other information. GPR is widely used in the detection of underground constitution because of its non-destruction, high efficiency, continuous detection, and intuitive image characteristics. The common detection methods of GPR include common midpoint (CMP), wide-angle reflection (WAR) [6], and continuous profile scanning measurement. Among them, continuous profile scanning measurement is mostly applied for target detection and imaging. For this method, the distance between the transmitting and receiving antennas is fixed during the measurement, and continuous scanning measurement is performed by moving in the same direction along the designated survey line. The working schematic is shown in Figure 1.
According to different detection objects, underground abnormalities in urban roads can be categorized into underground problems, such as looseness, cavities, water rich, etc., and underground structures, such as stratum subsidence, pipelines, pipe drains, etc. [7,8]. While the data collection efficiency of GPR detection is high, the processing and interpretation of abnormal regions have become a bottleneck in the development of this technology. As of now, the interpretation of GPR images is mainly based on manual analysis, which requires high professional knowledge of the processor, and the speed of manual processing is relatively slow. Therefore, how to improve the recognition efficiency of abnormal regions in road detection and achieve intelligent extraction of abnormal regions is an important issue to be studied [9]. Aiming at the above problems, Meecan, B et al. [10] obtained 2580 training images through cross-validation and forward simulation, performed n-line parallel preprocessing and image changes to extract the feature vectors of underground targets, and then used KNN to identify the underground targets. Du, Y [11] of Tongji University and others used XGBoost to identify common problems such as voids, looseness, and cracks. Li, S et al. [12] used the YOLO series model and combined 303 GPR images with a total of 1306 cracks to detect hidden cracks in GPR images. With the recent development of 3D GPR, Li, H et al. [13] proposed an algorithm named GPR-RCNN based on RCNN to combine 2D features in B-Scan images and 3D features in C-Scan images. They obtained a large amount of airport road data through detection. After analysis, they detected problems under the road surface such as pores, cracks, sedimentation, and cavities. Liu, Z et al. [14] used 350 GPR images, including a total of 1400 3D crack images, to train the YOLOv5 model, so as to achieve the extraction and identification of road defects. However, the methods above usually perform feature extraction and recognition only for a special experimental environment. For radars of different frequencies, underground media, and changes in the detection environment, it is necessary to retrain and adjust the contents of the training set and model parameters, and the generalization ability is limited. At the same time, the requirement for the number of training sets being high, the insufficient number of road problems, and the high cost of detection, verification, and information collection have become obstacles to the application of deep learning networks in the detection of road abnormalities in GPR images.
In order to resolve the above issues, as shown in Table 1, typical images of different types of abnormalities and characteristics in GPR images are analyzed.
By analyzing the common features of abnormal regions in GPR images, it can be concluded that the abnormal regions obviously reflected energy, with significantly higher brightness than the background. The abnormal regions also have the characteristics of cluttered waveforms and prominent directional characteristics. A visual attention mechanism-related method is introduced into this abnormal region-screening algorithm. The introduction of the visual attention mechanism into this algorithm is obtained by combining the abnormal area features analyzed above. Studies have shown that the human visual system can quickly discover some conspicuous areas in natural scenes and focus on important parts while ignoring some irrelevant information [15]. The visual attention mechanism is to simulate the working principle of the human visual system and analyze the visual stimuli generated by abnormal regions according to the underlying features (such as brightness features, directional features, etc.) in the visual scene image, so as to achieve the purpose of extracting abnormal significant regions. The novelty of this research is the combination of the visual attention mechanism and the underlying visual features of abnormal regions in GPR images. In this way, the feature extraction and enhancement of the abnormal regions of the GPR can be effectively carried out in the case of less prior knowledge. It can provide strong support for improving manual processing speed and refined recognition in the later steps.

2. Algorithm Model and Analysis of Radar Image Attention Mechanism

The algorithm model includes two parts: The first part is GPR noise characteristics and preprocessing, and the second part is the construction of visual attention features. The algorithm combines the visual attention [16] mechanism with the features of abnormalities in GPR images, enhances image quality and abnormality features through wavelet denoising and gamma transform preprocessing, and builds a multi-scale attention pyramid so that the model achieves the purpose of extracting abnormally significant regions. The algorithm processing steps are shown in Figure 2.

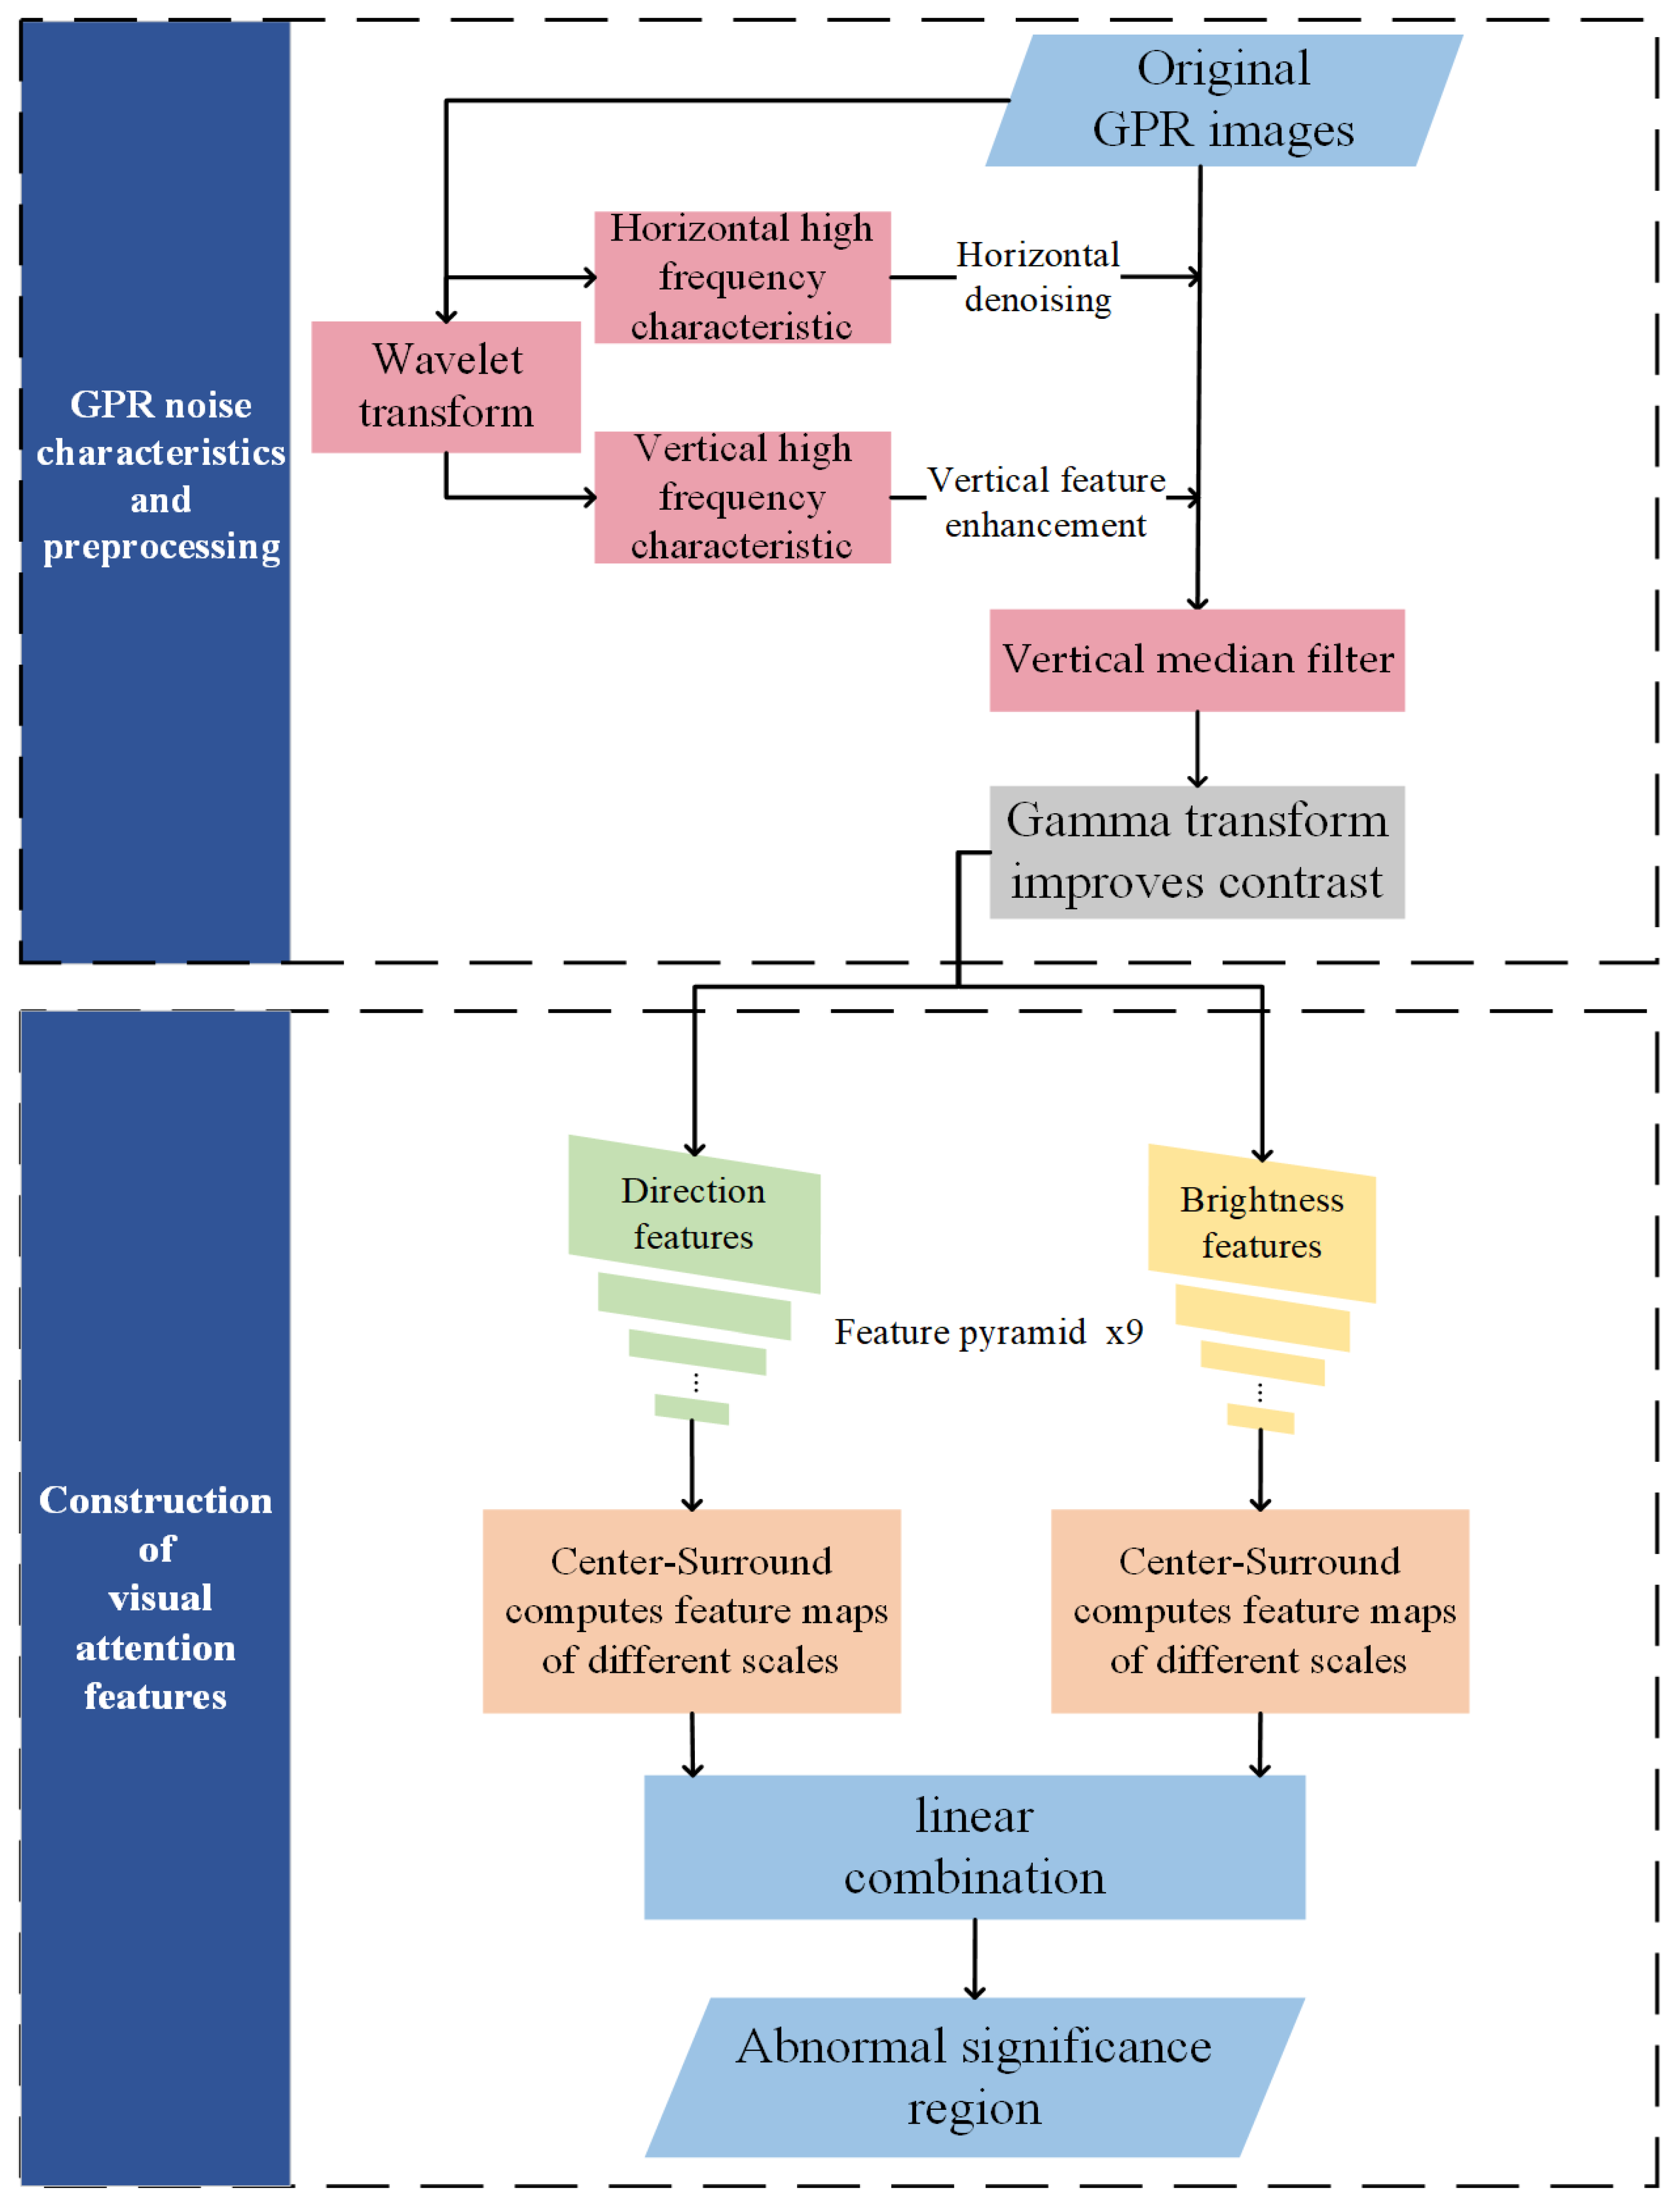
2.1. GPR Noise Characteristics and Preprocessing

The pulse emitted by GPR presents non-stationary and non-uniform propagation characteristics [17], weak signal, and strong interference characteristics [18]. During the process of GPR detection, there will be standing wave interference, and the GPR profile image shows that the phase axis is horizontally distributed. Because of the rapid attenuation of the GPR signal and the low signal-to-noise ratio of the deep signal, in the process of gain processing the signal, the deep noise will also be amplified. These noises are isolated and exhibit broadband and high-frequency characteristics in frequency. Wavelet transform is one of the most commonly used methods for non-stationary time series analysis [19]. Through wavelet transform, we can observe the frequency characteristics of signals at different positions through translation and scale changes [20]. The discrete wavelet transform function Wf(m, n) and the wavelet function φ m,n(t) are defined in Formulas (1) and (2), where a0 and b0 are the discrete scale factor and translation factor, respectively, f(t) is the input signal, m, n are integers.
W f ( m , n ) = a 0 m / 2 f ( t ) φ m , n ( t ) dt = a 0 m / 2 f ( t ) φ ( a 0 m t n b 0 ) d t
φ m , n = 1 a 0 m φ ( t n b 0 a 0 a 0 m ) = a 0 m / 2 φ ( a 0 m t n b 0 )
Wavelet transform is performed in the horizontal and vertical directions to obtain high-frequency and low-frequency features in the horizontal and vertical directions, as well as edge features in the diagonal direction. This study aimed to reduce the interference of horizontal waves and background noise as much as possible, and at the same time strengthen the diffracted wave and hyperbolic characteristics that are abnormal in the vertical direction in the GPR image. The radar image noise features obtained by wavelet decomposition are used for image preprocessing. In order to keep the image energy unchanged, the following linear processing needs to be performed on the raw image (RI) to obtain the processed image (PI), where HH is the high-frequency feature in the horizontal direction, VH is the high-frequency feature in the vertical direction, x represents the weight of the corresponding feature, and x ∈ (0, 1).
PI = RI x HH + ( 1 x ) V H
To further reduce the interference of high-frequency point noises and random noises from antenna jitter on later image processing, the processed image is subjected to a median filter, and then the grayscale of the image is corrected by gamma transform [21]. It uses nolinear transformation [22] to make the linear response of the image exposure intensity becomes closer to the response perceived by the human eyes. The original image gamma coefficient is equal to 1. When the gamma transformation coefficient is greater than 1, the contrast of the high gray value areas in the image can be improved, and the contrast of the low gray value areas can be reduced as well.

2.2. Construction of Visual Attention Features

In complex natural scenes, detection algorithms based on visual attention mechanism can quickly focus attention on significant regions [23], and significant regions are usually the ones most related to image semantics [24], which often contain the most important information of these images. The visual attention mechanism is usually divided into two modes: Top down and bottom up. The top-down mode needs to be driven by specific tasks, not only relying on low-level visual features [25] but also incorporating high-level semantic knowledge to guide model processing images, which cannot be processed using a generic model. The bottom-up model is to organize the basic features of the visual scenes into feature maps and then combine and significant extraction of features based on center-surround differences [26].
By combining with the ground penetrating radar system, the analog signal to digital signal conversion is conducted through analog-to-digital (A/D) conversion, which means the data collected by the GPR is single-channel data after A/D conversion and does not have the color characteristics of RGB three channel. The converted GPR value is determined by the electrical difference between the underground target and the surrounding environment. The greater the difference, the greater the reflection coefficient and the stronger the energy. In this study, the radar image adopts the organization method that bright and dark points represent strong and weak energies, respectively. The study results indicate that the abnormal regions detected by GPR mainly manifest in two aspects: Energy mutation and diffraction enhancement. The energy mutation is caused by the electrical difference mutation of the target during the propagation of the electromagnetic wave, while the diffraction enhancement is due to the mutation of the target. The diffraction reflection phenomenon is caused by points, so the energy brightness and diffraction direction features are selected as the low-level features of the visual attention mechanism. In this algorithm, the feature pyramid of GPR images is constructed by extracting brightness and directional features at different scales, respectively. The features between different scales are fused by the center-surround strategy. The inputs to the brightness and directional feature pyramids are GPR images that have gone through the preprocessing stage of this algorithm. The pyramid outputs two feature maps. One of them is the brightness feature and the other is the directional feature. Finally, the two maps are fused to obtain the abnormal region feature map. The detailed steps are described below.
The multiple layers of the feature pyramid are achieved by downsampling with Gaussian filtering. The more Gaussian filter applied to the GPR image, the higher the corresponding pyramid layer. As the layer of the feature pyramid is higher, the image details are blurred and abnormal regions are more obvious. The feature of which layer is selected should be adjusted according to the actual experimental situation and the requirements for accuracy. The Gaussian filter kernel is shown in Formula (4), where x, y are the coordinates of the image pixels, and σ is the size of the Gaussian kernel.
G ( x , y ) = 1 2 π σ 2 e x 2 + y 2 2 π 2
In a grayscale image, the image brightness feature is equal to the image grayscale value. So that the grayscale value can be seen as the brightness features of GPR images. For directional features, the Gabor filter [27] is used to extract directional features of images. The frequency and direction expression of the Gabor filter is similar to the human visual system, which is very suitable for texture expression and separation. The complex expression of the Gabor kernel function is shown in Formulas (5)–(7), where x and y are the image coordinates, λ is the wavelength, θ determines the fringe direction of the Gabor filter, Ψ is the phase offset, τ represents the standard deviation of the Gaussian factor of the Gabor function, and γ is the spatial aspect ratio that determines the shape of the Gabor kernel. To avoid extracting strong horizontal standing wave interference in the process of the Gabor filter, the angle of the filter kernel should be avoided as much as possible with a small lateral angle.
g ( x , y ; λ , θ , ψ , τ , γ ) = exp ( x 2 + γ 2 y 2 2 τ 2 ) exp ( i ( 2 π x λ + ψ ) )
  x = xcos θ + ysin θ
  y = xsin θ + ycos θ
The center-surround [28] mechanism is used for feature fusion between the visual feature pyramids. A small area in the center of the center-surround model stimulates visual neurons to excite, while a large concentric surrounding area inhibits excitation. This mechanism is very sensitive to local discontinuities and particularly suitable for detecting objects that stand out relative to the surrounding background, and the GPR images of underground abnormalities in urban roads just meet this feature. The center-surround calculation method of the brightness feature I(c,s) and the directional feature O(c,s,θ) are shown in Formulas (8) and (9), where c represents the center layer, s represents the surrounding layer, and θ represents the feature extraction direction.
I ( c , s ) = | I ( c ) I ( s ) |
O ( c , s , θ ) = | O ( c , θ ) O ( s , θ ) |
The feature maps with brightness and directional are linearly combined to output the final GPR abnormal significant regions. The linear combination expression of brightness feature and directional feature is shown in Formula (10); If is the brightness feature, Df is the directional feature, and AR represents the final abnormal significant regions.
AR = 0 . 5 × If + 0 . 5 × Df

3. Practical Testing of the Algorithm

In order to verify the abnormal region detection effect of the algorithm in practical application, the MTGR-400 ground penetrating radar of China University of Mining and Technology (Beijing) was used to detect the roads near 2nd Road and 3rd Road, Antuoshan, Futian District, Shenzhen. The center frequency of the antenna is 400 MHz, the sampling interval is 0.023 m.T The detection route and equipment are shown in Figure 3.
Because the dielectric constant of the abnormal region is significantly different from the surrounding medium. The brightness of this part in the GPR image will be particularly high. If there is an abnormal region with particularly strong reflected energy, the parameter selection will be affected in the subsequent Gamma transformation. This will cause some weaker abnormal regions to be mistaken for normal regions relative to the extreme region. The brightness of these weaker abnormal regions will be suppressed by the Gamma transform. In this way, the purpose of image contrast adjustment by Gamma transformation cannot be achieved. However, no matter whether the reflected energy is strong or weak, the abnormal region has a bright feature compared to the normal region. Therefore, the method of image segmentation is used to process in a small range to avoid the influence of diseases. In this experiment, the survey line is divided every 500 traces (every 11.34 m get an image) so that 60 images are obtained. Parts of the GPR images are shown in Figure 4.

3.1. GPR Image Preprocessing

The preprocessing of GPR images is performed according to the method in Section 2.1. This algorithm obtains horizontal and vertical high frequency features through wavelet transform. As shown in Formula (3), the weight of horizontal noise reduction and vertical feature enhancement need to be considered. In order to ensure image quality and effective information, the peak signal-to-noise ratio (PSNR) [29] and structural similarity (SSIM) [30] are selected to measure the effect of horizontal noise removal and vertical feature.
The calculation formula of PSNR is indicated in Formulas (11) and (12), where MSE is the mean square error, Q and K are two grayscale images of size m*n to be compared, and MaxQ is the maximum value of the color points in the picture Q.
PSNR = 10 lo g 10 ( Ma x Q 2 MSE )
MSE = 1 mn i = 0 m 1 j = 0 n 1 Q ( i , j ) K ( i , j ) 2
SSIM measures the similarity of images from three aspects: Brightness (I), contrast (C), and structure (S). The higher the SSIM ∈ [0, 1], the smaller the image distortion. As shown, μ and σ represent the mean and variance of the image, σQK is the standard deviation of the two images, and C1, C2, and C3 are constants.
SSIM ( Q , K ) = I ( Q , K ) C ( Q , K ) S ( Q , K )
I ( Q , K ) = 2 μ Q μ K + C 1 μ Q 2 + μ K 2 + C 1
C ( Q , K ) = 2 σ Q σ K + C 2 σ Q 2 + σ K 2 + C 2
S ( Q , K ) = σ Q K + C 3 σ Q σ K + C 3
Using the metrics above, discussing the weights in Formula (2), the average PSNR and SSIM of all images as a function of weights are shown in Figure 5. It can be seen that when the weights are 0.5, the PSNR of the image reaches the highest point of 26.72, the image quality is the highest and the SSIM value is 87.23%. After processing, the distortion is small and the structural similarity of the image is basically preserved. The decrease of the structural similarity is mainly caused by the removal of horizontal standing waves and high-frequency noise filtering. Therefore, 0.5 is selected as the weight of horizontal noise reduction and vertical feature enhancement. Then the vertical median filtering is applied to the images to further remove isolated high-frequency noise points.
The ground penetrating radar images after processing are shown in Figure 6. The high-frequency interference noises at the bottom are significantly reduced, the horizontal standing waves are reduced, and the effective signals at the depth are enhanced.
In order to further suppress the background noises, the image contrast at high gray values is enhanced by gamma transformation. In order to observe the grayscale distribution in the image more intuitively in the experiment, the color distribution is divided into 128 color bins and the grayscale histogram distribution of the images is calculated as shown in Figure 7. The highlight feature of abnormal information means that abnormal information is mostly distributed in higher gray levels in grayscale images. As shown in the second column, (b), (f), (j), and (n) in Figure 7, the grayscale histogram distribution of the image before Gamma transformation is relatively uniform, which means that the abnormal information of interest is not obvious compared with the background. The background information is too complex to extract effective information. After the Gamma transformation with a coefficient of 5, the overall brightness of the images becomes dark, as shown in the third column, (c), (g), (k), and (o) of Figure 7, and the grayscale histogram of the fourth column, (d), (h), (l), and (p) of Figure 7, shows that in the original images most of the low gray value points in the images are adjusted to 0 after Gamma transformation, and the more complex and low gray value background is suppressed so that the abnormal high brightness regions are visually highlighted. Excessive Gamma transform coefficients may cause some effective signals to be misjudged as background signals and adjusted to zero, and the overall picture is darker, resulting in poor visual effect, which is not conducive to the extraction and construction of visual attention features in later steps. The experimental results show that the suppression effect on the background noises of the GPR images is more obvious when the Gamma coefficient is 5, and the loss of effective information is relatively small.

3.2. Extracting Visual Attention Features from Abnormal Regions

In order to obtain the brightness features of GPR images, the algorithm extracted them at different scales in turn. The low and high layer brightness features of some GPR images are shown in Figure 8.
To characterize the directional characteristics of the images, some GPR images were selected and the directional features of 0°, 75°, 90°, and 135° were compared as well (Figure 9). As shown in the fourth column, (d), (i), (n) and (s) of Figure 9, the horizontal standing waves interference in the radar images will be extracted when the extraction direction is set to 90°. It is difficult to highlight the abnormal electromagnetic waves in the GPR images. This will result in excessive horizontal standing wave interference in the final significant regions. From the effects of the remaining angles in Figure 9, it can be seen that the horizontal and oblique directions can suppress the interference of standing waves while extracting abnormal regions in the images, creating favorable conditions for the extraction of later visual effects. In this feature extraction, the extraction directions of the Gabor filter are set to 0°, 75°, 115°, and 135°. The specific extracted direction feature angles need to be adjusted according to the feature angles in the GPR images concerned in each experiment.
The above features of brightness and direction are extracted layer by layer according to the structure of the feature pyramid. The center-surround strategy is used to construct the brightness feature image and the directional feature image for the constructed visual feature pyramid of brightness and direction, as the components of the later output visual saliency region. In order to avoid the interference of details in the low-level features of the feature pyramid, this experiment center-surround selects the sixth and seventh layers as the center layer, and the eighth and ninth layers as the surround layers to construct the final brightness and directional features. As shown in Figure 10, the brightness features are distributed in regions, and the directional features are more obvious for hyperbolic diffraction. Due to the suppression of horizontal direction signal when extracting directional features, the directional features have less noises in the horizontal direction.
For the brightness and directional features extracted above, linearly combine them according to Formula (10) and construct these abnormal significant regions of the GPR image shown in the second column and the fourth column of Figure 11. In the visual significant regions, the importance of the corresponding area from white to black decreases in turn, and the probability of the area being abnormal also decreases step by step.

3.3. Experimental Results

The detection line totals 117 abnormal areas, including looseness, cavities, water-rich, stratum subsidence, pipelines, and pipe drains. According to the statistical analysis, a total of 121 abnormal regions were detected by this algorithm, including 111 correctly detected abnormal regions and 10 false detections. For statistical results, the experiment introduces three evaluation standards. The rate of detected correct abnormal regions to all abnormal regions is defined as the detection rate. The accuracy represents the proportion of truly abnormal regions in all detected regions. In this study, the percentage of all detected regions that are not actually abnormal regions is named false detection rate.
The purpose of introducing these three evaluation standards into this study is to comprehensively evaluate this algorithm. Detection rate represents the ability to detect abnormal features and regions. The higher the detection rate, the more abnormal features and regions are detected. In practical applications, the efficiency of using this algorithm to detect problems and features is higher. The accuracy is introduced to evaluate the correctness of using this algorithm in large-scale screening of urban road problems. This evaluation standard can also be used to evaluate whether the brightness and directional features extraction in the algorithm is appropriate. The last standard is the false detection rate. If the false detection is high, it means that the extraction of the brightness and directional features of the problem in early steps is inaccurate. At this time, we need to go back to earlier steps to adjust the corresponding parameters. After the experiment, the detection rate, accuracy, and false detection rate are obtained as shown in Figure 12.

4. Discussion

Based on the comprehensive experimental process and experimental results analysis, the following can be concluded:
  • Based on PSNR and SSIM as image preprocessing evaluation standards in this experiment: Noises removal is achieved by wavelet decomposition. When the weight of vertical feature enhancement and horizontal standing wave noise removal are both 0.5, the PSNR value of 26.72 is relatively high while the SSIM of 87.23 is retained, which has an obvious effect on noise removal visually. Especially for the high-frequency isolated noise points at the bottom, the removal effect is obvious. The denoised image combined with Gamma transform can effectively suppress the background information and highlight the relevant features of abnormal regions.
  • In the second part of the algorithm, the construction of the brightness and directional feature pyramid provides the elements for the visual attention mechanism. The experiment uses higher layer pyramid features, which better avoid the influence of some image edges. The center-surround strategy can well simulate the response of human vision to significant regions. It avoids the influence of noises caused by the distribution of complex underground media and the hardware defects of GPR and ignores the edge details with strong interference.
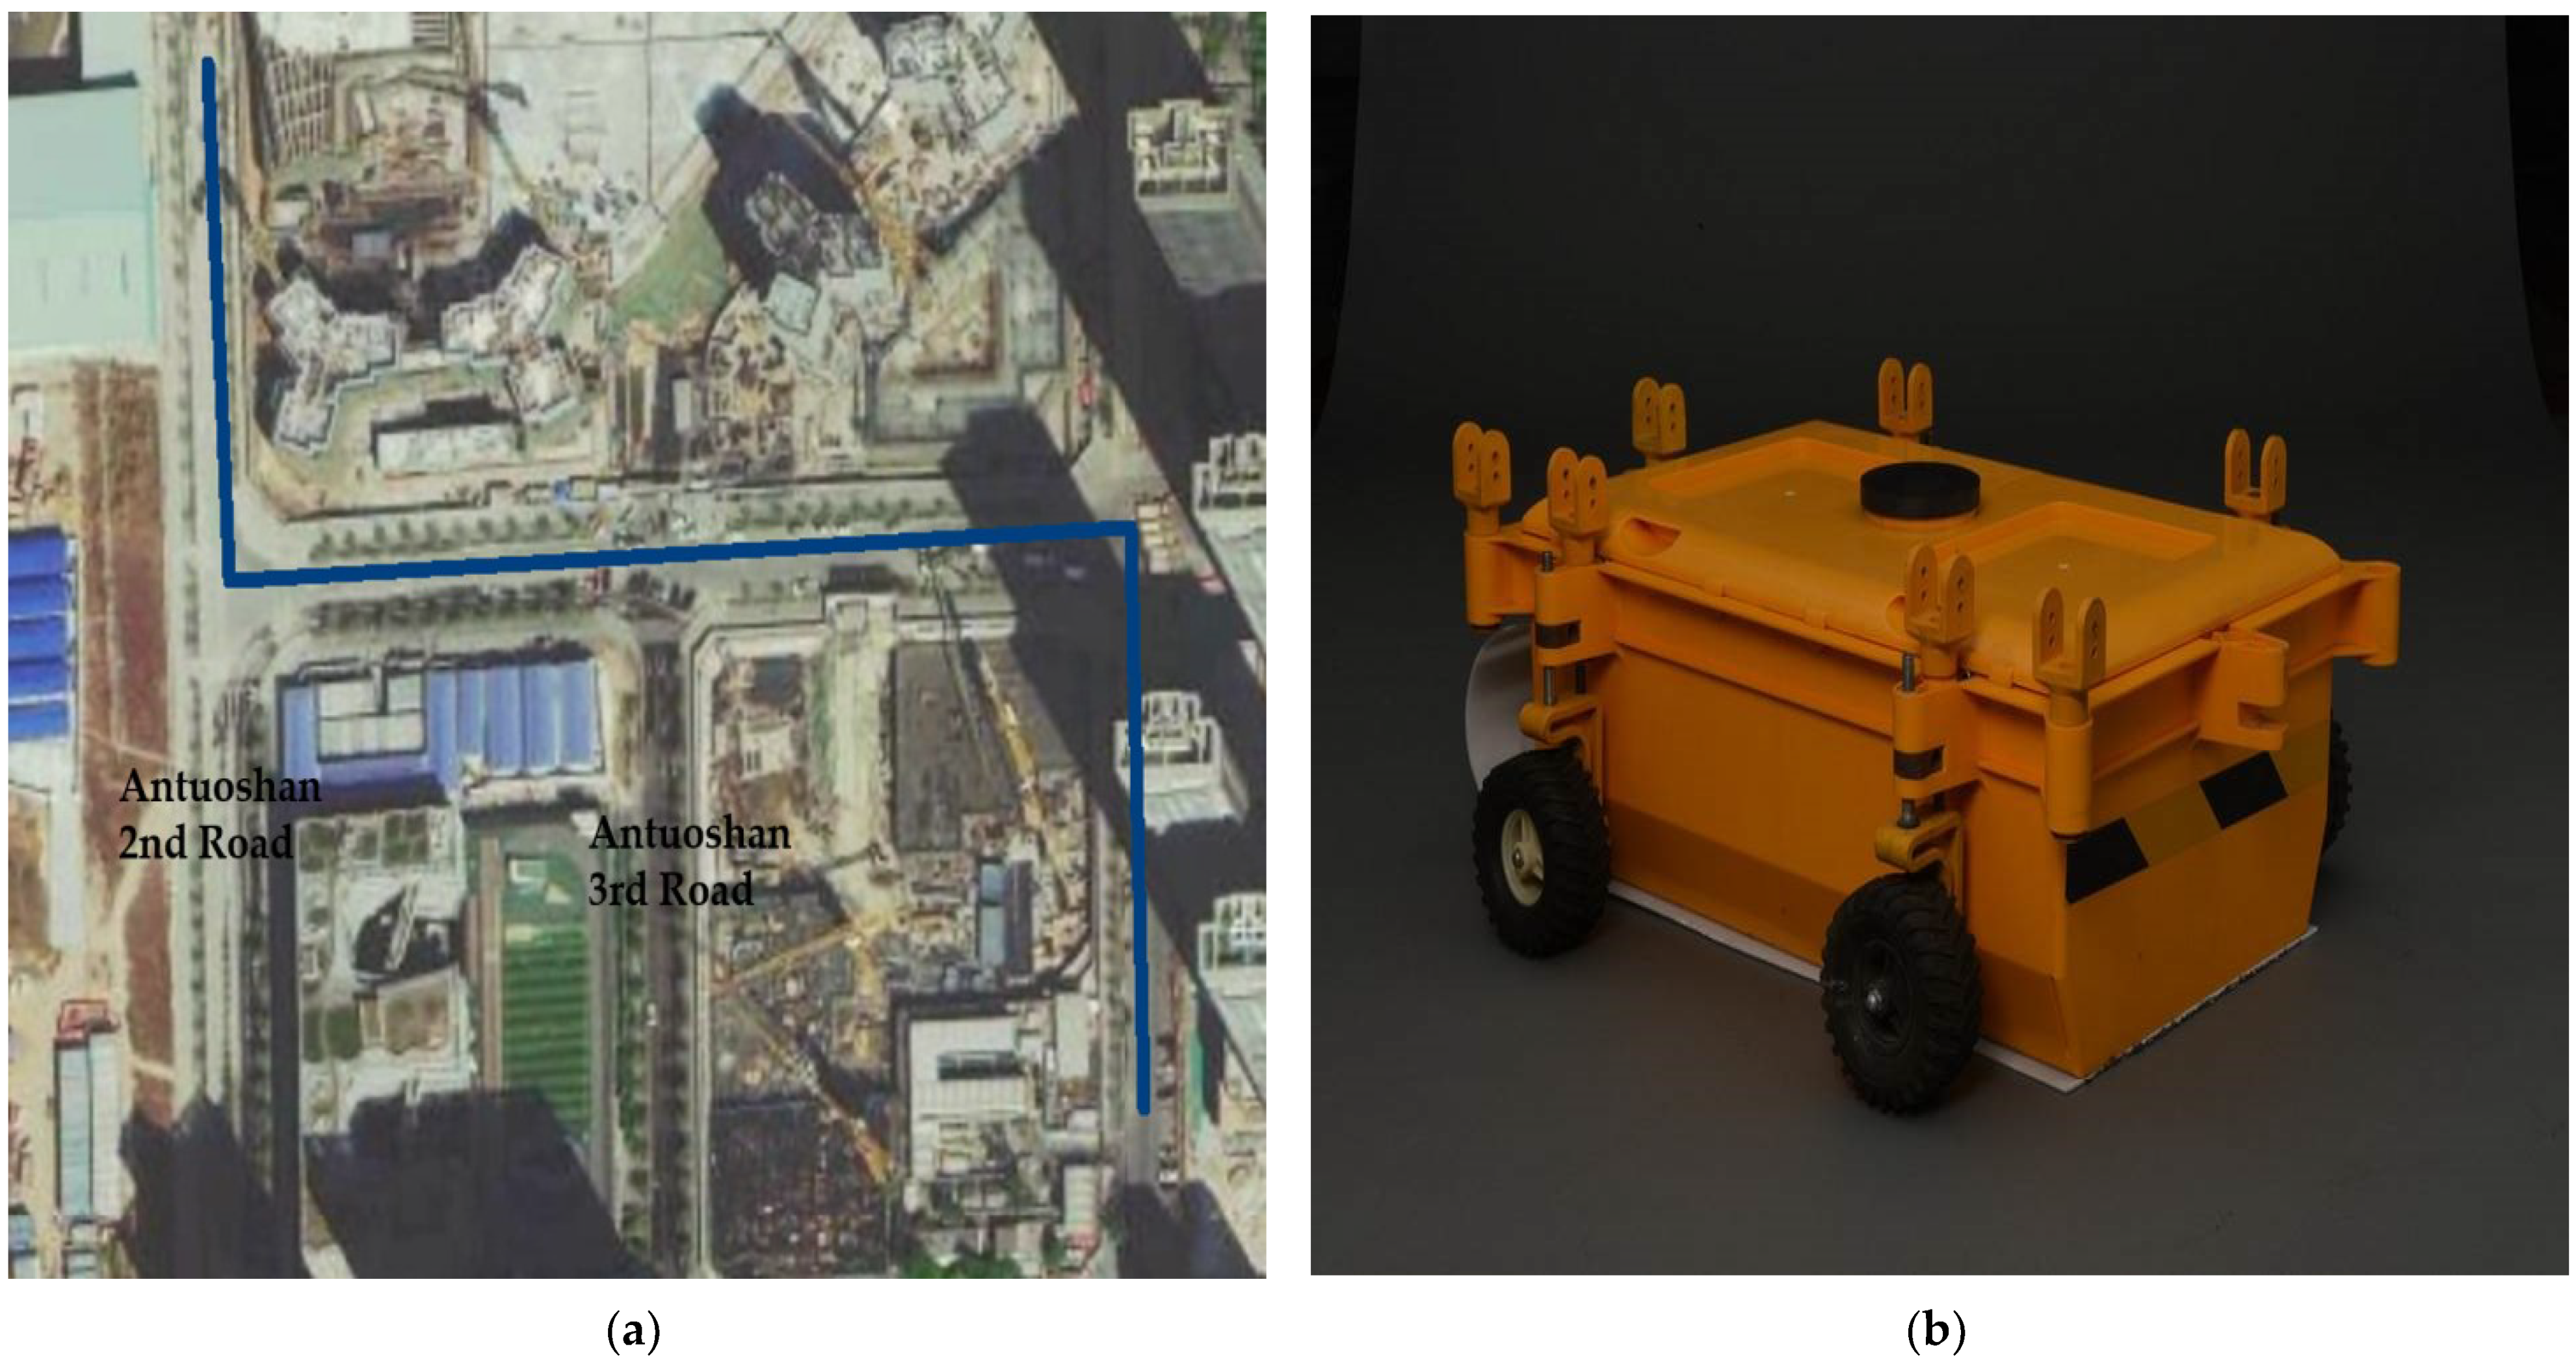
  • In Figure 12, the detection rate is 94.87%, which means this algorithm can find out most of the abnormal regions and features under the detection road. Since the algorithm detected underground problems based on brightness and directional features. The more serious the problems, the stronger the brightness and the more complex the reflection in the GPR images. So the undetected problems may not be very harmful. The detection accuracy is 91.74% and the false detection rate is 8.26%. Some normal stratum boundaries and strong horizontal standing wave interference will lead to false detections. Among all the detected regions, the number of correct abnormal regions can fully meet the requirements of large-scale screening of GPR images. In the later manual processing, the detected regions can be quickly screened. This can avoid the inefficiency of manual search for problems from redundant GPR data. In general, in this experiment, the algorithm can meet the needs of GPR underground abnormal regions detection.

5. Conclusions

This study proposes a large-scale GPR abnormal feature detection algorithm based on the visual attention mechanism. The research analyzes the high brightness and directional characteristics of common diseases on GPR images in different underground environments. Compared with common algorithms such as hyperbolic summation, it can also extract diseases with less obvious hyperbolic characteristics (such as stratum subsidence, cavity, water rich, etc.). Different from the general phase shift methods, electromagnetic wave reflection caused by the complex underground medium and difficult to obtain prior knowledge will not have a great influence on the detection results of this algorithm. Therefore, its general applicability is greatly strong. The image preprocessing and feature enhancement combines the GPR hardware and image features closely. The feature extraction stage can meet the requirements for different detection details and human visual perception of stimuli. After the testing, the algorithm can meet the requirements for the detection of road abnormal regions. It can also achieve the purpose of improving the detection efficiency of GPR underground problems. Moreover, in order to further classify and characterize the hazard of abnormal regions, subsequent sorting of the importance of significant regions and selection of thresholds should be carried out, combined with deep learning and improving the weight of abnormal attention regions. Further research will focus on accelerating the convergence speed of the deep learning model.

Author Contributions

Conceptualization, F.L., F.Y. and X.Q.; methodology, F.L., F.Y. and X.Q.; software, F.L. and X.Q.; validation, F.L. and F.Y.; formal analysis, F.L. and F.Y.; investigation, F.L., F.Y. and R.Y.; resources, F.Y.; data curation, F.L., Y.L. and H.X.; writing-original draft preparation, F.L.; writing-review and editing, F.L. and F.Y.; visualization, F.L. and X.Q.; supervision, F.Y., X.Q., Y.L., R.Y. and H.X.; project administration, F.L.; funding acquisition, F.Y. and X.Q. All authors have read and agreed to the published version of the manuscript.

Funding

This research was funded by the National Key Research and Development Program of China, grant number (2021YFC3090304).

Institutional Review Board Statement

Not applicable.

Informed Consent Statement

Not applicable.

Data Availability Statement

Restrictions apply to the availability of these data. Data were obtained from [China University of Minning and Technology (Beijing)] and are available [from the authors] with the permission of [China University of Minning and Technology (Beijing)].

Conflicts of Interest

The authors declare no conflict of interest.

References

  1. Benedetto, A.; Tosti, F.; Ciampoli, L.B.; D’Amico, F. An overview of ground-penetrating radar signal processing techniques for road inspections. Signal Process. 2017, 132, 201–209. [Google Scholar] [CrossRef]
  2. Nectaria, D.; Peter, A.A.; Steven, R.J.; Dylan, K. A GPR-Based Pavement Density Profiler: Operating Principles and Applications. Remote Sens. 2021, 13, 2613. [Google Scholar]
  3. Lai, W.W.; Derobert, X.; Peter, A. A review of ground penetrating radar application in civil engineering: A 30-year journey from locating and testing to imaging and diagnosis. NDT E Int. 2018, 96, 58–79. [Google Scholar]
  4. Yang, J.; Yunling, D. 2D Wavelet Decomposition and F-K Migration for Identifying Fractured Rock Areas Using Ground Penetrating Radar. Remote Sens. 2021, 13, 2280. [Google Scholar]
  5. Paola, M.B.M.; José, T.A.J.; Genda, C.; Neil, L.A.; dos Santos, A.B. Ground penetrating radar for assessment of reinforced concrete wastewater treatment plant. J. Civ. Struct. Health Monit. 2020, 11, 1–14. [Google Scholar]
  6. Klewe, T.; Strangfeld, C.; Kruschwitz, S. Review of moisture measurements in civil engineering with ground penetrating radar—Applied methods and signal features. Constr. Build. Mater. 2021, 278, 122250. [Google Scholar] [CrossRef]
  7. Zhang, X.; Feng, X.; Zhang, Z.; Kang, Z.; Chai, Y.; You, Q.; Ding, L. Dip Filter and Random Noise Suppression for GPR B-Scan Data Based on a Hybrid Method in f-x Domain. Remote Sens. 2019, 11, 2180. [Google Scholar] [CrossRef] [Green Version]
  8. Kang, M.S.; Kim, N.; Im, S.B.; Lee, J.J.; An, Y.K. 3D GPR Image-based UcNet for Enhancing Underground Cavity Detectability. Remote Sens. 2019, 11, 2545. [Google Scholar] [CrossRef] [Green Version]
  9. Solla, M.; Lagüela, S.; González-Jorge, H.; Arias, P. Approach to identify cracking in asphalt pavement using GPR and infrared thermographic methods: Preliminary findings. NDT E Int. 2014, 62, 55–65. [Google Scholar] [CrossRef]
  10. Meecan, B.; Io, B.; Bucak, H.M. Feature vector for underground object detection using B-scan images from GprMax. Microprocess. Microsyst. 2020, 76, 103116. [Google Scholar] [CrossRef]
  11. Du, Y.; Du, Z.; Liu, C. Road Diseases Recongition of Ground Penetrating Radar Based on Extreme Gradient Boosting. J. Tongji Univ. Nat. Sci. 2020, 48, 1742–1750. [Google Scholar]
  12. Li, S.; Gu, X.; Xu, X.; Xu, D.; Dong, Q. Detection of concealed cracks from ground penetrating radar images based on deep learning algorithm. Constr. Build. Mater. 2021, 273, 121949. [Google Scholar] [CrossRef]
  13. Li, H.; Li, N.; Wang, H.; Gui, Z.; Song, D. An Algorithm of Subsurface Defect Detection for Airport Runway Based on GPR. IEEE Robot. Autom. Lett. 2021, 6, 3001–3008. [Google Scholar] [CrossRef]
  14. Liu, Z.; Wu, W.; Gu, X.; Li, S.; Wang, L.; Zhang, T. Application of Combining YOLO Models and 3D GPR Images in Road Detection and Maintenance. Remote Sens. 2021, 13, 1081. [Google Scholar] [CrossRef]
  15. Treisman, A.M.; Gelade, G. A feature-integration theory of attention. Cogn. Psychol. 1980, 12, 97–136. [Google Scholar] [CrossRef]
  16. Lee, D.; Choi, M.; Lee, J. Prediction of Head Movement in 360-Degree Videos Using Attention Model. Sensors 2021, 21, 3678. [Google Scholar] [CrossRef] [PubMed]
  17. Feng, D.; Liu, S.; Wang, X.; Yang, J.; Wang, X. The Noise Attenuation and Stochastic Clutter Removal of Ground Penetrating Radar Based on the K-SVD Dictionary Learning. IEEE Access 2021, 9, 74879–74890. [Google Scholar] [CrossRef]
  18. Liu, Z.; Wu, Y.; Liu, B.; Liu, M.; Lan, R.; Sun, H. Research on the interference elimination method of GPR signal for tunnel geological prediction. Chin. J. Eng. 2020, 42, 390–398. [Google Scholar]
  19. Bilgili, F. Business cycle co-movements between renewables consumption and industrial production: A continuous wavelet coherence approach. Renew. Sustain. Energy Rev. 2015, 52, 325–332. [Google Scholar] [CrossRef]
  20. Bilgili, F.; Lorente, D.B.; Kukaya, S.; Nlü, F.; Rosha, P. The role of hydropower energy in the level of CO2 emissions: An application of continuous wavelet transform. Renew. Energy 2021, 178, 283–294. [Google Scholar] [CrossRef]
  21. Huang, S.C.; Cheng, F.C.; Chiu, Y.S. Efficient Contrast Enhancement Using Adaptive Gamma Correction with Weighting Distribution. IEEE Trans. Image Process. A Publ. IEEE Signal Process. Soc. 2013, 22, 1032–1041. [Google Scholar] [CrossRef] [PubMed]
  22. Ak, A.; Rkj, A.; Nkn, B. An improved Gamma correction model for image dehazing in a multi-exposure fusion framework. J. Vis. Commun. Image Represent. 2021, 78, 103122. [Google Scholar]
  23. Xu, Z.; Yang, J.; Zhang, W.; Yang, Z. Regions of Interest Detection Algorithm Based on Improved Visual Attention Model. Appl. Mech. Mater. 2014, 513, 3368–3371. [Google Scholar] [CrossRef]
  24. Tang, J.; Li, M.; Li, Z. Tag ranking based on salient region graph propagation. Multimed. Syst. 2015, 21, 267–275. [Google Scholar] [CrossRef]
  25. Corbetta, M.; Shulman, G.L. Control of goal-directed and stimulus-driven attention in the brain. Nat. Rev. Neurosci. 2002, 3, 201. [Google Scholar] [CrossRef]
  26. Dacey, D.; Packer, O.S.; Diller, L.; Brainard, D.; Lee, B. Center surround receptive field structure of cone bipolar cells in primate retina. Vis. Res. 2000, 40, 1801–1811. [Google Scholar] [CrossRef] [Green Version]
  27. Zhao, M.; Qiu, W.; Wen, T.; Liao, T.; Huang, J. Feature extraction based on Gabor filter and Support Vector Machine classifier in defect analysis of Thermoelectric Cooler Component. Comput. Electr. Eng. 2021, 92, 107118. [Google Scholar] [CrossRef]
  28. Ananyev, E.; Yong, Z.; Hsieh, P. Center-surround velocity-based segmentation: Speed, eccentricity, and timing of visual stimuli interact to determine interocular dominance. J. Vis. 2019, 19, 3. [Google Scholar] [CrossRef]
  29. Liu, C.; Tan, Z.; Yang, J.; Zhang, C.; Xu, H.; Okasha, A.; Arbab, A.M.H. Ultrasonic diagnosis of functional dyspepsia under adaptive partial differential denoising model and its relationship with Helicobacter pylori infection. Results Phys. 2021, 26, 104387. [Google Scholar] [CrossRef]
  30. Harshalatha, Y.; Biswas, P.K. Structural similarity-based rate control algorithm for 3D video. Multimed. Tools Appl. 2021, 80, 25897–25908. [Google Scholar] [CrossRef]
Figure 1. Continuous profile scanning survey of GPR.
Remotesensing 14 01546 g001
Figure 2. Algorithm processing flow chart.
Remotesensing 14 01546 g002
Figure 3. Detection route and equipment: (a) Detection route marked by blue line; (b) Detection equipment.
Remotesensing 14 01546 g003
Figure 4. Partial GPR images 1−8 (ah).
Remotesensing 14 01546 g004
Figure 5. The average PSNR and average SSIM: (a) The average PSNR; (b) The average SSIM.
Remotesensing 14 01546 g005
Figure 6. Filtered and enhanced GPR images 1−8 (ah).
Remotesensing 14 01546 g006
Figure 7. Gamma transform effect and gray histogram statistical comparison: Gamma transform effect and gray histogram statistical comparison: Filtered GPR images 1−4 (a,e,i,m); Gray histogram of image 1−4 (b,f,j,n); Gamma transformed GPR images 1−4 (c,g,k,o); Gray histogram of Gamma transformed GPR image 1−4 (d,h,l,p).
Remotesensing 14 01546 g007
Figure 8. Partial images brightness features pyramid comparison: (a,d,g,j) are filtered GPR image 1 to filtered GPR image 4; (b,e,h,k) are second-layer brightness features of image 1 to image 4; (c,f,i,l) are ninth-layer brightness features of image 1 to image 4.
Remotesensing 14 01546 g008
Figure 9. Partial image features comparison in different angles: (a,f,k,p) are filtered GPR image 1 to filtered GPR image 4; (b,g,l,q) are the 0° direction feature of image 1 to image 4; (c,h,m,r) are the 75° direction feature of image 1 to image 4; (d,i,n,s) are the 90° direction feature of image 1 to image 4; (e,j,o,t) are the 135° direction feature of image 1 to image 4.
Remotesensing 14 01546 g009
Figure 10. Brightness and directional visual features: (a,d,g,j,m,p,s,v) are the filtered GPR image 1 to filtered GPR image 8; (b,e,h,k,n,q,t,w) are the direction feature of image 1 to image 8; (c,f,i,l,o,r,u,x) are the brightness feature of image 1 to image 8.
Remotesensing 14 01546 g010
Figure 11. Abnormal significance region: (a,c,e,g,i,k,m,o) are the filtered GPR image 1 to filtered GPR image 8; (b,d,f,h,j,l,n,p) are the abnormally significant region.
Remotesensing 14 01546 g011
Figure 12. Algorithm detection result.
Remotesensing 14 01546 g012
Table 1. Typical abnormal images and features.
Abnormal TypeTypical ImageImage FeaturesAbnormal TypeTypical ImageImage Features
Looseness Remotesensing 14 01546 i001From top to bottom in the image, the reflected signal energy changes obviously, and the overall amplitude is strong.Cavity Remotesensing 14 01546 i002Diffraction waves and multiple waves are clearly developed. The reflected signal energy is stronger than the normal region. And the amplitude, phase of this region changes are visibly.
Water-rich Remotesensing 14 01546 i003In the image, the reflected energy of the top surface is strong, the signal is attenuated. This part of the region is brighter than the surrounding region.Stratum subsidence Remotesensing 14 01546 i004The subsidence signal is very different from the surrounding region. And the boundaries of this region are clear. Most importantly, the shape has an extension in a certain direction.
Pipeline Remotesensing 14 01546 i005Most of the images show regular hyperbolic features. It can find the diffraction phenomenon in the GPR image.
The reflected signal of this region changes dramatically
Pipe drain Remotesensing 14 01546 i006The hyperbolic diffraction phenomenon is easily observed. And there is a horizontal extension at the top. The frequency of this region is higher than the background field.
Publisher’s Note: MDPI stays neutral with regard to jurisdictional claims in published maps and institutional affiliations.

