Article

Impact of Aerosol Mixing State and Hygroscopicity on the Lidar Ratio

1
Guangdong Provincial Key Laboratory for Climate Change and Natural Disaster Studies, School of Atmospheric Sciences, Sun Yat-sen University, Zhuhai 519082, China
2
Institute of Tropical and Marine Meteorology of CMA, Guangzhou 510640, China
3
Southern Marine Science and Engineering Guangdong Laboratory (Zhuhai), Zhuhai 519082, China
4
Guangdong Provincial Field Observation and Research Station for Climate Environment and Air Quality Change in the Pearl River Estuary, Guangzhou 510275, China
5
Laboratory for Atmospheric Research, Department of Civil and Environmental Engineering, Washington State University, Pullman, WA 99164, USA
6
Hong Kong Observatory, Kowloon, Hong Kong
*
Author to whom correspondence should be addressed.
These authors contributed equally to this work.
Remote Sens. 2022, 14(7), 1554; https://doi.org/10.3390/rs14071554
Submission received: 11 February 2022 / Revised: 19 March 2022 / Accepted: 21 March 2022 / Published: 23 March 2022
(This article belongs to the Section Atmospheric Remote Sensing)

Abstract

:
The lidar ratio (LR) is a key parameter for the retrieval of atmospheric optical parameters from lidar equations. In this study, we simulated the optical parameters to investigate the impact factors of the LR using a three-component optical aerosol assumption based on the Mie model. The simulated LR was generally related to the overall particle size of the aerosols, the proportion of elemental carbon (EC), as well as aerosol mixing states and hygroscopicity. The LR was positively correlated with the particle size and volume fraction of elemental carbon (fEC). The LR increased more than three-fold with the increase in fEC from 0% to 40%. The LR of the core-shell (CS) mixing state and homogeneously internal (INT) mixing state was greater than that of the external (EXT) mixing state. The LR of all mixing states increased monotonically with hygroscopicity when the fEC was below 10%, while the LR of the core-shell mixing state (homogeneously internal mixing state) initially decreased (increased) and then increased (decreased) with increasing hygroscopicity when the fEC was more than 20%. These results will help in selecting a reasonable LR for practical applications.

1. Introduction

Atmospheric aerosol particles have a significant direct effect on the radiative balance (IPCC, 2013) and can weaken the hydrological cycle [1]. As cloud condensation and ice nuclei, aerosols play an important role in affecting the cloud characteristics, changing the life cycle of clouds, and thus impacting precipitation [2,3]. Atmospheric aerosol observation methods primarily include ground-based observations and remote sensing detection. Elastic backscatter lidar is one of the most widely used remote sensing detection methods, which can observe the microphysical aerosol characteristics and their vertical distributions. A key parameter, referred to as the lidar ratio (LR), is typically introduced to retrieve the lidar signal and obtain the vertical distribution characteristics of the aerosol extinction coefficient when solving the lidar equation [4,5]. Previous studies have indicated that the LR can be directly observed by a combined Raman elastic-backscatter lidar [6,7,8] or accurately retrieved by a high spectral resolution lidar [9,10]. The LR was also retrieved by combining multi-wavelength lidar, a sunphotometer, and other ground-based observation instruments, according to previous research [11,12,13,14]. However, the physical and chemical properties of aerosols have great heterogeneity and uncertainty in temporal and spatial distributions; hence, it is essential to study how and why the LR changes due to these factors.
The traditional method to determine the LR in practical studies is by employing empirical constants with respect to the types of aerosols, which might lead to great uncertainty. For instance, Schuster et al. [15] compared lidar products from Cloud-Aerosol Lidar, Infrared Satellite Observation (CALIPSO), and Aerosol Robotic Network (AERONET), indicating that the LR of dust aerosols (40 sr) calculated by CALIPSO is smaller than that calculated by AERONET (49.7 sr). AERONET and CALIPSO’s algorithm used to calculate the optical and microphysical properties have been improved in recent years. Shin et al. [16] studied the LR of mixed dust using the version three data released by AERONET, and proved that the LR of the mixture of fine-mode particles with dust is higher than that of the pure dust aerosol. Kim et al. [17] optimized CALIPSO’s aerosol classification algorithm by submitting some new aerosol types. Error analysis by He et al. [13] suggested that the LR is the main error source in the retrieval processes of lidar. Shimizu et al. [18] indicated that using a constant LR value of 50 sr in strong dust events resulted in an error of extinction coefficient up to 50%. Different values of LR will contribute to a great impact on the properties of PBL aerosol products of lidar. Zhao et al. [19] calculated the lidar ratio under different relative humidity and compared the extinction coefficient profiles retrieved by different LR. The results show that fixed LR may lead to deviation of lidar products such as the mixed layer height and the radiation energy distribution in the vertical direction. The characteristics of the extinction coefficient calculated by corrected LR may also contribute to a reinterpretation of the structure of the mixed layer.
The LR is determined by the extinction and backscattering coefficients (Equation (1)). These two aerosol optical parameters are jointly influenced by several factors, such as the aerosol particle number size distribution (PNSD), the mixing state of elemental carbon (EC), hygroscopicity, relative humidity (RH), complex refractive index, and incident light wavelength. Zhao et al. [20] calculated the LR at different wavelengths using Mie theory and the PSND of aerosols measured by an aerodynamic particle sizer spectrometer (APS). The results suggested that the LR is positively correlated with the effective radius of the aerosol and the ratio of coarse and fine particles. Song et al. [21] found that the LR has a high correlation with the Ångström exponent, which is typically used to indicate the overall particle size of aerosols, when the aerosol types are continental, marine, and desert aerosols.
The mixing state of EC refers to the pattern of how the EC is mixed with a non-light absorbing component, including the external mixing state (EXT), core-shell mixing state (CS), and homogeneously internal mixing state (INT). The optical properties of aerosols vary substantially with the mixing states [22,23,24]. Numerical simulations suggest that the absorption coefficient of aerosols in the INT can reach 2–3 times of that in the EXT [25,26,27]. Additionally, the difference in the hemispherical backscattering fraction (HBF) between the EXT and the CS was greater than 50% at an incident light wavelength of 550 nm [28]. However, few studies have analyzed the influence of the aerosol mixing state on the LR, which is one of the main objectives of this study. There are significant diurnal variation characteristics and regional distinctions in the different mixing states [28,29,30], which complicates the analysis and applications of the LR.
The optical properties of aerosols are also affected by hygroscopicity, which is typically expressed by the growth factor (Gf) and hygroscopic enhancement factor of aerosol optical properties (f(RH)). The variations in extinction and backscattering are not obvious under relatively low RH, while the extinction and scattering of aerosols increase exponentially with increasing RH [31,32,33]. Aerosols from different sources respond differently to the LR with an increase in the ambient RH [34]. Radiosonde data revealed that the RH exhibited obvious profile characteristics with increasing height, particularly within the mixing layer [35,36]. Zhao et al. [20] analyzed the influence of the particle number size distribution, hygroscopicity, and RH profile on the LR. When the RH was 92%, the LR value was 2.2 times that under dry conditions. Both the observation and simulation results revealed that using a constant LR in the retrieval of lidar data may result in a large error in the retrieved aerosol extinction profile if the influence of the aerosol hygroscopicity and RH on the LR is not considered.
As stated above, many factors affect the LR value of aerosol. However, an inaccurate LR value will result in the deviation of the lidar inversion products. Accurate LR, which is obtained by comparing different channels of Raman lidar [37] or constraining the aerosol optical depths (AODs) [38], will improve the accuracy of lidar products such as atmospheric boundary layer height, optical thickness, extinction coefficient profile, backscattering coefficient profile, and cloud height.
Therefore, it is essential to conduct a detailed study on the factors influencing the LR variation to improve the accuracy of lidar data retrieval. In this study, PNSD data of the different types of aerosol were selected as the samples to calculate the theoretical LR value based on the ‘three-component optical equilibrium aerosol model’ [39]. The results of the LR are varied with the PNSD, fEC, mixing state, hygroscopicity, and RH. The remainder of this paper is organized as follows: Section 2 introduces the LR calculation methods. The results are described in Section 3, and the conclusions are discussed in Section 4.

2. Methodology

2.1. Calculation of Lidar Ratio in the Dry Condition

The LR refers to the ratio of the extinction coefficient to the backscattering coefficient (Equation (1)).
L R = α β
where α is the extinction coefficient of aerosols and β is the 180° backscattering coefficient of aerosol, which are defined in Equations (2) and (3), respectively:
α = π r 2 Q e p r , λ , m ˜ n r d r
β = π r 2 Q b a c r , λ , m ˜ n r d r
where r is the radius of a single particle; λ is the wavelength of the incident laser; m ˜ is the complex refractive index of the particles; n(r) is the PNSD; and Qep and Qbac are the extinction and backscattering efficiencies of the particles, respectively. Therefore, the theoretical value of the LR is calculated using Equation (4):
L R = π r 2 Q e p r , λ , m ˜ n r d r π r 2 Q b a c r , λ , m ˜ n r d r
Generally, the PNSD is simplified as a lognormal distribution model and can be expressed as follows:
n r = d N d r = i = 1 M N t o t , i 2 π r l n σ 0 , i e x p l n r l n r 0 , i 2 2 l n σ 0 2
where Ntot,i denotes the total number concentration of mode i, σ0,I and r0,i are the standard deviation and median radius of mode i , respectively. The number of modes introduced by M includes the nucleation mode (0–20 nm), Aitken mode (20–100 nm), and accumulation mode (100–2000 nm). In this study, the extinction efficiency and 180° backscattering efficiency are calculated using two aerosol simplified spherical models based on the Mie theory: homogeneously spherical model (BHMie) and core-shell double-layer spherical model (BHCoat). In order to simplify the model, the wavelength of the lidar selected in this study is 532 nm.
Aerosols are divided into three components based on their optical characteristics: the light-absorbing component (i.e., EC), non-light-absorbing component (NLB), and water (which is not included in the dry aerosol particles) [22,23,40]. The optical parameters depend on the complex refractive index of each component and the aerosol mixing state when the aerosol PNSD is known. Instead of choosing specific types of aerosol, this study modifies the overall complex refractive index of aerosol by changing the fractions of the three components and their mixing states.
In this work, the complex refractive indices of the EC component ( m ˜ EC = 1.8 + 0.55 i ), NLB component ( m ˜ NLB , dry = 1.55 + 10 7 i ), and water ( m ˜ water = 1.33 + 10 9 i ) were obtained from previous studies [28,41,42,43,44,45]. The volume fraction of EC (fEC), which is defined in Equation (6), was assumed to be uniform for each particle size in this study.
f EC = V EC V dry
Therefore, the aerosol complex refractive index of homogeneously internal mixture is calculated according to the volume averaging rule [46]:
m ˜ INT , dry = m ˜ EC f EC , dry + m ˜ NLB , dry ( 1 f EC , dry )

2.2. Calculation of Lidar Ratio under the Wet Condition

The aerosol particle diameter, complex refraction index, optical properties, and LR change when hygroscopic particles absorb moisture under wet conditions. The hygroscopic growth factor (Gf) is introduced to describe the increase in particle size:
G f = r wet r dry
The PNSD under wet conditions is calculated using the Gf and PNSD under dry conditions. The hygroscopic growth of aerosol particles is affected by the hygroscopicity and RH. Aerosol hygroscopicity can be expressed by parameter κ [47], which has been reported to range from 0–0.6 in the majority of regions in China [48]. The hygroscopic growth factor of aerosol particles is calculated as in previous studies [49]:
G f 1 + κ R H 100 R H 1 3
The extinction and backscattering efficiencies of particles that have undergone hygroscopic growth are solved using three spherical particle models. The necessary input parameters are listed in Table 1.
Where r t , λ , m ˜ EC , m ˜ NLB , dry , m ˜ NLB , wet , r c , m ˜ c , m ˜ s , m ˜ INT , dry ,   a n d   m ˜ INT , wet represent the radius of the particle, incident wavelength, complex refractive index of the EC component, complex refractive index of the NLB component under dry conditions, complex refractive index of the NLB component under dry conditions, radius of the core, complex refractive index of the core, complex refractive index of the shell, overall complex refractive index of the homogeneously internal mixture particles under dry conditions, and overall complex refractive index of the homogeneously internal mixture particles under wet conditions, respectively.
We also assumed that Gf is uniform for all aerosol particle sizes and that the EC component is water-insoluble, implying that m ˜ EC does not change at all. The complex refractive indices under wet conditions were calculated as follows:
m ˜ NLB , wet = m ˜ NLB , dry f NLB , wet + m ˜ water f water f NLB , wet + f water
m ˜ INT , wet = m ˜ EC f EC , wet + m ˜ NLB , dry f NLB , wet + m ˜ water f water
where fNLB,wet, fEC,wet, and fwater represent the volume ratio of the NLB component, EC component, and water in the wet condition, respectively (Equations (12)–(14)):
f EC , wet = f EC f EC + 1 f EC G f 3
f NLB , wet = 1 f EC f EC + 1 f EC G f 3
f water = 1 f EC , wet f NLB , wet

3. Results and Discussion

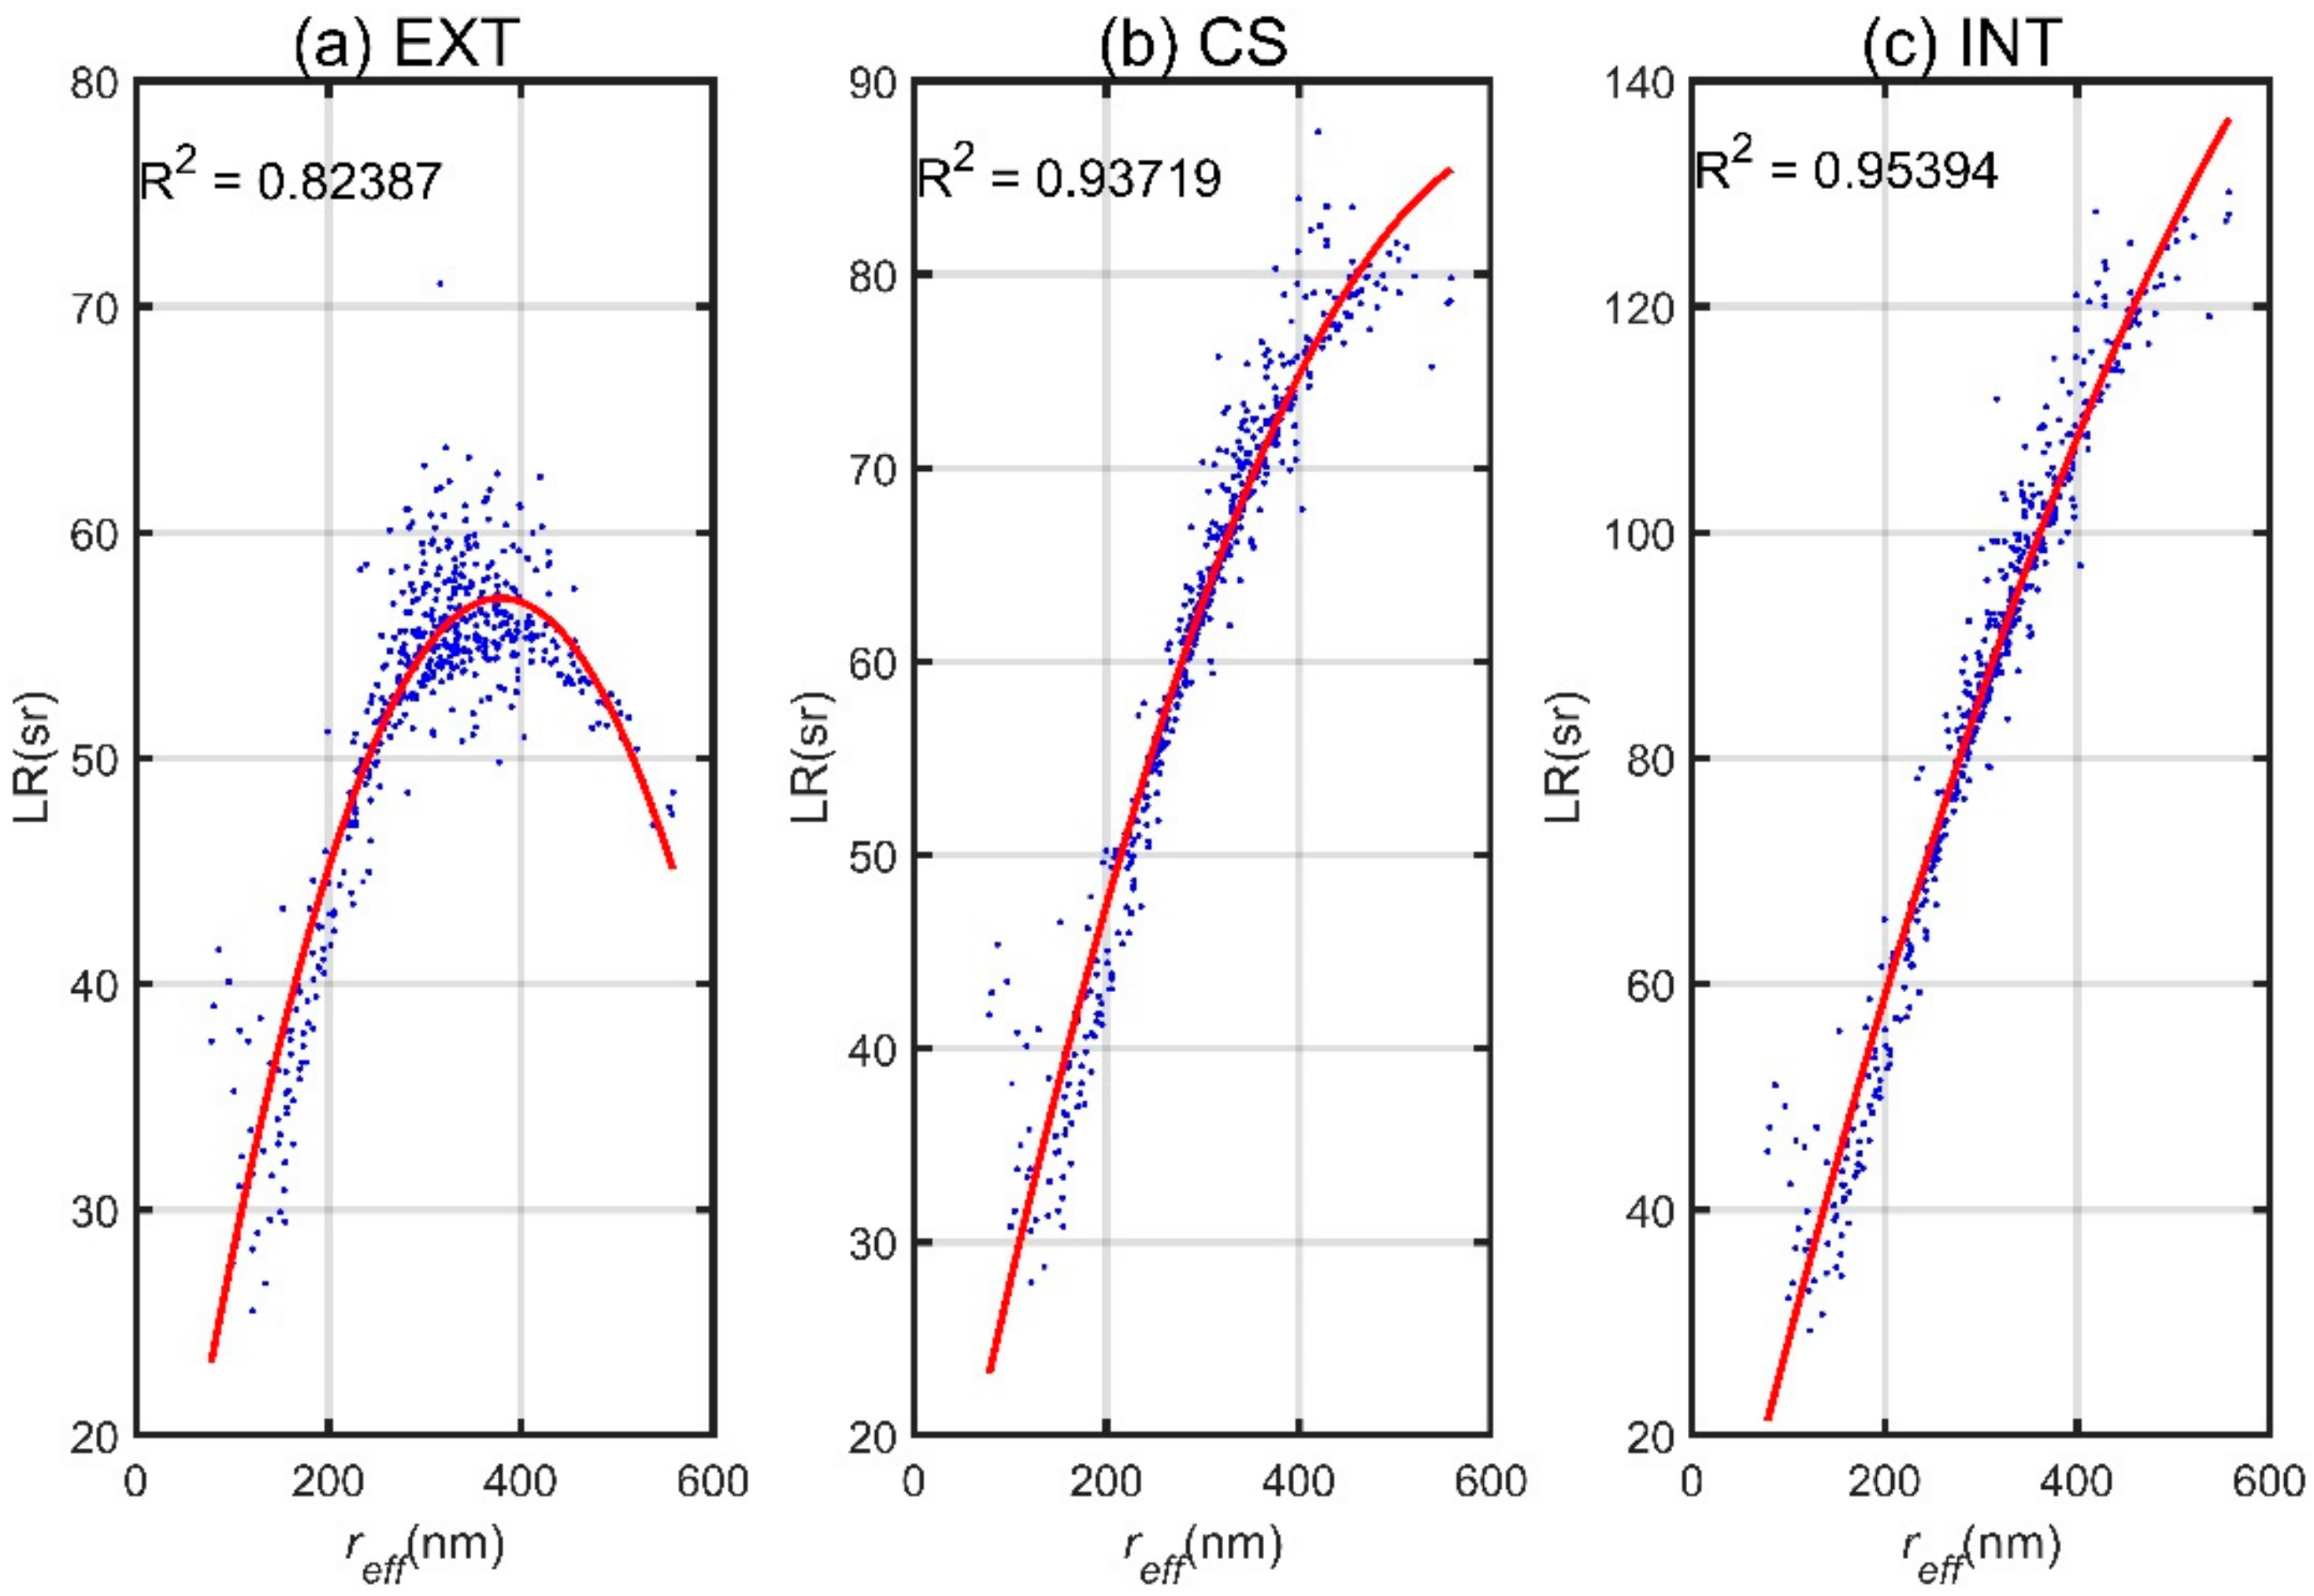
3.1. Influence of the Particle Number Size Distribution on the LR

To inform the LR characteristics among the different regions, the aerosol PNSDs of East Asia (EA), Europe (EU), Latin America (LA), and North America (NA), reported by Wu et al. [50]), were utilized to simulate the aerosol optical properties as well as the LR. The median PNSDs of the four regions were obtained by synthesizing 525 PNSD observations from 1998 to 2017, as shown in Figure 1. The PNSDs exhibited significant variations in their shapes and magnitudes. The aerosol number concentration in EA is approximately the same order of magnitude as that in NA, while the diameter corresponding to the prominent mode in EA (60 nm) is approximately twice as large as that in LA (30 nm). The median PNSDs in EU and LA display similar structural characteristics, both of which are dominated by the nucleation mode and Aitken mode particles [50]. It can be seen from Figure 1 that the samples selected in this study are mainly fine-mode aerosol particles. Shin et al. [51] reported that dust was hydrophobic aerosol with coarse mode fraction over 0.9 and volume depolarization ratio greater than 0.2. Therefore, we do not consider the effect of dust in this study.
Based on the Mie theory, the LRs were simulated for the EXT, CS, and INT mixing states. The volume fraction of EC was set to 0.1, and the complex refractive indices were 1.8 + 0.55i and 1.55 + 10−7i for EC and NLB, respectively (refer to Section 2). Considering the difference in the type of PNSD, the LR was noticeably lower in the NA region than in the other three regions by 30–50%, as shown in Figure 2. The median LR values in EA, EU, and LA were similar in magnitude under the same mixing conditions. The proportion of PNSD in the nucleation, Aitken, and accumulation modes shown in Figure 3 are used to study the influence of the number size distribution on LR.
The calculated LR value in this study was relatively larger than that obtained by Raman lidar in previous studies [6,37] wherein the average LR was 39 sr to 59 sr and 37 sr to 65 sr for urban haze and South-East Asian aerosols, respectively. In addition to the distinction of aerosol physical and chemical characters among regions, another probable reason is that the backscattering signal obtained by Raman lidar is not only the backscattering signal at 180°, but also that within a small angle at approximately 180°. This leads to a larger backscattering signal in the actual observation compared to the calculated theoretical backscattering value. On the other hand, the fraction of EC in mainland China was reported to be between 5% and 10% [52] while it was occasionally increased to approximately 30% in some pollution events [53,54,55]. Thus, considering that the LR rapidly increased with fEC (discussed in Section 3.3), the EC content reported in previous observations were typically lower than the EC volume ratio assumed in this study.
Similarly, the proportions of the accumulation and Aitken modes were found to be the highest and the lowest, respectively, in the EA, while those in NA showed the opposite trends. This shows that the aerosol size particles in EA tend to be larger than those in LA. The proportions of both the accumulation and Aitken modes are high in EU and LA, corresponding to a wide range of PNSD peaks. To study the influence of particle size on the LR, the effective particle size reff,i is defined by Equation (15) [20,56]:
r e f f , i = π r 3 n i r d r π r 2 n i r d r
where i represents the number of samples (up to 525), and ni represents the number of particles of the corresponding particle size. The r parameter is used to indicate the overall particle size of the corresponding sample. A regression analysis of the LR was conducted for each sample, and the results are shown in Figure 4.
As shown in Figure 4, the reff values are generally positively correlated with the LR value for all mixing states, consistent with previous studies [14,20,21]. However, it is worth noting that, when the effective particle size increased higher than 380 nm, the LR of the EXT tended to be negatively correlated with the effective particle size. This is because the LR mainly depends on the variation of aerosol extinction and backscattering for different PNSD and mixing states. As shown in Figure S3, the variations of extinction and backscattering efficiency of single particles were displayed. The extinction efficiency of a single particle rapidly increases with the particle size, meanwhile, the backscattering efficiency keeps increasing with fluctuation. The fast increase in the extinction efficiency dominates the LR and leads to an increase in LR. However, when the particle size exceeds a critical point, the extinction efficiency decreases with the increase in particle size, as is shown in Figure S3a, while the backscattering efficiency still increases with fluctuation, as is shown in Figure S3b, which will lead to the decrease in LR. This demonstrated that the LR was positively correlated with reff in a certain effective particle size range, while the range is different for three mixing states.

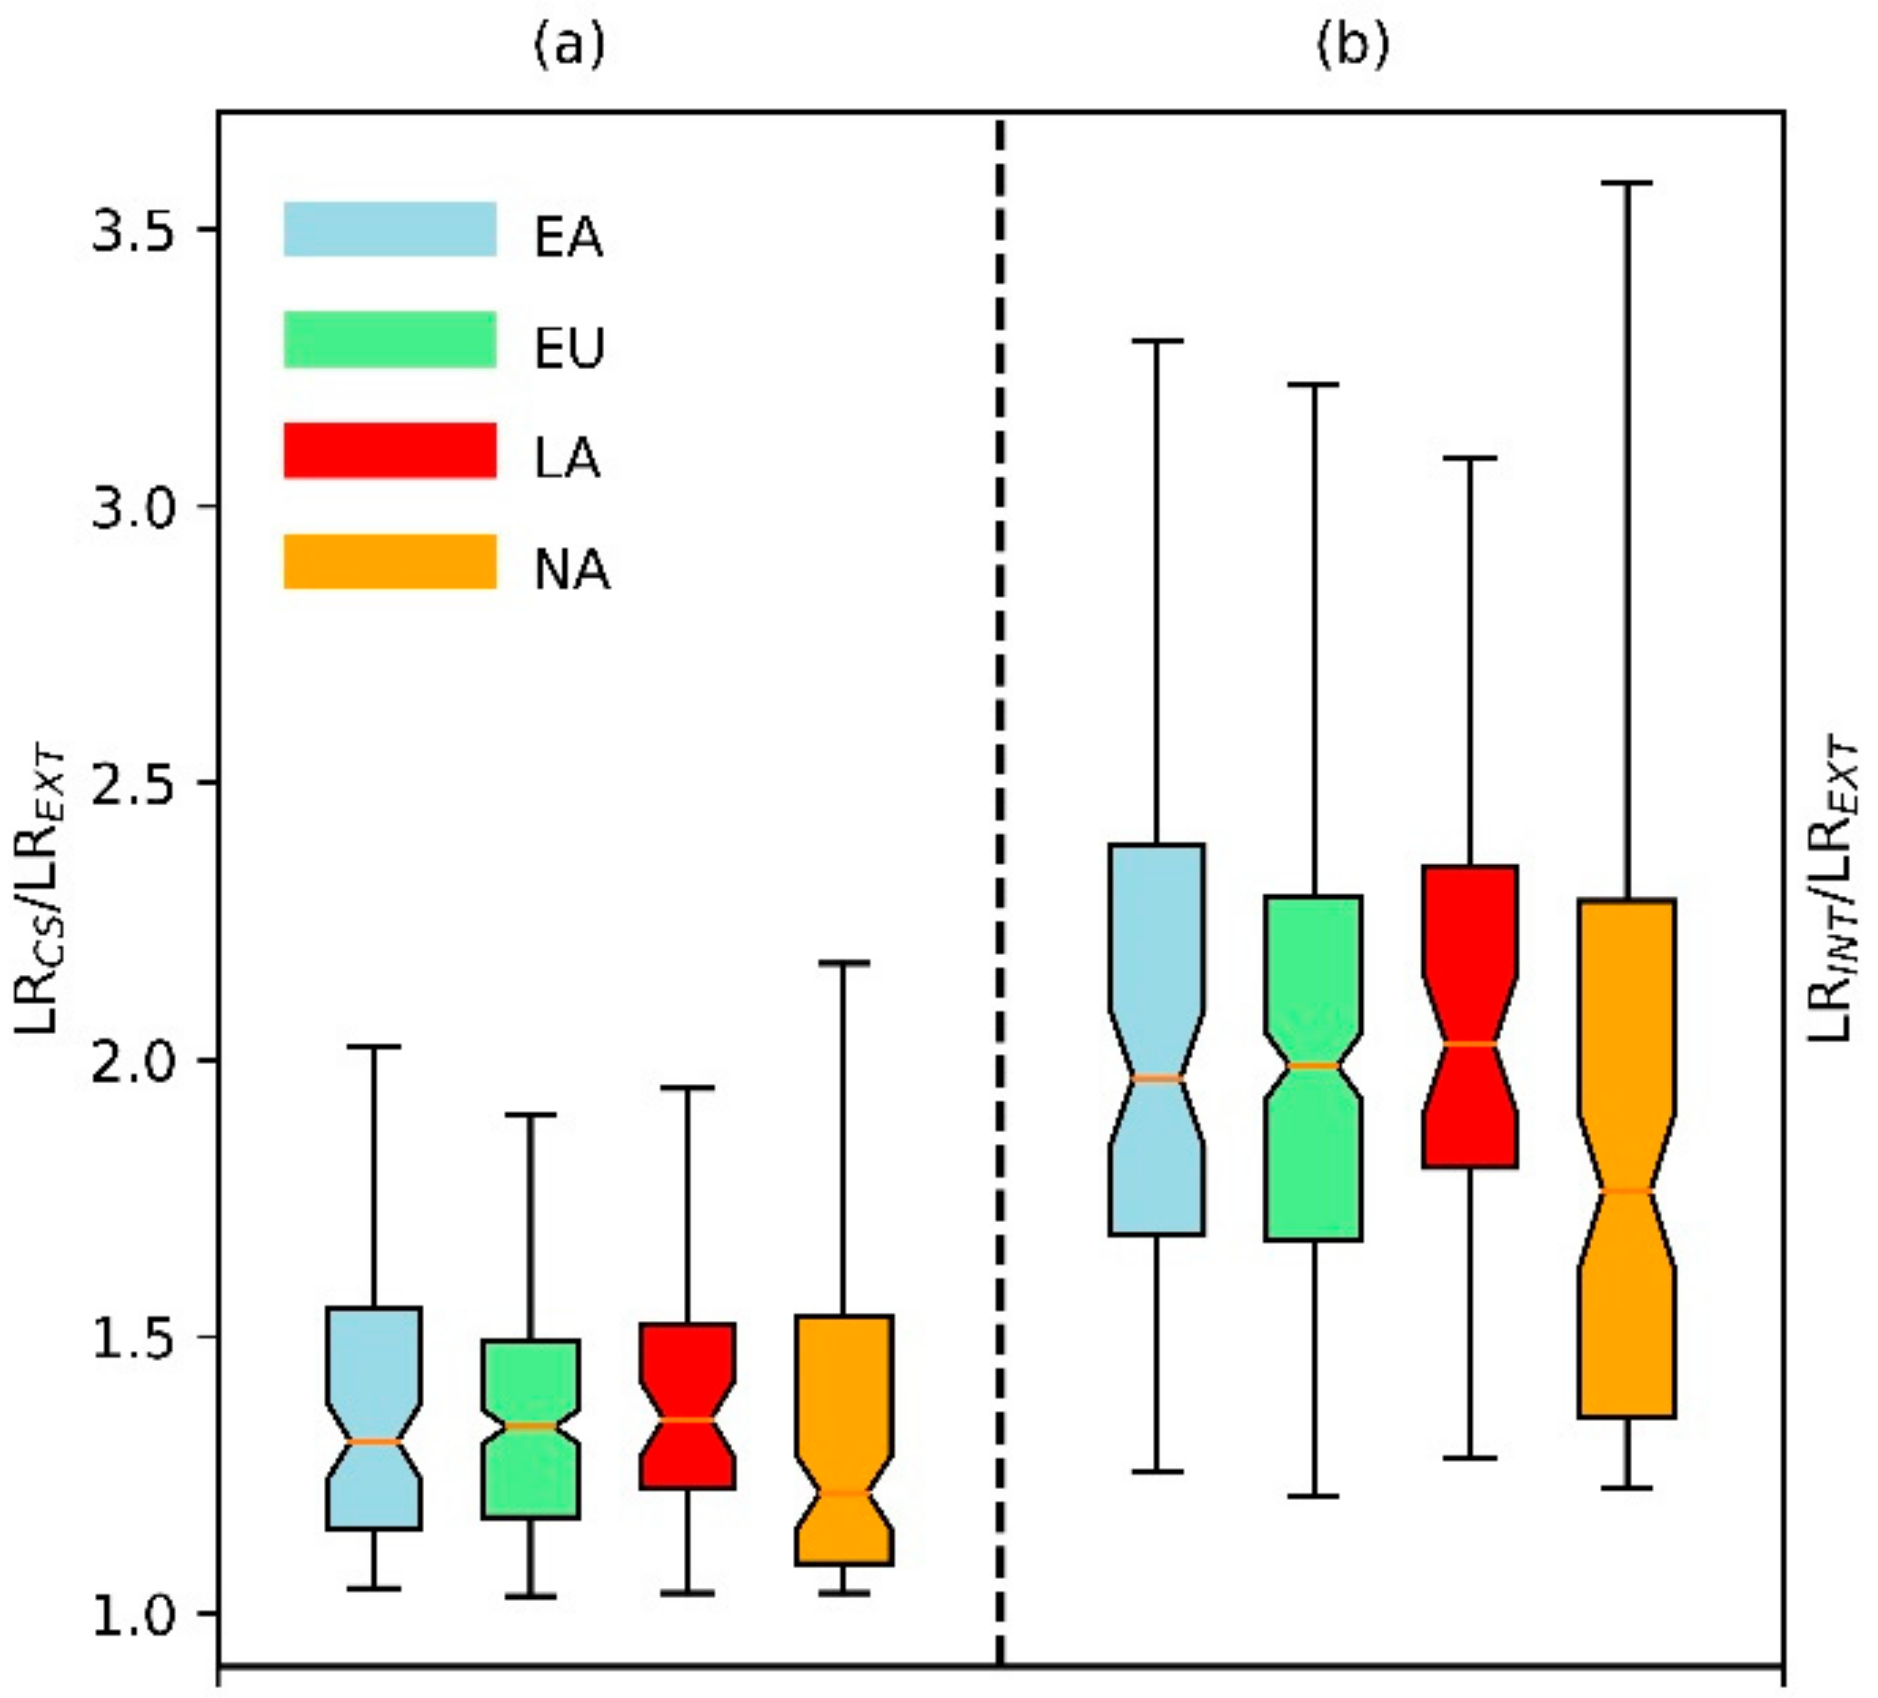
3.2. Influence of the Mixing State on LR under the Dry Condition

As is shown in Figure 2, the LR of INT is the highest among the three mixing states, whereas that of the EXT is the lowest. For the same type of PNSD, there is little distinction among the extinction coefficients calculated for the three mixing states (Figure 5a), which agrees with the results of previous studies [28,29,39]. As is shown in Figure 5b, the simulated absorption coefficients of INT and CS were considerably higher than those of EXT. This is because only the EC particles contribute to the light absorption of aerosols in EXT. In contrast, in INT and CS, the light absorption capacity of particles is amplified when EC is mixed internally or as a core surrounded with non-EC components due to the ‘lensing effect’ [28,29,39]. Consequently, as is shown in Figure 5c, the simulated scattering coefficient of EXT is higher than that of CS and INT. At the same time, Figure 5d also shows that the backscattering coefficient of CS and INT is smaller than that of EXT. This illustrates that backscattering is affected by the aerosol mixing states, and thus alters the LR.
The median value and standard deviation of the LR exhibited significant differences under the different mixing states, as is shown in Figure 2. Under EXT, the LR shows the lowest median and the smallest standard deviation, whereas INT shows the highest median and the highest standard deviation. To evaluate the effects of different mixing states on the LR calculation, the ratios of LR under the three mixing states are defined in Equations (16) and (17).
r 1 = L R CS , i L R EXT , i
r 2 = L R INT , i L R EXT , i
where i represents the number of samples (up to 525), and r1 and r2 are the ratios of LR under CS and INT to those under EXT, respectively. In general, the median r1 and r2 values were 1.2–1.4 and 1.7–2.1, respectively (Figure 6). The variation range of r2 is greater than that of r1, which implies that the LR is most sensitive to INT. It is necessary to evaluate the influence of the EC mixing state on the LR calculation and improve the accuracy of the extinction coefficient in the retrieval of the lidar equation.

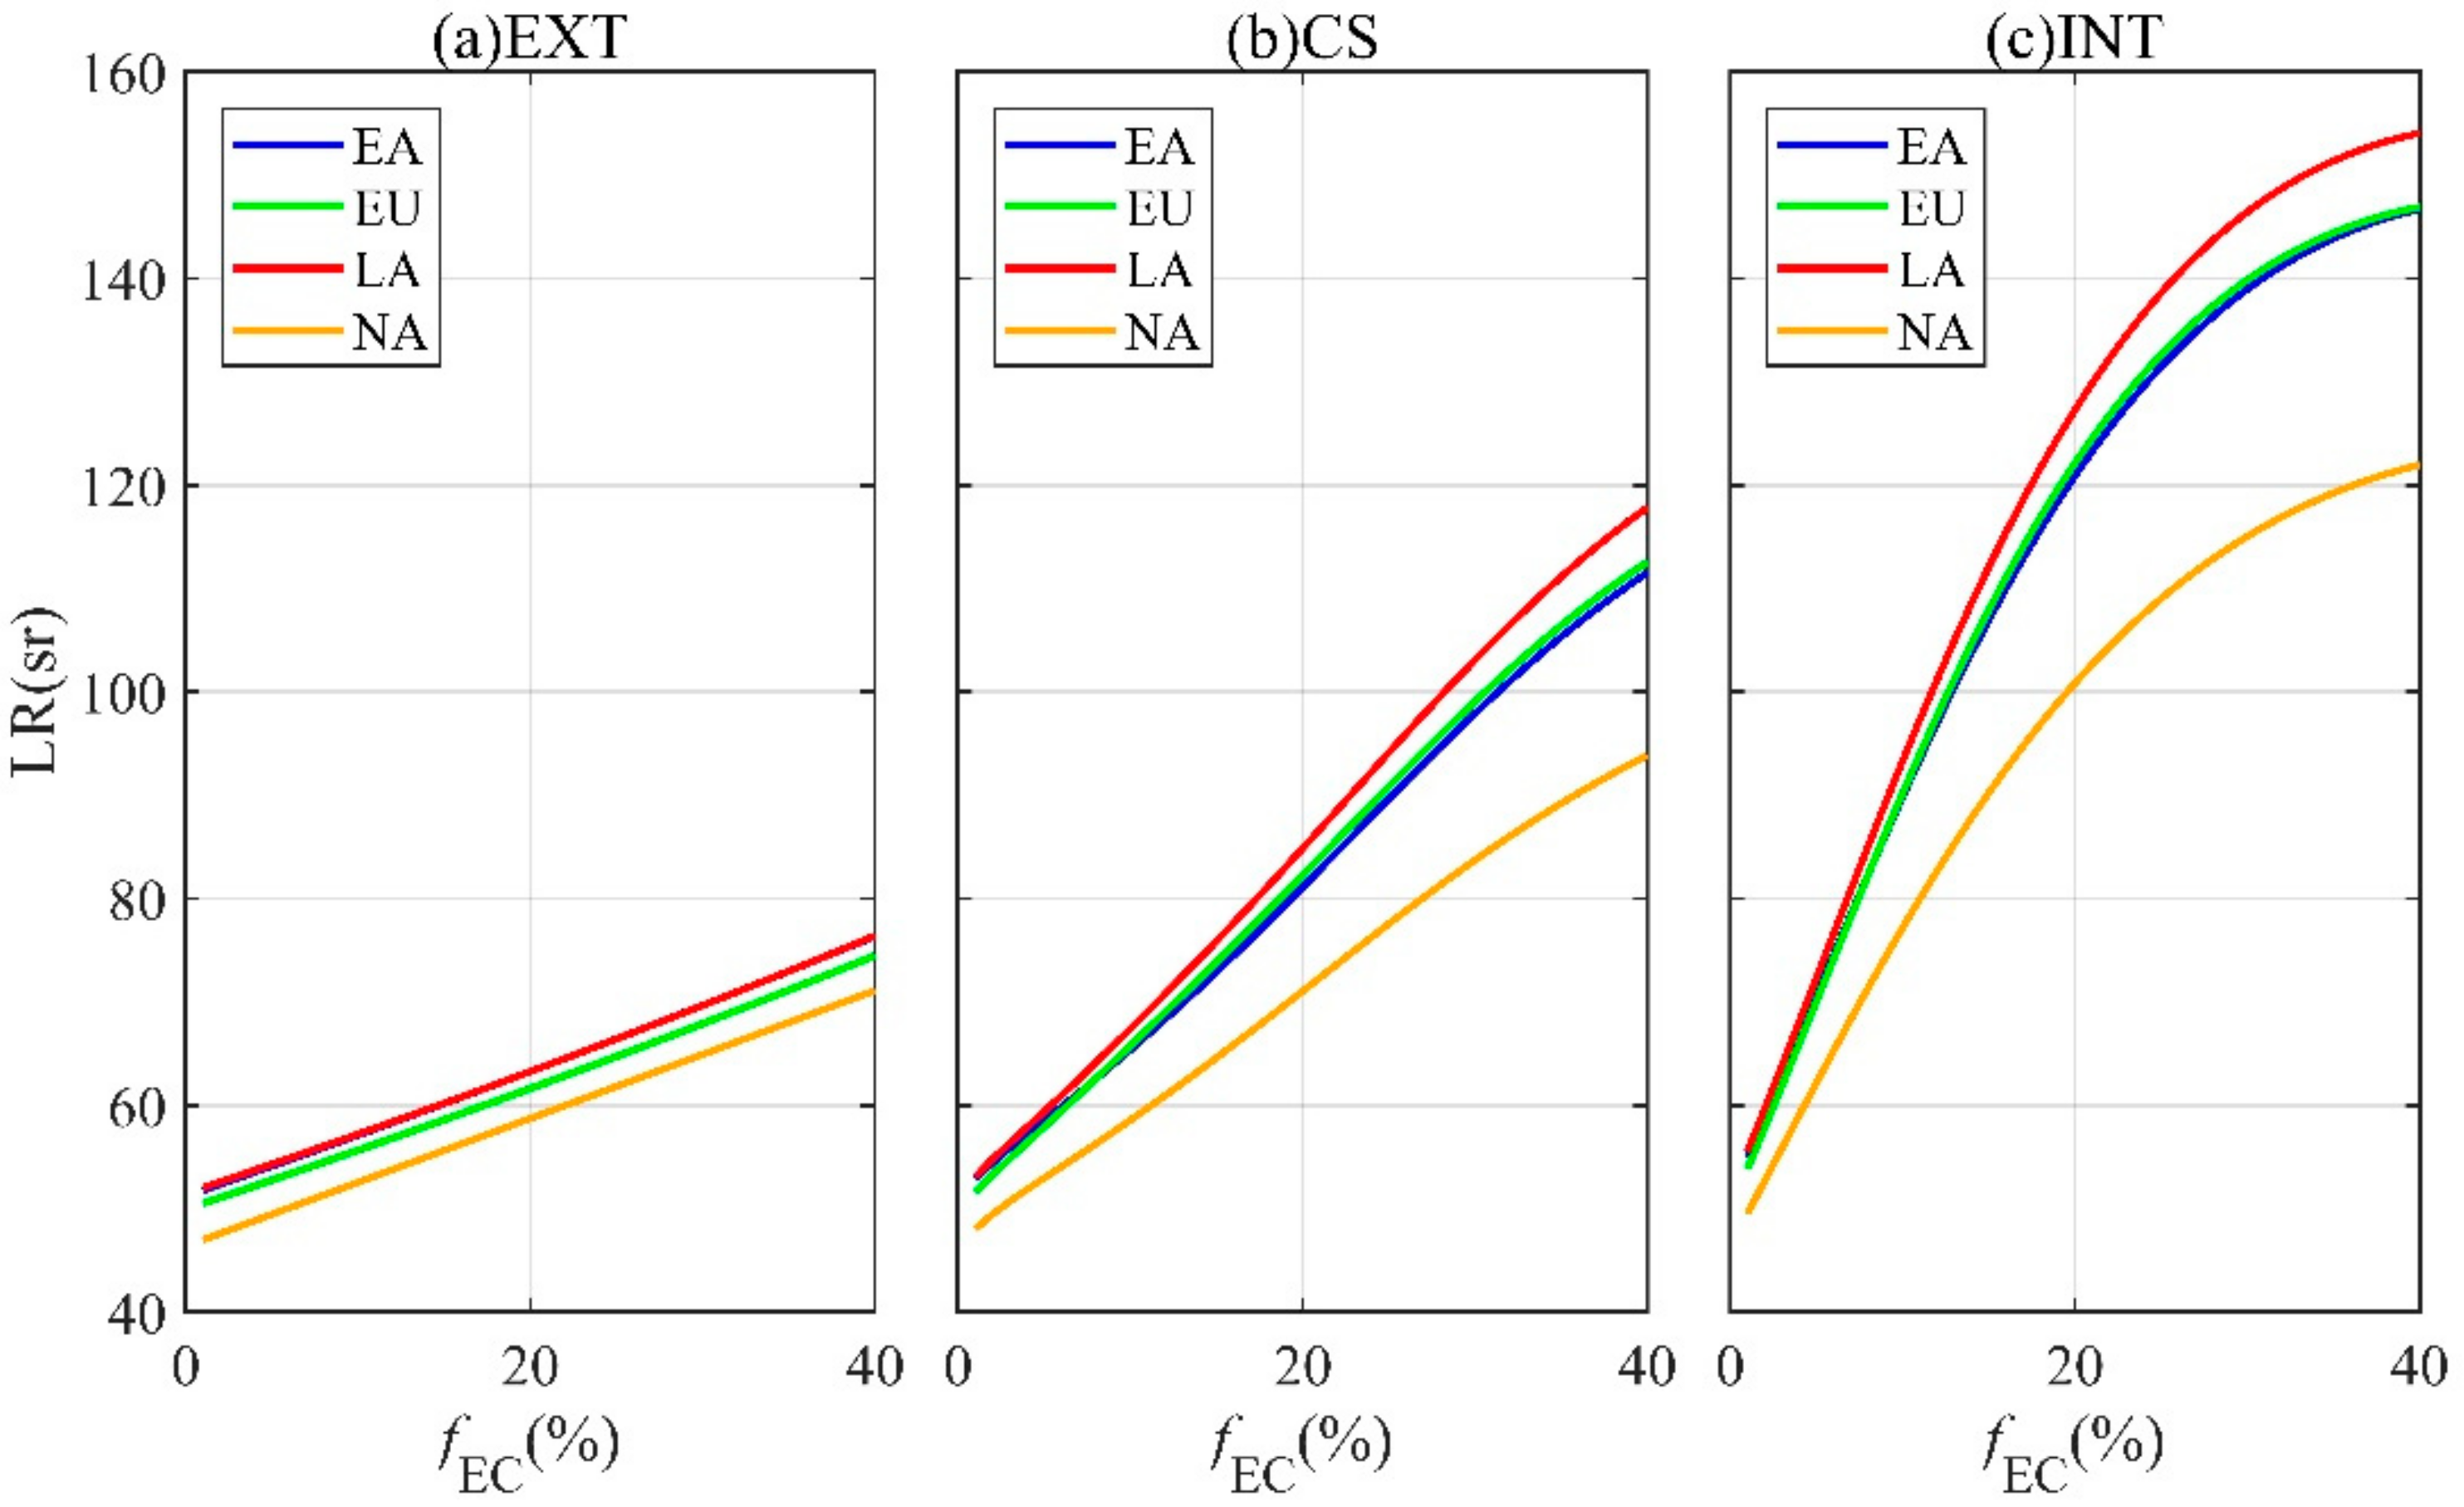
3.3. Influence of the Volume Fraction of EC on the LR under the Dry Condition

The LR is also affected by the chemical composition, particularly the ratio of the EC volume to the total aerosol volume, apart from the PNSD and mixing states. The volume ratio of EC (fEC) changes the aerosol complex refraction index, thus altering the LR calculated from the Mie model. To investigate the impact of the fEC on the LR of different mixing states, Figure 7 shows the change of simulated LR with fEC values of EXT, CS, and INT.
The medians of the PNSDs in the EA, EU, LA, and NA regions were chosen for the calculation (Figure 1) (Figure S1, hygroscopic parameters). In general, the LR values in the four regions increased with increasing fEC when the fEC was less than 40%. However, the growth rates of LRs were different under the three mixing states. The LR was the highest in LA and the lowest in NA due to the differences in PNSDs, which was consistent with the results shown in Figure 1. As shown in Figure 7a, the LR increased linearly with an increase in the fEC under EXT. A higher fEC implies the presence of more EC particles, which can linearly enhance the aerosol absorption coefficient due to the increase in independent light-absorbing EC particles. Nevertheless, as fEC increased, the LR values nonlinearly increased under CS and INT (Figure 7b,c). With an increase in the volume fraction of EC, the EC core in each particle became greater under CS, which led to a stronger ‘lensing effect’. Similarly, the light-absorbing ability of aerosols increased, owing to the change in the aerosol complex index under INT, which also nonlinearly enhanced the light absorption and the LR. Moreover, the discrepancy in the LR between the LA and NA regions increased, particularly for INT. The results indicated that LR increased with an elevated volume fraction of EC, whereas the growth rate of LR was different under the three mixing states. Moreover, the discrepancy in the LR calculated with different PNSDs barely changed under EXT. The discrepancy of LR increased with increasing fEC under CS and INT, and both the PNSD and fEC impacted the ‘lensing effect’, thereby altering the LR.

3.4. Influence of Hygroscopicity on the LR

The hygroscopic growth of aerosol particles is affected by the hygroscopicity and RH. In this section, the median value of PNSD in mainland China [50] is used to calculate the aerosol optical properties and the LR based on the Mie model. We used single hygroscopicity parameter (κ = 0.0–0.6) data from hygroscopic experiments in China over the past 20 years [48] to study the impact of hygroscopicity on the LR. The growth factor (Gf) of particle size was obtained by combining κ and RH according to Equation (9) (Brock et al. [49]), and was then utilized into the Mie model calculation in wet condition, the details of which were given in Section 2.2 (Figure S2).
To study the variation in the LR due to the hygroscopic growth of aerosol particles, the hygroscopic enhancement factor of LR was introduced in Equation (18). The variations in LR with κ, RH, and fEC for the three mixing states are shown in Figure 8.
f R H L R = L R wet L R dry
The LR value increased with elevated κ and RH when the fEC values were 10, 20, and 30% under EXT. Only the non-EC components, which can grow under wet conditions, were considered to be hygroscopic. The extinction and backscattering were exponentially enhanced owing to the growth of non-EC components. The LR increased up to 1.8 times when the RH ranged from 40% to 100% under the same κ and the fEC value was from 10% to 20%. Nevertheless, the LR first decreased and then increased when the fEC value was 30%.
To study the variation of optical parameters due to the hygroscopic growth of aerosol particles, the hygroscopic enhancement factor of the extinction coefficient f(RH)ep and backscattering coefficient f(RH)bac were introduced in Equations (19) and (20), which is the ratio of the optical parameters in the wet state to those in the dry state. The changes in these two optical parameters were studied by defining κ as its median value of 0.25 and with RH ranging from 50% to 100%. The results are shown in Figure 9.
f R H e p = α wet α dry
f R H b a c = β wet β dry
As is shown in Figure 9, both the extinction and backscattering of aerosols increased with elevated RH, while the fEC values were 10%, 20%, and 30%, respectively, which is consistent with the results of other studies [31,33]. Figure 9 shows that the LR value depends on the growth rate of extinction and backscattering. For EXT, the growth rate of the extinction was faster than that of the backscattering when the fEC value was 10–20%, leading to a larger LR. When the fEC value was 30%, the growth rate of the extinction was slower than that of the backscattering at an RH below 80%; thus, the growth rate of the LR was slow. When the RH exceeded 80%, the growth rate of the extinction exceeded that of the backscattering and the LR increased. The LR depended primarily on the variation in the particle size distribution caused by the growth of non-EC particles under EXT.
For the CS and INT, the LR also increased with κ and RH when the fEC value was 10%, which was consistent with the growth rate of the extinction and backscattering shown in Figure 9b,c. When the fEC was 20–30%, the LR first decreased with RH and then increased under CS, whose change rule was the opposite to that under INT. For CS, the extinction growth rate was slightly lower than that of backscattering at low RH values, which leads the LR to decrease under low RH values. The growth rate of extinction finally matches the growth rate of backscattering when the RH value was higher than 90%, therefore the LR increases when RH is high. However, for INT, the growth rate of extinction was always higher than that of backscattering at low RH. The variation in extinction and backscattering increased with increasing RH up to 70% and then decreased; thus, the LR increased and then decreased with the RH. For CS and INT, the LR was affected by the change in the particle diameter caused by the hygroscopic growth of non-EC components. All particles contained EC and altered the aerosol absorption during the hygroscopic process for CS and INT, which differed from EXT. On the one hand, the increase in particle thickness or non-EC components enhances the ‘lensing effect’ and increases light absorption. Conversely, the increase in water accompanied by a change in the complex refraction index will partly lead to a decrease in the light absorption capacity owing to the growth of hygroscopic particles. Previous studies also showed the optical properties of aerosols and their dependence on humidity. Zieger et al. [57] and Liu et al. [33] have studied the relationship between optical properties and RH via experimental and Mie models. Their results showed that the extinction coefficient, scattering coefficient, and backscattering coefficient increase with the increase in RH. Ackermann [34] highlighted that the dependence of lidar ratio of different kinds of aerosols on RH is different. When RH increases, the LR of marine aerosol increases first and then decreases at all wavelengths, while that of continental aerosol in 532 nm wavelength increases monotonically with RH. Zhao et al. [19] proved that there is a positive correlation between LR and RH, and he also introduced a scheme of LR enhancement factor parameterization. However, their studies did not consider the characteristics of LR in different mixing states and different EC fractions. This study analyzes the impact of various factors on the LR of aerosols. Overall, the LR was comprehensively influenced by the particle effective radius, EC volume fraction, ‘lensing effect’, and aerosol complex refraction index for CS and INT. It is necessary to consider the impact of the mixing state, EC volume fraction, and aerosol hygroscopicity on the LR, as well as the application of LR in the retrieval of lidar.

4. Conclusions

A simulation of optical parameters was conducted in this study to investigate the impact factors of the lidar ratio (LR) using a three-component optical aerosol assumption based on the Mie model. The impact factors of the LR were analyzed, including the aerosol particle number size distribution (PNSD), volume fraction of EC, mixing state, and hygroscopicity of aerosols.
The LR of aerosol particles is positively correlated with the overall particle size within a certain scale range of particle size, which is consistent with the conclusion of single particle optical properties obtained by the Mie model. In a certain scale range of particle size, the proportion of backscatter in the entire extinction decreases with an increase in particle size, which leads to an increase in the LR.
The LR of aerosols was positively correlated with the volume fraction of the EC. The increase in fEC significantly increased the proportion of light absorption, which led to a decrease in the overall scattering and an increase in the LR. The LR for CS and INT was affected by the ‘lensing effect’, which increased the proportion of particle light-absorption and reduced the particle scattering, leading to an eventual increase in the LR.
The influence of hygroscopicity on the LR is dominated by the relative growth rate of the enhancement factor of aerosol extinction and backscattering. The LR in EXT is positively correlated with hygroscopic parameters, which is attributed to an increase in particle size caused by the hygroscopic growth. While for the core-shell mixing state and homogeneously mixing state, the LR is not only affected by the particle diameter change in the particle hygroscopic growth process but also influenced by the ‘lensing effect’, which needs further study in the future.
The findings in this study could theoretically be used to establish a scheme of parameterization for LR. The LR at the target location can be determined quantitatively by real-time measured PNSD, humidity, single hygroscopicity parameters, EC fraction, and mixing state. We believe that the completeness of these parameters will contribute to a more accurate correction of the LR. If the data of some parameters cannot be obtained in real-time observation, we suggest to select the appropriate values of the parameters from long-term measurement.

Supplementary Materials

The following supporting information can be downloaded at: https://www.mdpi.com/article/10.3390/rs14071554/s1, Figure S1: PNSD of each region; Figure S2: Statistical chart of the frequency of hygroscopic parameters κ in China; Figure S3: Calculated optical efficiencies of the median PNSD [58].

Author Contributions

Conceptualization, Z.Z. and B.W.; methodology, Z.Z. and L.L.; validation, Z.Z., L.L. and B.W.; formal analysis, Z.Z. and L.L.; investigation, Y.W. and C.L.; resources, B.W.; data curation, Y.W.; writing—original draft preparation, Z.Z. and L.L.; writing—review and editing, B.W., H.T., C.L. and P.C.; project administration, B.W.; funding acquisition, B.W., H.T. and L.L. All authors have read and agreed to the published version of the manuscript.

Funding

This research was funded by the National Natural Science Foundation of China (grant numbers 41775015, 41630422, and 42105092); Guangdong Major Project of Basic and Applied Basic Research (grant number 2020B0301030004); Guangdong Province Key Laboratory for Climate Change and Natural Disaster Studies (grant number 2020B1212060025); Guangdong Basic and Applied Basic Research Foundation (grant number 2019A1515110791); Science and Technology Innovation Team Plan of Guangdong Meteorological Bureau (grant number GRMCTD202003); and Science and Technology Research Project of Guangdong Meteorological Bureau (grant number GRMC2018M07).

Institutional Review Board Statement

Not applicable.

Informed Consent Statement

Not applicable.

Data Availability Statement

Not applicable.

Conflicts of Interest

The authors declare no conflict of interest.

References

  1. Ramanathan, V.; Crutzen, P.J.; Kiehl, J.T.; Rosenfeld, D. Aerosols, climate, and the hydrological cycle. Science 2001, 294, 2119–2124. [Google Scholar] [CrossRef] [PubMed] [Green Version]
  2. Twomey, S. Pollution and the planetary albedo. Atmos. Environ. 1974, 8, 1251–1256. [Google Scholar] [CrossRef]
  3. Albrecht, B.A. Aerosols, cloud microphysics, and fractional cloudiness. Science 1989, 245, 1227–1230. [Google Scholar] [CrossRef] [PubMed]
  4. Fernald, F.G.; Herman, B.M.; Reagan, J.A. Determination of aerosol height distributions by lidar. J. Appl. Meteorol. 1972, 11, 482–489. [Google Scholar] [CrossRef] [Green Version]
  5. Fernald, F.G. Analysis of atmospheric lidar observations: Some comments. Appl. Opt. 1984, 23, 652. [Google Scholar] [CrossRef] [PubMed]
  6. Liu, Z.; Sugimoto, N.; Murayama, T. Extinction-to-backscatter ratio of Asian dust observed with high-spectral-resolution lidar and Raman lidar. Appl. Opt. 2002, 41, 2760–2767. [Google Scholar] [CrossRef] [Green Version]
  7. Su, J.; Liu, Z.; Wu, Y.; McCormick, M.P.; Lei, L. Retrieval of multi-wavelength aerosol lidar ratio profiles using Raman scattering and Mie backscattering signals. Atmos. Environ. 2013, 79, 36–40. [Google Scholar] [CrossRef]
  8. Pappalardo, G.; Amodeo, A.; Pandolfi, M.; Wandinger, U.; Ansmann, A.; Bösenberg, J.; Matthias, V.; Amiridis, V.; De Tomasi, F.; Frioud, M.; et al. Aerosol lidar intercomparison in the framework of the EARLINET project. 3. Raman lidar algorithm for aerosol extinction, backscatter, and lidar ratio. Appl. Opt. 2004, 43, 5370–5385. [Google Scholar] [CrossRef]
  9. Sroga, J.T.; Eloranta, E.W.; Shipley, S.T.; Roesler, F.L.; Tryon, P.J. High spectral resolution lidar to measure optical scattering properties of atmospheric aerosols. 2: Calibration and data analysis. Appl. Opt. 1983, 22, 3725–3732. [Google Scholar] [CrossRef]
  10. Hair, J.W.; Hostetler, C.A.; Cook, A.L.; Harper, D.B.; Ferrare, R.A.; Mack, T.L.; Welch, W.; Izquierdo, L.R.; Hovis, F.E. Airborne high spectral resolution lidar for profiling aerosol optical properties. Appl. Opt. 2008, 47, 6734–6752. [Google Scholar] [CrossRef]
  11. Lopes, F.; Landulfo, E.; Vaughan, M. Assessment of the CALIPSO Lidar 532-nm version 3 lidar ratio models using a ground-based lidar and AERONET sun photometers in Brazil. Atmos. Meas. Tech. Discuss. 2013, 6, 1143–1199. [Google Scholar]
  12. Chaikovsky, A.; Dubovik, O.; Holben, B.; Bril, A.; Goloub, P.; Tanré, D.; Pappalardo, G.; Wandinger, U.; Chaikovskaya, L.; Denisov, S.; et al. Lidar-Radiometer Inversion Code (LIRIC) for the retrieval of vertical aerosol properties from combined lidar/radiometer data: Development and distribution in EARLINET. Atmos. Meas. Tech. 2016, 9, 1181–1205. [Google Scholar] [CrossRef] [Green Version]
  13. He, Q.S.; Li, C.C.; Mao, J.T.; Lau, A.K.H.; Li, P.R. A study on the aerosol extinction-to-backscatter ratio with combination of micro-pulse LIDAR and MODIS over Hong Kong. Atmos. Chem. Phys. 2006, 6, 3243–3256. [Google Scholar] [CrossRef] [Green Version]
  14. Zhao, H.; Mao, J.; Zhou, C.; Gong, X. A method of determining multi-wavelength lidar ratios combining aerodynamic particle sizer spectrometer and sun-photometer. J. Quant. Spectrosc. Radiat. Transf. 2018, 217, 224–228. [Google Scholar] [CrossRef]
  15. Schuster, G.L.; Vaughan, M.; MacDonnell, D.; Su, W.; Winker, D.; Dubovik, O.; Lapyonok, T.; Trepte, C. Comparison of CALIPSO aerosol optical depth retrievals to AERONET measurements, and a climatology for the lidar ratio of dust. Atmos. Chem. Phys. 2012, 12, 7431–7452. [Google Scholar] [CrossRef] [Green Version]
  16. Shin, S.-K.; Tesche, M.; Müller, D.; Noh, Y. Technical note: Absorption aerosol optical depth components from AERONET observations of mixed dust plumes. Atmos. Meas. Tech. 2019, 12, 607–618. [Google Scholar] [CrossRef] [Green Version]
  17. Kim, M.H.; Omar, A.H.; Tackett, J.L.; Vaughan, M.A.; Winker, D.M.; Trepte, C.R.; Hu, Y.; Liu, Z.; Poole, L.R.; Pitts, M.C.; et al. The CALIPSO Version 4 Automated Aerosol Classification and Lidar Ratio Selection Algorithm. Atmos. Meas. Tech. 2018, 11, 6107–6135. [Google Scholar] [CrossRef] [Green Version]
  18. Shimizu, A.; Sugimoto, N.; Matsui, I.; Mori, I.; Nishikawa, M.; Kido, M. Relationship between lidar-derived dust extinction coefficients and mass concentrations in Japan. SOLA 2011, 7A, 1–4. [Google Scholar] [CrossRef] [Green Version]
  19. Zhao, G.; Zhao, C.; Kuang, Y.; Tao, J.; Tan, W.; Bian, Y.; Li, J.; Li, C. Impact of aerosol hygroscopic growth on retrieving aerosol extinction coefficient profiles from elastic-backscatter lidar signals. Atmos. Chem. Phys. 2017, 17, 12133–12143. [Google Scholar] [CrossRef] [Green Version]
  20. Zhao, H.; Hua, D.; Mao, J.; Zhou, C. Investigate the relationship between multiwavelength lidar ratios and aerosol size distributions using aerodynamic particle sizer spectrometer. J. Quant. Spectrosc. Radiat. Transf. 2017, 188, 12–19. [Google Scholar] [CrossRef]
  21. Song, Y.; Zhang, B.; Shi, G.; Li, S.; Di, H.; Yan, Q.; Hua, D. Correlation between the lidar ratio and the Ångström exponent of various aerosol types. Particuology 2018, 40, 62–69. [Google Scholar] [CrossRef]
  22. Jacobson, M.Z. Strong radiative heating due to the mixing state of black carbon in atmospheric aerosols. Nature 2001, 409, 695–697. [Google Scholar] [CrossRef] [PubMed]
  23. Bond, T.C.; Bergstrom, R.W. Light absorption by carbonaceous particles: An investigative review. Aerosol Sci. Technol. 2006, 40, 27–67. [Google Scholar] [CrossRef]
  24. Myhre, G.; Samset, B.H.; Schulz, M.; Balkanski, Y.; Bauer, S.; Berntsen, T.K.; Bian, H.; Bellouin, N.; Chin, M.; Diehl, T.; et al. Radiative forcing of the direct aerosol effect from AeroCom Phase II simulations. Atmos. Chem. Phys. 2013, 13, 1853–1877. [Google Scholar] [CrossRef] [Green Version]
  25. Heintzenberg, J. Particle size distribution from scattering measurements of nonspherical particles via Mie-theory. Contrib. Atmos. Phys./Beitraege Phys. Atmos. 1978, 51, 91–99. [Google Scholar]
  26. Cappa, C.D.; Onasch, T.B.; Massoli, P.; Worsnop, D.R.; Bates, T.S.; Cross, E.S.; Davidovits, P.; Hakala, J.; Hayden, K.L.; Jobson, B.T.; et al. Radiative absorption enhancements due to the mixing state of atmospheric black carbon. Science 2012, 337, 1078–1081. [Google Scholar] [CrossRef] [Green Version]
  27. Bond, T.C.; Doherty, S.J.; Fahey, D.W.; Forster, P.M.; Berntsen, T.; DeAngelo, B.J.; Flanner, M.G.; Ghan, S.; Kärcher, B.; Koch, D.; et al. Bounding the role of black carbon in the climate system: A scientific assessment. J. Geophys. Res. Atmos. 2013, 118, 5380–5552. [Google Scholar] [CrossRef]
  28. Ma, N.; Zhao, C.S.; Müller, T.; Cheng, Y.F.; Liu, P.F.; Deng, Z.Z.; Xu, W.Y.; Ran, L.; Nekat, B.; van Pinxteren, D.; et al. A new method to determine the mixing state of light absorbing carbonaceous using the measured aerosol optical properties and number size distributions. Atmos. Chem. Phys. 2012, 12, 2381–2397. [Google Scholar] [CrossRef] [Green Version]
  29. Tan, H.; Liu, L.; Fan, S.; Li, F.; Yin, Y.; Cai, M.; Chan, P.W. Aerosol optical properties and mixing state of black carbon in the Pearl River Delta, China. Atmos. Environ. 2016, 131, 196–208. [Google Scholar] [CrossRef]
  30. Liu, D.; Allan, J.D.; Young, D.E.; Coe, H.; Beddows, D.; Fleming, Z.L.; Flynn, M.J.; Gallagher, M.W.; Harrison, R.M.; Lee, J.; et al. Size distribution, mixing state and source apportionment of black carbon aerosol in London during wintertime. Atmos. Chem. Phys. 2014, 14, 10061–10084. [Google Scholar] [CrossRef] [Green Version]
  31. Adam, M.; Putaud, J.P.; Martins Dos Santos, S.; Dell’Acqua, A.; Gruening, C. Aerosol hygroscopicity at a regional background site (Ispra) in Northern Italy. Atmos. Chem. Phys. 2012, 12, 5703–5717. [Google Scholar] [CrossRef]
  32. Deng, H.; Tan, H.; Li, F.; Cai, M.; Chan, P.W.; Xu, H.; Huang, X.; Wu, D. Impact of relative humidity on visibility degradation during a haze event: A case study. Sci. Total Environ. 2016, 1149–1158. [Google Scholar] [CrossRef] [PubMed]
  33. Liu, L.; Tan, H.; Fan, S.; Cai, M.; Xu, H.; Li, F.; Chan, P. Influence of aerosol hygroscopicity and mixing state on aerosol optical properties in the Pearl River Delta region, China. Sci. Total Environ. 2018, 627, 1560–1571. [Google Scholar] [CrossRef] [PubMed]
  34. Ackermann, J. The extinction-to-backscatter ratio of tropospheric aerosol: A numerical study. J. Atmos. Ocean. Technol. 1998, 15, 1043–1050. [Google Scholar] [CrossRef]
  35. Ferrare, R.A.; Melfi, S.H.; Whiteman, D.N.; Evans, K.D.; Poellot, M.; Kaufman, Y.J. Raman lidar measurements of aerosol extinction and backscattering: 2. Derivation of aerosol real refractive index, single-scattering albedo, and humidification factor using Raman lidar and aircraft size distribution measurements. J. Geophys. Res. Atmos. 1998, 103, 19673–19689. [Google Scholar] [CrossRef]
  36. Kuang, Y.; Zhao, C.S.; Tao, J.C.; Bian, Y.X.; Ma, N. Impact of aerosol hygroscopic growth on the direct aerosol radiative effect in summer on North China Plain. Atmos. Environ. 2016, 147, 224–233. [Google Scholar] [CrossRef]
  37. Müller, D.; Ansmann, A.; Mattis, I.; Tesche, M.; Wandinger, U.; Althausen, D.; Pisani, G. Aerosol-type-dependent lidar ratios observed with Raman lidar. J. Geophys. Res. 2007, 112, D16202. [Google Scholar] [CrossRef]
  38. Kim, M.-H.; Kim, S.-W.; Omar, A.H. Dust Lidar Ratios Retrieved from the CALIOP Measurements Using the MODIS AOD as a Constraint. Remote Sens. 2020, 12, 251. [Google Scholar] [CrossRef] [Green Version]
  39. Cheng, Y.F.; Wiedensohler, A.; Eichler, H.; Su, H.; Gnauk, T.; Brüggemann, E.; Herrmann, H.; Heintzenberg, J.; Slanina, J.; Tuch, T. Aerosol optical properties and related chemical apportionment at Xinken in Pearl River Delta of China. Atmos. Environ. 2008, 42, 6351–6372. [Google Scholar] [CrossRef]
  40. Ackerman, T.P.; Toon, O.B. Absorption of visible radiation in atmosphere containing mixtures of absorbing and nonabsorbing particles. Appl. Opt. 1981, 20, 3661–3667. [Google Scholar] [CrossRef]
  41. Hasan, H.; Dzubay, T.G. Apportioning light extinction coefficients to chemical species in atmospheric aerosol. Atmos. Environ. 1983, 17, 1573–1581. [Google Scholar] [CrossRef]
  42. Ouimette, J.R.; Flagan, R.C. The extinction coefficient of multicomponent aerosols. Atmos. Environ. 1982, 16, 2405–2419. [Google Scholar] [CrossRef]
  43. Steinfeld, J.I. Atmospheric chemistry and physics: From air pollution to climate change. Environ. Sci. Policy Sustain. Dev. 1998, 40, 26. [Google Scholar] [CrossRef]
  44. Sloane, C.S. Optical properties of aerosols of mixed composition. Atmos. Environ. 1984, 18, 871–878. [Google Scholar] [CrossRef]
  45. Tang, I.N.; Munkelwitz, H.R. Water activities, densities, and refractive indices of aqueous sulfates and sodium nitrate droplets of atmospheric importance. J. Geophys. Res. 1994, 99, 18801–18808. [Google Scholar] [CrossRef]
  46. Lesins, G.; Chylek, P.; Lohmann, U. A study of internal and external mixing scenarios and its effect on aerosol optical properties and direct radiative forcing. J. Geophys. Res. Atmos. AAC 2002, 107, AAC 5-1–AAC 5-12. [Google Scholar] [CrossRef]
  47. Köhler, H. The nucleus in and the growth of hygroscopic droplets. Trans. Faraday Soc. 1936, 32, 1152–1161. [Google Scholar] [CrossRef]
  48. Peng, C.; Wang, Y.; Wu, Z.; Chen, L.; Huang, R.-J.; Wang, W.; Wang, Z.; Hu, W.; Zhang, G.; Ge, M.; et al. Tropospheric aerosol hygroscopicity in China. Atmos. Chem. Phys. 2020, 20, 13877–13903. [Google Scholar] [CrossRef]
  49. Brock, C.A.; Wagner, N.L.; Anderson, B.E.; Attwood, A.R.; Beyersdorf, A.; Campuzano-Jost, P.; Carlton, A.G.; Day, D.A.; Diskin, G.S.; Gordon, T.D.; et al. Aerosol optical properties in the southeastern United States in summer—Part_1: Hygroscopic growth. Atmos. Chem. Phys. 2016, 16, 4987–5007. [Google Scholar] [CrossRef] [Green Version]
  50. Wu, T.; Boor, B.E. Urban aerosol size distributions: A global perspective. Atmos. Chem. Phys. 2021, 21, 8883–8914. [Google Scholar] [CrossRef]
  51. Shin, S.-K.; Tesche, M.; Kim, K.; Kezoudi, M.; Tatarov, B.; Müller, D.; Noh, Y. On the spectral depolarisation and lidar ratio of mineral dust provided in the AERONET version 3 inversion product. Atmos. Chem. Phys. 2018, 18, 12735–12746. [Google Scholar] [CrossRef] [Green Version]
  52. Yang, F.; Tan, J.; Zhao, Q.; Du, Z.; He, K.; Ma, Y.; Duan, F.; Chen, G.; Zhao, Q. Characteristics of PM2.5 speciation in representative megacities and across China. Atmos. Chem. Phys. 2011, 11, 5207–5219. [Google Scholar] [CrossRef] [Green Version]
  53. Chan, C.K.; Yao, X. Air pollution in mega cities in China. Atmos. Environ. 2008, 42, 1–42. [Google Scholar] [CrossRef]
  54. Zhang, Q.; Jimenez, J.L.; Canagaratna, M.R.; Allan, J.D.; Coe, H.; Ulbrich, I.; Alfarra, M.R.; Takami, A.; Middlebrook, A.M.; Sun, Y.L.; et al. Ubiquity and dominance of oxygenated species in organic aerosols in anthropogenically-influenced Northern Hemisphere midlatitudes. Geophys. Res. Lett. 2007, 34, L13801. [Google Scholar] [CrossRef] [Green Version]
  55. Cao, G.; Zhang, X.; Zheng, F. Inventory of black carbon and organic carbon emissions from China. Atmos. Environ. 2006, 40, 6516–6527. [Google Scholar] [CrossRef]
  56. Hansen, J.E.; Travis, L.D. Light scattering in planetary atmospheres. Space Sci. Rev. 1974, 16, 527–610. [Google Scholar] [CrossRef]
  57. Zieger, P.; Fierz-Schmidhauser, R.; Weingartner, E.; Baltensperger, U. Effects of relative humidity on aerosol light scattering: Results from different European sites. Atmos. Chem. Phys. 2013, 13, 10609–10631. [Google Scholar] [CrossRef] [Green Version]
  58. Hussein, T.; Dal Maso, M.; Petaja, T.; Koponen, I.K.; Paatero, P.; Aalto, P.P.; Hameri, K.; Kulmala, M. Evaluation of an automatic algorithm for fitting the particle number size distributions. Boreal Environ. Res. 2005, 10, 337. [Google Scholar]
Figure 1. Representative PNSDs in different regions. The representative samples of the four regions in the figure are the median value of the PNSD.
Remotesensing 14 01554 g001
Figure 2. Values of the LR of all samples in different regions under the condition of fEC = 0.1. EXT, CS, and INT represent the external, core-shell, and internal mixing states, respectively.
Remotesensing 14 01554 g002
Figure 3. Proportion of the three modes of aerosol number concentration in the four regions. The proportion of (a) nucleation mode aerosols, (b) Aitken mode aerosols, and (c) accumulated modal aerosols.
Remotesensing 14 01554 g003
Figure 4. Regression analysis results of r e f f and LR for the (a) external mixing state, (b) core-shell mixing state, and (c) homogeneously internal mixing state.
Remotesensing 14 01554 g004
Figure 5. (a) Extinction coefficients, (b) absorption coefficients, (c) scattering coefficients, and (d) backscattering coefficients of aerosols under three mixing states.
Remotesensing 14 01554 g005
Figure 6. The ratio of the LR of (a) the core-shell mixing state to that of the external mixing state, (b) the homogeneously internal mixing state to that of the external mixing state.
Remotesensing 14 01554 g006
Figure 7. The LR changes with fEC under PNSDs of different regions in (a) external mixing state, (b) core-shell mixing state, and (c) homogeneously internal mixing state.
Remotesensing 14 01554 g007
Figure 8. The LR under different κ and fEC values. The X axis represents κ, Y axis represents RH, and color represents the value of the f(RH)LR. (ac) represent the EXT cases where the fractions of EC are 10%, 20% and 30%, respectively. (df) represent the CS cases where the fractions of EC are 10%, 20% and 30%, respectively. (gi) represent the INT cases where the fractions of EC are 10%, 20% and 30%, respectively.
Remotesensing 14 01554 g008
Figure 9. Hygroscopic enhancement factor diagram of optical parameters; the abscissa and ordinate represent the relative humidity and hygroscopic enhancement factor of optical parameters, respectively. (ac) represent the EXT cases where the fractions of EC are 10%, 20% and 30%, respectively. (df) represent the CS cases where the fractions of EC are 10%, 20% and 30%, respectively. (gi) represent the INT cases where the fractions of EC are 10%, 20% and 30%, respectively.
Remotesensing 14 01554 g009
Table 1. Input parameters and the applied Mie model for the three mixing states under dry and wet conditions.
Mixing StateApplied Mie ModelInput Parameter
Dry ConditionWet Condition
EXTBHMie r t , λ , m ˜ EC , m ˜ NLB , dry r t G f , λ , m ˜ EC , m ˜ NLB , wet
CSBHCoat r t , r c , λ , m ˜ c , m ˜ s r t G f , r c , λ , m ˜ c , m ˜ s
INTBHMie r t , λ , m ˜ INT , dry r t G f , λ , m ˜ INT , wet
Publisher’s Note: MDPI stays neutral with regard to jurisdictional claims in published maps and institutional affiliations.

