
Building Height Extraction from GF-7 Satellite Images Based on Roof Contour Constrained Stereo Matching


Abstract
:1. Introduction
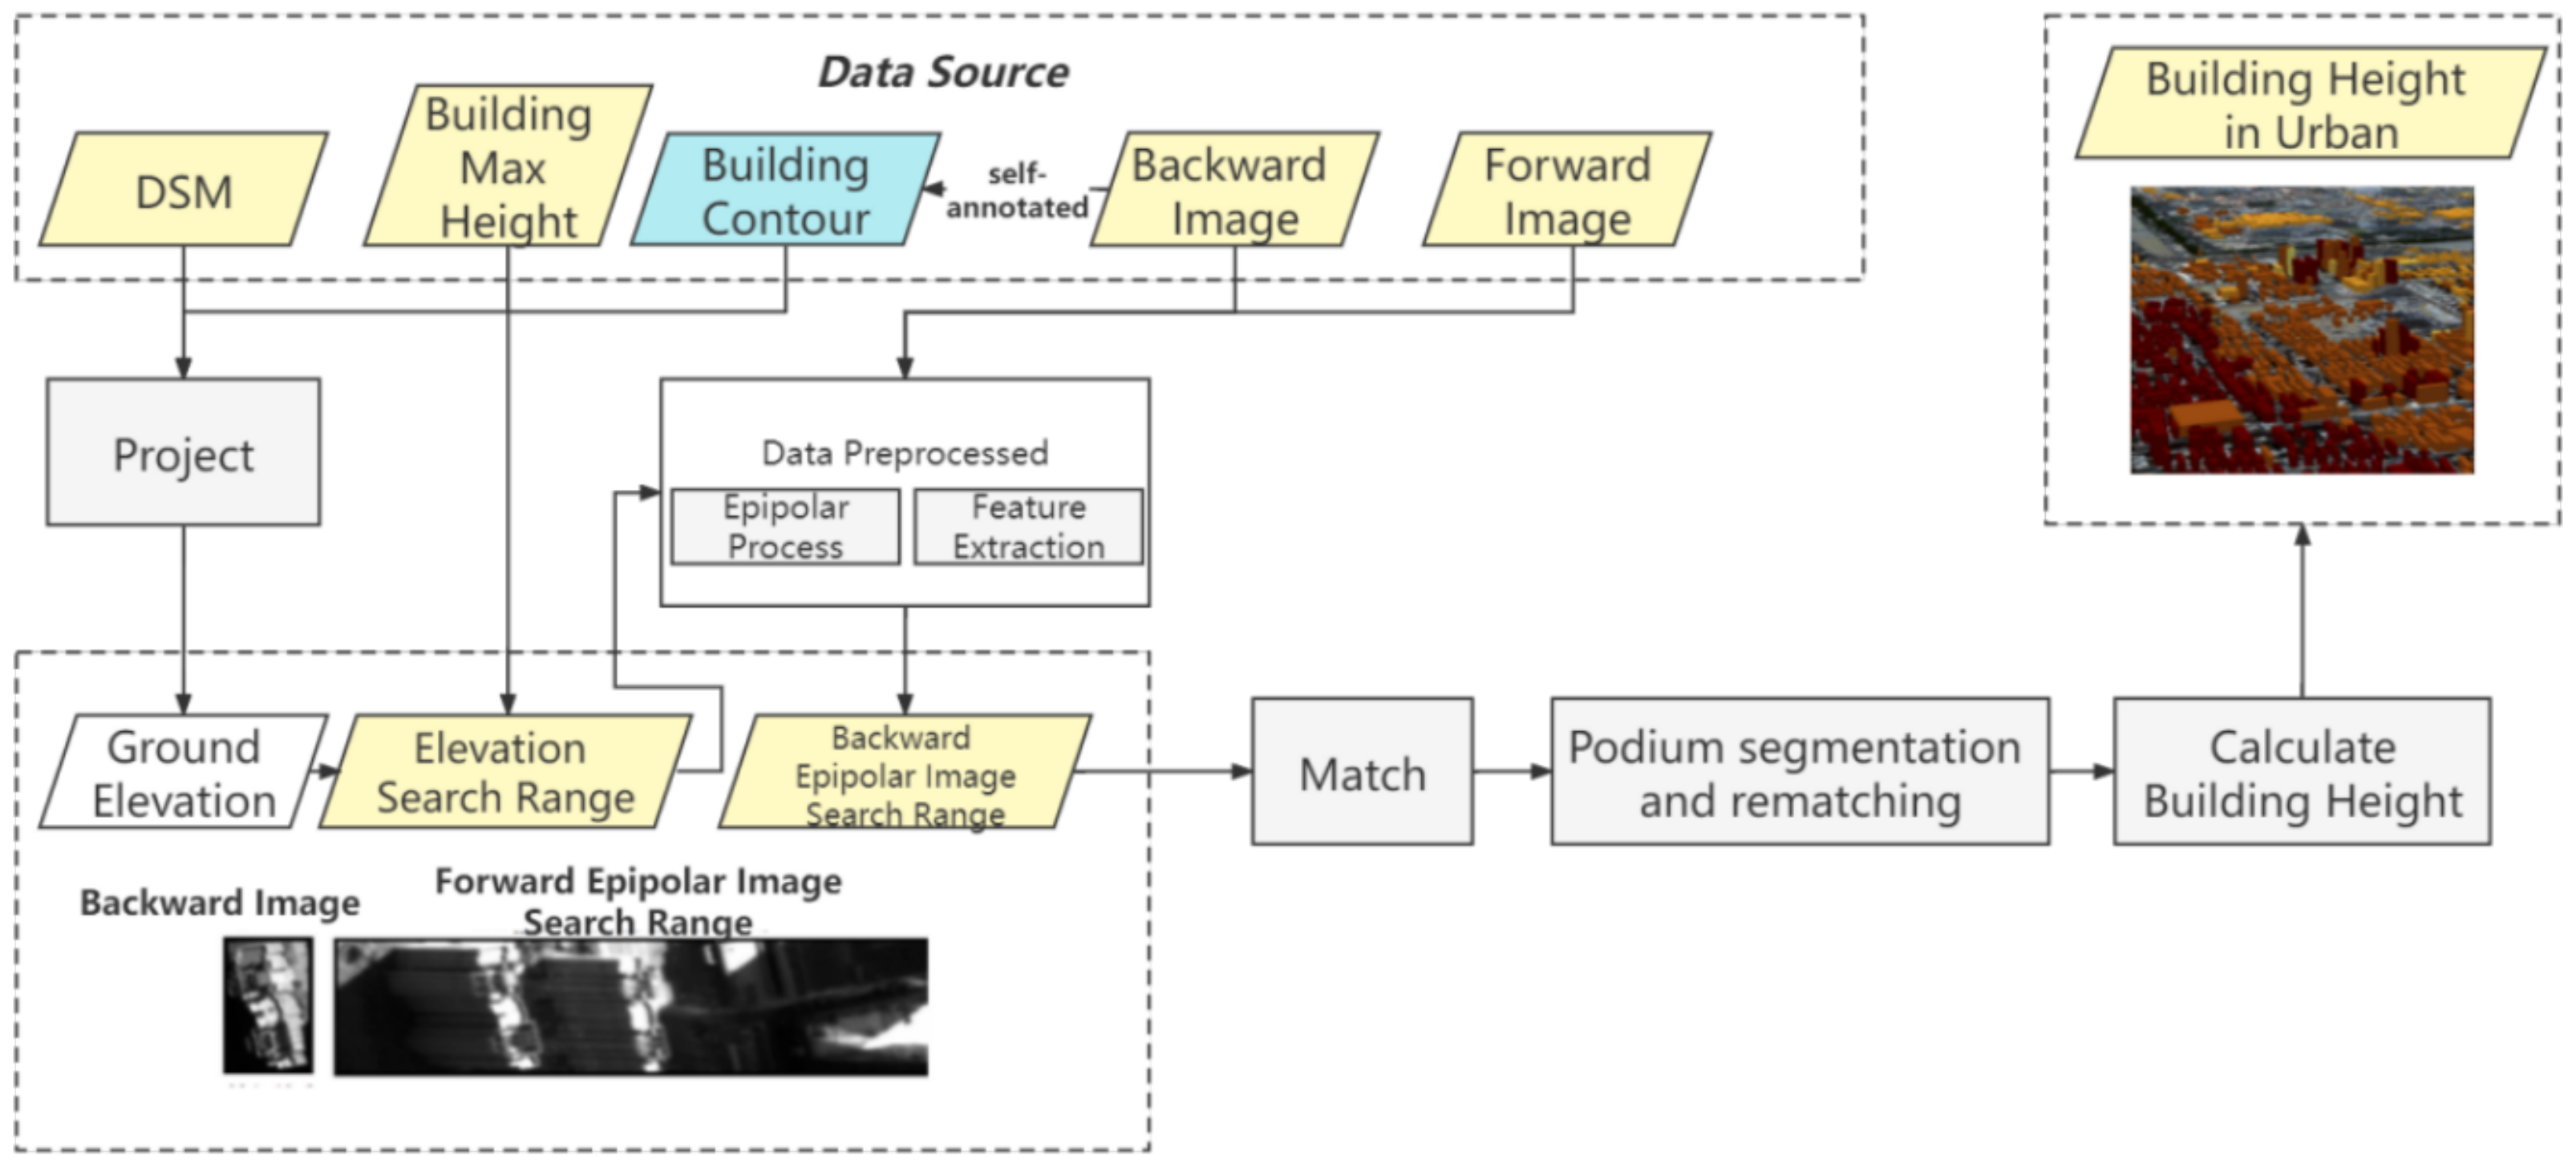
2. Methodology
- (1)
- Epipolar image block and feature map generation from stereo images. The first step is to prepare the epipolar image block for roof contour matching, in which the parallax search range is determined by using the DSM data and a supposed maximum range of building heights. After image resampling, the epipolar image blocks are transformed into feature map blocks by computing regional standard deviation to extract the structural characteristics.
- (2)
- Roof contour constrained stereo matching considering podium structure. The backward image block is first matched against the forward image block with the similarity measure of image feature difference. To deal with the multi-heights problem arising from podium buildings, the gray difference image is used to detect the mismatched contours, which can include podium. The image is then rematched iteratively until no podium structure can be detected. With the matched parallax, the roof elevation is calculated through the space intersection using the RPCs of satellite stereo images and the 2D roof contours on the backward image is transformed into 3D roof contours in the geographic coordinate system.
- (3)
- Bottom elevation estimation and building height calculation. Bottom elevation is estimated using histogram analysis of the DSM in the buffer of a building contour with a buffer size of 20 m. Building height is then calculated by the subtraction between bottom elevation and roof elevation.
2.1. Epipolar Image Block and Feature Map Generation for Stereo Images
2.1.1. Calculation of Parallex Search Range
- (1)
- With the initial evaluation , we can get point in the 3D object space by intersecting imaging ray through the roof center with the horizontal plane created by the elevation of .
- (2)
- After obtaining point , we use the horizontal coordinates X and Y of point to interpolate a new elevation value of from the DSM data.
- (3)
- If the elevation difference between and is greater than a given threshold, then update with .
- (4)
- Steps 1 to 3 are iteratively executed until reaching the terminal condition.
2.1.2. Epipolar Image Block and Feature Map Generation
2.2. Roof Contour Constrained Stereo Matching Considering Podium Structure
2.2.1. Roof Contour Constrained Stereo Matching
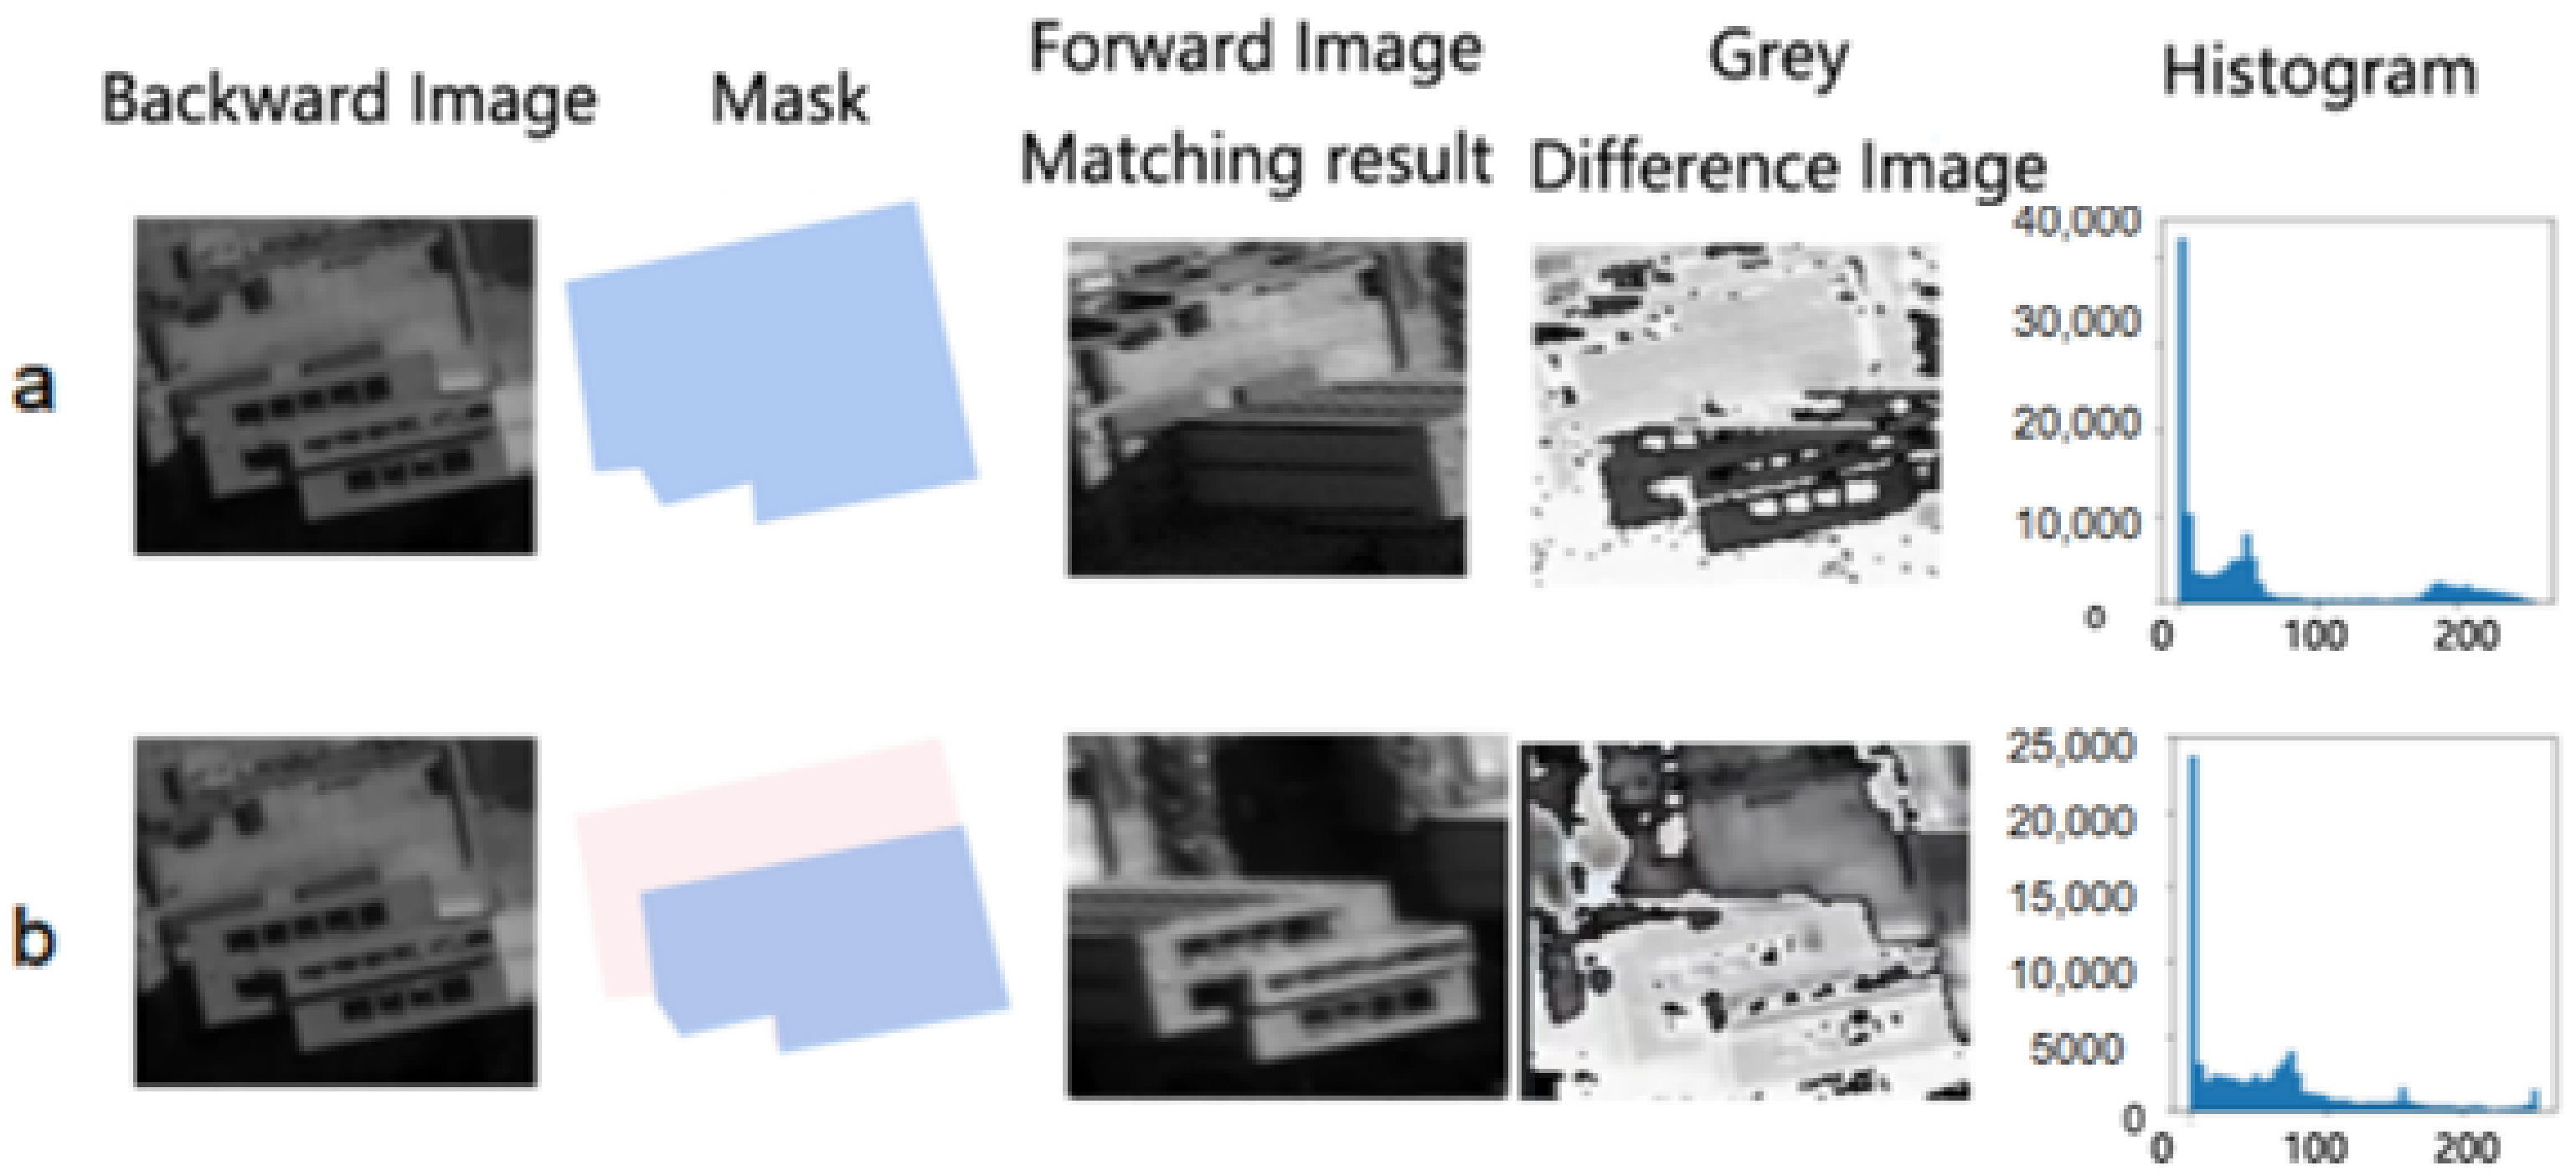
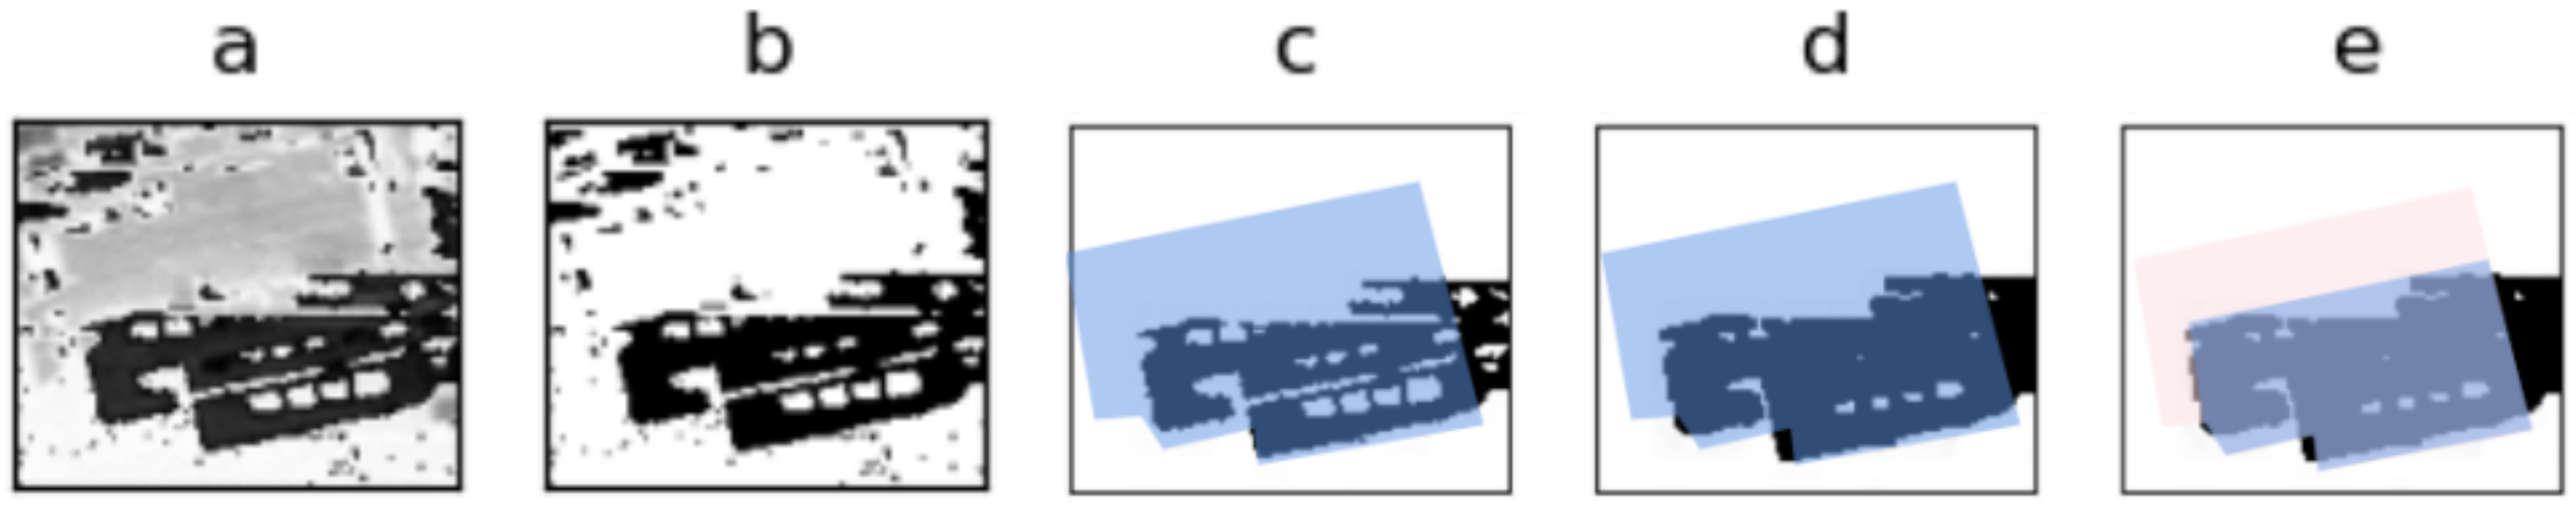
2.2.2. Segmentation and Rematching of Building with Podium
- (1)
- Set the mask as the whole roof using the blue contour polygon.
- (2)
- Search the x-parallax with the minimum masked gray difference in the standard deviation map;
- (3)
- Compute the gray difference map between matched image blocks;
- (4)
- Compute the histogram of the gray difference map in the mask set;
- (5)
- If there are more than one peaks in the histogram, the gray difference image is binarized and refined as a new mask for next matching.
- (6)
- Repeat steps 2 to 5 until 90% pixel is matched.
2.3. Bottom Elevation Estimation and Building Height Calculation
3. Experiment and Results
3.1. Data and Study Area
3.1.1. Study Area
3.1.2. GF-7 Stereo Images
3.1.3. LiDAR Data
3.1.4. Building Roof Contours and Ground Truth
3.1.5. DSM Generation
3.2. Evaluation Metrics
3.3. Experimental Results of Yingde Dataset
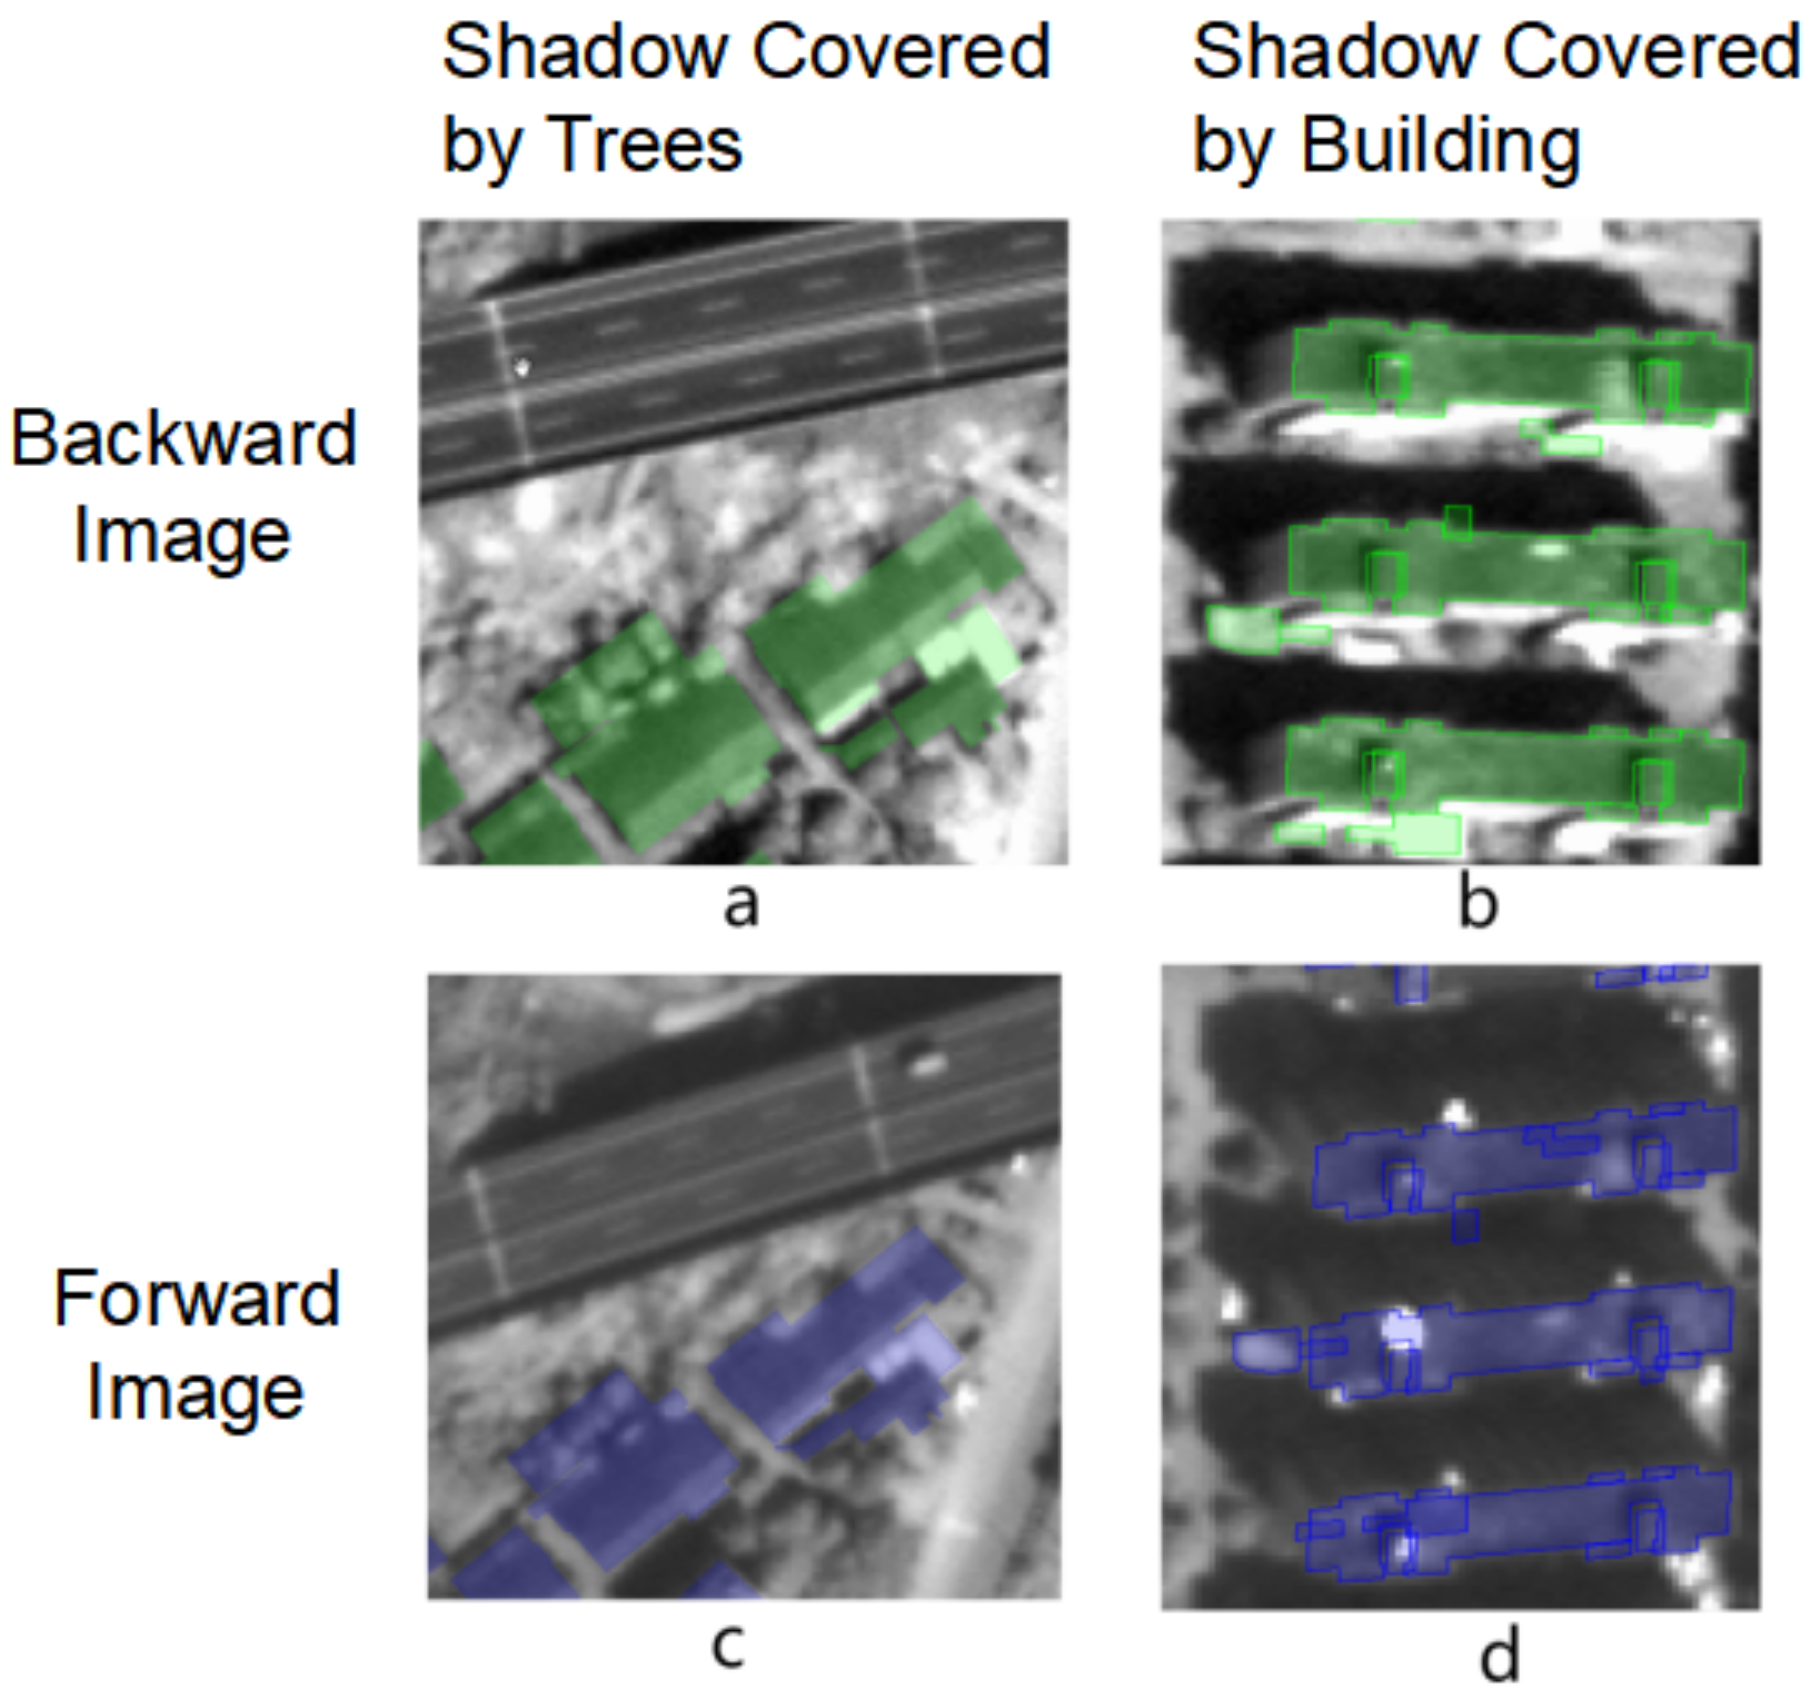
3.3.1. Comparison with the Shadow-Based Method
3.3.2. Comparison with DSM Based Method
3.4. Experimental Results of Xi’an Dataset
Building Height Estimation of Buildings with Podium
4. Conclusions
Author Contributions
Funding
Data Availability Statement
Conflicts of Interest
References
- Chen, A.J.; Xu, G.Y.; Shi, Y.C. Automatic 3D building modeling based on urban aerial stereo pairs. J. Surv. Mapp. 2002, 1, 54–59. [Google Scholar]
- Xia, M.; Jia, K.; Zhao, W.; Liu, S.; Wei, X.; Wang, B. Spatio-temporal changes of ecological vulnerability across the Qinghai-Tibetan Plateau. Ecol. Indic. 2021, 123, 107274. [Google Scholar]
- Qin, R. Change detection on LOD 2 building models with very high resolution spaceborne stereo imagery. ISPRS J. Photogramm. Remote Sens. 2014, 96, 179–192. [Google Scholar]
- Tomás, L.; Fonseca, L.; Almeida, C.; Leonardi, F.; Pereira, M. Urban population estimation based on residential buildings volume using IKONOS-2 images and lidar data. Int. J. Remote Sens. 2016, 37, 1–28. [Google Scholar]
- Xie, Y.; Weng, A.; Weng, Q. Population estimation of urban residential communities using remotely sensed morphologic data. IEEE Geosci. Remote Sens. Lett. 2015, 12, 1111–1115. [Google Scholar]
- Xu, M.; Cao, C.; Jia, P. Mapping fine-scale urban spatial population distribution based on high-resolution stereo pair images, points of interest, and land cover data. Remote Sens. 2020, 12, 608. [Google Scholar]
- Berger, C.; Rosentreter, J.; Voltersen, M.; Baumgart, C.; Schmullius, C.; Hese, S. Spatio-temporal analysis of the relationship between 2D/3D urban site characteristics and land surface temperature. Remote Sens. Environ. 2017, 193, 225–243. [Google Scholar]
- Venter, Z.S.; Brousse, O.; Esau, I.; Meier, F. Hyperlocal mapping of urban air temperature using remote sensing and crowdsourced weather data. Remote Sens. Environ. 2020, 242, 111791. [Google Scholar]
- Hang, J.; Li, Y.; Sandberg, M.; Buccolieri, R.; Di Sabatino, S. The influence of building height variability on pollutant dispersion and pedestrian ventilation in idealized high-rise urban areas. Build. Environ. 2012, 56, 346–360. [Google Scholar]
- Güneralp, B.; Zhou, Y.; Ürge-Vorsatz, D.; Gupta, M.; Yu, S.; Patel, P.L.; Fragkias, M.; Li, X.; Seto, K.C. Global scenarios of urban density and its impacts on building energy use through 2050. Proc. Natl. Acad. Sci. USA 2017, 114, 8945–8950. [Google Scholar]
- Facciolo, G.; De Franchis, C.; Meinhardt-Llopis, E. Automatic 3D reconstruction from multi-date satellite images. In Proceedings of the IEEE Conference on Computer Vision and Pattern Recognition, Honolulu, HI, USA, 21–26 July 2017; pp. 57–66. [Google Scholar]
- Bullinger, S.; Bodensteiner, C.; Arens, M. 3D Surface Reconstruction From Multi-Date Satellite Images. arXiv 2021, arXiv:2102.02502. [Google Scholar]
- Qin, R.; Song, S.; Ling, X.; Elhashash, M. 3D reconstruction through fusion of cross-view images. In Recent Advances in Image Restoration with Applications to Real World Problems; IntechOpen: London, UK, 2020; p. 123. [Google Scholar]
- Gui, S.; Qin, R. Automated LoD-2 model reconstruction from very-high-resolution satellite-derived digital surface model and orthophoto. ISPRS J. Photogramm. Remote Sens. 2021, 181, 1–19. [Google Scholar]
- Zhao, Y.D.; Wang, X.X.; Bai, Y. High resolution remote sensing image building extraction in combination with morphological reconstruction. Bull. Surv. Mapp. 2012, s1, 253–254. [Google Scholar]
- Tian, Y.J. Application prospect of high score satellite in surveying and mapping. Sci. Technol. Innov. 2020, 22, 160–161. [Google Scholar]
- Zhao, Z.M.; Zhou, X.C.; Fu, Q.K.; Wang, X.Q. Building height information extraction method based on ZY-3 image. Land Resour. Remote Sens. 2015, 3, 19–24. [Google Scholar]
- Shi, Y.F.; Wang, X.Q.; Sun, Z.H.; Chen, Y.Z.; Fu, Q.K. Urban building height estimation based on shadow ZY-3 satellite data. J. Earth Inf. Sci. 2015, 2, 236–243. [Google Scholar]
- Tian, F.; Chen, D.H.; Huang, X.L.; Li, H.; Yao, G.H.; Zhao, J.P.; Ding, F.; Xing, F. Building height estimation of GF2 image based on morphological shadow index. Remote Sens. Technol. Appl. 2017, 5, 844–850. [Google Scholar]
- Xie, Y.K. Research on Building Height Information Extraction Method of Multiple Scenes Based on High Resolution Image Shadow. Master’s Thesis, Southwest Jiaotong University, Chengdu, China, 2018. [Google Scholar]
- Chen, C. Height inversion of urban buildings based on Google Earth remote sensing images. Bull. Surv. Mapp. 2020, 1, 98–101. [Google Scholar]
- Wang, X.D.; Duan, F.Z.; Qu, X.Y.; Li, D.; Yu, P.F. UAV data building extraction based on object-oriented and SVM. Land Resour. Remote Sens. 2017, 1, 97–103. [Google Scholar]
- Wu, J.; Yao, Z.X.; Cheng, M.M. Dense matching of oblique aerial images fused with sift and SGM. J. Remote Sens. 2015, 3, 431–442. [Google Scholar]
- Li, Y.; Zhu, L.; Gong, P.; Shimamura, H. A refined marker controlled watershed for building extraction from DSM and imagery. Int. J. Remote Sens. 2010, 31, 1441–1452. [Google Scholar]
- Shaker, I.F.; Abd-Elrahman, A.; Abdel-Gawad, A.K.; Sherief, M.A. Building Extraction from High Resolution Space Images in High Density Residential Areas in the Great Cairo Region. Remote Sens. 2021, 3, 781–791. [Google Scholar]
- Alobeid, A.; Jacobsen, K.; Heipke, C. Building height estimationin urban areas from very high Resolution satellite stereo images. Proc. ISPRS 2009, 5, 2–5. [Google Scholar]
- Li, X.H. Research on urban building height extraction method based on DSM. Nat. Resour. North China 2020, 5, 97–98. [Google Scholar]
- Wang, J.Y.; Hu, X.L.; Meng, Q.Y.; Zhang, L.L.; Wang, C.Y.; Liu, X.C.; Zhao, M.F. Developing a Method to Extract Building 3D Information from GF-7 Data. Remote Sens. 2021, 22, 4532. [Google Scholar]
- Hirschmuller, H. Accurate and efficient stereo processing by semi-global matching and mutual information. In Proceedings of the 2005 IEEE Computer Society Conference on Computer Vision and Pattern Recognition, San Diego, CA, USA, 20–25 June 2005; pp. 807–814. [Google Scholar]
- Liu, C.J.; Krylov, V.A.; Kane, P.; Kavanagh, G.; Dahyot, R. IM2ELEVATION: Building Height Estimation from Single-View Aerial Imagery. Remote Sens. 2020, 12, 2072–4292. [Google Scholar]
- Tao, R.S.; Xiang, Y.M.; You, H.J. An Edge-Sense Bidirectional Pyramid Network for Stereo Matching of VHR Remote Sensing Images. Remote Sens. 2020, 12, 4025. [Google Scholar]
- Pang, J.H.; Sun, W.X.; Ren, J.S.J.; Yang, C.X.; Yan, Q. Cascade Residual Learning: A Two-stage Convolutional Neural Network for Stereo Matching. In Proceedings of the IEEE International Conference on Computer Vision, Venice, Italy, 22–29 October 2017; pp. 878–886. [Google Scholar]
- Liu, J.; Ji, S.P. A Novel Recurrent Encoder-Decoder Structure for Large-Scale Multi-view Stereo Reconstruction from An Open Aerial Dataset. In Proceedings of the 2020 IEEE CVF Conference Oncomputer Vision and Pattern Recognition (CVPR), Seattle, WA, USA, 13–19 June 2020; pp. 6049–6058. [Google Scholar]
- Yao, Y.; Luo, Z.X.; Li, S.W.; Shen, T.W.; Fang, T.; Quan, L. Recurrent mvsnet for high-resolution multiview stereo depth inference. In Proceedings of the IEEE Conference on Computer Vision and Pattern Recognition, Long Beach, CA, USA, 15–20 June 2019; pp. 5525–5534. [Google Scholar]
- Yang, X.B.; Lv, J.G.; Jiang, S.; Zhang, D.L. Improved semiglobal matching generation method for high resolution remote sensing image DSM. J. Surv. Mapp. 2018, 10, 1372–1384. [Google Scholar]
- Tao, L.H.; Ma, J.; Li, N.N.; Li, C.N. Application of PCI GXL and INPHO software in GF7 image production. Geospat. Inf. 2021, 8, 90–96. [Google Scholar]
- Bosch, M.; Foster, K.; Christie, G. Semantic Stereo for Incidental Satellite Images. In Proceedings of the 2019 IEEE Winter Conference on Applications of Computer Vision, Waikoloa Village, HI, USA, 7–11 January 2019; pp. 1524–1532. [Google Scholar]
- Cao, Y.X.; Huang, X. A deep learning method for building height estimation using high-resolution multi-view imagery over urban areas: A case study of 42 Chinese cities. Remote Sens. Environ. 2021, 12, 19–24. [Google Scholar]
- Karatsiolis, S.; Kamilaris, A.; Cole, I. IMG2nDSM: Height Estimation from Single Airborne RGB Images with Deep Learning. Remote Sens. 2021, 13, 2417. [Google Scholar]
- Liu, J.; Ji, S.P. Dense matching of aerial remote sensing images based on deep learning. J. Surv. Mapp. 2019, 9, 1141–1150. [Google Scholar]
- Pan, H.B.; Zhang, G.; Chen, T. A general method of generating satellite epipolar images based on rpc model. In Proceedings of the 2011 IEEE International Geoscience And Remote Sensing Symposium (IGARSS), Vancouver, BC, Canada, 24–29 July 2011; pp. 3015–3018. [Google Scholar]
- Zhang, J.Q. Forward intersection method and accuracy analysis of multi baseline photogrammetry. J. Wuhan Univ. (Inf. Sci. Ed.) 2007, 10, 847–857. [Google Scholar]
- New Leica City Mapper Configuration for Challenging Digital Twin Creation. GIM Int.— Worldw. Mag. Geomat. 2021, 35, 7.
- Rothermel, M.; Wenzel, K.; Fritsh, D.; Haala, N. SURE: Photogrammetric Surface Reconstruction from Imagery. In Proceedings of the LC3D Workshop, Berlin, Germany, 4–5 December 2012. [Google Scholar]
- Fraser, C.; Hanley, H.; Yamakawa, T. Three-Dimensional Geopositioning Accuracy of Ikonos Imagery. Photogramm. Rec. 2002, 17, 465–479. [Google Scholar]


| Parameter | Value |
|---|---|
| Forward camera inclination | 26° |
| Backward camera inclination | 5° |
| Panchromatic resolution | Backward 0.65 m, Forward 0.8 m |
| Multispectral resolution | Backward 2.6 m |
| Width of Windows | ≥20 km |
| Index | Roof Elevation | Bottom Elevation | Building Height |
|---|---|---|---|
| MAE (m) | 1.57 | 1.91 | 2.31 |
| RMSE (m) | 2.01 | 2.57 | 3.01 |
| maxAE (m) | 12.67 | 4.99 | 9.97 |
| Height Range | Building Numbers | MAE | ||
|---|---|---|---|---|
| Roof Elevation | Bottom Elevation | Building Height | ||
| 0–10 m | 5774 | 1.56 | 1.66 | 2.05 |
| 10–20 m | 2466 | 1.59 | 2.32 | 2.76 |
| 20–30 m | 305 | 1.48 | 2.73 | 3.07 |
| 30–40 m | 48 | 1.56 | 3.29 | 3.75 |
| 40–50 m | 21 | 1.29 | 4.39 | 4.85 |
| 50–60 m | 17 | 1.12 | 3.20 | 3.65 |
| 60–70 m | 8 | 2.27 | 1.69 | 2.71 |
| 70–80 m | 8 | 1.24 | 1.47 | 1.98 |
| 80–90 m | 6 | 0.76 | 3.67 | 2.90 |
| 90–100 m | 1 | 1.99 | 4.31 | 6.31 |
| Para. | Building < 30 m | Building > 30 m | ||||
|---|---|---|---|---|---|---|
| Forward | Backward | Ours | Forward | Backward | Ours | |
| MAE (m) | 2.63 | 3.02 | 1.34 | 3.72 | 3.09 | 1.43 |
| RMSE (m) | 3.48 | 14.93 | 1.77 | 4.60 | 6.97 | 1.90 |
| maxAE (m) | 8.11 | 13.50 | 4.75 | 9.59 | 8.59 | 4.63 |
| AE | Building < 30 m | Building > 30 m | ||||
|---|---|---|---|---|---|---|
| Forward | Backward | Ours | Forward | Backward | Ours | |
| <2 (m) | 16 | 53 | 229 | 25 | 38 | 127 |
| 2–4 (m) | 8 | 22 | 65 | 25 | 23 | 30 |
| 4–6 (m) | 3 | 14 | 5 | 7 | 12 | 13 |
| >6 (m) | 4 | 20 | 0 | 20 | 28 | 0 |
| occlusion | 268 | 190 | 0 | 93 | 69 | 0 |
| Para. | Building < 30 m | Building > 30 m | ||||
|---|---|---|---|---|---|---|
| ENVI | INPHO | Ours | ENVI | INPHO | Ours | |
| MAE (m) | 5.12 | 6.53 | 1.34 | 15.6 | 32.65 | 1.43 |
| RMSE (m) | 6.13 | 8.64 | 1.77 | 28.19 | 38.70 | 1.90 |
| maxAE (m) | 26.67 | 35.95 | 4.75 | 82.87 | 89.86 | 4.63 |
| Index | Building Height | ||
|---|---|---|---|
| ENVI | INPHO | Ours | |
| MAE (m) | 41.46 | 55.20 | 1.69 |
| RMSE (m) | 77.86 | 100.64 | 2.34 |
| maxAE (m) | 326.38 | 345.38 | 7.47 |
| Index | Whole | Part1 | Part2 | Part3 | |||
|---|---|---|---|---|---|---|---|
| Ours (m) | Truth (m) | Ours (m) | Truth (m) | Ours (m) | Truth (m) | Ours (m) | |
| 1 | 106.19 | 108 | 106.19 | 16 | 18.86 | ||
| 2 | 74.71 | 106 | 105.18 | - | - | ||
| 3 | 60.49 | 75 | 70.65 | 75 | 70.65 | 10 | 9.72 |
| 4 | 17.85 | 52 | 49.33 | 25 | 18.86 | ||
| 5 | 30.04 | 55 | 50.35 | 16 | 13.79 | ||
| 6 | 4.65 | 87 | 86.90 | 12 | 7.70 | ||
| 7 | 4.65 | 93 | 90.65 | 2 | 4.65 | ||
Publisher’s Note: MDPI stays neutral with regard to jurisdictional claims in published maps and institutional affiliations. |
© 2022 by the authors. Licensee MDPI, Basel, Switzerland. This article is an open access article distributed under the terms and conditions of the Creative Commons Attribution (CC BY) license (https://creativecommons.org/licenses/by/4.0/).
Share and Cite
Zhang, C.; Cui, Y.; Zhu, Z.; Jiang, S.; Jiang, W. Building Height Extraction from GF-7 Satellite Images Based on Roof Contour Constrained Stereo Matching. Remote Sens. 2022, 14, 1566. https://doi.org/10.3390/rs14071566
Zhang C, Cui Y, Zhu Z, Jiang S, Jiang W. Building Height Extraction from GF-7 Satellite Images Based on Roof Contour Constrained Stereo Matching. Remote Sensing. 2022; 14(7):1566. https://doi.org/10.3390/rs14071566
Chicago/Turabian StyleZhang, Chenni, Yunfan Cui, Zeyao Zhu, San Jiang, and Wanshou Jiang. 2022. "Building Height Extraction from GF-7 Satellite Images Based on Roof Contour Constrained Stereo Matching" Remote Sensing 14, no. 7: 1566. https://doi.org/10.3390/rs14071566
APA StyleZhang, C., Cui, Y., Zhu, Z., Jiang, S., & Jiang, W. (2022). Building Height Extraction from GF-7 Satellite Images Based on Roof Contour Constrained Stereo Matching. Remote Sensing, 14(7), 1566. https://doi.org/10.3390/rs14071566