
Registration and Combined Adjustment for the Laser Altimetry Data and High-Resolution Optical Stereo Images of the GF-7 Satellite

 , ,
, ,
Abstract
:1. Introduction
2. Materials and Methods
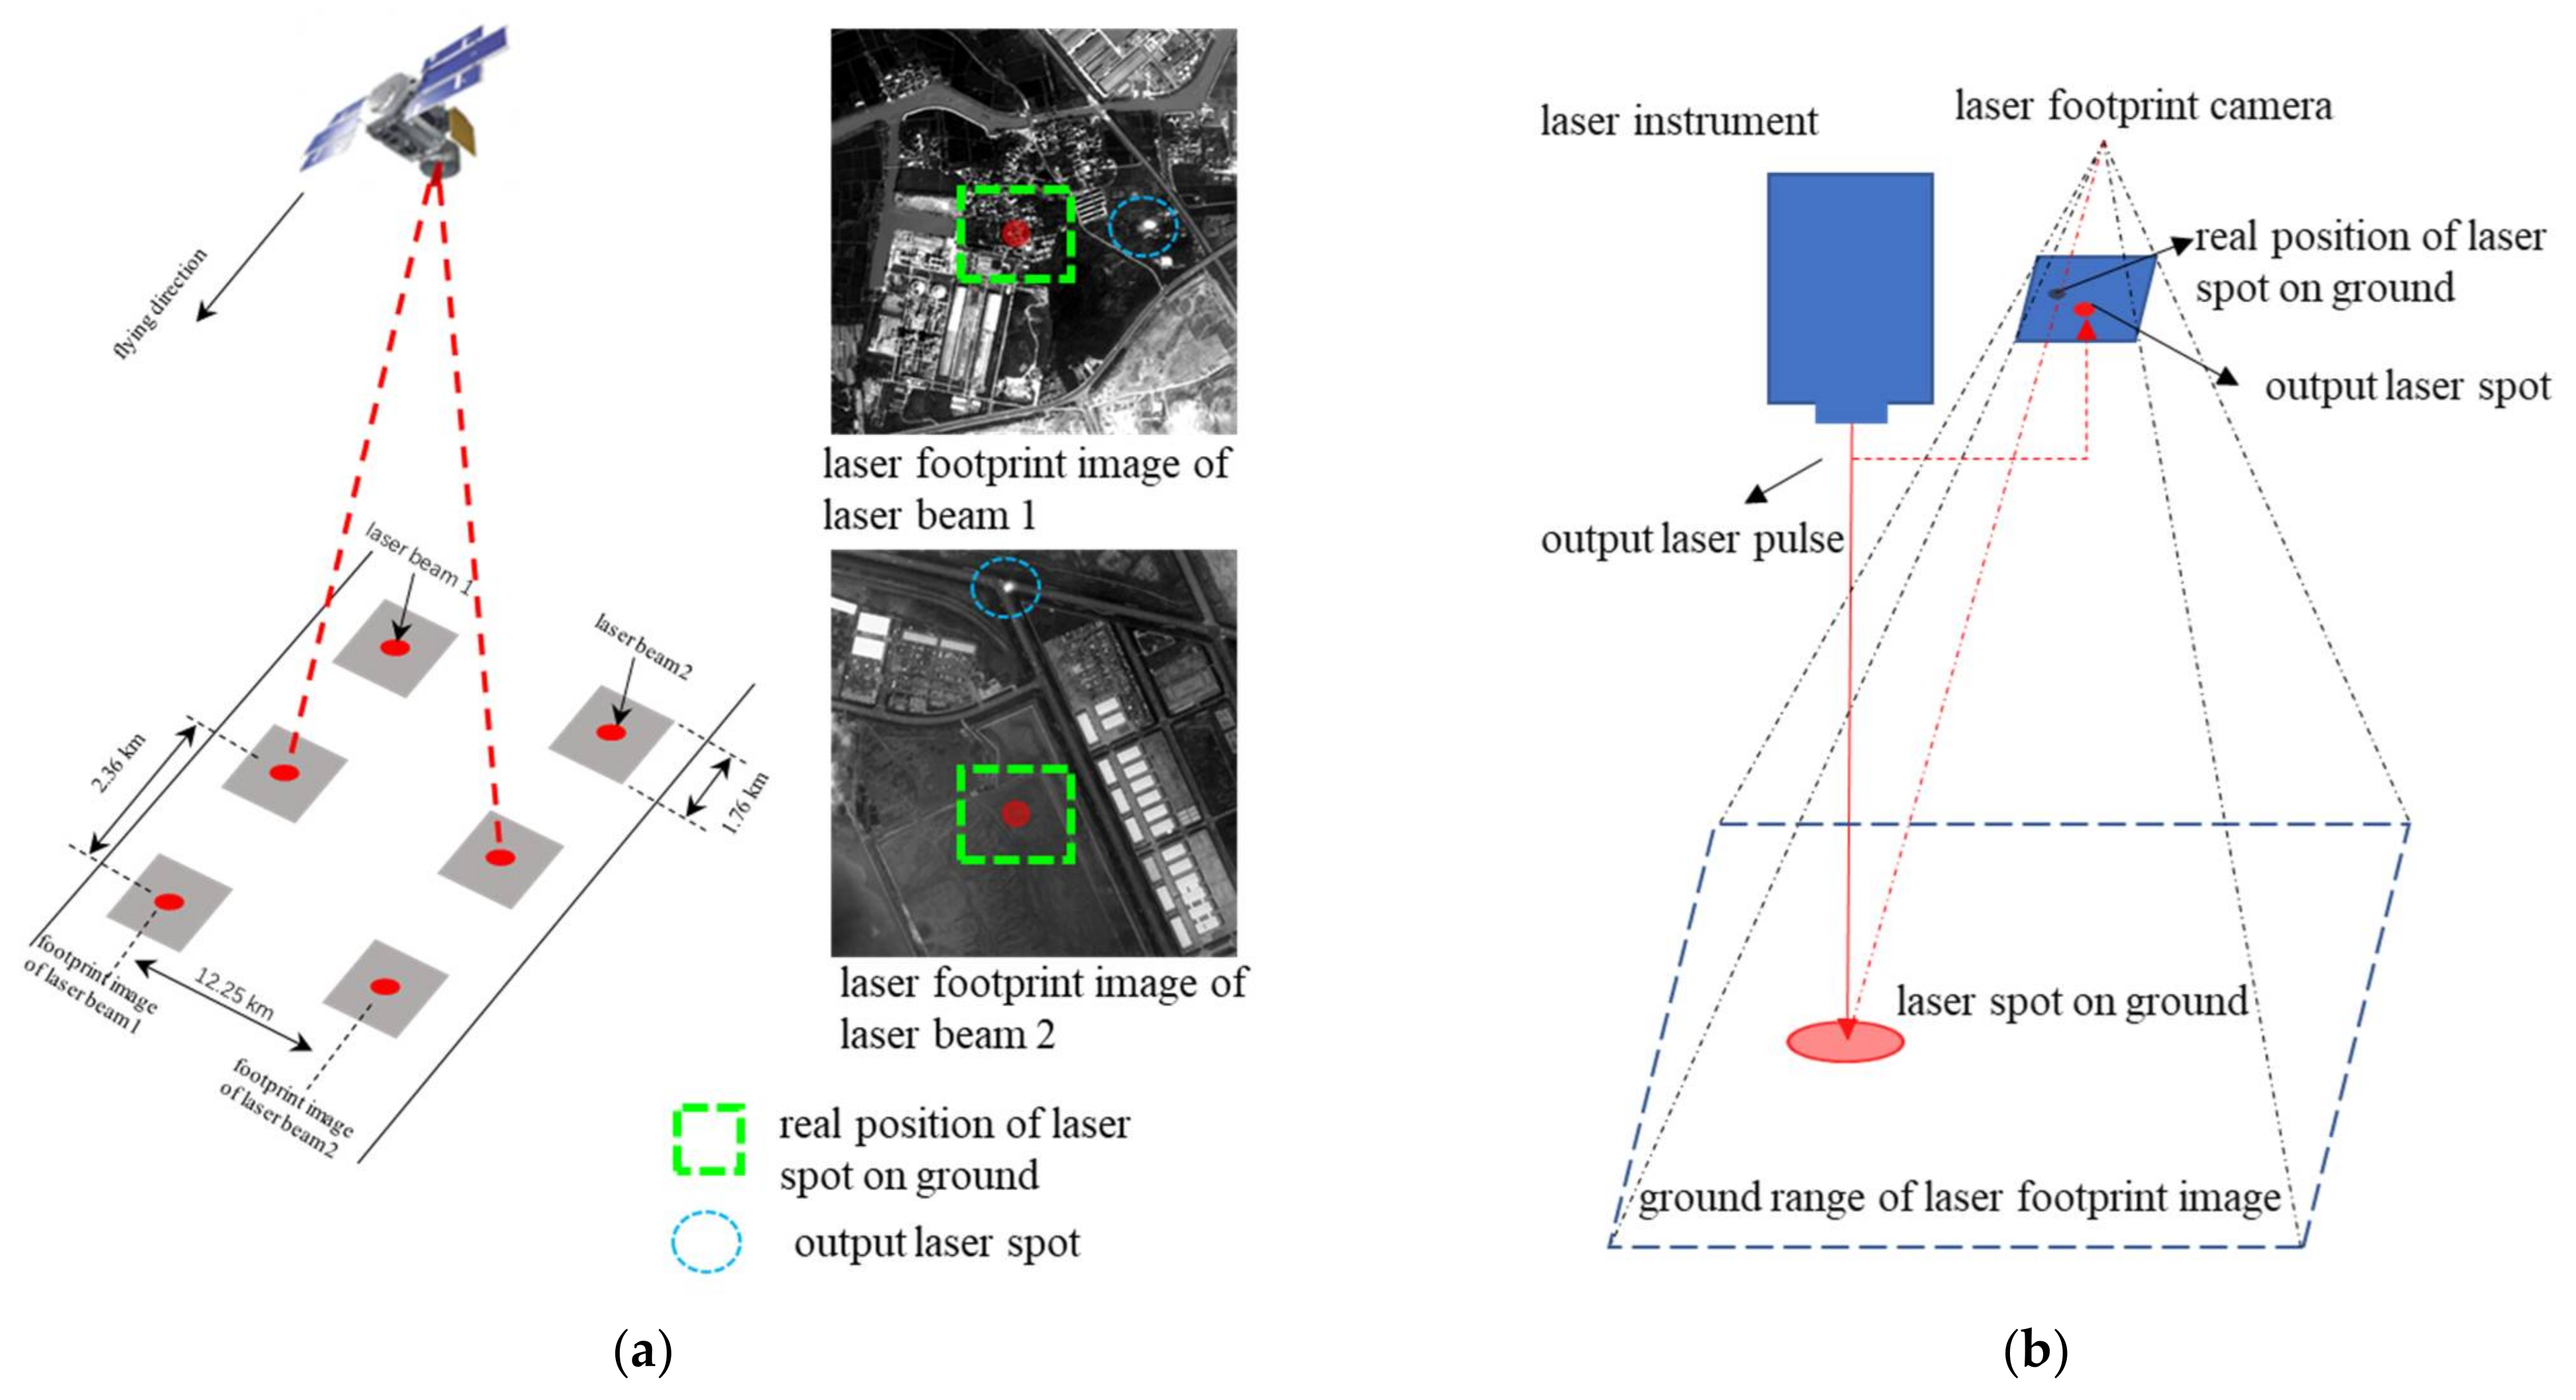
2.1. The GF-7 Satellite Data
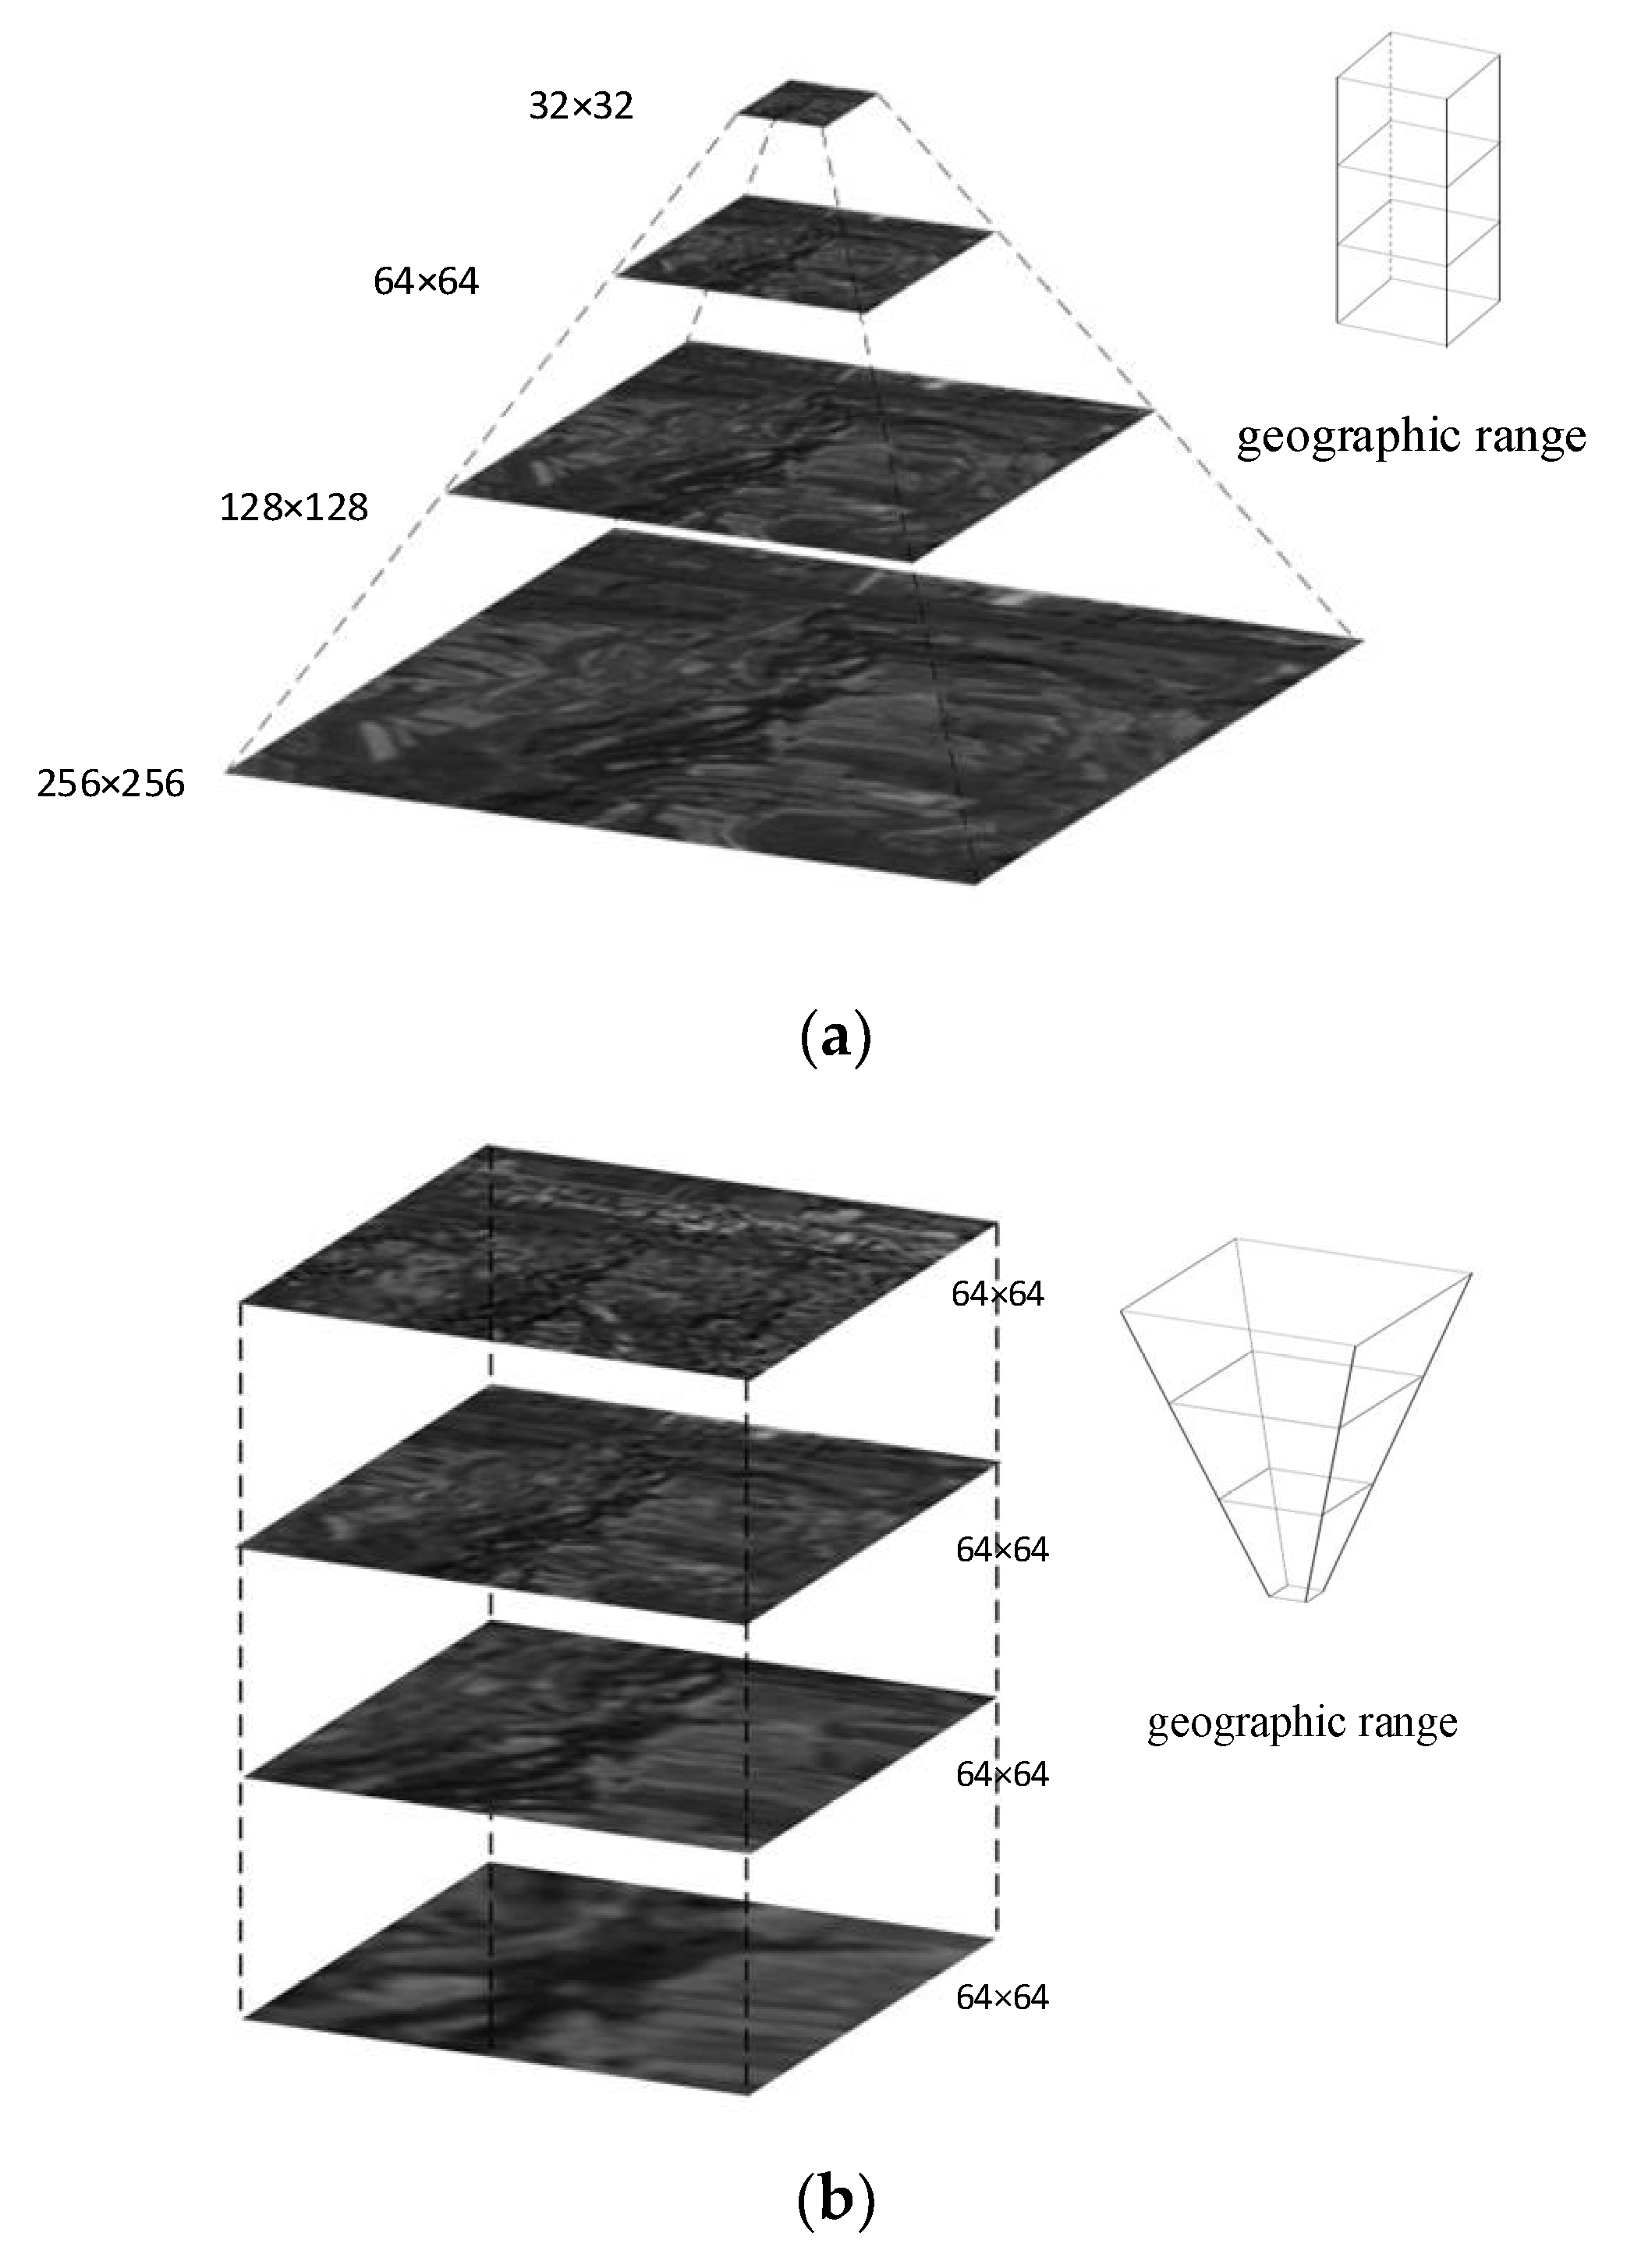
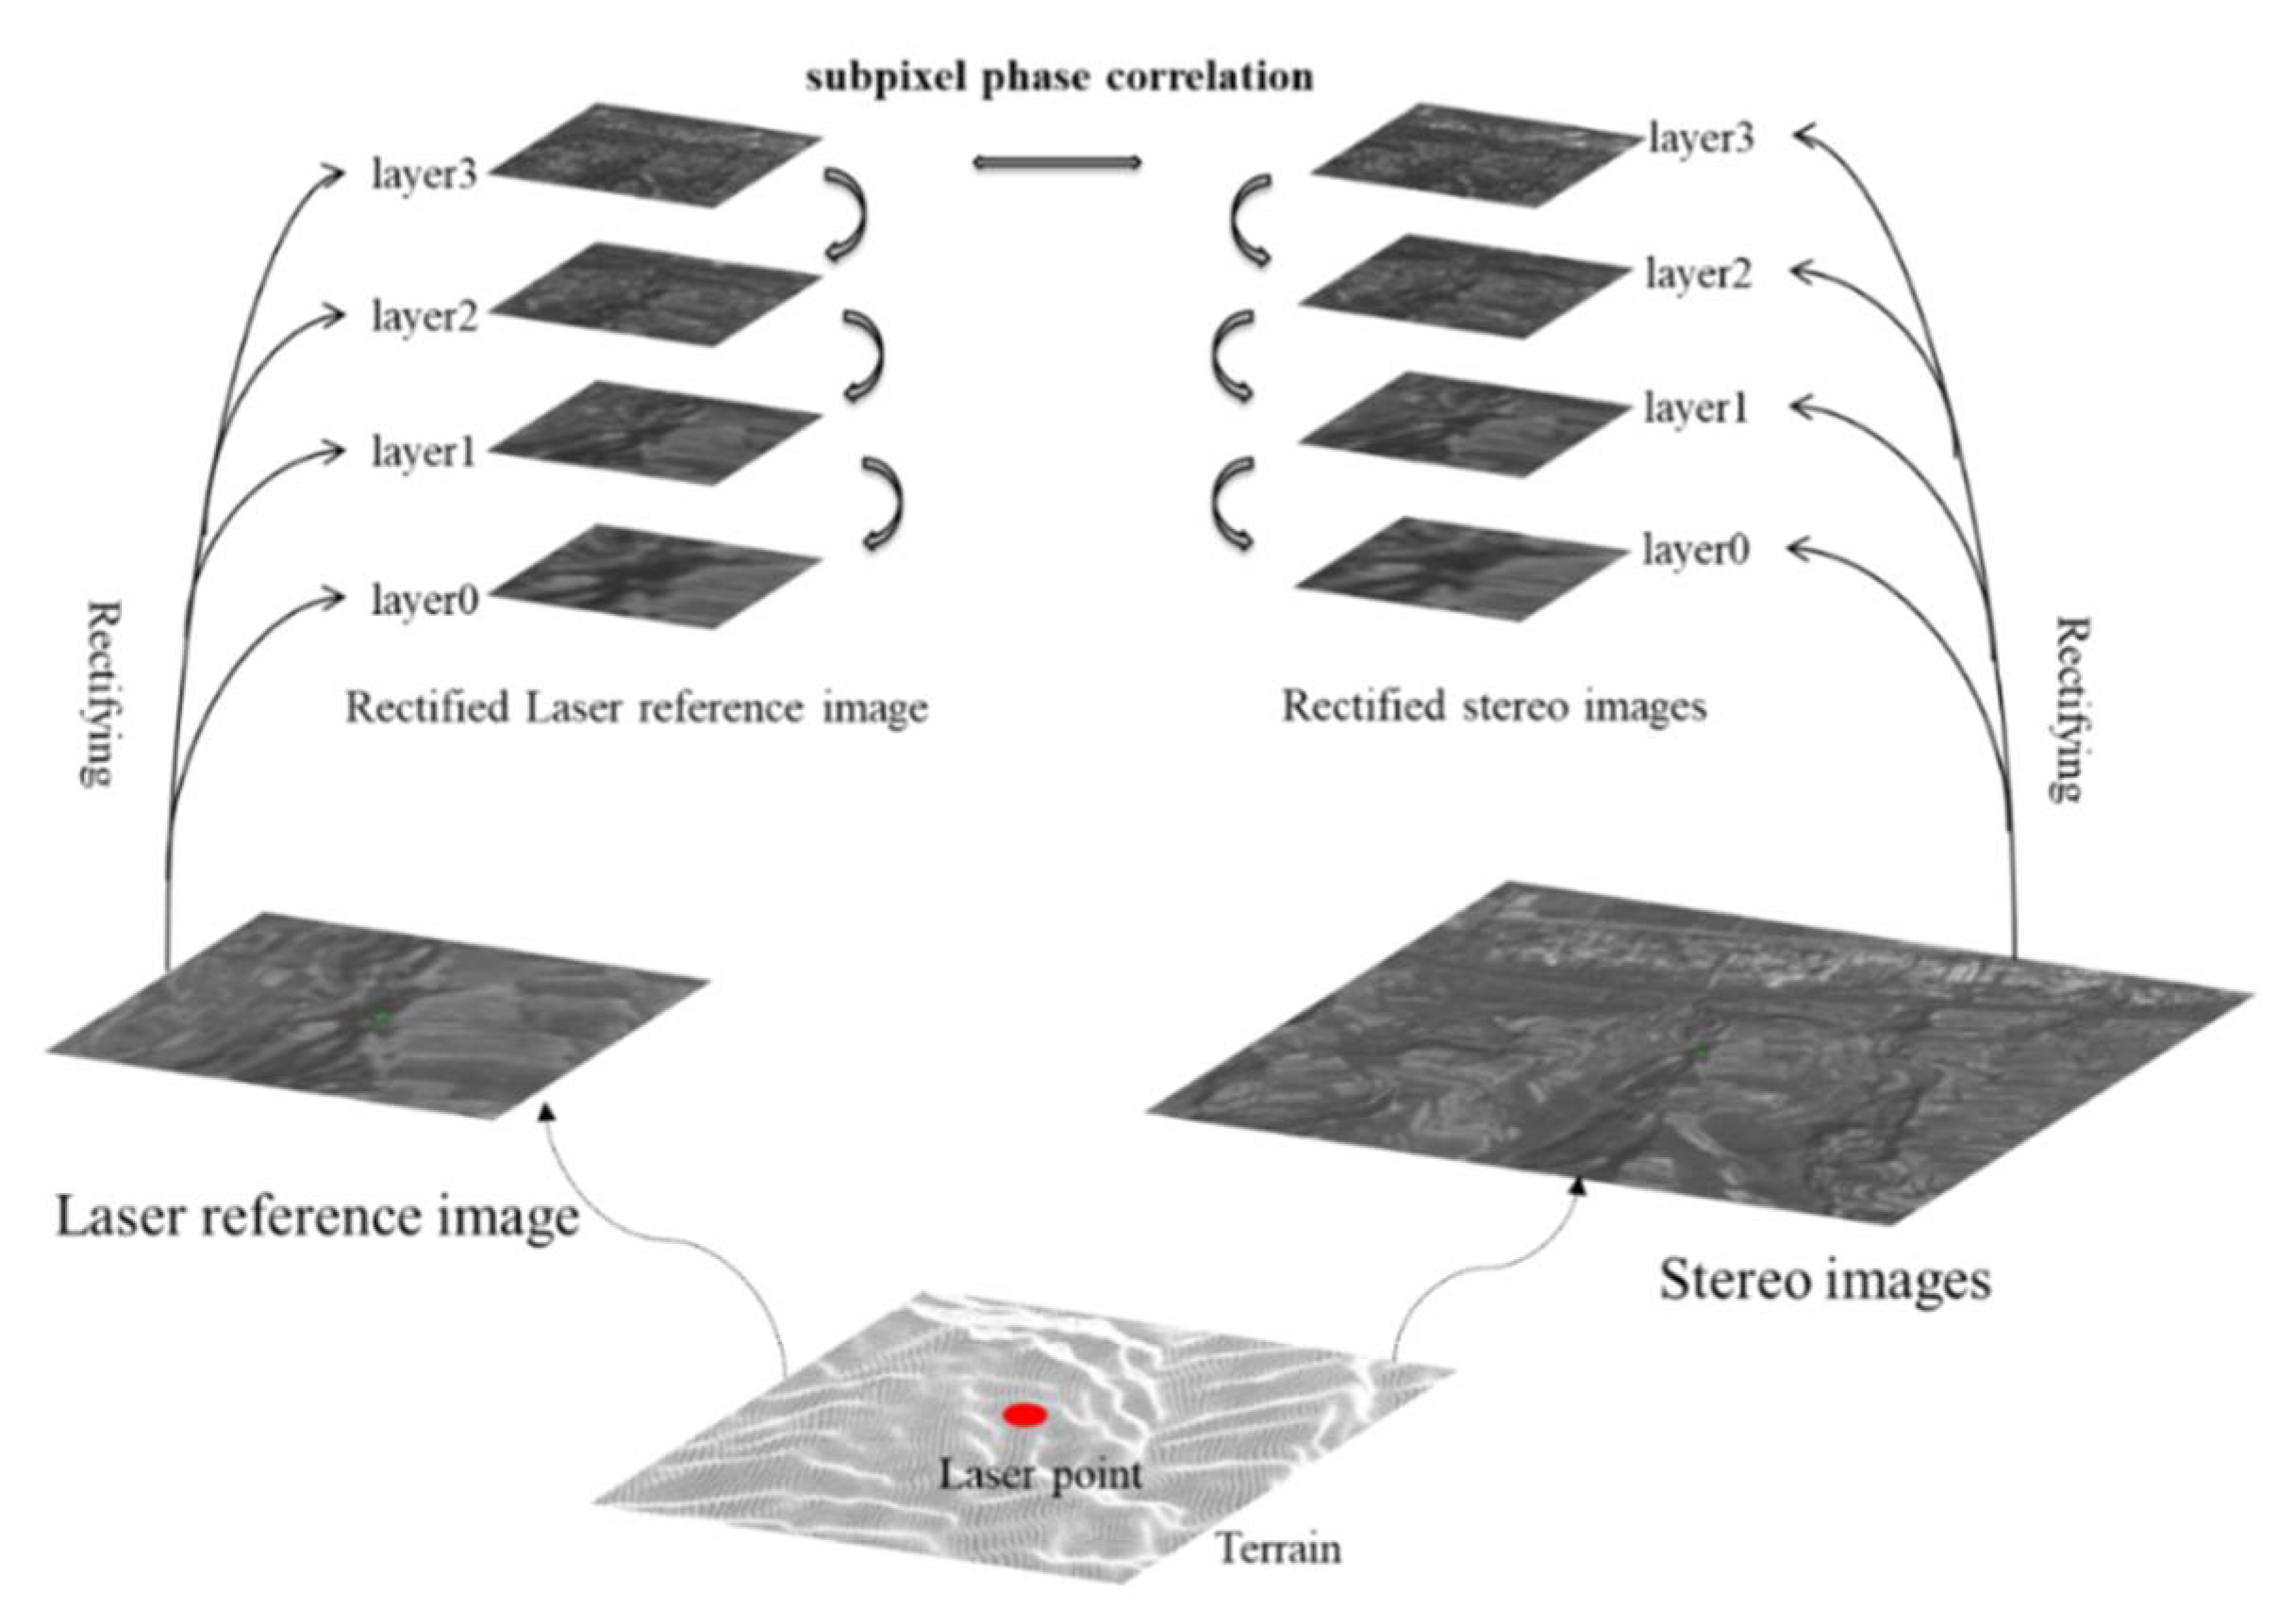
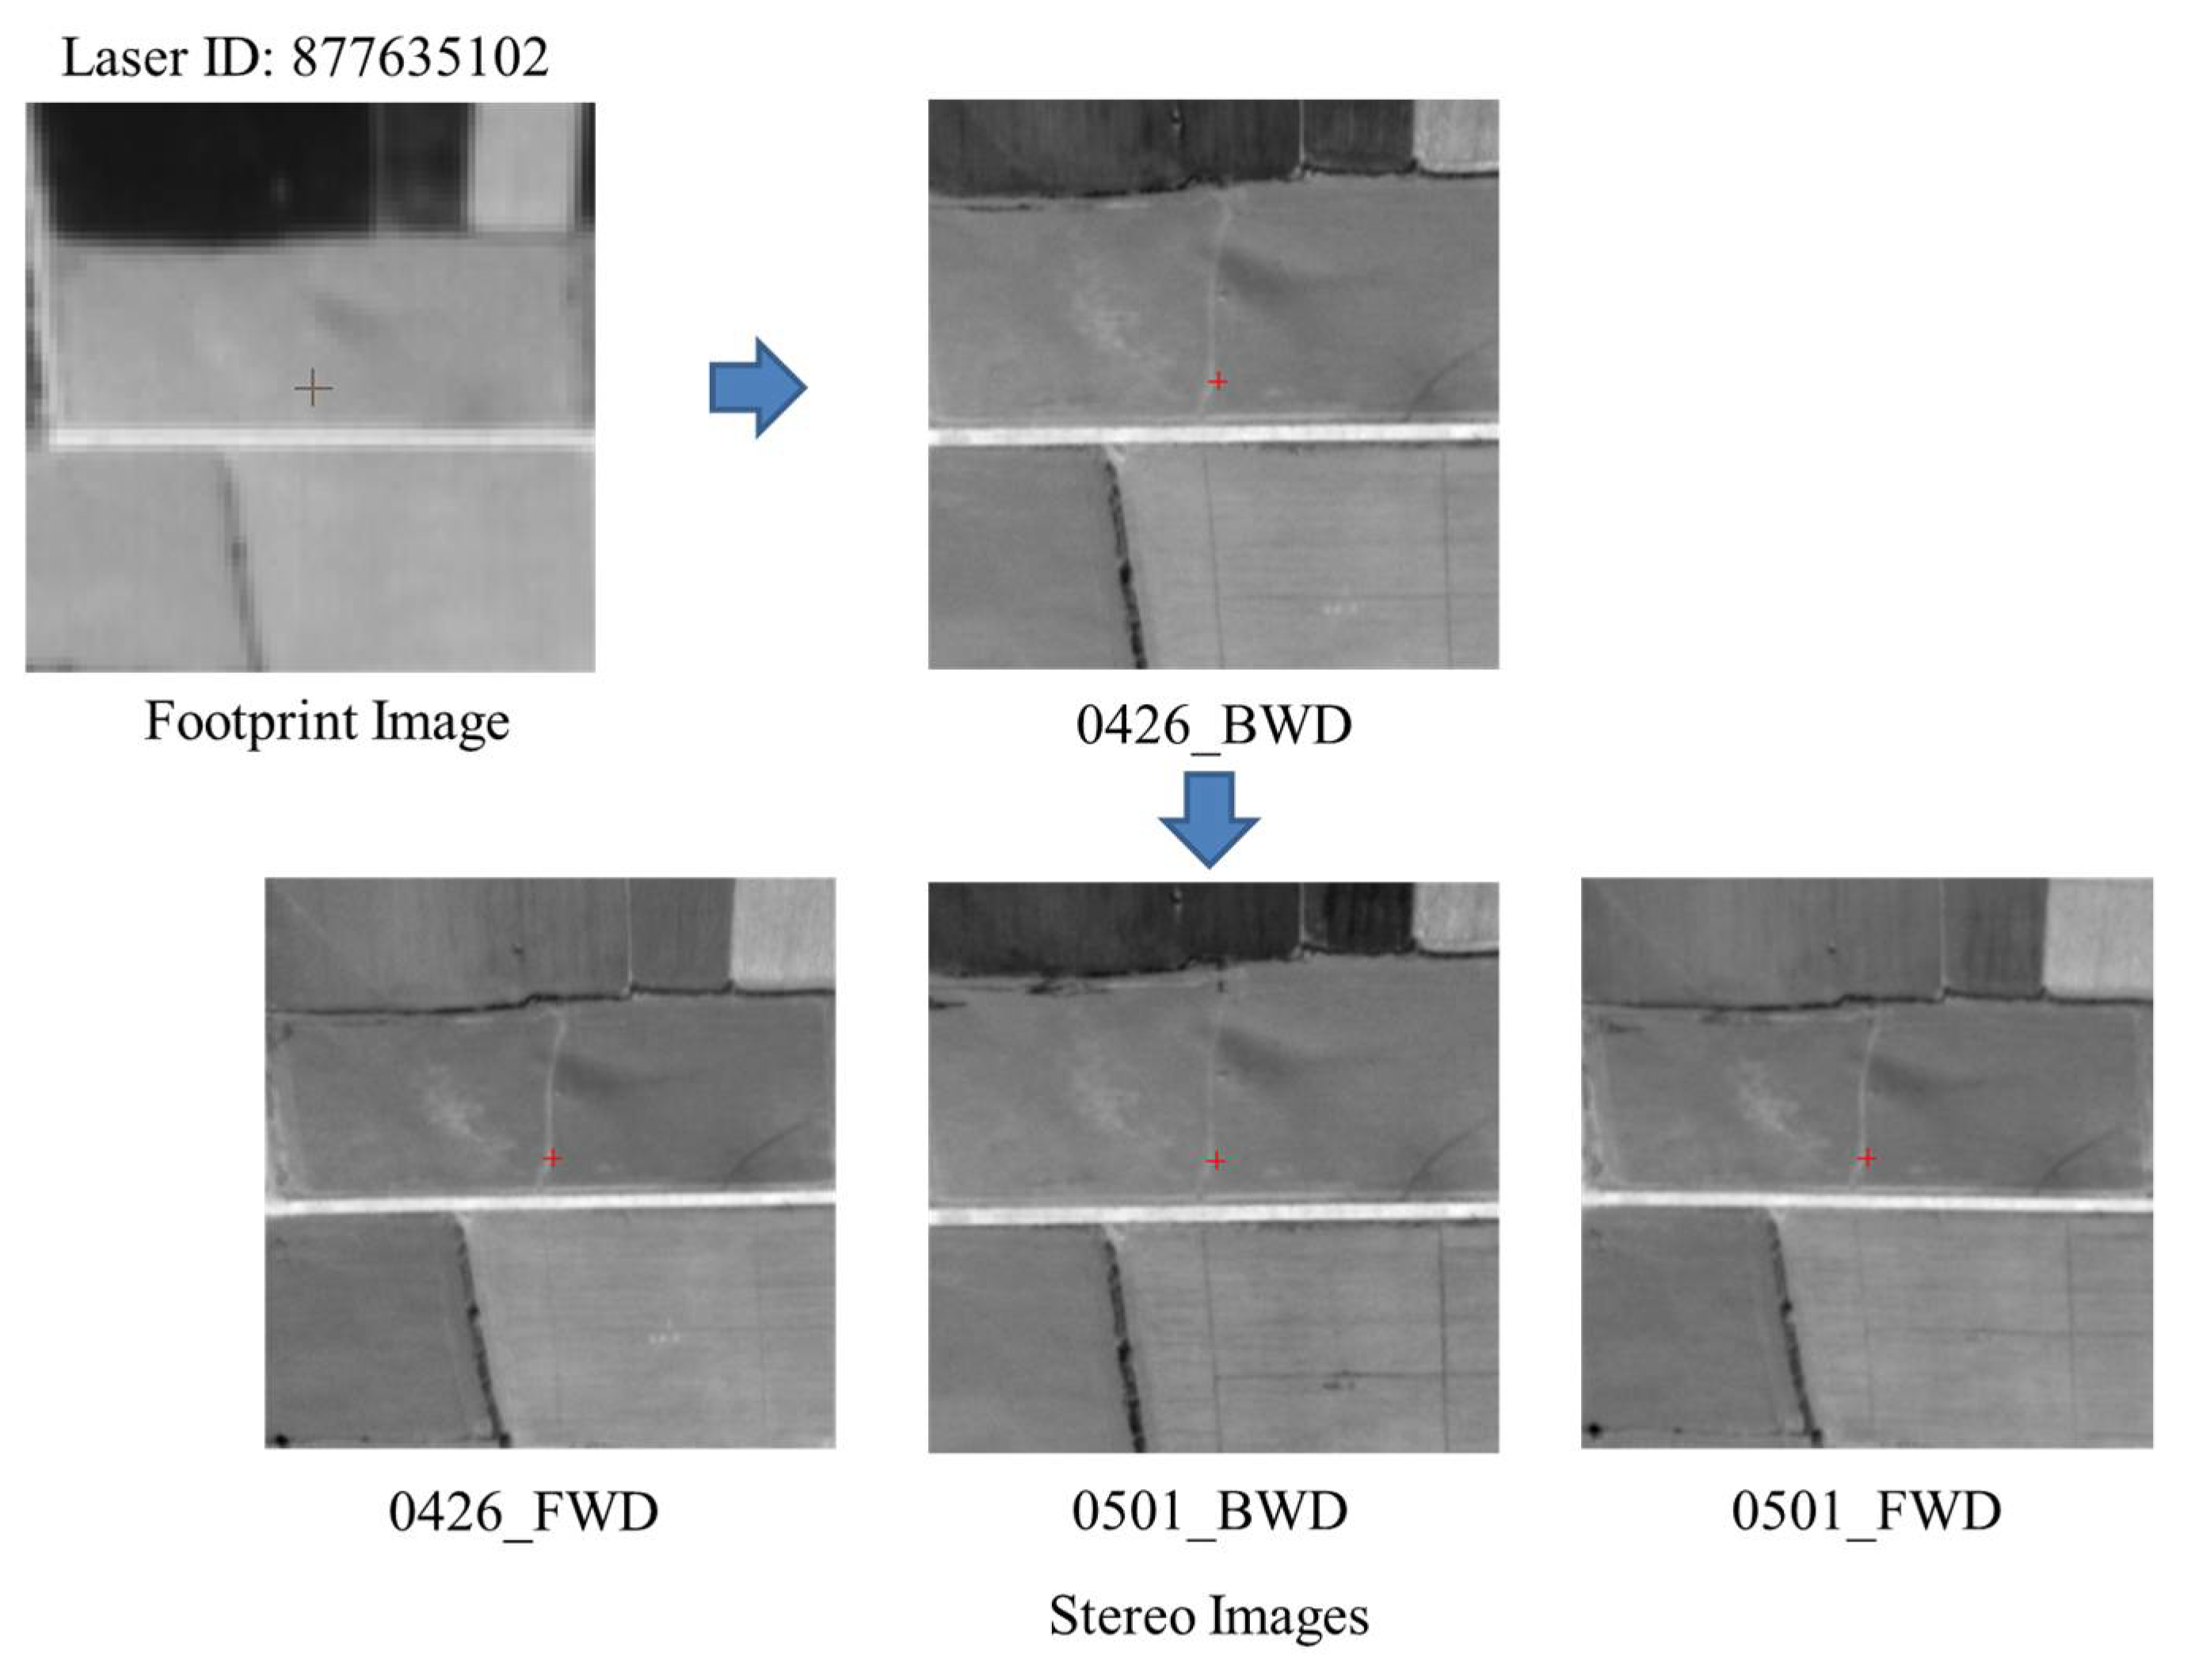
2.2. Registration for Laser Altimetry Data and Stereo Images
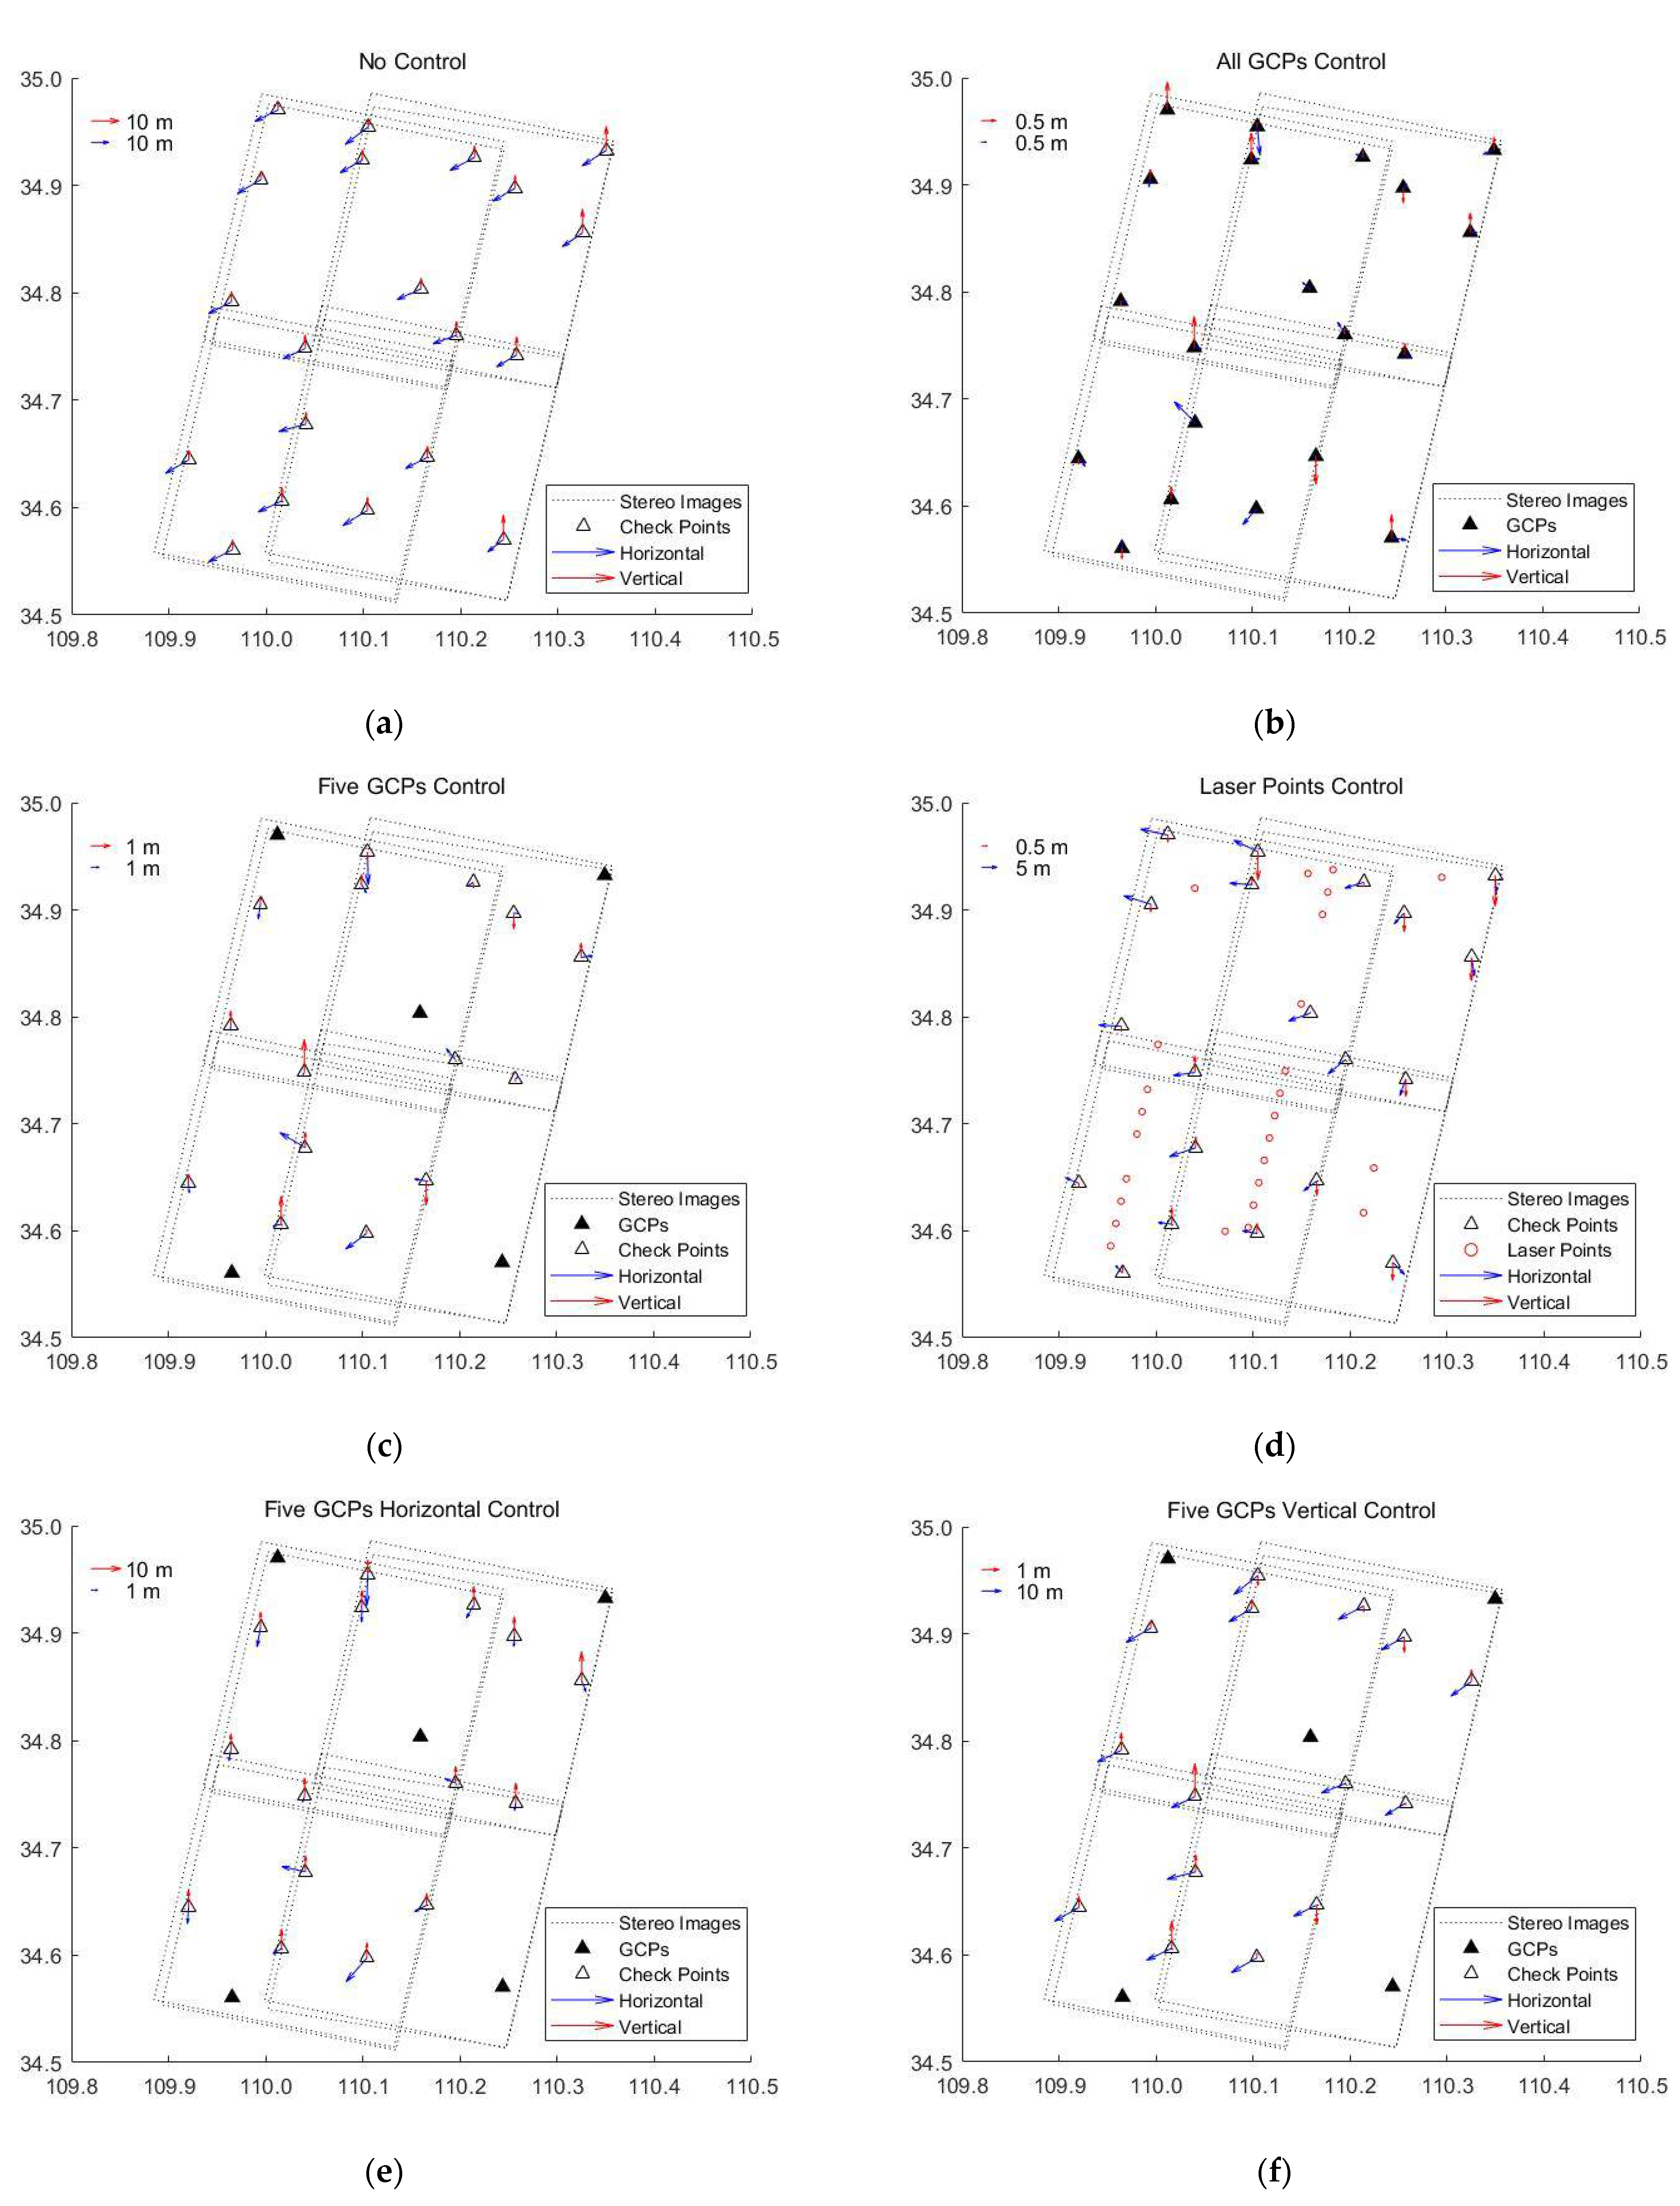
2.3. Bundle Adjustment for Stereo Mapping
- Plan A: free network adjustment;
- Plan B: adjustment with all GCPs that are available;
- Plan C: adjustment with a modest number of GCPs;
- Plan D: adjustment with LPs as control;
- Plan E: adjustment with a few GCPs as horizontal control;
- Plan F: adjustment with a few GCPs as vertical control;
- Plan G: adjustment with all LPs as vertical control;
- Plan H: adjustment with a few GCPs as horizontal control and LPs as vertical control.
3. Results
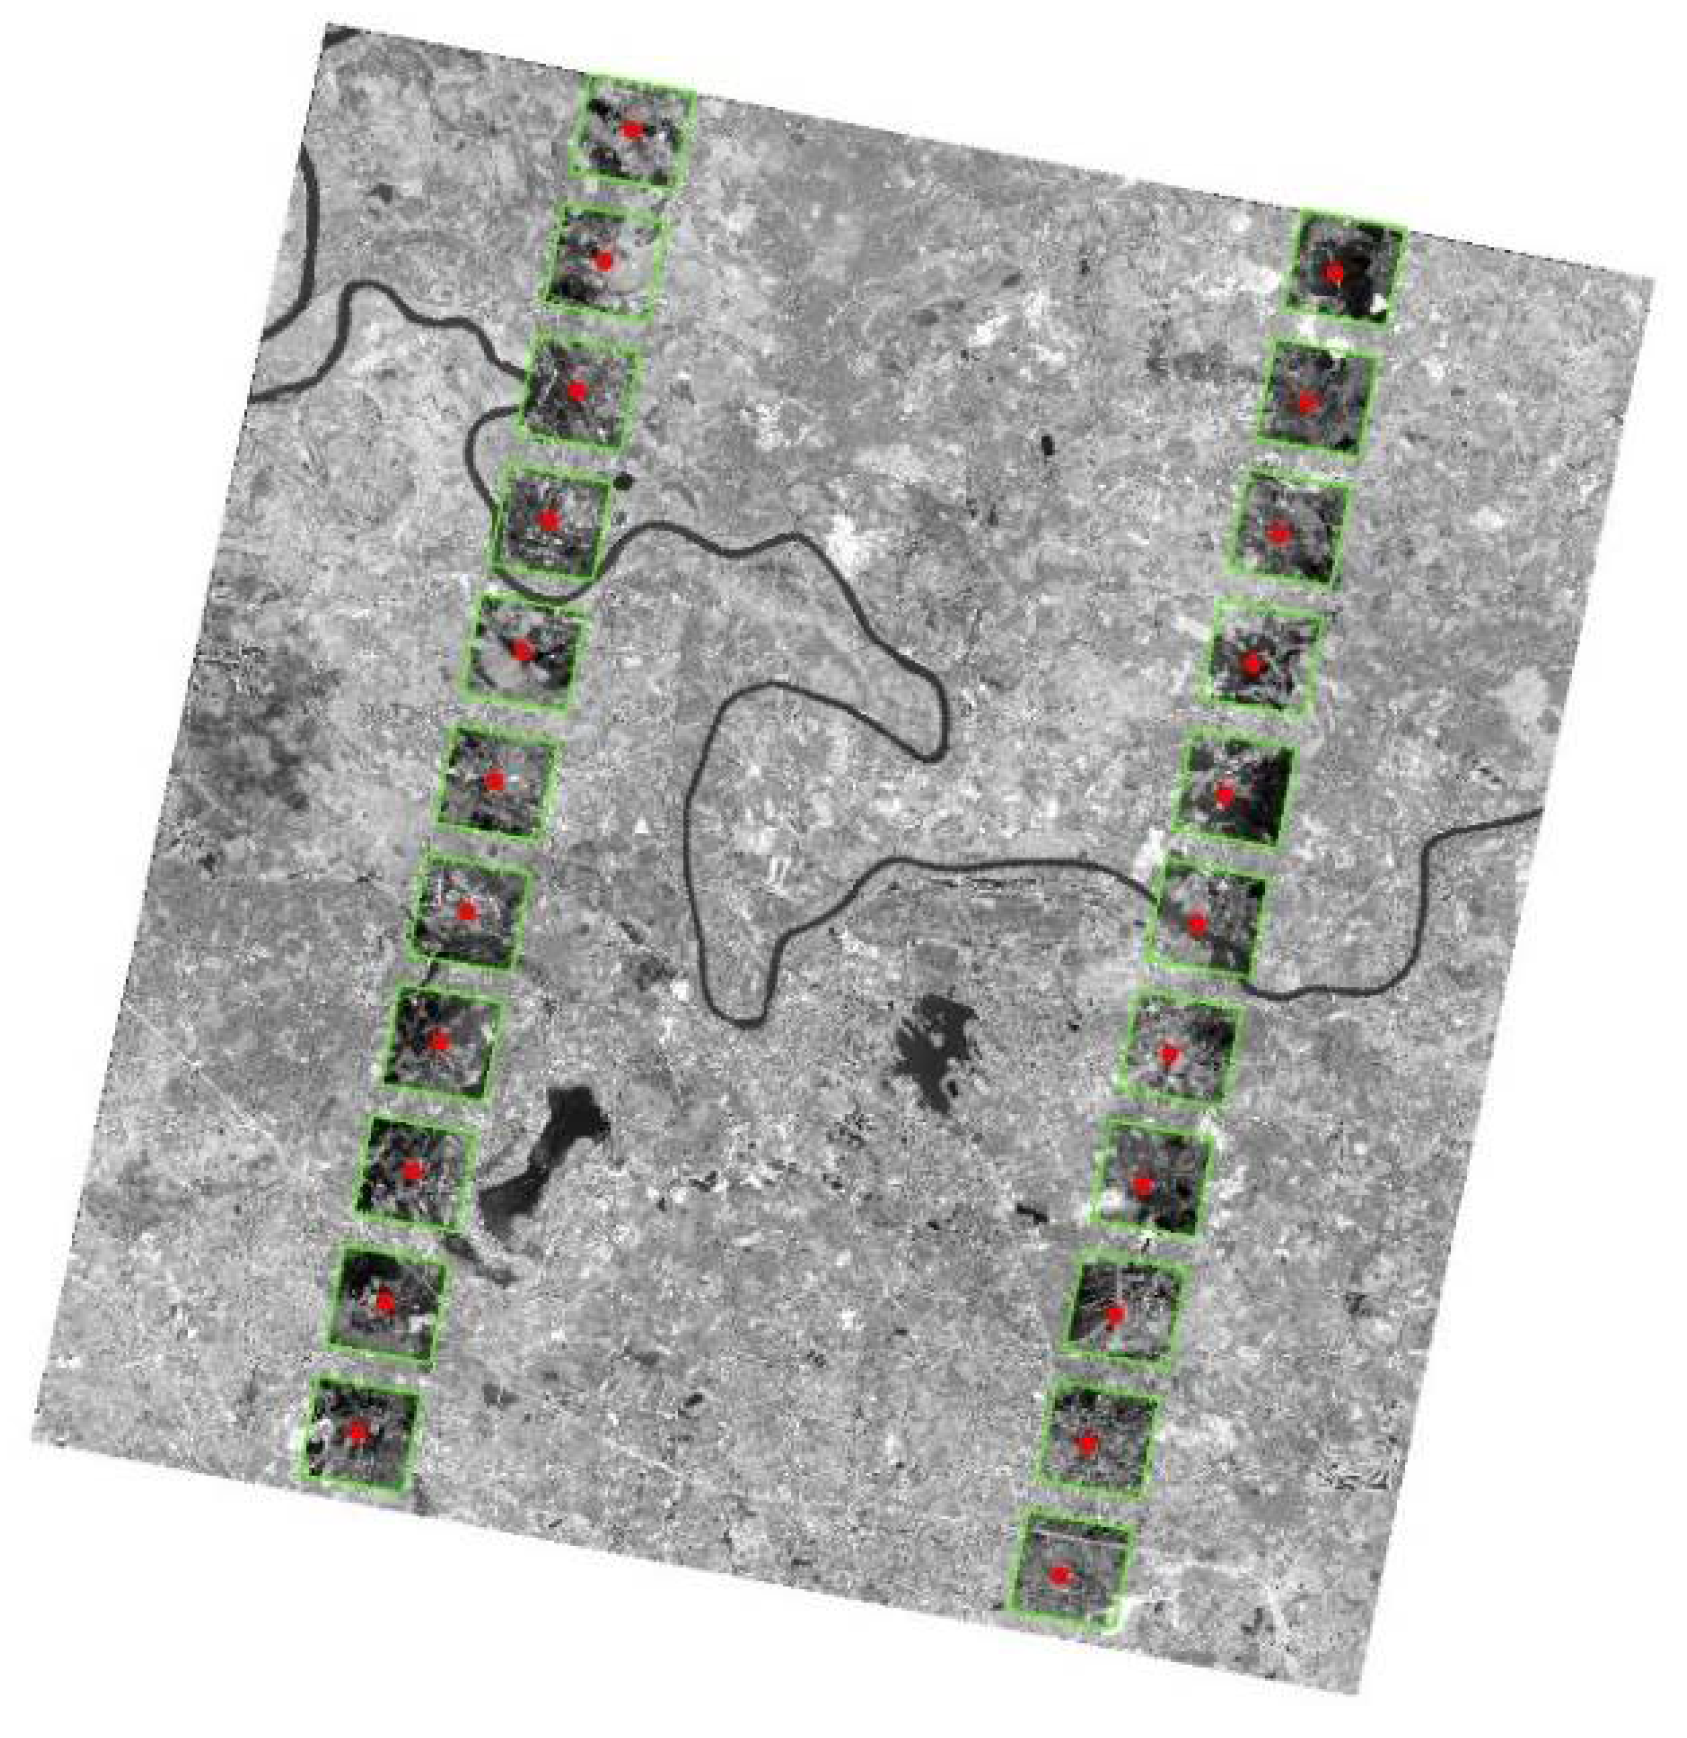
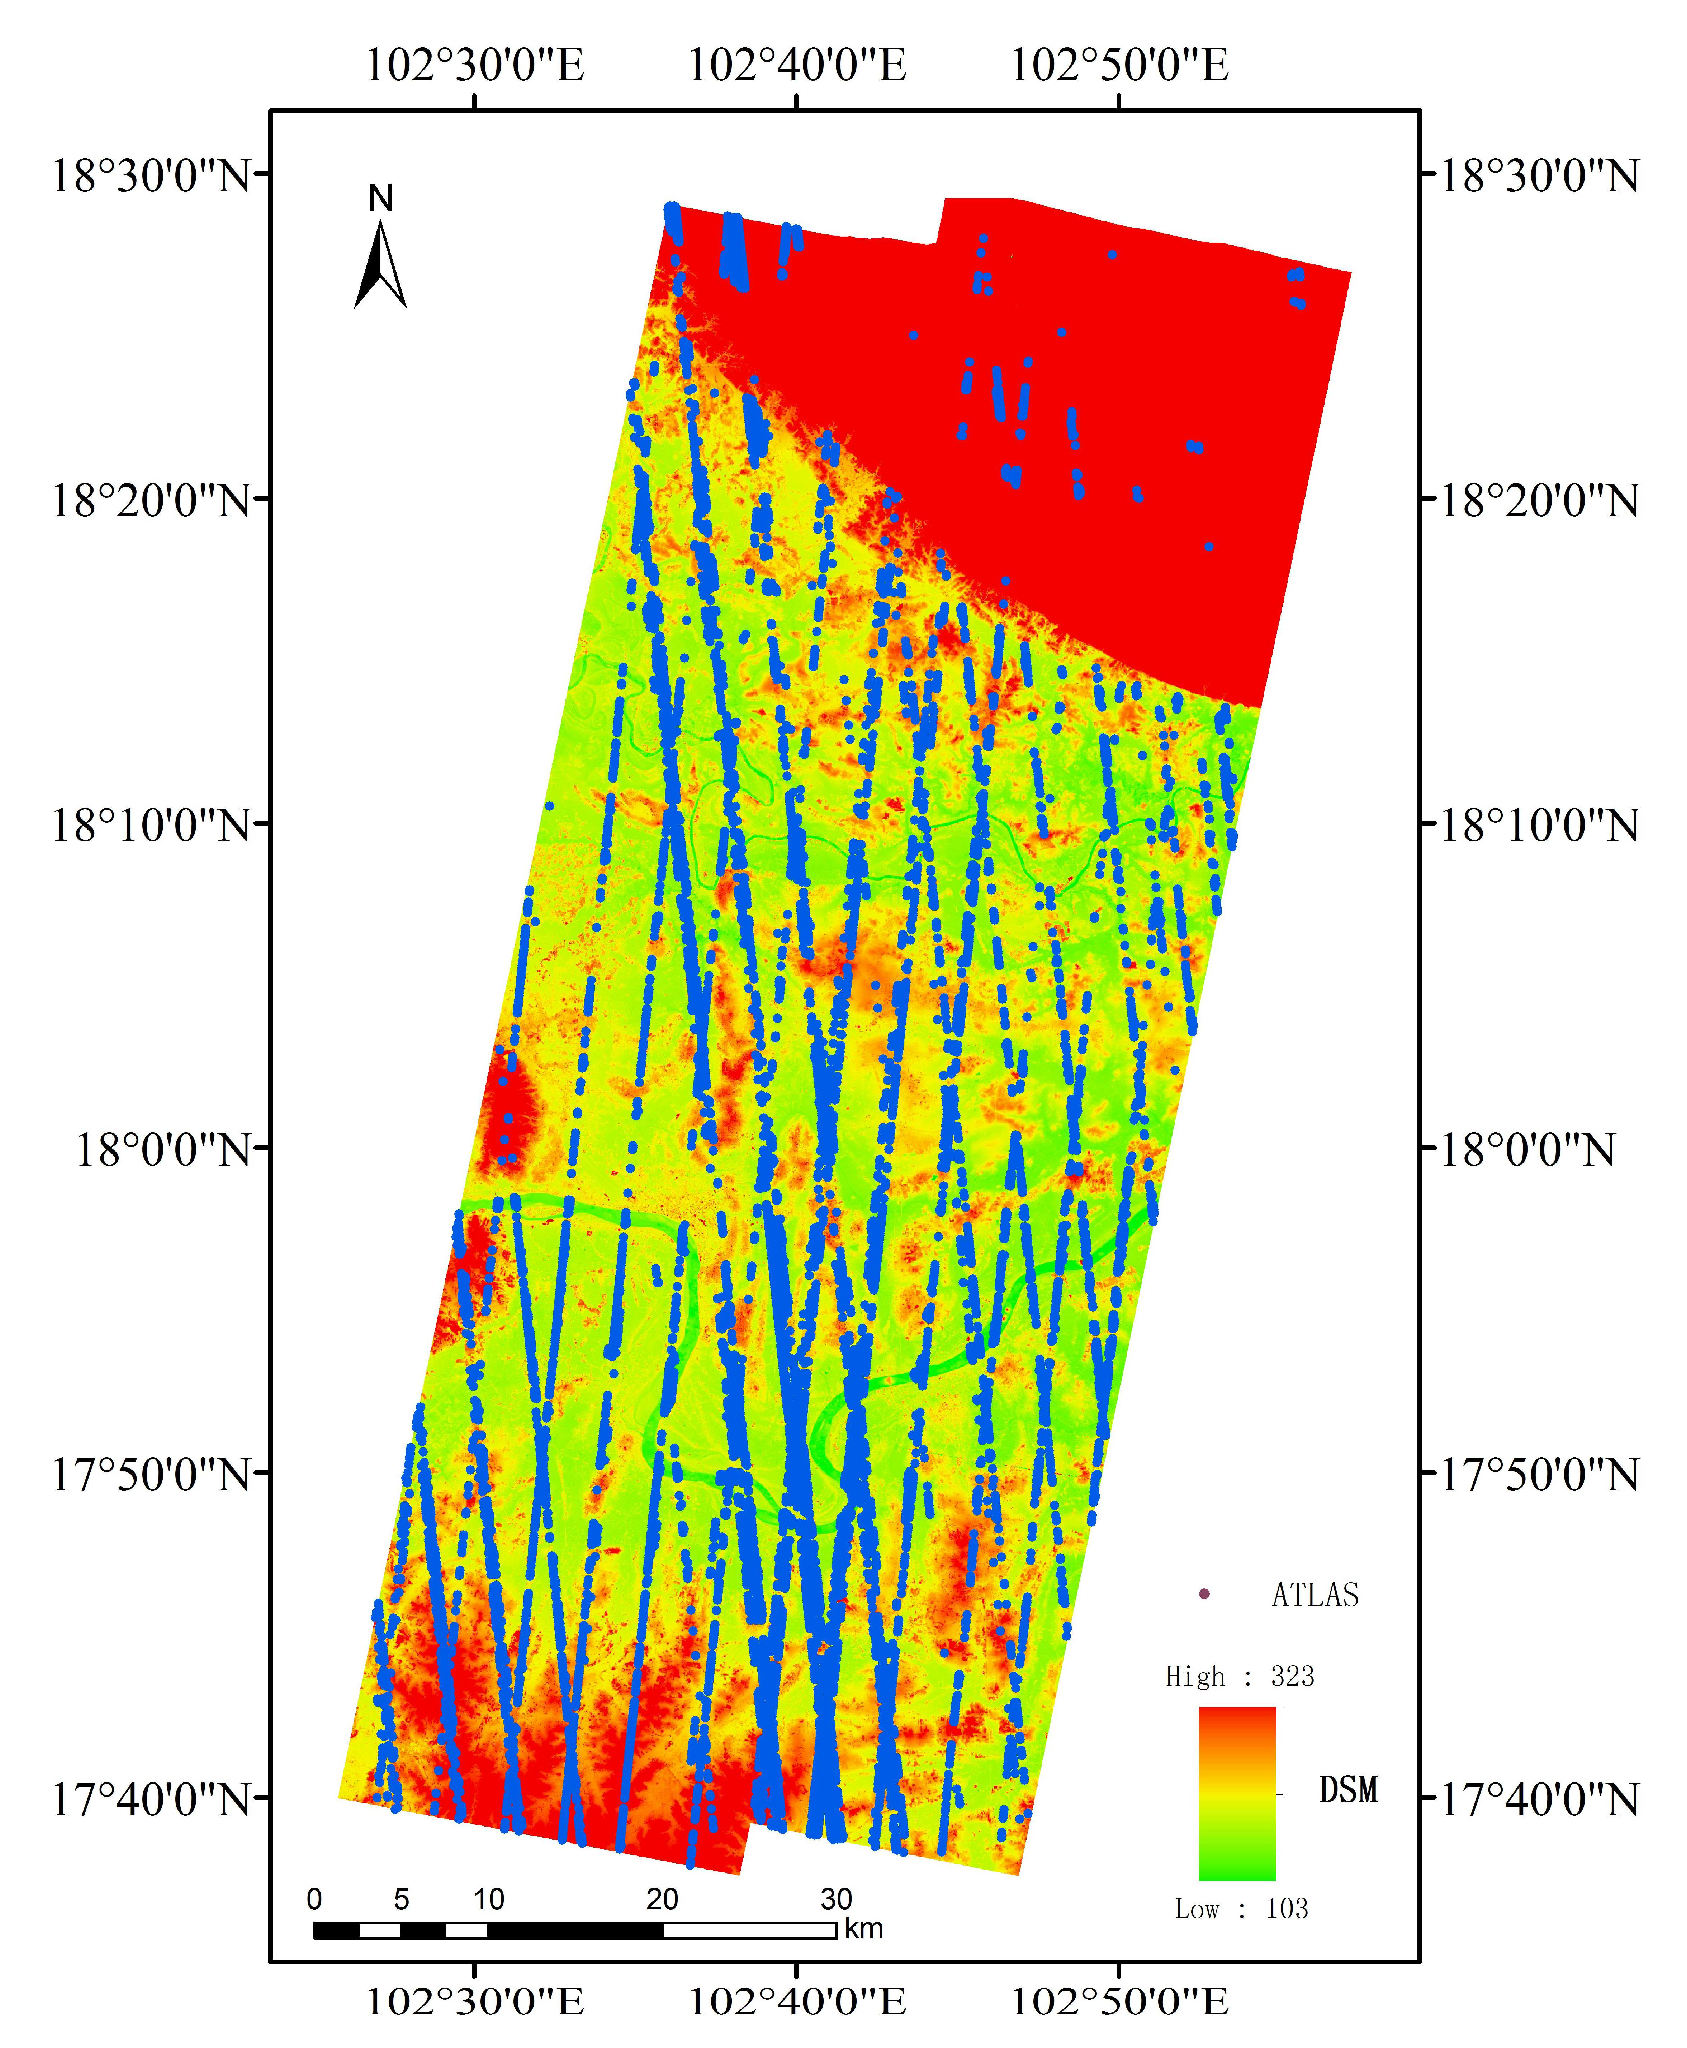
3.1. Study Area and Data
3.2. Results of Registration for Laser Altimetry Data and Stereo Images
3.3. Results of Bundle Adjustment
4. Discussion
5. Conclusions
Author Contributions
Funding
Institutional Review Board Statement
Informed Consent Statement
Data Availability Statement
Acknowledgments
Conflicts of Interest
References
- Tang, X.; Xie, J.; Liu, R.; Huang, G.; Zhao, C.; Zhen, Y.; Tang, H.; Dou, X. Overview of the GF-7 laser altimeter system mission. Earth Space Sci. 2020, 7, e2019EA000777. [Google Scholar] [CrossRef]
- Li, G.; Tang, X.; Chen, J.; Yao, J.; Liu, Z.; Gao, X.; Zuo, Z. Processing and preliminary accuracy validation of the GF-7 satellite laser altimetry data. Acta Geod. Cartogr. Sin. 2021, 50, 1338–1348. [Google Scholar] [CrossRef]
- Wang, R.; Wang, J. Technology of Bundle Adjustment Using Two-Line-Array CCD Satellite Image Combined Laser Ranging Data. J. Geomat. Sci. Technol. 2014, 31, 1–4. [Google Scholar]
- Yue, C.; Zheng, Y.; Tao, Y. Study on Space-borne Laser Altimeter Supported Satellite Photogrammetry. Spacecr. Recovery Remote Sens. 2013, 34, 71–76. [Google Scholar] [CrossRef]
- Wang, R. Chinese Photogrammetry Satellite without Ground Control Points(2)—Technical Thinking of 1:10 000 Scale Data-transferring Photogrammetry Satellite. Spacecr. Recovery Remote Sens. 2014, 35, 1–5. [Google Scholar] [CrossRef]
- Schutz, B.E.; Zwally, H.J.; Shuman, C.A.; Hancock, D.; DiMarzio, J.P. Overview of the ICESat Mission. Geophys. Res. Lett. 2005, 32, L21S01. [Google Scholar] [CrossRef] [Green Version]
- Takaku, J.; Tadono, T.; Tsutsui, K. Generation of high resolution global DSM from ALOS PRISM. In Proceedings of the International Archives of the Photogrammetry, Remote Sensing and Spatial Information Sciences, ISPRS Technical Commission IV Symposium, Suzhou, China, 14–16 May 2014. [Google Scholar] [CrossRef] [Green Version]
- Li, G.; Tang, X.; Gao, X.; Wang, H.; Wang, Y. Research on the ZY-3 Block Adjustment Supported by the GLAS Laser Altimetry Data. Photogramm. Record 2016, 31, 88–107. [Google Scholar] [CrossRef]
- Li, G.; Tang, X.; Zhang, C.; Gao, X.; Chen, J. Multi-criteria constraint algorithm for selecting ICESat/GLAS data as elevation control points. J. Remote Sens. 2017, 21, 96–104. [Google Scholar] [CrossRef]
- Wang, J.; Zhang, Y.; Zhang, Z.; Li, X.; Tao, P.; Song, M. ICESat Laser Points Assisted Block Adjustment for Mapping Satellite-1 Stereo Imagery. Acta Geod. Cartogr. Sin. 2018, 47, 359–369. [Google Scholar] [CrossRef]
- Tang, X.; Li, G.; Gao, X.; Chen, J. The Rigorous Geometric Model of Satellite Laser Altimeter and Preliminarily Accuracy Validation. Acta Geod. Cartogr. Sin. 2016, 45, 1182–1191. [Google Scholar] [CrossRef]
- Li, G.; Tang, X.; Gao, X.; Wang, X.; Fan, W.; Chen, J.; Mo, F. Integration of ZY3-02 Satellite Laser Altimetry Data and Stereo Images for High-Accuracy Mapping. Photogramm. Eng. Remote Sens. 2018, 84, 569–578. [Google Scholar] [CrossRef]
- Cao, N.; Zhou, P.; Wang, X.; Tang, X.; Li, G. Refined processing of laser altimeter data-aided satellite geometry model. J. Sens. 2018, 22, 599–610. [Google Scholar] [CrossRef]
- Zhang, G.; Xu, K.; Jia, P.; Hao, X.; Li, D. Integrating Stereo Images and Laser Altimeter Data of the ZY3-02 Satellite for Improved Earth Topographic Modeling. Remote Sens. 2019, 11, 2453. [Google Scholar] [CrossRef] [Green Version]
- Di, K.; Hu, W.; Liu, Y.; Peng, M. Co-registration of Chang’E-1 stereo images and laser altimeter data with crossover adjustment and image sensor model refinement. Adv. Space Res. 2012, 50, 1615–1628. [Google Scholar] [CrossRef]
- Wu, B.; Hu, H.; Guo, J. Integration of Chang’E-2 imagery and LRO laser altimeter data with a combined block adjustment for precision lunar topographic modeling. Earth Planet. Sci. Lett. 2014, 391, 1–15. [Google Scholar] [CrossRef]
- Chen, J.; Zhang, B.; Tang, X.; Li, G.; Zhou, X.; Hu, L.; Dou, X. On-Orbit Geometric Calibration and Accuracy Validation for Laser Footprint Cameras of GF-7 Satellite. Remote Sens. 2022, 14, 886. [Google Scholar] [CrossRef]
- Tang, X.; Li, G.; Chen, J.; Liu, Z. The specification of GF-7 satellite laser altimetry standard product. Land Satell. Remote Sens. 2020, 12, 1–29. Available online: http://sasclouds.com/chinese/applicationExtend/fileShare/course (accessed on 16 November 2021).
- Tang, X.; Xie, J.; Mo, F.; Dou, X.; Li, X.; Li, S.; Li, S.; Huang, G.; Fu, X.; Liu, R.; et al. GF-7 dual-beam laser altimeter on-orbit geometric calibration and test verification. Acta Geod. Cartogr. Sin. 2021, 50, 384–395. [Google Scholar] [CrossRef]
- Tao, C.V.; Hu, Y. A comprehensive study of the rational function model for photogrammetric processing. Photogramm. Eng. Remote Sens. 2001, 67, 1347–1357. [Google Scholar]
- Huang, G.; Ding, Y.; Wu, J. Design and On-orbit Validation of GF-7 Satellite Laser Altimeter. Spacecr. Eng. 2020, 3, 68–73. [Google Scholar]
- Lowe, D.G. Distinctive image features from scale-invariant keypoints. Int. J. Comput. Vis. 2004, 60, 91–110. [Google Scholar] [CrossRef]
- Bay, H.; Ess, A.; Tuytelaars, T.; Van Gool, L. Speeded-up robust features (SURF). Comput. Vis. Image Underst. 2008, 110, 346–359. [Google Scholar] [CrossRef]
- Kuglin, C.D.; Hines, D.C. The Phase Correlation Image Alignment Method. In Proceeding of the IEEE International Conference on Cybernetics and Society, New York, NY, USA, 1975; pp. 163–165. [Google Scholar]
- Foroosh, H.; Zerubia, J.; Berthod, M. Extension of Phase Correlation to Subpixel Registration. IEEE Trans. Image Process. 2002, 11, 188–200. [Google Scholar] [CrossRef] [PubMed] [Green Version]
- Wang, Z.; Bovik, A.C.; Sheikh, H.R.; Simoncelli, E.P. Image quality assessment: From error visibility to structural similarity. IEEE Trans. Image Process. 2004, 13, 600–612. [Google Scholar] [CrossRef] [Green Version]
- Dial, G.; Grodecki, J. Block adjustment with rational polynomial camera models. In Proceedings of the ACSM-ASPRS 2002, Washington, DC, USA, 22–26 April 2002. [Google Scholar]
- Grodecki, J.; Dial, G. Block Adjustment of High-Resolution Satellite Images Described by Rational Polynomials. Photogramm. Eng. Remote Sens. 2003, 69, 59–68. [Google Scholar] [CrossRef]
- Fraser, C.; Hanley, H. Bias-compensated RPCs for sensor orientation of high-resolution satellite imagery. Photogramm. Eng. Remote Sens. 2005, 71, 909–915. [Google Scholar] [CrossRef]
- Huang, X.; Qin, R. Multi-View Large-Scale Bundle Adjustment Method for High-Resolution Satellite Images. In Proceedings of the ASPRS 2019 Annual Conference, Denver, CO, USA, 27–31 January 2019. [Google Scholar]
- Agarwal, S.; Mierle, K. Ceres Solver. Available online: http://ceres-solver.org (accessed on 10 October 2021).
- Neumann, T.A.; Martino, A.J.; Markus, T.; Bae, S.; Bock, M.R.; Brenner, A.C.; Brunt, K.M.; Cavanaugh, J.; Fernandes, S.T.; Hancock, D.W.; et al. The Ice, Cloud, and Land Elevation Satellite—2 mission: A global geolocated photon product derived from the Advanced Topographic Laser Altimeter System. Remote Sens. Environ. 2019, 233, 111325. [Google Scholar] [CrossRef]
- Tian, X.; Shan, J. Comprehensive Evaluation of the ICESat-2 ATL08 Terrain Product. IEEE Trans. Geosci. Remote Sens. 2021, 59, 8195–8209. [Google Scholar] [CrossRef]
- Hirschmuller, H. Accurate and efficient stereo processing by semi-global matching and mutual information. In Proceedings of the 2005 IEEE Computer Society Conference on Computer Vision and Pattern Recognition (CVPR’05), San Diego, CA, USA, 20–25 June 2005; Volume 802, pp. 807–814. [Google Scholar] [CrossRef]
- Li, B.; Xie, H.; Liu, S.; Tong, X.; Tang, H.; Wang, X. A Method of Extracting High-Accuracy Elevation Control Points from ICESat-2 Altimetry Data. Photogramm. Eng. Remote Sens. 2021, 87, 821–830. [Google Scholar] [CrossRef]
- Zhao, C.M.; Tang, X.M. Precise Orbit Determination for the ZY-3 Satellite Mission Using GPS Receiver. J. Astronaut. 2013, 34, 1202–1206. [Google Scholar]
- Tang, X.; Xie, J.; Wang, X.; Jiang, W. High-Precision Attitude Post-Processing and Initial Verification for the ZY-3 Satellite. Remote Sens. 2015, 7, 111–134. [Google Scholar] [CrossRef]


| Experiments | Selected | Matched | Success Rate | X Res/Pixels | Y Res/Pixels |
|---|---|---|---|---|---|
| Shaanxi Area | 26 | 24 | 92.3% | 0.31 | 0.40 |
| Laos–Thailand border Area | 53 | 49 | 92.5% | 0.19 | 0.10 |
| Index | GCPs | CPs | LPs | X/m | Y/m | Horizontal/m | Elevation/m | ||||
|---|---|---|---|---|---|---|---|---|---|---|---|
| RMSE | ME | RMSE | ME | RMSE | ME | RMSE | ME | ||||
| Plan A | 0 | 20 | 0 | 12.758 | −12.703 | 6.393 | −6.135 | 14.270 | 14.209 | 4.486 | 4.238 |
| Plan B | 20 | 0 | 0 | 0.827 | −0.122 | 0.903 | −0.064 | 1.224 | 1.065 | 0.481 | 0.154 |
| Plan C | 5 | 15 | 0 | 1.272 | −0.559 | 1.313 | −0.442 | 1.828 | 1.564 | 0.737 | 0.175 |
| Plan D | 0 | 20 | 24 | 5.686 | −4.784 | 2.905 | 1.283 | 6.385 | 6.169 | 1.115 | −0.388 |
| Plan E | 5H | 15 | 0 | 1.452 | −0.955 | 2.471 | −1.391 | 2.866 | 2.513 | 5.368 | 5.267 |
| Plan F | 5V | 15 | 0 | 12.203 | −12.159 | 5.995 | −5.866 | 13.596 | 13.557 | 0.781 | 0.217 |
| Plan G | 0 | 20 | 24V | 10.675 | −10.527 | 4.792 | −4.631 | 11.701 | 11.558 | 1.192 | −0.379 |
| Plan H | 5H | 15 | 24V | 1.586 | −1.012 | 1.445 | −0.598 | 2.146 | 1.907 | 0.934 | −0.148 |
| Index | GCPs | CPs | LPs | X/m | Y/m | Horizontal/m | Elevation/m | ||||
|---|---|---|---|---|---|---|---|---|---|---|---|
| RMSE | ME | RMSE | ME | RMSE | ME | RMSE | ME | ||||
| Plan A | 0 | 5 | 0 | 11.809 | −11.781 | 5.033 | −4.838 | 12.837 | 12.800 | 3.363 | −3.294 |
| Plan B | 5 | 0 | 0 | 0.914 | −0.486 | 0.835 | −0.114 | 1.238 | 1.147 | 0.366 | 0.059 |
| Plan C | 2 | 3 | 0 | 1.630 | −1.395 | 1.061 | 0.448 | 1.945 | 1.738 | 1.299 | 0.846 |
| Plan D | 0 | 5 | 49 | 2.475 | −2.398 | 5.362 | 5.105 | 5.906 | 5.692 | 0.937 | −0.612 |
| Plan E | 2H | 3 | 0 | 2.235 | −2.026 | 2.596 | −0.843 | 3.405 | 3.174 | 7.273 | 7.197 |
| Plan F | 2V | 3 | 0 | 11.024 | −11.002 | 5.291 | −5.189 | 12.228 | 12.221 | 1.217 | 0.796 |
| Plan G | 0 | 5 | 49V | 6.670 | −6.577 | 1.193 | −0.704 | 6.776 | 6.659 | 1.037 | −0.794 |
| Plan H | 2H | 3 | 49V | 1.215 | −1.024 | 1.334 | 0.868 | 1.804 | 1.586 | 0.794 | −0.020 |
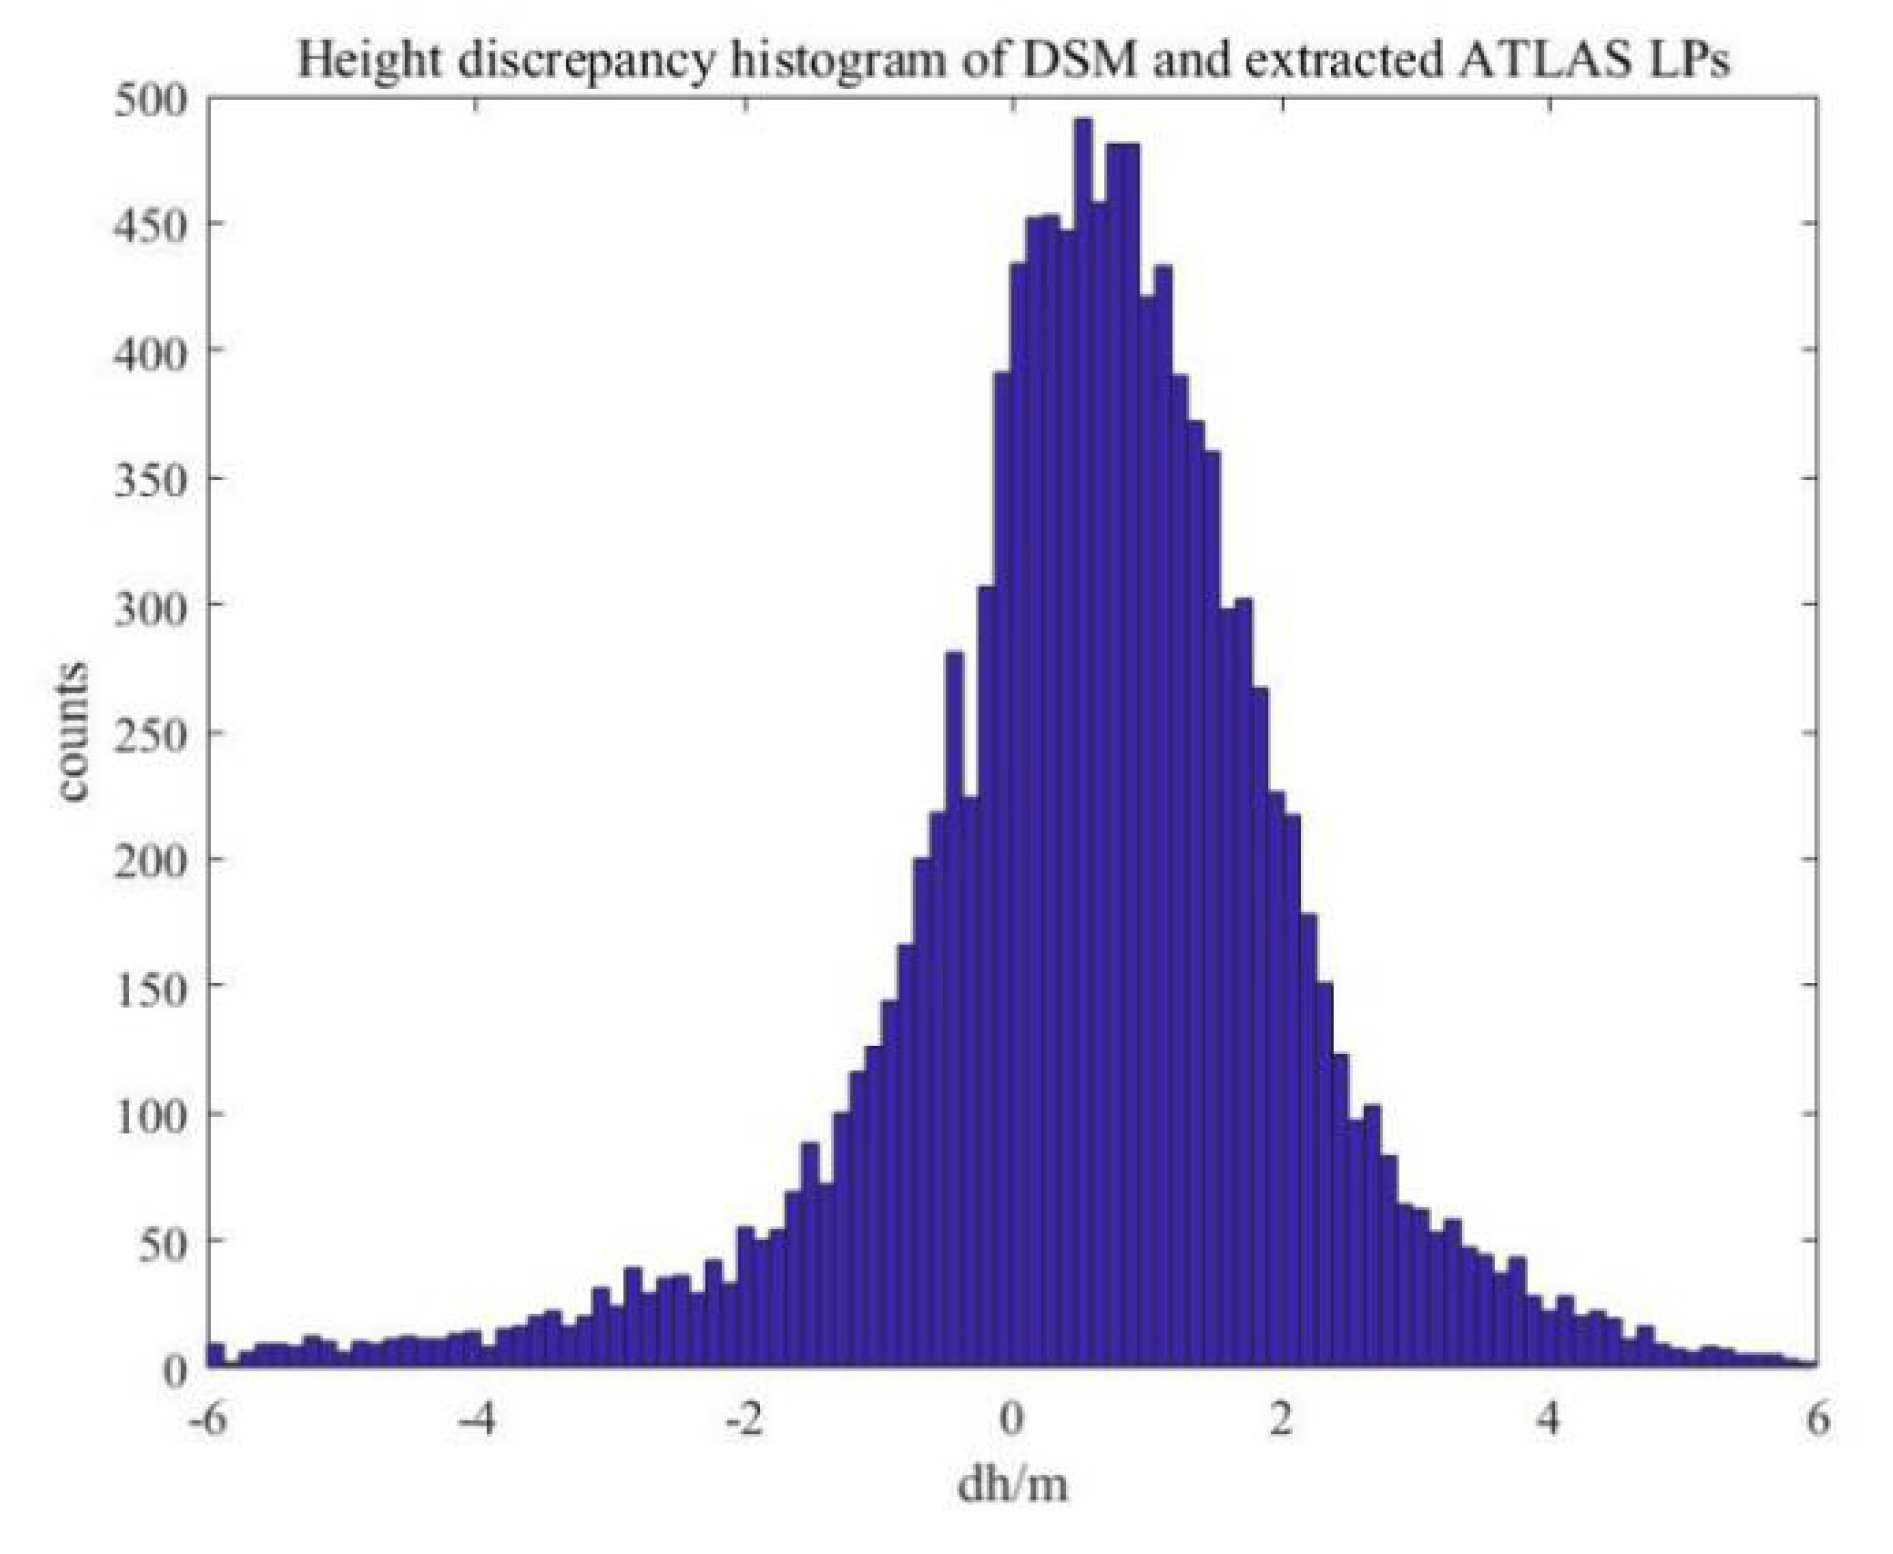
| Total | |dH| < 1.0 | |dH| < 1.5 | |dH| < 3.0 | |dH| < 6.0 | |
|---|---|---|---|---|---|
| Count | 11,784 | 5883 | 7948 | 10,721 | 11,587 |
| Percentage | 100% | 49.9% | 67.4% | 91.0% | 98.3% |
| Average/m | 0.465 | 0.193 | 0.331 | 0.566 | 0.595 |
| Standard deviation/m | 2.029 | 0.521 | 0.724 | 1.136 | 1.530 |
Publisher’s Note: MDPI stays neutral with regard to jurisdictional claims in published maps and institutional affiliations. |
© 2022 by the authors. Licensee MDPI, Basel, Switzerland. This article is an open access article distributed under the terms and conditions of the Creative Commons Attribution (CC BY) license (https://creativecommons.org/licenses/by/4.0/).
Share and Cite
Chen, J.; Tang, X.; Xue, Y.; Li, G.; Zhou, X.; Hu, L.; Zhang, S. Registration and Combined Adjustment for the Laser Altimetry Data and High-Resolution Optical Stereo Images of the GF-7 Satellite. Remote Sens. 2022, 14, 1666. https://doi.org/10.3390/rs14071666
Chen J, Tang X, Xue Y, Li G, Zhou X, Hu L, Zhang S. Registration and Combined Adjustment for the Laser Altimetry Data and High-Resolution Optical Stereo Images of the GF-7 Satellite. Remote Sensing. 2022; 14(7):1666. https://doi.org/10.3390/rs14071666
Chicago/Turabian StyleChen, Jiyi, Xinming Tang, Yucai Xue, Guoyuan Li, Xiaoqing Zhou, Liuru Hu, and Shuaitai Zhang. 2022. "Registration and Combined Adjustment for the Laser Altimetry Data and High-Resolution Optical Stereo Images of the GF-7 Satellite" Remote Sensing 14, no. 7: 1666. https://doi.org/10.3390/rs14071666
APA StyleChen, J., Tang, X., Xue, Y., Li, G., Zhou, X., Hu, L., & Zhang, S. (2022). Registration and Combined Adjustment for the Laser Altimetry Data and High-Resolution Optical Stereo Images of the GF-7 Satellite. Remote Sensing, 14(7), 1666. https://doi.org/10.3390/rs14071666