Article

Using InSAR Time Series to Monitor Surface Fractures and Fissures in the Al-Yutamah Valley, Western Arabia

1
Seismological Laboratory, Division of Geological and Planetary Sciences, California Institute of Technology, Pasadena, CA 91125, USA
2
King Abdulaziz City for Science and Technology, Riyadh 11442, Saudi Arabia
3
Jet Propulsion Laboratory, California Institute of Technology, Pasadena, CA 91109, USA
*
Author to whom correspondence should be addressed.
Remote Sens. 2022, 14(8), 1769; https://doi.org/10.3390/rs14081769
Submission received: 28 February 2022 / Revised: 28 March 2022 / Accepted: 1 April 2022 / Published: 7 April 2022
(This article belongs to the Special Issue Geodetic Observations for Earth System)

Abstract

:
Western Arabia routinely experiences geophysical phenomena that deform the surface of the earth in a variety of ways. These phenomena include earthquakes, volcanic eruptions, sinkholes, and earth fissuring and fracturing. We perform a time-series analysis of interferometric synthetic aperture radar (InSAR) observations derived from the ESA Sentinel-1 radar satellite constellation to map regional surface displacements in western Arabia as a function of time. We rely on InSAR products generated by the JPL-Caltech ARIA project to detect regions with short wavelength anomalies, and then manually reprocess InSAR products at a higher resolution for these regions to maximize spatial and temporal coverage. We post-process InSAR products using MintPy workflows to develop the InSAR time series. We report short wavelength anomalies localized within alluvial valleys across western Arabia and find a 5 cm/year line-of-sight surface displacement within the Al-Yutamah Valley. Part of the observed subsidence is correlated with surface fractures that developed in conjunction with severe rainfall events in regions characterized mainly by alluvial sediments at the surface. Regions of observed subsidence that are not associated with any surface fractures or fissures are correlated with the presence of basalt layers at the surface. Both regions are subject to groundwater exploitation. The observed subsidence is inferred to be driven by groundwater withdrawal perhaps modulated by the presence of a preexisting depositional environment (e.g., paleo-lake deposits) that promotes unconsolidated soil compaction.

Graphical Abstract

1. Introduction

The western Arabian margin (Figure 1A) has experienced a rich history of volcanism during the last 20 Ma [1]. However, these volcanic events are not the only potential geologic hazard that affects this region. Surface fractures and sinkholes within the Arabian margin are also rapidly becoming a challenging hazard. These hazards are frequently linked to surface subsidence. Thus, identifying such regions of subsidence can provide an indication of potential future hazards [2,3,4,5,6]. Recent studies of surface deformation within Arabia investigate surface fissures and fractures, explore their underlying mechanism, and address mitigation of their potential risks [7,8,9,10,11,12,13,14,15,16,17,18,19,20]. These studies used multiple methods, including structural geology, soil analysis, and interferometric synthetic aperture radar (InSAR). Among these approaches, InSAR is becoming one of the most powerful tools that can be used to monitor ground movement over time. This approach relies on determining phase differences in repeat synthetic aperture radar (SAR) images to quantify spatial variations in surface displacement (e.g., [21]). The InSAR phase is a superposition of various signals, including all geophysical contributions to ground displacements and propagation delays accrued in the atmosphere. Thus, we must pay particular attention to separating the various contributions to the measured phase change in order to isolate the geophysical signal of interest.
In this work, we apply an InSAR time series analysis of Sentinel-1 data to cover wide areas (250 × 1000 km) of western Arabia at a 90 m spatial resolution and with short revisit times (6–12 days on average). This regional survey allows us to detect the short wavelength anomalies that correspond to local ongoing deformation within the Arabian margin. Then, we reprocess the Sentinel-1 data at a much higher (15 m) spatial resolution for a limited region where we have identified short wavelength deformation anomalies. We use this local analysis to optimize spatial and temporal resolution for the Al-Yutamah Valley in comparison with our regional survey, to investigate domains of earth fissuring and fracturing, and to monitor their activities over time. We develop time series, velocity maps, and fracture event spanning maps. Here, we present both the regional and local analyses, correlate the observed deformation fields with surface fractures and fissures, discuss the possible underlying mechanisms, and forecast future hazards.

Study Area

Within western Arabia lies an exposed Neoproterozoic block (Figure 1A) known as the Arabian Shield, with a crystalline Precambrian basement, Cenozoic alkalic volcanic fields (Harrat), and small sedimentary basins and grabens (e.g., [22]). The Al-Yutamah Valley (Figure 1B) is located in western Arabia (23.8852 N, 39.7524 E) within the Arabian shield, in the vicinity of Harrat Rashid [23] or Al-Madinah [24]; which is the northern part of the Harrat Rahat volcanic field, about 100 km from the Red Sea coast. The study area (Figure 1B) is dominated by basaltic lava flows of the middle–Pleistocene age that bound the area from the eastern and the northern sides. Precambrian basement is exposed in the western and southern regions, while surficial deposits (Alluvium—Quaternary) present as mud/loam flat around the periphery of volcanic rocks [25]. The Al-Yutamah Valley was formed by E–W Cenozoic dextral strike slip faulting (Figure 1B) [26], which has been suggested to be associated with opening of the Red Sea [27]. The other major structural features of the area generally trend in NW–SE direction, consistent with the regional structural direction and believed to be part of the Najd strike-slip fault system (NFS) [26]. However, the pattern of small-scale faulting changes strike in the Al-Yutamah basin to a N–S direction, as seen in the field within the Quaternary deposits [8].

2. Methodology

2.1. Geologic Map

We have considered various geological maps for the study area from the Saudi Geological Survey [30,31] and the United State Geological Survey [25,32]. While the most recent detailed map published by USGS [25] has the highest resolution boundary between the geological units, our area of interest has not been completely mapped (about 30% of the area has been covered). Thus, these resources were supplemented with our field observations and high-resolution satellite images (Figure 1C) to create a complete map for the study area (Figure 1B). The geological map of the Al-Yutamah contains three main units (Precambrian shield, Pleistocene basalts, and Quaternary deposits) with the basalts unit further subdivided into three units based on the recent observation and classification of [25].

2.2. Weather Model and Ancillary Weather Data

To correct the InSAR time series for tropospheric delay effects, we rely on the weather models provided by Copernicus Climate Change Service (ERA5) [33]. The ERA5 is the fifth generation of the European Centre for Medium Range Weather Forecasting (ECMWF) [34], an hourly analysis for the global climate and weather. This model has been regridded on a regular lat–lon grid of 0.25 degrees. We also compare our InSAR time series and rainfall in the Al-Yutamah Valley (See Section 3.2.1). The rainfall data are taken from World Weather Online (https://www.worldweatheronline.com/aboutus.aspx; accessed on 20 February 2022, last accessed on 31 March 2022).

2.3. InSAR Data and Method

We use radar imagery acquired by the Copernicus Program Sentinel-1A and 1B (track 14) synthetic aperture radar (SAR) satellites developed and operated by the European Space Agency. We consider InSAR images at both regional and local scales. We start with a regional scale (100 s of km) to detect short wavelength anomalies that correspond to local ongoing deformation and consider local scales (10 s of km) to maximize spatial and temporal resolution for local regions of interest. All our InSAR processing relies on the open-source InSAR Scientific Computing Environment (ISCE; [35]) software.
At the regional scale, we use the so-called “standard product” produced by the Advanced Rapid Imaging and Analysis (ARIA) system [36]. The ARIA system uses algorithms from ISCE to provide an operational archive of standard Sentinel-1 Geocoded UNWrapped interferogram (GUNW) products, enabling rapid ingestion into post-processing algorithms. These InSAR-derived surface displacement products are reduced from the original resolution down to a 90 m spatial resolution to increase the signal-to-noise ratio. Interferometric pairs are generated between the nearest two acquisitions, leading to temporal baselines of 12 and 24 days. We also produce additional annual interferogram pairs spanning October and May of each year. We use the ARIA-tools open-source package [37] to download and stitch 5102 GUNW products into 252 continuous interferograms from 133 acquisitions spanning the nearly 5-and-a-half-year period between February 2016 and July 2021. The region covered extends from 20N to 28N and 37E to 41E. All our time series are referenced to the date 5 February 2018. We consider the root-mean-square (RMS) residual phase as a measure for our data quality (Figure S1). The original number of acquisitions is 183, where we removed 50 acquisitions using a 24 mm residual threshold. We evaluate the quality of our data by calculating the history of interferometric coherence (Figure S2, left panel). The average coherence is high, with values generally above 0.85. We developed a redundant network for western Arabia (Figure S2, right panel) with each acquisition connected to an average of three other acquisitions.
We applied four main corrections to the InSAR data:
  • Model-based removal of the deformation signal caused by the solid earth tides (SET) [38,39] (Figure S3). There are both significant spatial and temporal variations in the impacts of SET.
  • Model-based removal of radar propagation effects associated with temporal variability in the quasi-stratified component of the troposphere [40].
  • Estimation and removal of error associated with the inaccurate digital elevation models (DEMs), as the sensitivity to this error is proportional to the perpendicular component of the interferometric spatial baseline (so-called Bperp) and is easily estimated in the time series analysis [41].
  • Empirical removal of residual long wavelength (100-km-scale) apparent deformation signals [42]. This removal is recommended for short spatial wavelength deformation signals, which estimate and then remove linear ramps from the displacement time-series at each acquisition on the reliable pixels. In contrast, for regional tectonic deformation signals, this approach is not recommended.
We use the ARIA tools package suite to prepare interferograms for time series analysis in the Miami INsar Time series software in Python language (MintPy) [42]. This workflow has been successfully demonstrated for mapping ground deformation in subsidence and tectonic active regions along the Eastern US [37], US west coast [43], and the Afar region of Ethiopia [44].
We also generate a higher-resolution InSAR dataset, with ~16 m spatial resolution, to further investigate the local deformation around the Al-Yutamah Valley identified from the ARIA products. We use Sentinel-1 ascending track 14 data acquired in Interferometric Wide (IW) mode from 6 October 2014 to 19 July 2021 (202 acquisitions in total). We use the stack processor [45] within the ISCE software [35] for interferogram processing. The stack of SAR images is coregistered using pure geometry with precise orbits and a digital elevation model (DEM). We remove the topographic phase using the SRTM DEM (SRTMGL1, 1 arc second with voids-filled, ~30 m) [46]. We pair each SAR image with its nearest 3 neighboring images in time domain to form 596 small temporal baseline interferograms, multi-look each interferogram by 3 in range, and filter the phase using the Goldstein filter with a strength of 0.2. We excluded 16 interferograms due to low coherence. The interferograms are phase unwrapped using the minimum cost flow method [47]. Increasing the spatial resolution comes at a cost of lowering coherence. We fit a simple temporal model that includes linear and periodic (annual and semi-annual) terms, and consider RMS residual phase in mm as a measure for our data quality (Figure S10). The original number of acquisitions is 264. We identified and removed 62 particularly noisy acquisitions using a 5 mm residual threshold. The coherence history (Figure S11, left panel) of our region shows a lower coherence in comparison with our regional scale results. This decrease is caused by increasing spatial resolution. Nevertheless, the temporal coherence of the Al-Yutumah valley is high (S12), indicating minimum unwrapping error. Moreover, as phase unwrapping error can be detected using the number of interferogram triplets with non-zero integer ambiguity of the closure phase [42], our results (S13) show two triplet integer peaks suggesting 2 out of 580 interferograms have unwrapping errors in the coherent region, which is a minimal amount, and should has negligible effect on our time series estimation. We use the MintPy software [42] to form the InSAR time series from the stack of interferograms using the small baseline approach [48]. We exclude low-coherence interferograms using the coherence-based network modification with a threshold of 0.7. We remove the stratified tropospheric delay using the ERA5 weather reanalysis dataset [33] with the PyAPS software [40], the topographic residual caused by the DEM error [41], and a linear phase ramp for each acquisition to remove the long spatial wavelength component. We use the temporal coherence [49] to eliminate the unreliable pixels with a threshold of 0.7. The noisy acquisitions are identified based on the residual phase root mean squares with a predefined cutoff value (3 times the median absolute deviations) and excluded during the estimation of topographic residual and average velocity [42].

2.4. Ground Truth Data

We conducted multiple field trips in 2021 and 2022 to the Al-Yutamah Valley to map the developed fractures and correlate them with observed InSAR subsidence. We surveyed the fractures that developed in 2018 based on local witnesses and satellite images that were taken by the Worldview 2.0 optical satellite five months after the fracture event. We surveyed the important infrastructure that intersects with our observed InSAR subsidence and visited a couple of sites damaged by the developing fractures.

3. Results

3.1. Regional Analysis of Western Arabia

We discuss here the impact of each of the corrections we considered for the InSAR time series. First, we corrected our phase time series for solid earth tides by removing the calculated solid earth tide displacement in the LOS from our observation. The resultant map (Figure S4) shows regional long wavelength anomalies as the displacement increases gradually westward. However, short wavelength anomalies appear within western Arabia, distributed away from the Red Sea coast, within the plate interior. Second, we remove the tropospheric phase residual, and the resultant displacement map of this correction shows the observed displacement field corrected for the tropospheric component (Figure S5). Comparing this displacement field with the displacement field corrected for solid earth tides (Figure S4) suggests minor changes, as the long wavelength anomalies still sweep across western Arabia. Third, removing the delay corresponding to DEM error resulted in a displacement field (Figure S6) that shows very minor effects on the observed regional long wavelength signal.
A long wavelength phase residual still exists, which may be caused by ionosphere effects, or inaccuracies in the assumed orbits. We remove this long wavelength signal empirically by fitting and removing a bilinear ramp from the phase [42]. We also estimate annual (Figure S7) and semi-annual (Figure S8) components from our displacement time series. Our annual and semi-annual magnitude maps show potential long wavelength signals between latitudes 22N and 26N. These signals are spatially correlated with the observed phase residual magnitude transition from east to west. These observed signals are not validated nor well understood and are thus simply removed from our velocity since we are primarily concerned with short length scale displacements.
The resultant velocity map (Figure 2A), which excludes the annual and semi-annual signals, shows long wavelength velocity variations with small magnitudes. On the other hand, this velocity map also shows many prominent short wavelength velocity variations with larger magnitudes. The uncertainty of our results increases proportionally with distance away from the chosen spatial reference point as shown in the standard deviation of our velocity map (Figure S9). We show three examples of observed subsidence within western Arabia, the Alyutamah, Dhaa, and Shajwah Valleys (Figure 2B–D respectively). The observed subsidence within all the reported examples exceeds 2 cm/y, which is much larger than the noise threshold (Figure S9). Our focus in this paper is on the Al-Yutamah Valley (Figure 2B). For this region, we manually reprocess the InSAR data to increase the resolution and enhance the spatial and temporal coverage.

3.2. Al-Yutamah Valley
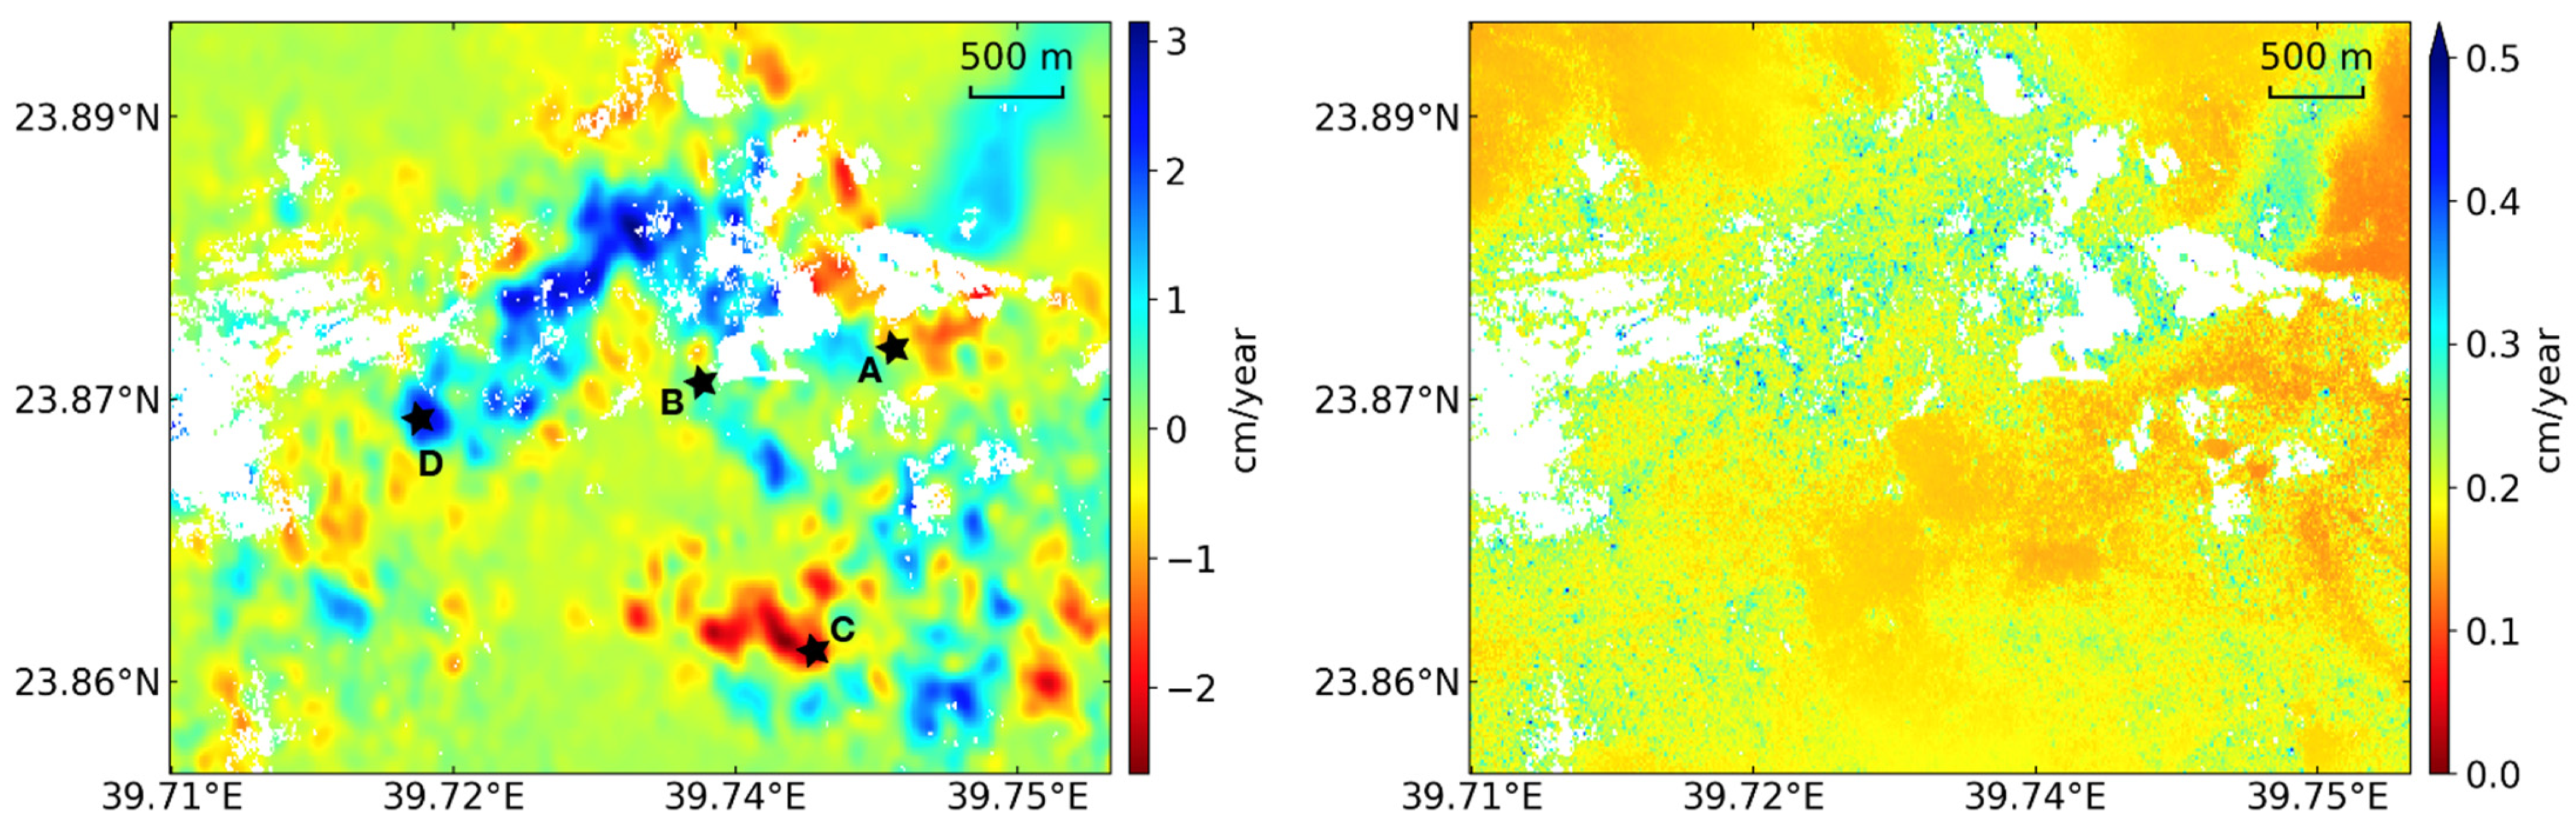
3.2.1. Velocity Map

We describe sustained subsidence in the Al-Yutamah Valley (Figure 2B) that has been observed using the regional, low resolution InSAR time series. We use 580 interferograms to develop the displacement time series for the Al-Yutamah Valley. Since we are working at a local scale, we have corrected our phase time series for troposphere and DEM error only. The resultant displacement time series has been used to estimate the annual and semi-annual signals, which are in our case lower than 0.4 cm magnitude. We use a linear temporal model to produce the velocity map of our area. The resultant velocity map (Figure 3, left panel) shows similar subsidence to what we already observed with our previous analysis (Figure 2B), but with much higher resolution and larger magnitudes. The left panel of Figure 3 shows the subsidence in our region, where we mask the lower temporal coherence domains as white. We present the displacement time series within the middle of the subsidence (Figure 3, right panel), which shows significant accumulated linear subsidence with 40 cm over the last seven years. A few minor offsets appear in the displacement time series, they can be addressed by removing the linear trend (analysis to follow).

3.2.2. Fractures

We observed two dominant temporal behaviors in our displacement time series, the nearly constant accumulation of subsidence and discrete offsets that occurred on November 2018. We describe these two components in more detail below. We visualize the discrete offset with our high-resolution dataset by fitting a step function at the beginning of November 2018. The resultant event spanning map (Figure 4, left panel) has been spatially smoothed using a Gaussian filter (half-width 3.0 pixels). We find that both uplift and subsidence occurred within a week, with a peak amplitude of 3 cm, which is much larger than the calculated error (Figure 4, right panel).
We describe four local regions (Figure 5A–D) and correlate them with rainfall accumulations. The time series presented in Figure 5A–D exhibits strong correlation with the rainfall events which occurred during November 2018. Beside each time series, we present the corresponding image that taken in April 2019 by the Worldview 2.0 optical satellite, which is four months after the fracture development/reactivation event. We removed the linear component (detrended) out of our time series in Figure 5A,B,D, while C has no prior linear subsidence. We validated our InSAR time series with field observations.
-
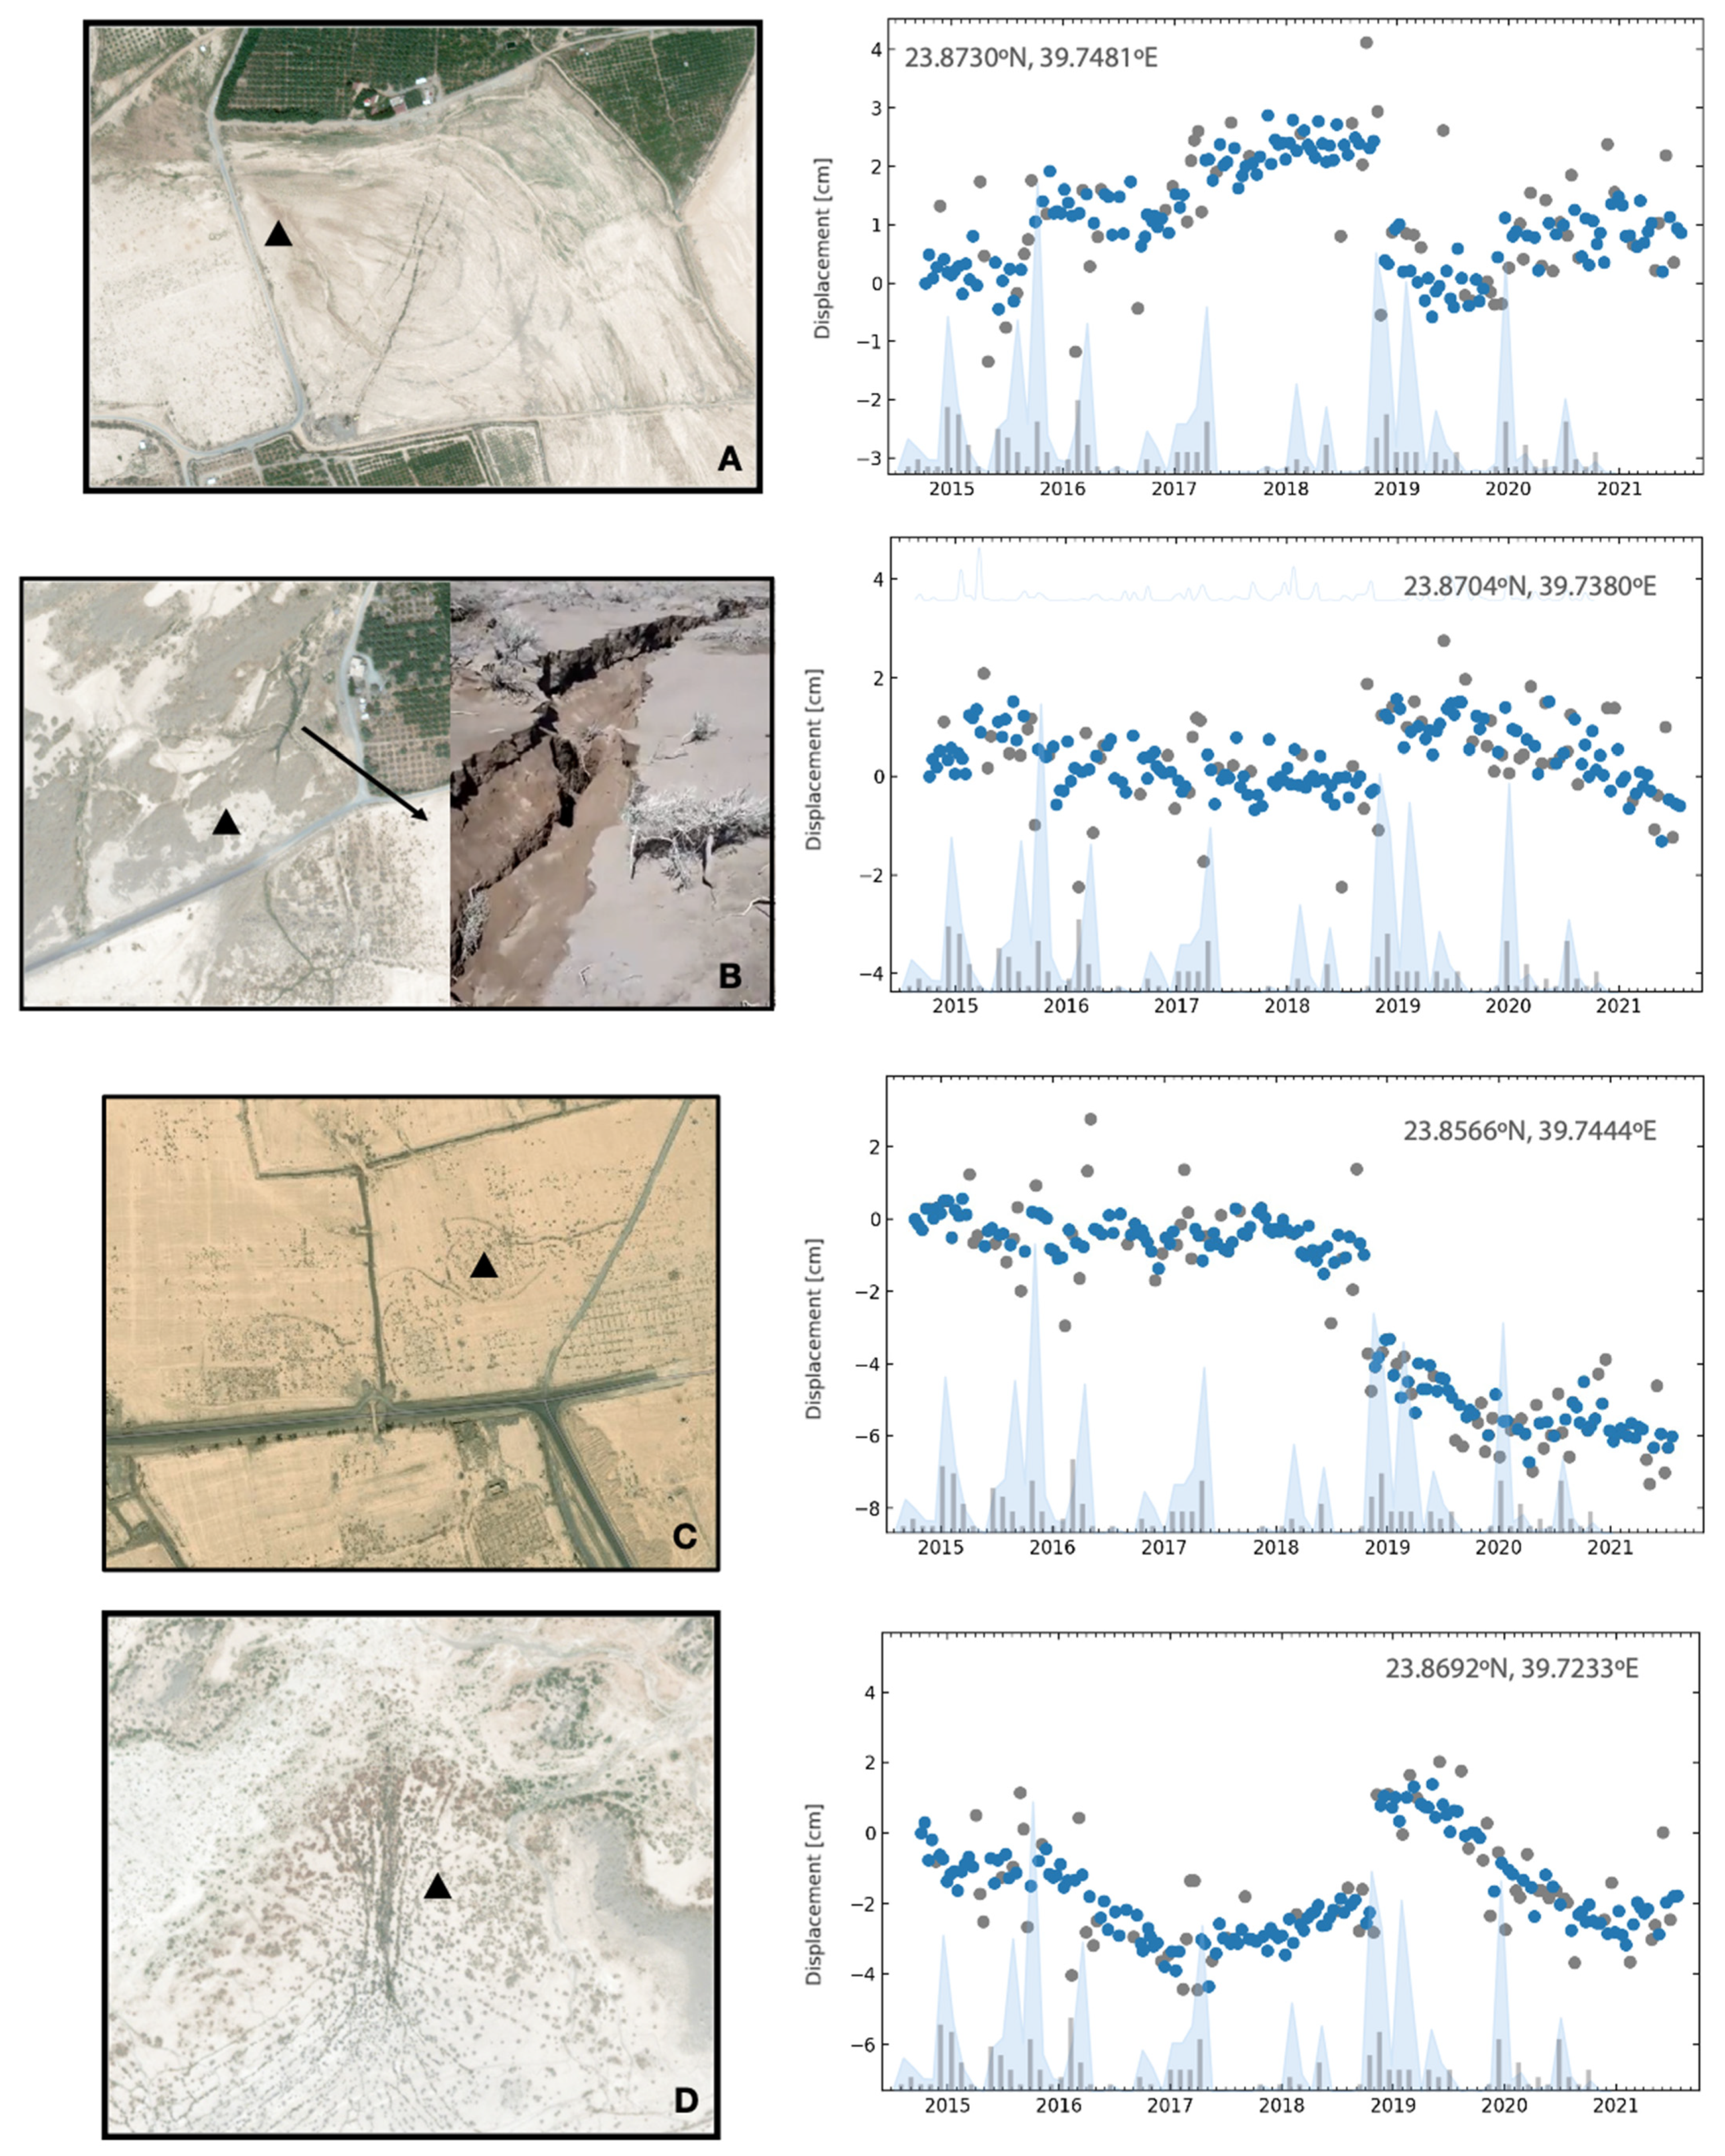
(Figure 5A) Subsidence within the Al-Yutamah Valley is associated with distinct surface fractures. In the right panel, we show the displacement time series for the location indicated by the black triangle in the upper left map to better visualize these offsets. The time series shows accumulated subsidence over the last seven years, with multiple offsets, one of which occurred during November 2018 associated with the fracture that can be seen in the optical image (Figure 5A).
-
(Figure 5B) The associated displacement time series (at the location indicated by the black triangle) has multiple temporal offsets. In the left panel is an image which shows the fracture in green, as it accommodated large volumes of rain and became a suitable environment conducive to plant growth. In the right side of the left panel is a picture taken by one local resident of the fracture zone upon its initiation. The picture exemplifies the size of the fracture and the potential hazard posed by such features. This region subjected to subsidence, albeit at a lower rate than the region presented in Figure 5A, also developed surface fractures in response to the severe rain season in November 2018.
-
(Figure 5C) A region outside of the original subsidence area showing little or no subsidence activities prior to the fracture development that occurred in November 2018. In the left image is the region of subsidence, which revealed a potential pattern which appeared in the form of fractures that connected in circles, which may lead into developing future sinkholes.
-
(Figure 5D) A region experiencing a long period displacement variation with a unique pattern of surface displacements that may reflect subsurface processes. The observed pattern seems to reflect a long-term subsurface process within the valley.

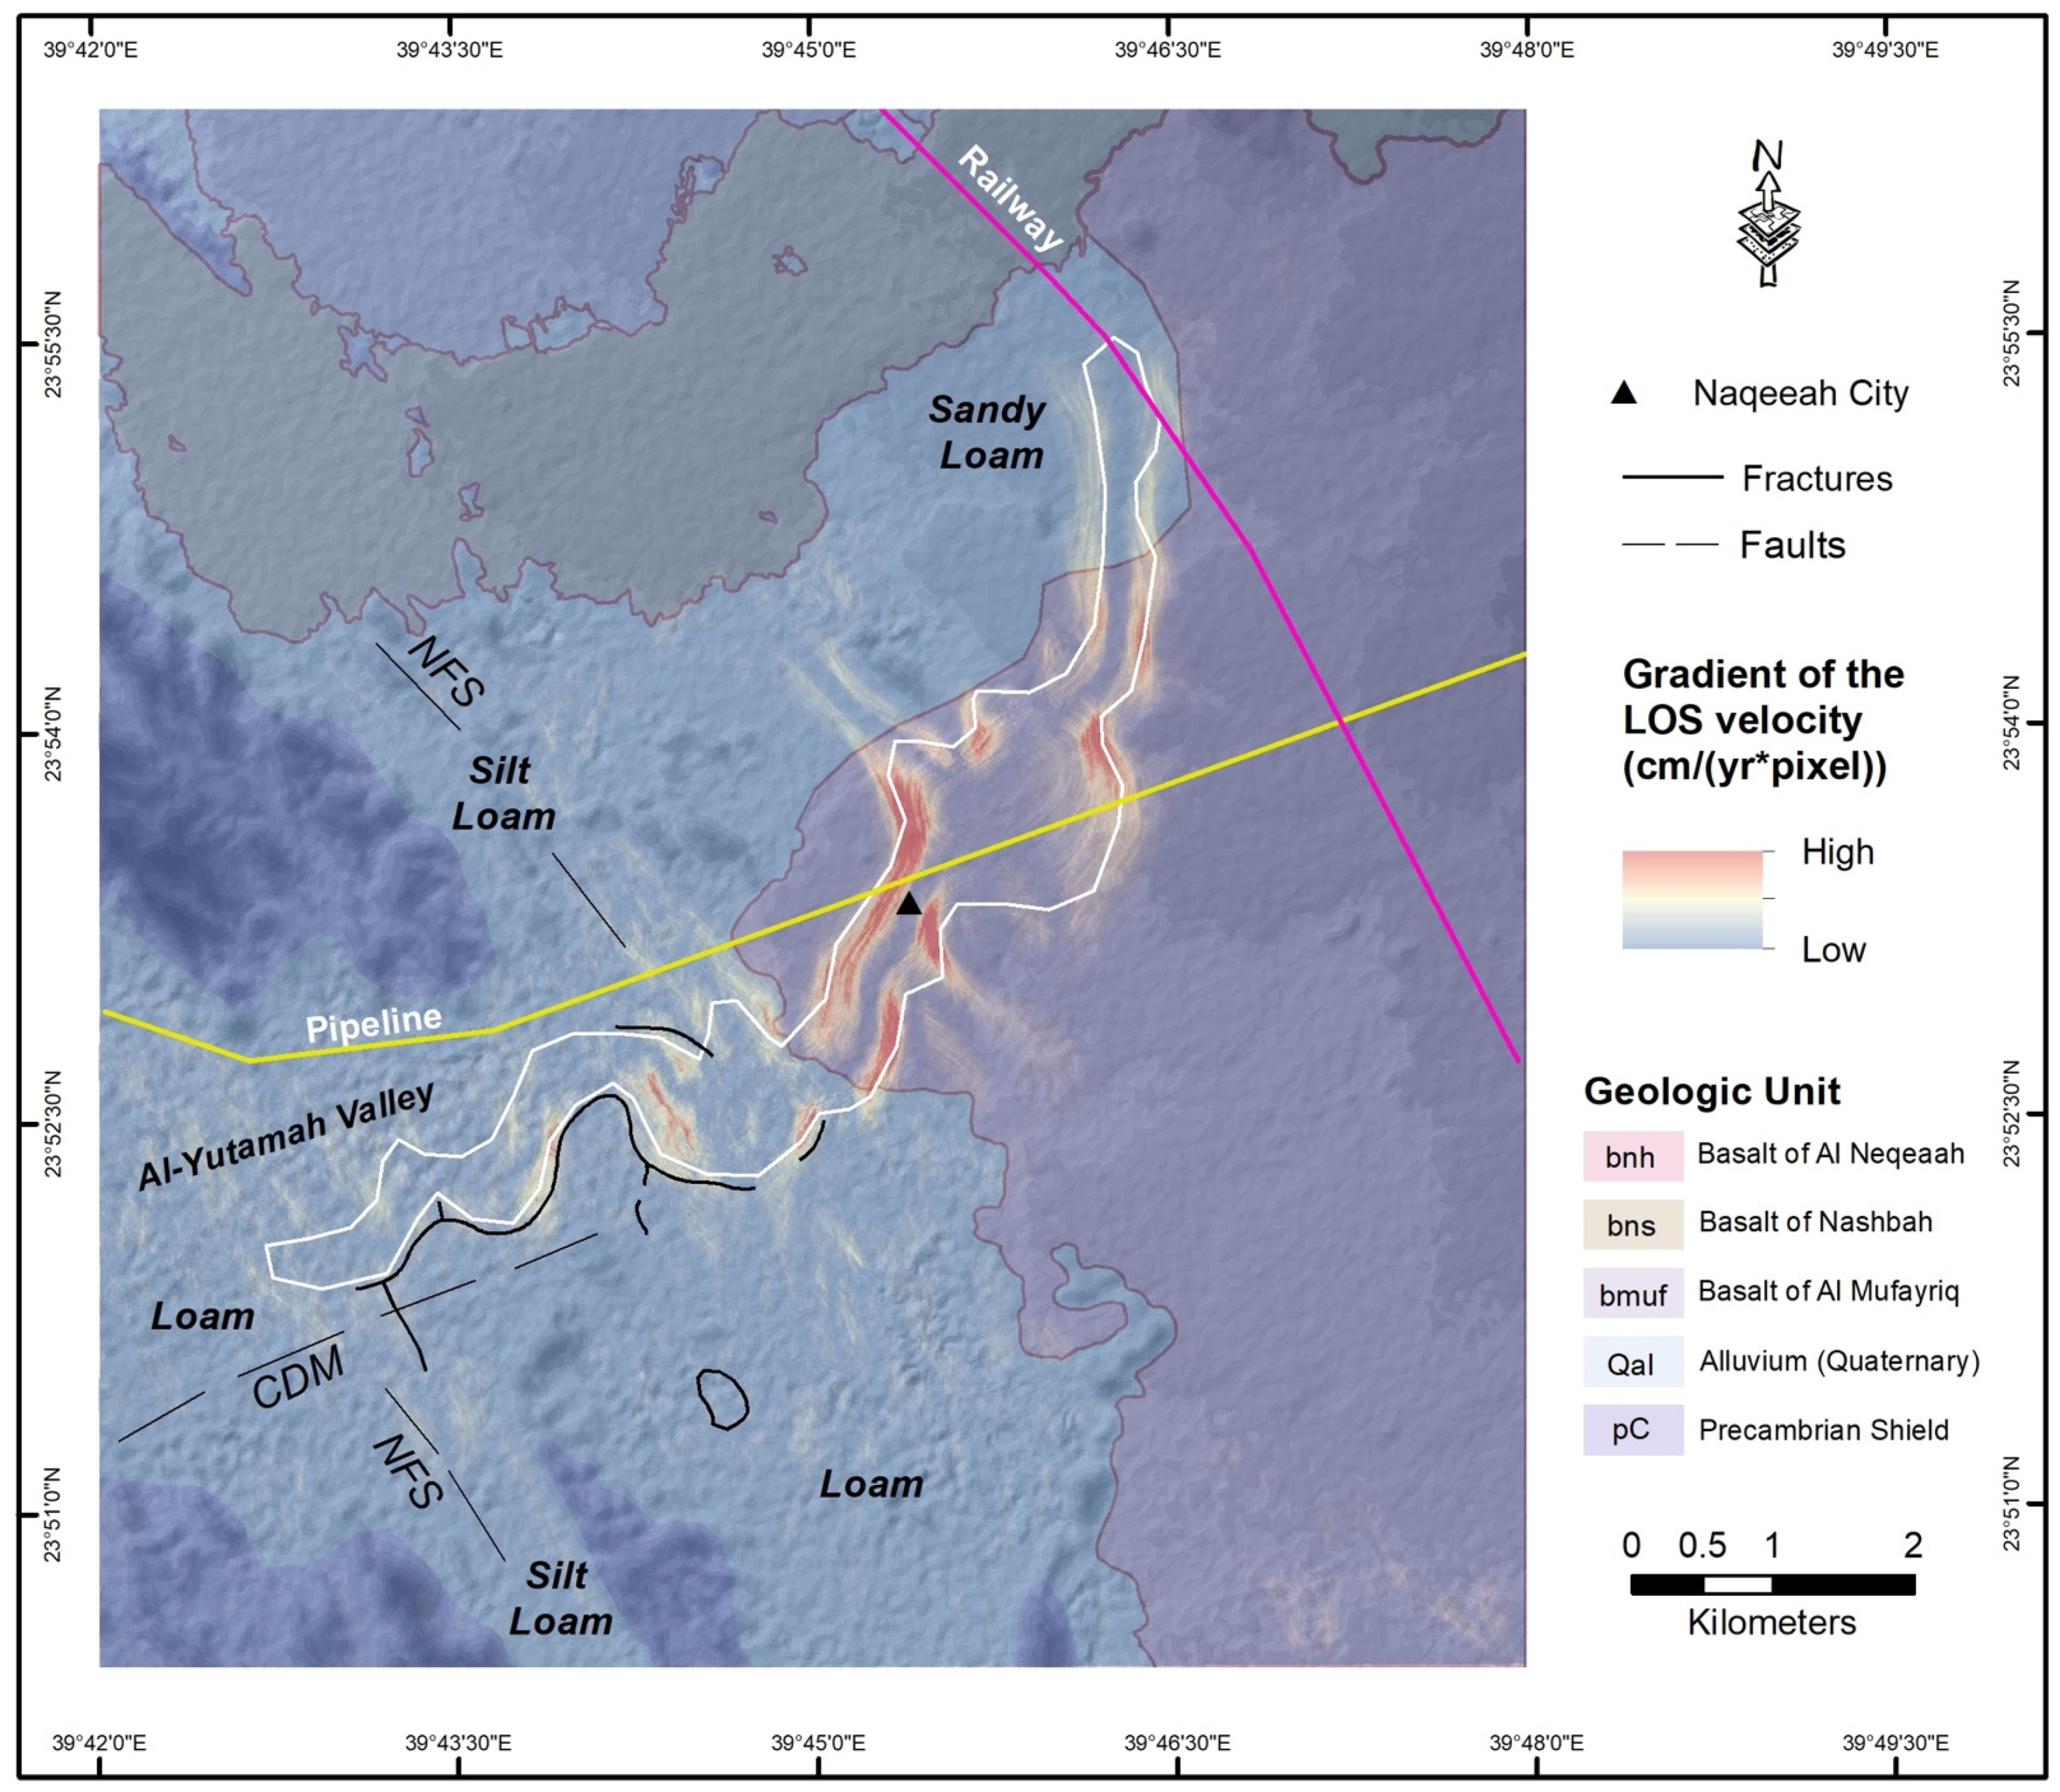
3.2.3. Spatial Gradient of the LOS Displacement Field

We calculate the first spatial derivative of the observed InSAR LOS velocity field (Figure 6) to quantify the distribution of the local deformation pattern due to the accumulative subsidence. We produce this map by computing the gradient amplitude as independent from the LOS direction. The resulting map shows high gradients along the edges of the subsidence area. We present three cross-sections, the first (Figure 6A-A’) shows the gradient amplitude of the LOS velocity field along the Haramain High Speed Railway that connects Jeddah to Madinah. The second transect (Figure 6B-B’) shows the gradient amplitude of the LOS velocity field along the national east–west pipeline that connects Beqaiq to Yanbu. The third transect (Figure 6C-C’) shows apparent gradient amplitude of the LOS velocity field within the valley, where the cumulative apparent gradient amplitude maximum value reaches 15 cm for the period between 2014 and 2021. The zones of high gradient are highly correlated with reported surface fractures (Figure 5). In contrast, although the apparent gradient amplitude of the LOS velocity field exhibits similar magnitude in the adjacent region (along the pipeline (Figure 6B-B’ transect)), there is currently no evidence for surface fractures.

4. Discussion

Using InSAR time series and ground truth observations, we investigated the occurrence and recent development of local fractures within the Al-Yutamah Valley, western Arabia. These hazards are associated with land deformation/subsidence as mapped using InSAR and identify potential areas at risk. We report three main observations: continuous subsidence since 2014 (Figure 3 right panel), development of large surface fracture events (Figure 5A–D), and long period oscillations in surface displacements (Figure 5D).
The long-term linear subsidence pattern (Figure 3, right panel) within the Al-Yutamah Valley suggests a long-lived subsurface process. The observed subsidence distribution prompts many questions about the nature of its causes. The most obvious of which is the role of groundwater exploitation that may also drive compaction processes within a subsurface aquifer [8] (Figure 3, right panel). Multiple studies of different examples around the world [16,50,51,52] show a strong relationship between groundwater exploitation and surface subsidence. Although the subsidence area appeared in the alluvial sediments and basalt flow, the fractures are observed only in the alluvial sediments (Figure 7). The observed pattern (Figure 5D) displays a sinkhole-like shape within the basalt area linked with a long meandering region of subsidence. Prior studies have attributed this subsidence to withdrawal of groundwater [7,8] based on an analysis collected of soil samples from the Al-Yutamah Valley. In the Najran Valley [12] geophysical surveys were conducted across observed surface fissures and they were attributed to water pumping and consequent continuous decline in groundwater, which led to the development of subsurface topography characterized with steep slopes (buried cliff) that are correlated with the observed surface fissures.
Reference [8] suggested another possible process based on their soil analysis for surface fractures in the Al-Yutamah Valley as developed due to the hydrocompaction of soil after severe rainy seasons. Though the local accuracy of rainfall accumulations could be missing due to the lack of weather stations in our region as the rainfall data are extracted from gridded dataset. We find that severe rainfall events are correlated with the observed offsets in our displacement time series. One of these events occurred in November of 2018 (Figure 4, left panel). During that event, the displacement field shows uplift along the regions that results in long term subsidence and subsidence along its boundaries. Furthermore, all the developed fractures are located along the boundaries of the original subsidence (Figure 7). Despite the potential effect of rainfall, part of the subsidence (Figure 5C) does not show any correlation with the repeated periods of severe rainfall, suggesting the possibility subsurface cavities may develop because of excessive withdrawal of groundwater from a subsurface aquifer. At the same time, we observed another pattern downstream at the western end of the subsidence region (Figure 5D) that reveals a long-term uplift/subsidence cycle, which may suggest aquifer related processes—but at this time, we cannot explain the actual process.
An alternative hypothesis relates the subsidence to subsurface rheological changes that promote compaction due to groundwater exploitation, leading to the development of fracture zones and sinkholes [4,6]. This hypothesis is motivated by the fact that the subsidence region has sharp boundaries that suggest sharp contrasts between subsurface regions with different rheological behavior, perhaps a consequence of a paleo-lake/paleo-river depositional environment; this implies that the subsidence region is characterized by mud deposits, which is different from the surrounding sandy deposits. Such a process has been reported elsewhere [53,54,55], particularly within the regions that are subjected to groundwater exploitation.
Regardless of the cause of Al-Yutamah subsidence, the area (Figure 7) is clearly subject to natural hazards that can cause severe damage to the residents and/or the major infrastructures such as the national east–west pipeline and the Haramain High Speed Railway. The cumulative gradient amplitude of the LOS velocity field that is observed in the Valley, where most of the fractures were reported, is similar to what is observed (Figure 7) in the vicinity of the national pipeline. That fractures have not yet manifested themselves at the surface does not mean that we should not expect them in the future if the subsidence continues. In fact, given the accumulation of strain, we may expect larger surface fractures or fissures than what we have already observed in the adjacent valley.

5. Conclusions

We mapped the regional and local velocity fields within western Arabia using a time-series analysis of InSAR observations derived from the ESA Sentinel-1 radar satellite constellation. We used InSAR products generated by the JPL-Caltech ARIA project for regional analysis, and we manually reprocessed InSAR products with 580 interferograms at a higher resolution for local analysis to maximize spatial and temporal coverage. We reported three regions where we observed continued subsidence within western Arabia (Al-Yutumah, Shajwah, and Dhaa valleys) (Figure 2). We focused on the Al-Yutumah valley where multiple fissures and fractures were reported. We applied multiple corrections on the regional and local scales. For the regional, we removed the delay within our time series due solid earth tides, troposphere, and DEM error. Additional long wavelength removal applied to highlight the short wavelength signals in our regional velocity map. For the local scale, we removed the delay corresponding to the troposphere and DEM error only to preserve any potential signal.
We observed continued subsidence within the Al-Yutumah valley with more than 40 cm accumulated displacement (Figure 3). We mapped the spanning event in November 2018 to show the spatial distribution of observed displacement in consequence to rainfall event (Figure 4). We presented the time series for the regions where fissures and fractures were observed. We manifested the strong correlation between the main rainfall event in November 2018 and the observed offset in our time series (Figure 5). We calculated the spatial gradient amplitude of the observed LOS InSAR velocity field to highlight local deformation patterns (Figure 6). The spatial gradient amplitude reaches its maximum value along the boundaries of the subsidence, which shows strong correlation with the distribution of fractures and fissures in the Al-Yutumah valley. We plotted the spatial gradient along three main cross-sections, first along the railway, second along the national pipeline, and third across the valley where we observed surface fissures and fractures (Figure 6). We manifested that the magnitude of spatial gradient within the valley is close to the magnitude along the pipeline, suggesting potential fractures and risk.

Supplementary Materials

The following supporting information can be downloaded at: https://www.mdpi.com/article/10.3390/rs14081769/s1, Figure S1: Regional phase residuals; Figure S2: Regional coherence history and interferogram network; Figure S3: Regional spatial and temporal solid earth tides; Figure S4: Velocity field of western Arabia after removing solid earth tides; Figure S5: Velocity field of western Arabia after removing delay due to troposphere; Figure S6: Velocity field of western Arabia after removing effect of DEM error; Figure S7: Spatial distribution of annual periodic signal; Figure S8: Spatial distribution of error; Figure S9: Spatial distribution of error; Figure S10: Local phase residuals; Figure S11: Local coherence history and interferogram network.

Author Contributions

Conceptualization, T.A. and M.S.; Methodology, Z.Y., D.B., K.A.A. and T.A.; Software, Z.Y., D.B. and T.A.; Validation, T.A., M.S. and K.A.A.; Formal analysis, T.A., Z.Y., D.B. and Y.-K.L.; Data curation, Z.Y. and D.B.; Writing—original draft preparation, T.A.; Writing—review and editing, M.S., Z.Y., K.A.A., D.B., Y.-K.L. and T.A.; Visualization, T.A. and Z.Y.; Supervision, M.S.; Project administration, T.A. All authors have read and agreed to the published version of the manuscript.

Funding

This research received no external funding.

Institutional Review Board Statement

Not applicable.

Informed Consent Statement

Not applicable.

Data Availability Statement

Not applicable.

Acknowledgments

This research was supported by the King Abdulaziz City for Science and Technology (KACST) and carried out at the California Institute of Technology, Jet Propulsion Laboratory, and KACST. We thank the reviewers for their thoughtful and constructive feedback.

Conflicts of Interest

The authors declare no conflict of interest.

References

  1. Stelten, M.E.; Downs, D.T.; Champion, D.E.; Dietterich, H.R.; Calvert, A.T.; Sisson, T.W.; Mahood, G.A.; Zahran, H. The timing and compositional evolution of volcanism within northern Harrat Rahat, Kingdom of Saudi Arabia. GSA Bull. 2020, 132, 1381–1403. [Google Scholar] [CrossRef]
  2. Chen, F.; Lin, H.; Zhang, Y.; Lu, Z. Ground subsidence geo-hazards induced by rapid urbanization: Implications from InSAR observation and geological analysis. Nat. Hazards Earth Syst. Sci. 2012, 12, 935–942. [Google Scholar] [CrossRef] [Green Version]
  3. Cigna, F.; Osmanoğlu, B.; Cabral-Cano, E.; Dixon, T.H.; Ávila-Olivera, J.A.; Garduño-Monroy, V.H.; DeMets, C.; Wdowinski, S. Monitoring land subsidence and its induced geological hazard with Synthetic Aperture Radar Interferometry: A case study in Morelia, Mexico. Remote Sens. Environ. 2012, 117, 146–161. [Google Scholar] [CrossRef]
  4. Intrieri, E.; Gigli, G.; Nocentini, M.; Lombardi, L.; Mugnai, F.; Fidolini, F.; Casagli, N. Sinkhole monitoring and early warning: An experimental and successful GB-InSAR application. Geomorphology 2015, 241, 304–314. [Google Scholar] [CrossRef] [Green Version]
  5. Cigna, F.; Tapete, D. Present-day land subsidence rates, surface faulting hazard and risk in Mexico City with 2014–2020 Sentinel-1 IW InSAR. Remote Sens. Environ. 2021, 253, 112–161. [Google Scholar] [CrossRef]
  6. Orhan, O.; Oliver-Cabrera, T.; Wdowinski, S.; Yalvac, S.; Yakar, M. Land subsidence and its relations with sinkhole activity in Karapınar region, Turkey: A multi-sensor InSAR time series study. Sensors 2021, 21, 774. [Google Scholar] [CrossRef]
  7. Amin, A.; Bankher, K. Causes of land subsidence in the Kingdom of Saudi Arabia. Nat. Hazards 1997, 16, 57–63. [Google Scholar] [CrossRef]
  8. Bankher, K.A.; Al-Harthi, A.A. Earth fissuring and land subsidence in western Saudi Arabia. Nat. Hazards 1999, 20, 21–42. [Google Scholar] [CrossRef]
  9. Pallister, J.S.; McCausland, W.A.; Jónsson, S.; Lu, Z.; Zahran, H.M.; Hadidy, S.E.; Aburukbah, A.; Stewart, I.C.; Lundgren, P.R.; White, R.A.; et al. Broad accommodation of rift-related extension recorded by dyke intrusion in Saudi Arabia. Nat. Geosci. 2010, 3, 705–712. [Google Scholar] [CrossRef]
  10. Youssef, A.M.; Maerz, N.H. Overview of some geological hazards in the Saudi Arabia. Environ. Earth Sci. 2013, 70, 3115–3130. [Google Scholar] [CrossRef]
  11. Al Fouzan, F.; Dafalla, M.A. Study of cracks and fissures phenomenon in Central Saudi Arabia by applying geotechnical and geophysical techniques. Arab. J. Geosci. 2014, 7, 1157–1164. [Google Scholar] [CrossRef]
  12. Youssef, A.M.; Sabtan, A.A.; Maerz, N.H.; Zabramawi, Y.A. Earth fissures in wadi Najran, kingdom of Saudi Arabia. Nat. Hazards 2014, 71, 2013–2027. [Google Scholar] [CrossRef]
  13. Xu, W.; Jónsson, S.; Corbi, F.; Rivalta, E. Graben formation and dike arrest during the 2009 Harrat Lunayyir dike intrusion in Saudi Arabia: Insights from InSAR, stress calculations and analog experiments. J. Geophys. Res. Solid Earth 2016, 121, 2837–2851. [Google Scholar] [CrossRef] [Green Version]
  14. Youssef, A.M.; Al-Harbi, H.M.; Gutiérrez, F.; Zabramwi, Y.A.; Bulkhi, A.B.; Zahrani, S.A.; Bahamil, A.M.; Zahrani, A.J.; Otaibi, Z.A.; El-Haddad, B.A. Natural and human-induced sinkhole hazards in Saudi Arabia: Distribution, investigation, causes and impacts. Hydrogeol. J. 2016, 24, 625–644. [Google Scholar] [CrossRef]
  15. Othman, A.; Sultan, M.; Becker, R.; Alsefry, S.; Alharbi, T.; Gebremichael, E.; Alharbi, H.; Abdelmohsen, K. Use of geophysical and remote sensing data for assessment of aquifer depletion and related land deformation. Surv. Geophys. 2018, 39, 543–566. [Google Scholar] [CrossRef] [Green Version]
  16. Othman, A.; Abotalib, A.Z. Land subsidence triggered by groundwater withdrawal under hyper-arid conditions: Case study from Central Saudi Arabia. Environ. Earth Sci. 2019, 78, 243. [Google Scholar] [CrossRef]
  17. Abdelkareem, M.; Gaber, A.; Abdalla, F.; El-Din, G.K. Use of optical and radar remote sensing satellites for identifying and monitoring active/inactive landforms in the driest desert in Saudi Arabia. Geomorphology 2020, 362, 107–197. [Google Scholar] [CrossRef]
  18. Alshehri, F.; Sultan, M.; Karki, S.; Alwagdani, E.; Alsefry, S.; Alharbi, H.; Sahour, H.; Sturchio, N. Mapping the distribution of shallow groundwater occurrences using Remote Sensing-based statistical modeling over southwest Saudi Arabia. Remote Sens. 2020, 12, 1361. [Google Scholar] [CrossRef]
  19. Aljammaz, A.; Sultan, M.; Izadi, M.; Abotalib, A.Z.; Elhebiry, M.S.; Emil, M.K.; Abdelmohsen, K.; Saleh, M.; Becker, R. Land subsidence induced by rapid urbanization in arid environments: A remote sensing-based investigation. Remote Sens. 2021, 13, 1109. [Google Scholar] [CrossRef]
  20. Pankratz, H.G.; Sultan, M.; Abdelmohsen, K.; Sauck, W.A.; Alsefry, S.; Alharbi, H.; Emil, M.K.; Gebremichael, E.; Asaeidi, A.; Alshehri, F.; et al. Use of geophysical and radar interferometric techniques to monitor land deformation associated with the Jazan Salt Diapir, Jazan city, Saudi Arabia. Surv. Geophys. 2021, 42, 177–200. [Google Scholar] [CrossRef]
  21. Simons, M.; Rosen, P.A. Interferometric synthetic aperture radar geodesy. In Treatise on Geophysics-Geodesy; Elsevier: Amsterdam, The Netherlands, 2007; pp. 391–446. [Google Scholar]
  22. Stern, R.J.; Johnson, P. Continental lithosphere of the Arabian Plate: A geologic, petrologic, and geophysical synthesis. Earth-Sci. Rev. 2010, 101, 29–67. [Google Scholar] [CrossRef]
  23. Camp, V.E.; Roobol, M.J. The Arabian continental alkali basalt province: Part I. evolution of Harrat Rahat, Kingdom of Saudi Arabia. Geol. Soc. Am. Bull. 1989, 101, 71–95. [Google Scholar] [CrossRef]
  24. Moufti, M.R.; Moghazi, A.M.; Ali, K.A. 40Ar/39Ar geochronology of the Neogene-Quaternary Harrat Al-Madinah intercontinental volcanic field, Saudi Arabia: Implications for duration and migration of volcanic activity. J. Asian Earth Sci. 2013, 62, 253–268. [Google Scholar] [CrossRef]
  25. Downs, D.T.; Stelten, M.E.; Champion, D.E.; Dietterich, H.R.; Nawab, Z.; Zahran, H.; Hassan, K.; Shawali, J. Volcanic history of the northernmost part of the Harrat Rahat volcanic field, Saudi Arabia. Geosphere 2018, 14, 1253–1282. [Google Scholar] [CrossRef] [Green Version]
  26. Camp, V.E. Geologic Map of the Umm al Birak Quadrangle, Sheet 23D, Kingdom of Saudi Arabia; Saudi Arabian Deputy Ministry for Mineral Resources: Jeddah, Saudi Arabia, 1986; p. 40.
  27. Bamousa, A.O. Infracambrian superimposed tectonics in the late proterozoic units of Mount Ablah area, southern Asir Terrane, Arabian Shield, Saudi Arabia. Arab. J. Geosci. 2013, 6, 2035–2044. [Google Scholar] [CrossRef]
  28. Sharland, P.R.; Casey, D.M.; Davies, R.B.; Simmons, M.D.; Sutcliffe, O.E. Arabian plate sequence stratigraphy–revisions to SP2. GeoArabia 2004, 9, 199–214. [Google Scholar] [CrossRef]
  29. Aldaajani, T.Z.; Almalki, K.A.; Betts, P.G. Plume Versus Slab-Pull: Example from the Arabian Plate. Front. Earth Sci. 2021, 9, 494. [Google Scholar] [CrossRef]
  30. Johnson, P.R. Explanatory Notes to the Map of Proterozoic Geology of Western Saudi Arabia: Saudi Geological Survey Technical Report; SGS-TR-2006-4, scale 1:1,500,000; Saudi Geological Survey: Jeddah, Saudi Arabia, 2006; 28p. [Google Scholar]
  31. Johnson, P.R.; Kattan, F.H. Lithostratigraphic revision in the Arabian Shield: The impacts of geochronology and tectonic analysis. Arab. J. Sci. Eng. 2008, 33, 3–16. [Google Scholar]
  32. Pollastro, R.M.; Karshbaum, A.S.; Viger, R.J. Maps Showing Geology, Oil and Gas Fields and Geologic Provinces of the Arabian Peninsula; US Geological Survey: Reston, VA, USA, 1999. [Google Scholar]
  33. Hersbach, H.; Bell, B.; Berrisford, P.; Hirahara, S.; Horányi, A.; Muñoz-Sabater, J.; Nicolas, J.; Peubey, C.; Radu, R.; Schepers, D.; et al. The ERA5 global reanalysis. Q. J. R. Meteorol. Soc. 2020, 146, 1999–2049. [Google Scholar] [CrossRef]
  34. Molteni, F.; Buizza, R.; Palmer, T.N.; Petroliagis, T. The ECMWF ensemble prediction system: Methodology and validation. Q. J. R. Meteorol. Soc. 1996, 122, 73–119. [Google Scholar] [CrossRef]
  35. Rosen, P.A.; Gurrola, E.; Sacco, G.F.; Zebker, H. The InSAR scientific computing environment. In Proceedings of the EUSAR 2012 9th European Conference on Synthetic Aperture Radar, Nürnberg, Germany, 23–26 April 2012; Volume 23, pp. 730–733. [Google Scholar]
  36. Bekaert, D.; Karim, M.; Justin, L.; Hua, H.; Agram, P.; Owen, S.; Manipon, G.; Malarout, N.; Lucas, M.; Sacco, G.; et al. Development and dissemination of standardized geodetic products by the Advanced Rapid Imaging and Analysis (ARIA) Center for Natural Hazards. In Proceedings of the International Union of Geodesy and Geophysics (IUGG), Montreal, QC, Canada, 8–18 July 2019. [Google Scholar]
  37. Buzzanga, B.; Bekaert, D.P.; Hamlington, B.D.; Sangha, S.S. Toward sustained monitoring of subsidence at the coast using InSAR and GPS: An application in Hampton Roads, Virginia. Geophys. Res. Lett. 2020, 47, e2020GL090013. [Google Scholar] [CrossRef]
  38. Milbert, D. Solid: Solid Earth Tide. 2018. Available online: http://geodesyworld.github.io/SOFTS/solid.htm (accessed on 17 January 2022).
  39. Yunjun, Z.; Fattahi, H.; Pi, X.; Rosen, P.; Simons, M.; Agram, P.; Aoki, Y. Range Geolocation Accuracy of C/L-band SAR and its Implications for Operational Stack Coregistration. IEEE Trans. Geosci. Remote Sens. 2022. under review. [Google Scholar]
  40. Jolivet, R.; Agram, P.S.; Lin, N.Y.; Simons, M.; Doin, M.P.; Peltzer, G.; Li, Z. Improving InSAR geodesy using global atmospheric models. J. Geophys. Res. Solid Earth 2014, 119, 2324–2341. [Google Scholar] [CrossRef]
  41. Fattahi, H.; Amelung, F. DEM error correction in InSAR time series. IEEE Trans. Geosci. Remote Sens. 2013, 51, 4249–4259. [Google Scholar] [CrossRef]
  42. Yunjun, Z.; Fattahi, H.; Amelung, F. Small baseline InSAR time series analysis: Unwrapping error correction and noise reduction. Comput. Geosci. 2019, 133, 104331. [Google Scholar] [CrossRef] [Green Version]
  43. Jones, J.; Jones, C.E.; Bekaert, D.P. Value of InSAR for Monitoring Land Subsidence to Support Water Management in the San Joaquin Valley, California. J. Am. Water Resour. Assoc. 2021. [Google Scholar] [CrossRef]
  44. Sangha, S.S. Characterizing the Deformation Field in Afar from Radar Interferometry and Topography Data; University of California: Los Angeles, CA, USA, 2021. [Google Scholar]
  45. Fattahi, H.; Agram, P.; Simons, M. A network-based enhanced spectral diversity approach for TOPS time-series analysis. IEEE Trans. Geosci. Remote Sens. 2016, 55, 777–786. [Google Scholar] [CrossRef] [Green Version]
  46. Farr, T.G.; Rosen, P.A.; Caro, E.; Crippen, R.; Duren, R.; Hensley, S.; Kobrick, M.; Paller, M.; Rodriguez, E.; Roth, L.; et al. The shuttle radar topography mission. Rev. Geophys. 2007, 45. [Google Scholar] [CrossRef] [Green Version]
  47. Chen, C.W.; Zebker, H.A. Two-dimensional phase unwrapping with use of statistical models for cost functions in nonlinear optimization. JOSA A 2001, 18, 338–351. [Google Scholar] [CrossRef] [Green Version]
  48. Berardino, P.; Fornaro, G.; Lanari, R.; Sansosti, E. A new algorithm for surface deformation monitoring based on small baseline differential SAR interferograms. IEEE Trans. Geosci. Remote Sens. 2002, 40, 2375–2383. [Google Scholar] [CrossRef] [Green Version]
  49. Pepe, A.; Lanari, R. On the extension of the minimum cost flow algorithm for phase unwrapping of multitemporal differential SAR interferograms. IEEE Trans. Geosci. Remote Sens. 2006, 44, 2374–2383. [Google Scholar] [CrossRef]
  50. Motagh, M.; Shamshiri, R.; Haghighi, M.H.; Wetzel, H.U.; Akbari, B.; Nahavandchi, H.; Roessner, S.; Arabi, S. Quantifying groundwater exploitation induced subsidence in the Rafsanjan plain, southeastern Iran, using InSAR time-series and in situ measurements. Eng. Geol. 2017, 218, 134–151. [Google Scholar] [CrossRef]
  51. Cigna, F.; Tapete, D. Satellite InSAR survey of structurally-controlled land subsidence due to groundwater exploitation in the Aguascalientes Valley, Mexico. Remote Sens. Environ. 2021, 254, 112–254. [Google Scholar] [CrossRef]
  52. Riel, B.; Simons, M.; Ponti, D.; Agram, P.; Jolivet, R. Quantifying ground deformation in the Los Angeles and Santa Ana Coastal Basins due to groundwater withdrawal. Water Resour. Res. 2018, 54, 3557–3582. [Google Scholar] [CrossRef] [Green Version]
  53. Solt, M.; Sneed, M. Subsidence (2004-09) in and Near Lakebeds of the Mojave River and Morongo Groundwater Basins, Southwest Mojave Desert, California; US Department of the Interior, US Geological Survey: Reston, VA, USA, 2014. [Google Scholar]
  54. Haghighi, M.H.; Motagh, M. Ground surface response to continuous compaction of aquifer system in Tehran, Iran: Results from a long-term multi-sensor InSAR analysis. Remote Sens. Environ. 2019, 221, 534–550. [Google Scholar] [CrossRef]
  55. Buffardi, C.; Barbato, R.; Vigliotti, M.; Mandolini, A.; Ruberti, D. The Holocene Evolution of the Volturno Coastal Plain (Northern Campania, Southern Italy): Implications for the Understanding of Subsidence Patterns. Water 2021, 13, 2692. [Google Scholar] [CrossRef]
Figure 1. Geologic and geographic context of the study area: (A) Tectonic setting and major structural features of the Arabian Shield and surrounding area modified after [28,29]. Our study area is highlighted in a green box. This region is characterized by diffuse extensional grabens, dike intrusions, and massive volcanic fields. (B) Geologic and major structural features of Al-Yutamah Valley is shown as NW sinistral Najd fault system (NFS) which intersects with Cenozoic dextral strike slip (CDM) superimposed on the general bedrock terrain. (C) Worldview satellite image of the eastern part of Al-Yutamah Valley showing primary infrastructure and farms. The red circle in (B,C) denotes the city of Naqeeah.
Remotesensing 14 01769 g001
Figure 2. InSAR velocity maps at the region (A) and local (BD) scales. (A) The surface velocity map for western Arabia for the period between 2014 and 2021. This map highlights the long wavelength uplift signal along the Red Sea and short wavelength subsidence signals (black boxes B, C, and D) within western Arabia. (B) The velocity map of the Al-Yutamah Valley. (C) The velocity map for the Dhaa region. (D) The velocity map for the Shajwah region. Black squares denote spatial references. The white arrow shows the radar looking direction relative to the ground.
Remotesensing 14 01769 g002
Figure 3. (Left) The secular surface velocity of the region highlighted in the black box in Figure 3. This velocity field is derived from an ascending S1 track with 580 interferograms spanning the period between October 2014 and August 2021. The average temporal coherence exceeds 0.75. The black line highlights the boundary between basalt and alluvium deposits. The black square denotes the spatial reference. The white arrow shows the radar looking direction relative to the ground. (Right) The time series at a location indicated by the white triangle in the left panel. Gray dots represent the dates we excluded based on the chosen residual threshold (Figure S10), while the blue dots denote the displacement time series we use in this study. The time series shows continuous subsidence with more than 40 cm of accumulated displacement.
Remotesensing 14 01769 g003
Figure 4. (Left) Displacement map of the region bounded by brown box (Figure 3A) for 18 November 2018 event after smoothing using a low-pass Gaussian filter. The distinct pattern is in agreement with the continued subsidence that is shown in Figure 4. A, B, C, and D denote the locations for time series shown in Figure 5. (Right) Standard deviation of the displacement map. The estimated error is insignificant as compared with the observed displacement magnitude.
Remotesensing 14 01769 g004
Figure 5. Panels (AD) show optical images of the region taken by the Worldview 2.0 optical satellite a couple months after the rainfall event. The corresponding panels to the right show the observed time series for black triangles indicated on each satellite image. In the background of the right panels, we illustrate the rainfall for the Al-Yutamah town (worldweatheronline.com, accessed on 31 March 2022), as rainfall event denoted in black histogram and accumulation in blue shadow. In the corresponding time series for panel (A), we show the detrended (removing the linear subsidence component) history to highlight the embedded offset. We show a similar time series pattern corresponding to panel (B) with a lower subsidence rate. The time series associated with panel (C) indicates little to no subsidence. The time series corresponding to panel (D) shows a distinct trend that combines abrupt motion associated with cracking in conjunction with the last severe rainfall within a long wavelength signal. Gray dots represent the dates we excluded based on the chosen residual threshold (Figure S10), while the blue dots denote the displacement time series we use in this study.
Remotesensing 14 01769 g005
Figure 6. (Upper left panel) Map of the spatial gradient amplitude of the observed LOS InSAR velocity (cm/(y∗pixel)). The fuchsia line demonstrates the boundary between basalt and alluvium deposits. (Upper right panel) Cross-section through the gradient of the LOS velocity (cm/(y∗pixel)) cross-section along the Haramain High Speed Railway. (Lower left panel) A similar cross-section along the national east–west pipeline. (Lower right panel) cross-section within the Al-Yutamah Valley. Cross-sections (A-A’,B-B’) are not correlated with surface fractures, while the cross-section C-C’ is highly correlated with field fractures as reported in Figure 5.
Remotesensing 14 01769 g006
Figure 7. Surface geology, regional structures, sediment types, reported fractures, subsidence area, gradient of the LOS velocity field, and main infrastructure of the Al-Yutamah Valley. The region is characterized by basalt flow, quaternary sedimentary deposits, and Precambrian rocks. The approximate outline of the principal zone of subsidence is indicated by the sinuous white line, observed fractures are indicated by the thick black lines, and regional faults are shown as dashed black lines. The observed subsidence is associated with fractures in the alluvial sediments, while in the region of basalt flows, no fractures were reported. The corresponding gradient amplitude of the velocity field demonstrates higher velocities in the basalt flow area in comparison with the region of alluvial sediments. The black triangle denotes the city of Naqeeah. NFS: Najd fault system; CDM: dextral Cenozoic fault.
Remotesensing 14 01769 g007
Publisher’s Note: MDPI stays neutral with regard to jurisdictional claims in published maps and institutional affiliations.

