Article

Surface Displacements Mechanism of the Dobi Graben from ASAR Time-Series Analysis of InSAR: Implications for the Tectonic Setting in the Central Afar Depression, Ethiopia

by
Zelalem S. Demissie
* and
Glyn Rimmington
Department of Geology, Fairmount School of Liberal Arts and Science, Wichita State University, Wichita, KS 67260-0027, USA
*
Author to whom correspondence should be addressed.
Remote Sens. 2022, 14(8), 1845; https://doi.org/10.3390/rs14081845
Submission received: 23 February 2022 / Revised: 30 March 2022 / Accepted: 2 April 2022 / Published: 12 April 2022
(This article belongs to the Special Issue Remote Sensing in Earthquake, Tectonics and Seismic Hazards)

Abstract

:
The Dobi graben is a Quaternary, NW-trending continental rift found within the East-Central Block (ECB) of the Afar Depression (AD) in Ethiopia. The AD might be the only place where three active rifts meet on land. This diffused, Rift–Rift–Rift (RRR) triple junction in the ECB comprises the overlap zone between the Red Sea and the Gulf of Aden propagators. Rifting is ongoing in the Dobi graben as evidenced by the August 1989 earthquakes (of magnitude 5.7 < MW < 6.2). This study carried out a surface displacement time-series analysis to examine the kinematics of the Dobi graben and the surrounding area using 18 ascending orbit scenes (between May 2005 and March 2010) along tract 257 and 15 along the descending orbit (tract 006) of the Advanced Synthetic Aperture Radar (ASAR), C-band (λ = 5.6 cm) acquired by the ENVIronmental SATellite (ENVISAT). We utilized the Small Baseline Algorithm (SBA) techniques of the distributed scatterer, which were implemented independently to generate Line of Sight (LOS) displacement maps. These LOS displacement surface movements, identified in both geometries, can be interpreted as ± signs of predominantly vertical movement in both geometries: positive for uplifting and negative for subsidence. Additionally, opposite signs of ± horizontal movement in both geometries indicate that the movement is from East to West (or vice versa). Results from the velocity and displacement maps and time series analysis suggest that creeping is associated mainly with normal faulting and could be the primary mechanism for strain distribution for the Southeastern part of the Dobi graben. The anomalous, continuous uplifting exhibited at the rift shoulder and in the horst area might be linked to the presence of temporary reactivation of normal faulting in the region. The oblique, positive LOS signals observed in different parts of the Dobi graben might serve as a proxy for understanding how strain is accommodated as normal faulting and is distributed in a distinct northeast direction. This explanation supports both the arguments for the Northeast migration of the triple junction and the transfer of strain from the southernmost Red Sea Rift (RSR) to the Central AD.

1. Introduction

The Afar Depression (AD) is the northern termination of the East African Rift System (EARS) (Figure 1A). It is a perfect, natural laboratory for studying the rift initiation that spans to the late-stage continental rifting on the verge of lithospheric rupturing. It is located where the Main Ethiopian Rift (MER), the Gulf of Aden Rift (GAR), and the Red Sea Rift (RSR) form a diffused, Rift–Rift–Rift (RRR) triple junction (Figure 1B) [1,2,3,4]. In general, rifting of the AD’s lithosphere is a fundamental process that describes the thinning of the entire lithosphere and leads to the final rupturing of the area. Two comprehensive rifting mechanisms, magma-rich rifting [5,6,7,8,9,10,11] and magma-poor rifting, are well conferred in the East African Rift System (EARS) [4,12] (Figure 1A). These two categories in the AD have been explained as distribution of strain from rift initiation to plate-rupturing mechanisms [13]. Yet, scientists have different ideas and opinions about how crustal extension is transferred from one rift segment to the other.
For example, different models have been proposed to explain the kinematics of the RRR triple junction within the AD. Bookshelf faulting [1,2,3,4,14,15], rigid plates [16], microplates [17,18,19], progressive tearing [20] and crank arm tectonics [21] are among the models that have been proposed to explain the deformation mechanism of the AD. Additionally, it has also been suggested that the slab pull of Arabia under Eurasia has created far-field stress that caused the Danakil block to rotate counterclockwise [19,22]. This counterclockwise rotation of the Danakil block is the cause of rifting in the ECB [23,24]. However, some authors [2] argue that all these models could be relevant in certain respects and apply to the AD at the proper scale. For instance, at the regional scale, the kinematics of this RRR junction have been defined by the Neogene-Pliocene deformation and explained mainly by the overlapping propagating axes of the RSR and GAR. In this model, the RSR and GAR create an East-Northeast-trending dextral shear, generating a clockwise rotation of the NW striking blocks separated by left-lateral Northwest striking faults—this is referred to as bookshelf faulting [1,2,14,15] (Figure 1C).
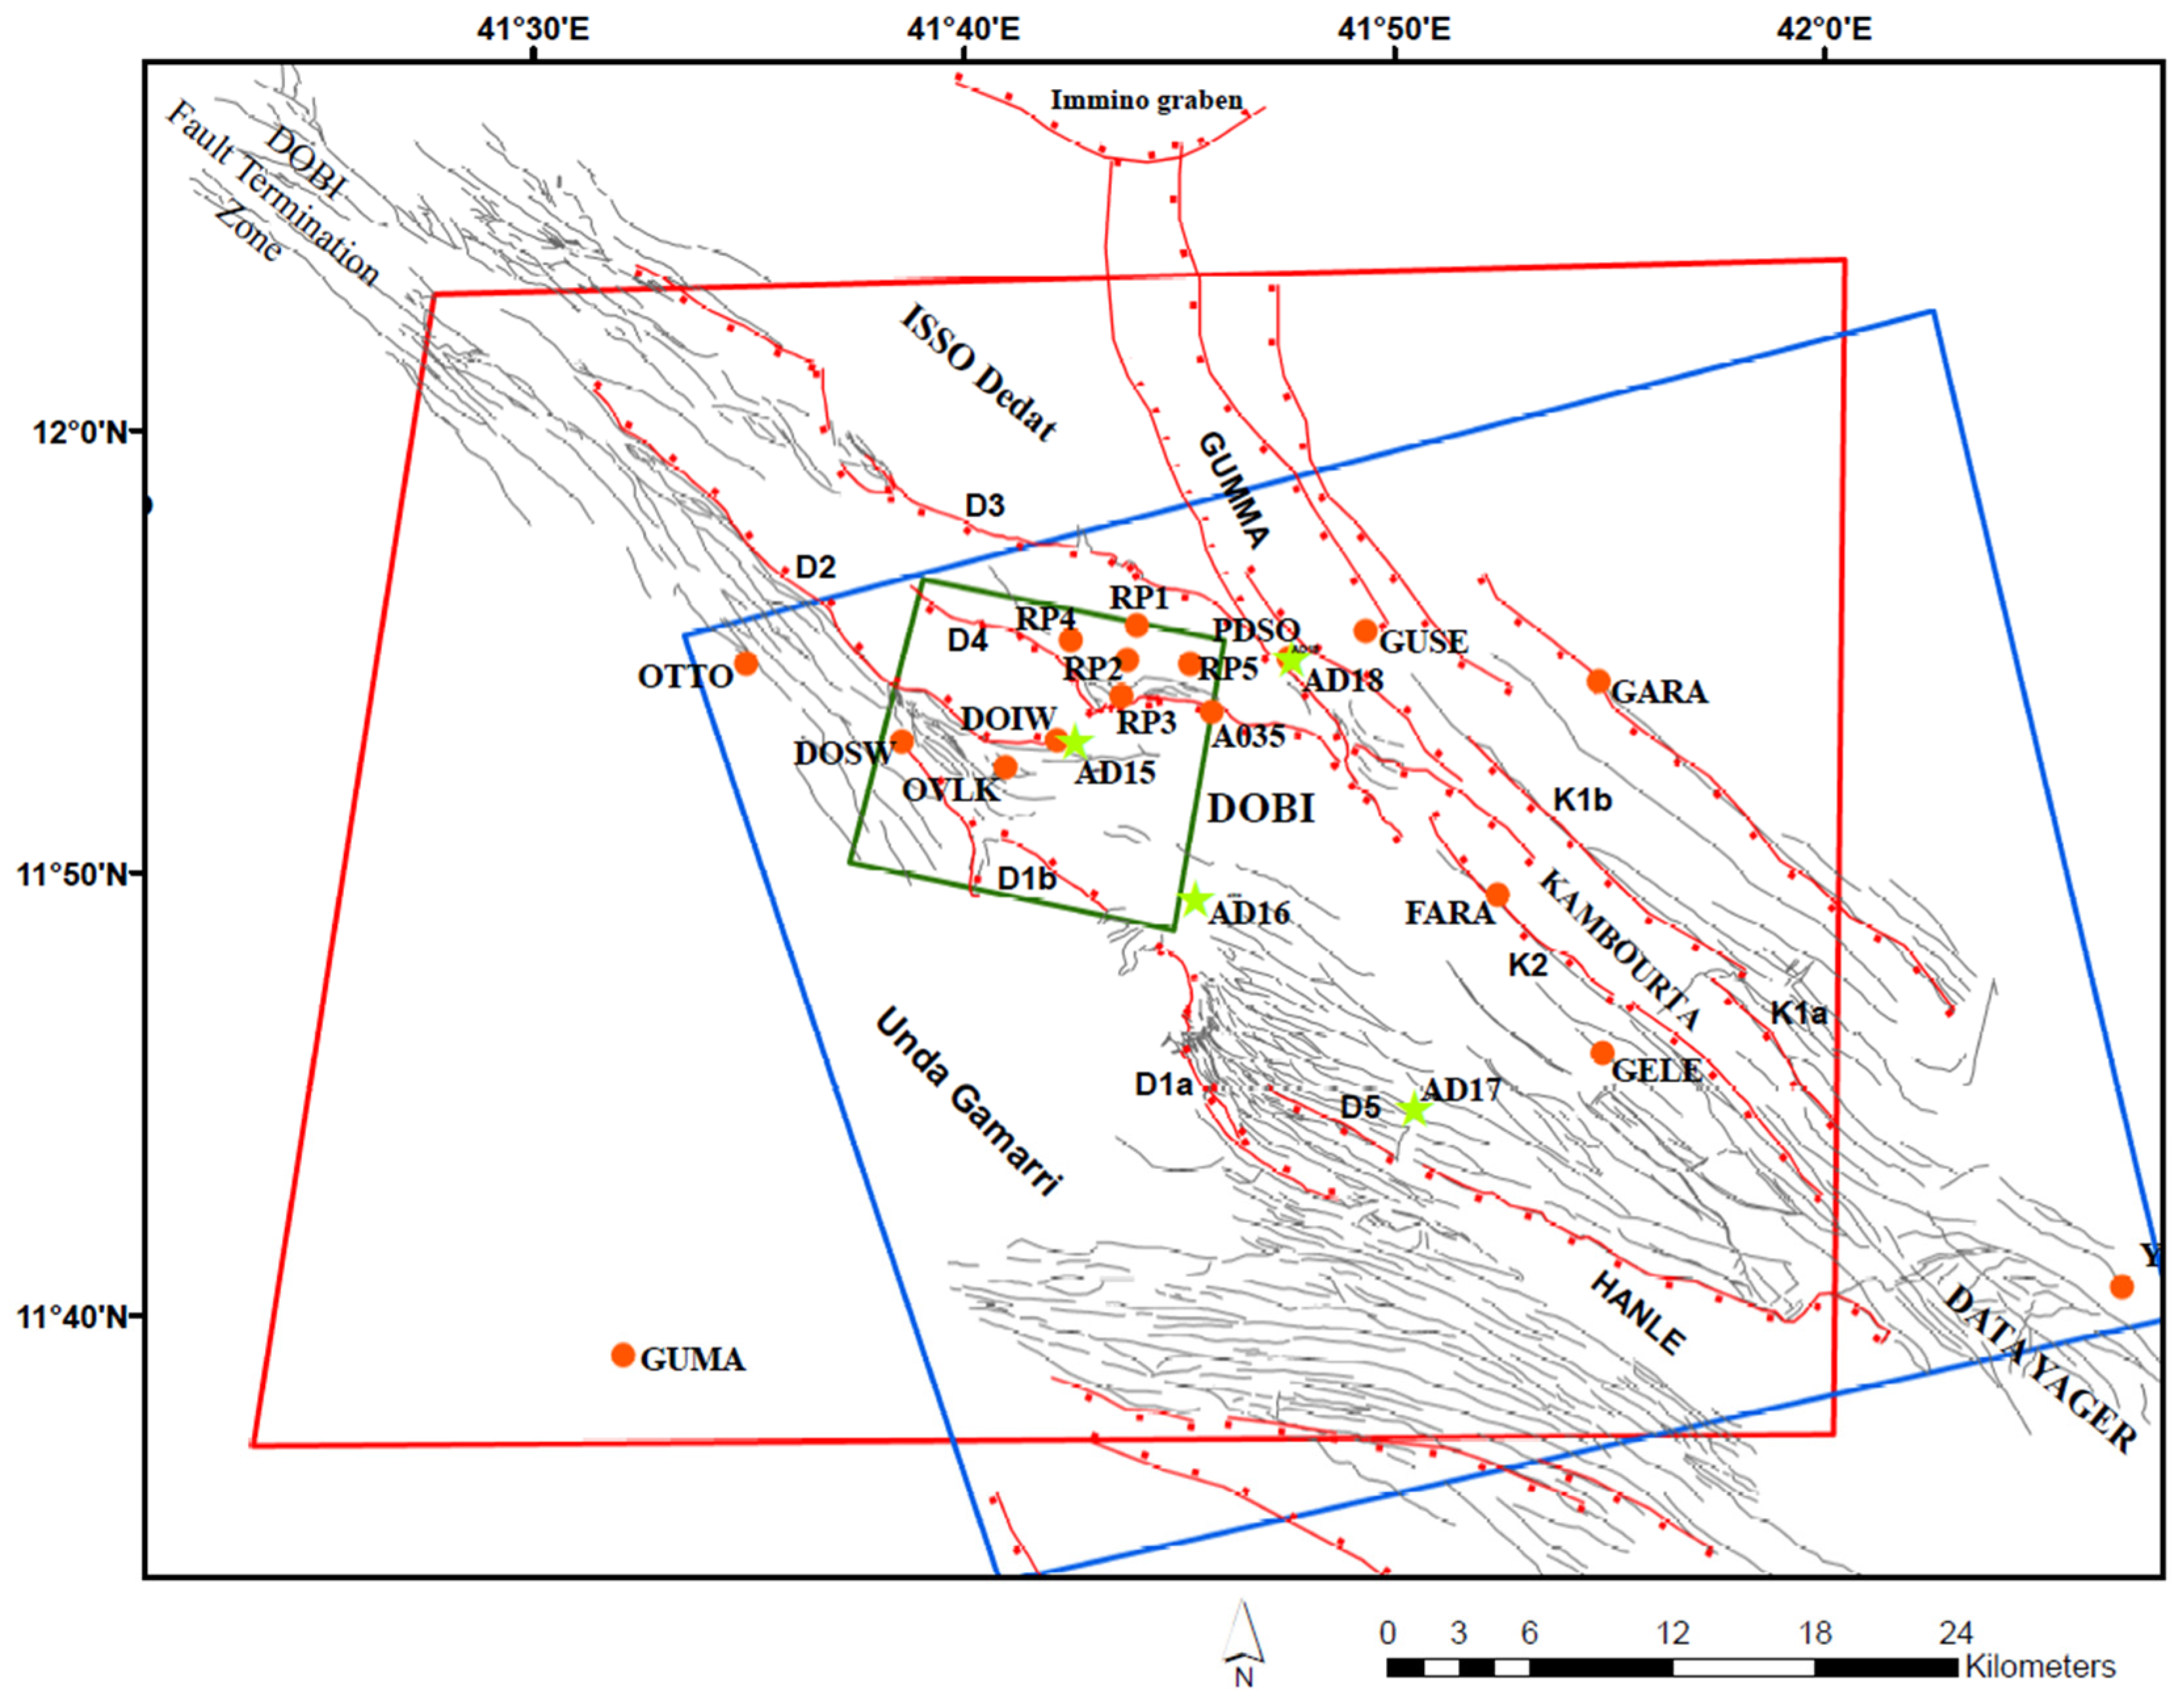
In addition to the classical, diffused crustal extension by normal faulting and block tilting that is emphasized more for the region, few reports explain the existence of the left lateral strike faults, particularly in the Northwest-trending Dobi graben. For example, Mohr [25] details a sinistral-shearing presence in the Dobi graben based on the interpretation of satellite images. Other authors [26] also report the existence of strike-slip faults with an NNE to ENE (rift transversal) strike from a slickensides analysis performed at several points in the Dobi graben and the graben rift shoulders. In addition, [27] also illustrated a strike-slip seismic pitch with the fault planes striking WNW–ESE to NW–SE at the Dobi ramp zone around 42OE and 12ON, just ~3 km NW of the strike-slip component reported by [26], (Figure 2).
Furthermore, geophysical and geodesy studies indicated that the present-day total spreading velocities are 18 mm/year between Nubia and Arabia, 16 mm/year between Somalia and Arabia, and 6 mm/yr for Nubia and Somalia [13,28,29]. Additionally, the RSR and GAR are spreading in a NE–SW direction and linked to the much slower, approximately east–west–extending MER just south of the southern end-segment of the RSR, the Tendaho–Goba’ad discontinuity [15,30]. Additionally, large border faults primarily accommodated the extension along with the southern RSR, but during the past ~4 m.y., the strain localized to axial magmatic segments, which mark an active plate boundary from the latitude ~15°N to 12°N in the RSR, and south of 11°N in the MER (Figure 1C) [3,15,30]. Likewise, the Asal–Ghoubbet rift segment of the GAR [31] also exhibited a similar pattern. Therefore, the presence of tectonic fault zones without recent (Holocene) volcanism, between the distinct segmentation of the RSRs and GARs, from latitude 12°N to 11°N, suggests that a dense network of normal faulting accommodates plate opening. More specifically, for instance, [32] used detailed ground-based magnetic data across the Tendaho graben, which comprises the southern segment of the RSR (Figure 1C) and explained that the Tendaho graben’s extension rate is slowing down. According to [32], the seismic and extensional strain is shifting from south to central Afar, particularly to the Dobi graben. Moreover, [4,32] suggested that the boundary between the Arabian and Nubian plates within the AD may be developing within central Afar, possibly within the Dobi graben in the central part of the block (Figure 1C and Figure 2).
Therefore, the scope of this paper is to quantify the time-series, slow-slip events (aseismic slip) that lead to strain distribution between the RSR and the central Afar using the Advanced Synthetic Aperture Radar (ASAR) acquired by ENVISAT from May 2005 to March 2010, with millimeter accuracy. We particularly emphasize investigating if the mechanism of the seismic tensile stress changes gradually to aseismic mantle-assisted slow-slip strain accommodation and distribution.
To achieve our goal, we used both the ascending tract 257 and descending tract 006 of the ASAR ENVISAT images acquired during the 2005 to 2010 period (Figure 2). First, we identified the mean velocities of the surface along the LOS of the ENVISAT platform using two different geometries, the ascending tract 257 and the descending tract 006, (Figure 2). Then, the time series displacement analysis followed to resolve the slow-slip strain accommodations caused by the normal faults where most of the faults are striking oblique to the N 30°E rifting direction. During result interpretation, integrated surface displacement measurements obtained using the Small Baseline Subset Algorithm (SBSA) were compared with the available GPS data. Comparison of the results from SBSA and the available GPS data suggest that the Dobi graben and surrounding area accommodated strain mainly by normal faulting, which tends to creep or to slip perpendicular to the rift extension direction.

2. Materials and Methods

We processed the phased-array C-band of the ASAR C-band (λ = 5.63 cm) scenes of the ENVISAT platform of the ESA (File S1A,B). While the phase-shift itself does not provide any useful information, the phase-shift difference or InterFeroGram (IFG) between two ASAR images does provide information about surface deformation. When comparing their compatible geometries, the interferogram contains information about surface topography, and possible ground displacements, in the LOS of the satellite.
In this research, we employed a systematic InSAR time series analysis for the Dobi graben and its vicinity using the Small BAseline Subset (SBAS) algorithm [33] to generate deformation velocity and displacement time-series.

2.1. ENVI SarScape® Small BAseline Subset Algorithm (SBAS)

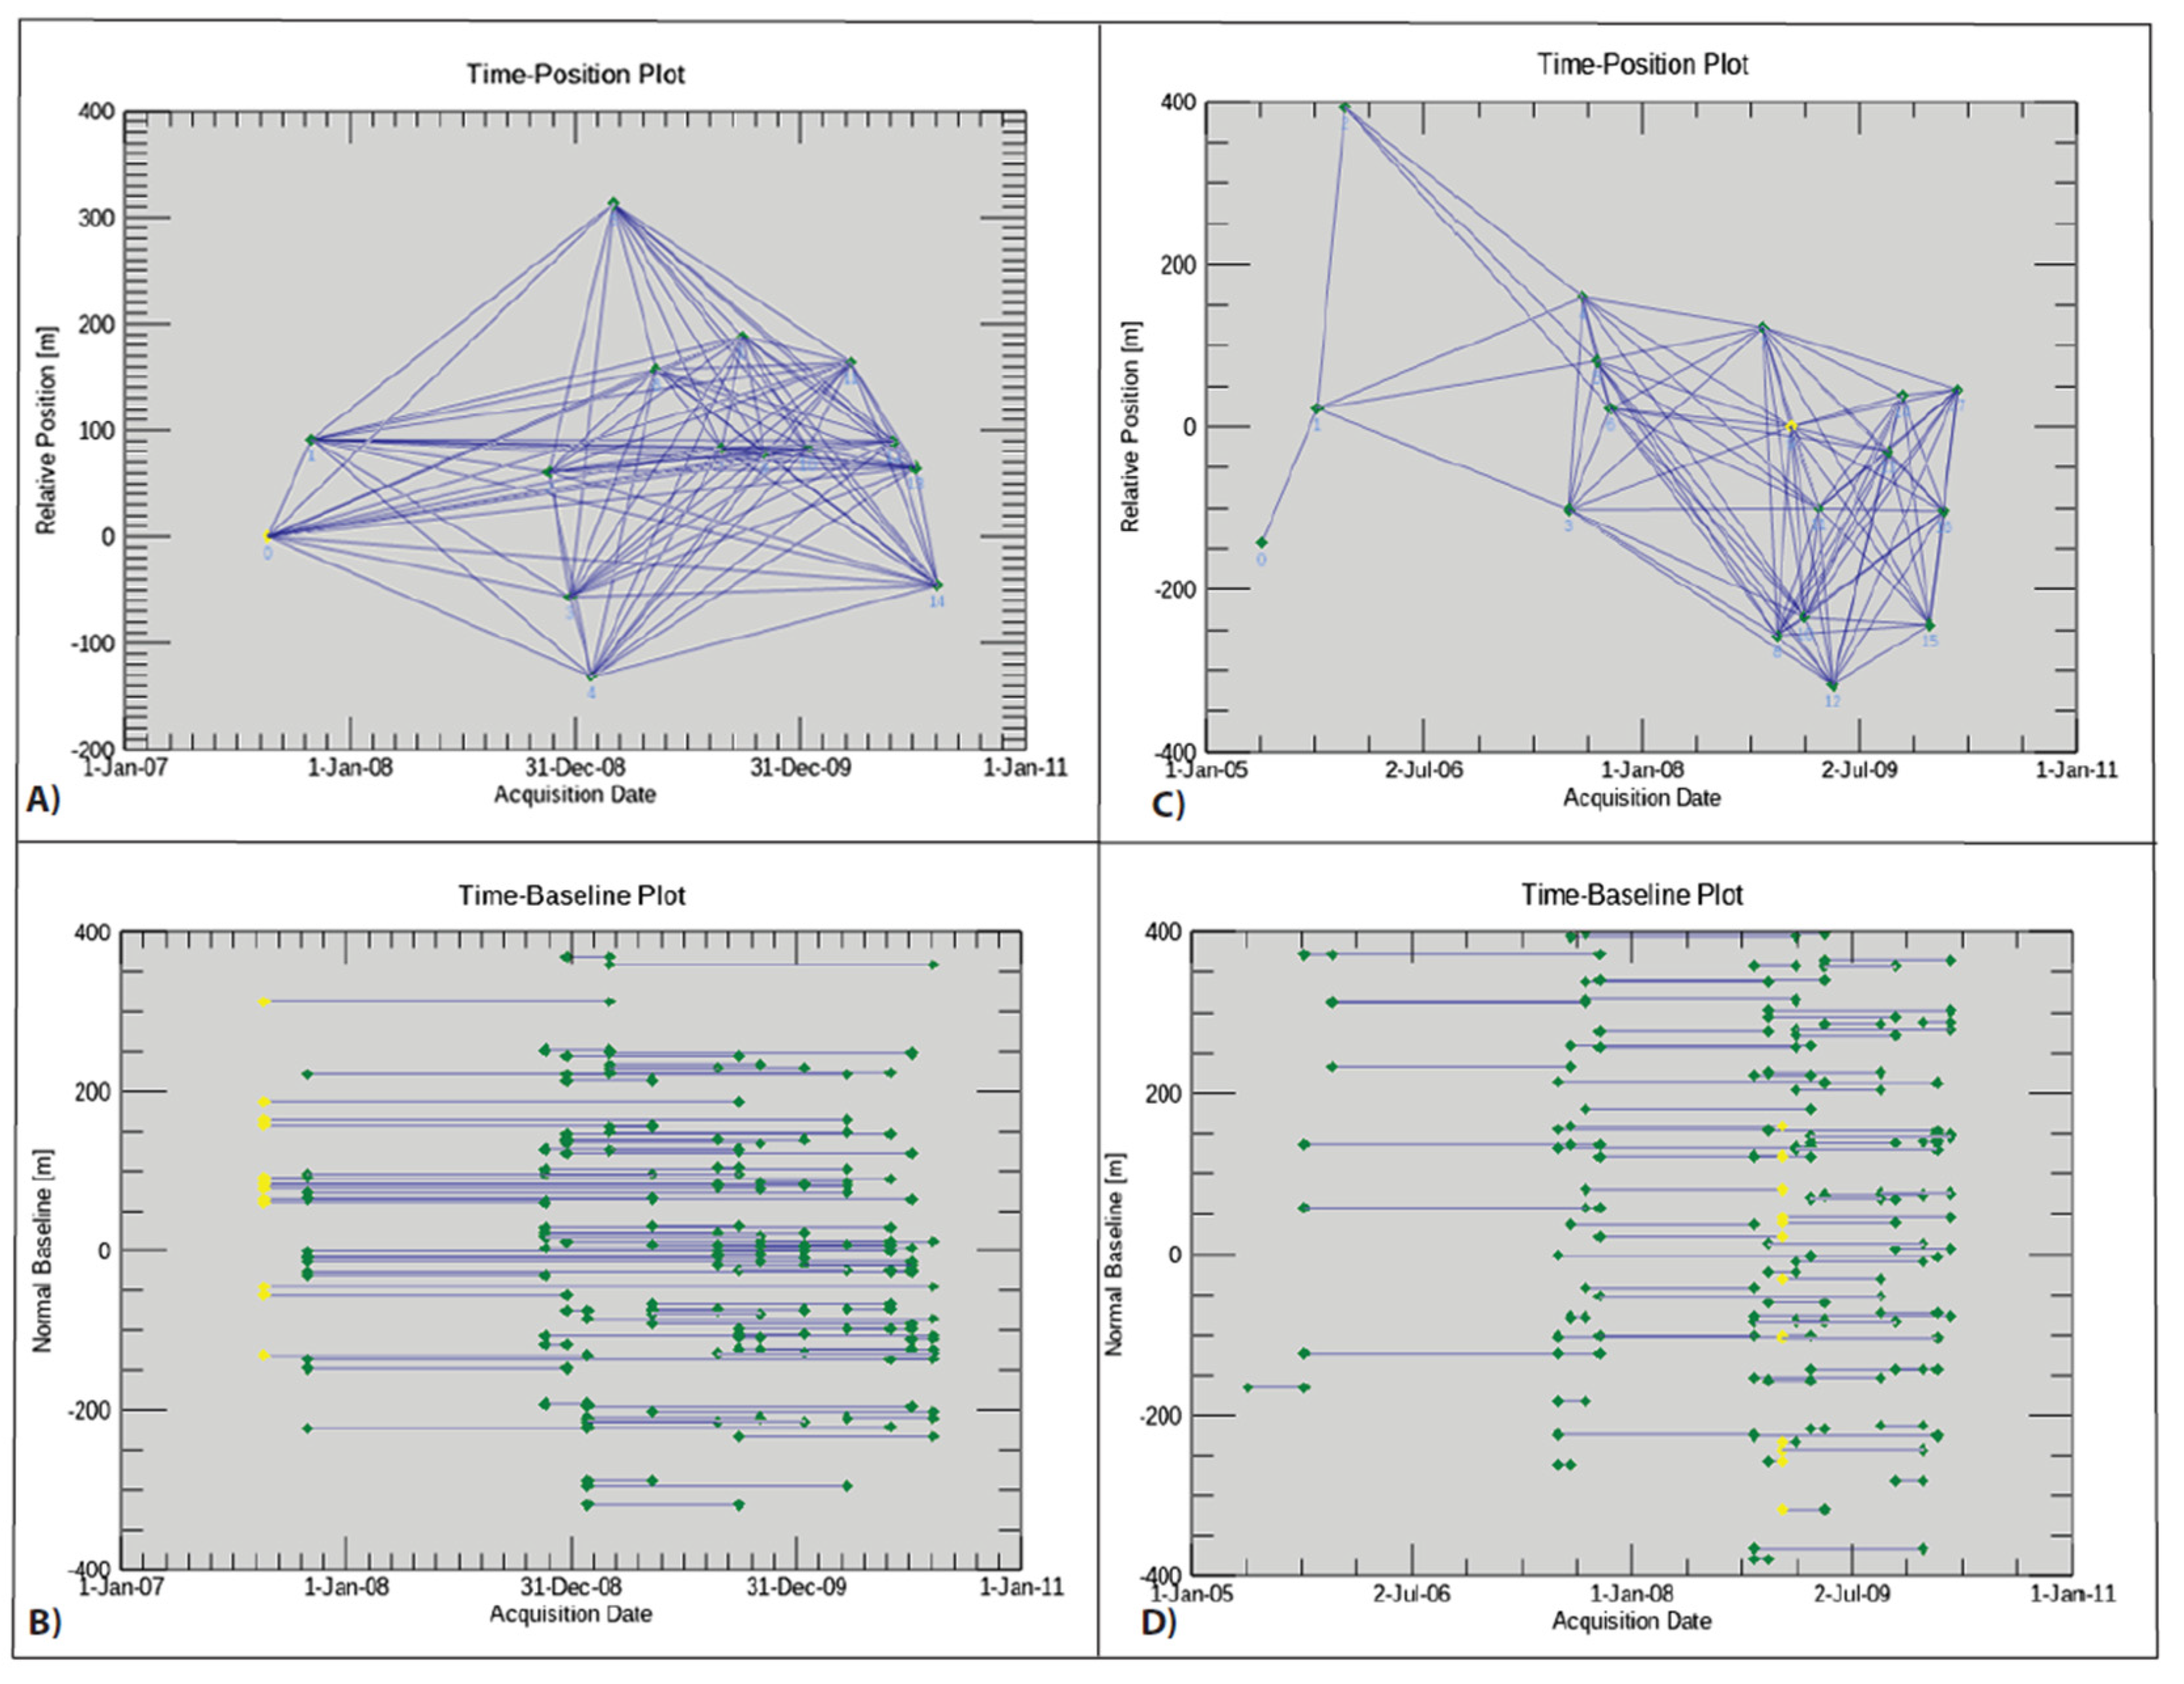
The SBA technique was developed for generating time series deformations for non-urban areas [33]. Therefore, it is ideal to implement in an arid, non-vegetated area, such as the Dobi graben and its surroundings. We proceeded with an image co-registration with a reference to DEM 1-arc-second Shuttle RADAR Topography Mission (SRTM) to reduce the topographic contribution. We focused the raw level-0 SAR data into Single Complex Images (SCL) by considering similar Doppler centroids and data obtained from Doppler Orbitography and Radio-positioning Integrated by Satellite (DORIS) [34]. The algorithm automatically selected an appropriate common master image using both temporal and spatial baselines criteria set by the system (Figure 3). Additionally, any differences in Doppler centroids are used to maximize the correlation between the images [35]. The overall processing workflow included the following steps: (a) creating a connection graph, (b) IFG generation, (c) Goldstein IFG filtering, (d) orbital refinement and re-flattening, (e) removal of atmospheric and topographic error, (f) phase unwrapping, and (g) phase-to-displacement conversion [36].
For example, we utilized 180 days of small baseline maximum temporal limits with reference to the common master image acquired on 9 January 2009, respectively, of the ASAR image of ascending tract 257. Our small temporal baseline caused the separation of the SCL into different subsets, which suppressed the effects of noise generated from incoherent pixels (Figure 3). Therefore, the SBAS subsets are constituted by images acquired from orbits close to each other as specified in the network and images with a maximum of 180-day intervals. Additionally, we set the perpendicular baseline input threshold to less than or equal to 500 m, selected to suppress the effects of spatial and temporal decorrelation.
The next step is to generate interferometric pairs with a high coherence (Figure 3A–D). Only interferometric pairs within a maximum normal baseline of 45 (%) and maximum temporal baseline shorter than 180 (days) will be generated, following the SBA connection graph rule. As shown in Figure 3A,B the ASAR image on 09 January 2009 was selected as a common master image and is designated with the yellow diamond point. The green diamonds represent the slave images, and each line denotes a connection between two SAR images.
Next, by measuring the distance difference between a point on earth and the sensor position of the two different acquisition times, the phase difference (ϕ) was generated between the master and slave complexes, co-registered SAR images. We produced 92 IFGs for the datasets from May 2005 to March 2010. To obtain the mean velocity field, cumulative displacement and respective time series, surface displacement stacks were computed for the 92 IFGs. The stacking procedures also helped us to mitigate the effect of the atmospheric noise, if any (e.g., [37]). Similarly, we also produced 104 IFGs for the data sets from October 2007 to August 2010 with respect to the 10 October 2007 image as a common master using the descending tract 006 orbit, but the spatial decorrelation phenomena are partitioned into two subsets (Files S2 and S3).
Based on the results obtained from co-registration, we generated 92 IFGs (File S2A,B). During the interferometric process, we used a predefined linear displacement model to remove phase residuals from digital elevation model (DEM) inaccuracies [33]. Depending on the redundancy of IFG pairs that satisfy the coherence threshold requirement of at least 0.35, the Minimum Cost Flow (MCF) method was applied for phase unwrapping [35,38]. This threshold is intended to define the minimum coherence value, which is considered for the cost estimate [34]. The MCF utilized the coherence threshold value to successfully perform unwrapping and decide where it is better to locate possible phase jumps.
SarScape® also estimated ground deformation relative to Ground Control (reference) Points (GCPs), which are technically used during the refinement and re-flattening step (File S2B). Therefore, 130 GCPs with assumed zero displacement (motionless) were used as reference points for SBAS processing [39]. Additionally, the GCPs allow us to perform a quality inspection, checking whether the change of phase caused by satellite orbital errors and residue from topographic errors are properly eliminated. In the first linear inversion model, an atmospheric high pass temporal filter of 365 days and an atmospheric low-pass spatial filter of 1200 m were utilized to reduce the atmospheric delay [36,40]), considering atmospheric artifacts have been removed using spatially low-pass and temporally high-pass filters. Additionally, these noise–signal ratios are highly correlated in space, but poorly correlated in time.
Once more, we utilized the predefined minimum and maximum threshold values recommended for the SBAS workflow [34,40] and adjusted the respective parameters for our analysis: a maximum normal baseline of 45% was used to generate a triangular connection network in the time baseline domain, but disconnected blocks were disallowed. Then, a maximum coherence threshold of value 0.3 was assigned, along with the Goldstein maximum alpha of 0.3. Subsequently, a maximum first step linear displacement inversion model of 365 days and spatial wavelet size (m) of 1200 was applied. Finally, inversion step 2, displacement of the linear model, like that employed in the 1st inversion, was utilized. Inversion step 2 also adjusted and ran with an atmospheric low pass at a size (m) of 1600 and, an inversion step 2 atmospheric high pass size (days) 365.
Additionally, we performed the same procedures for the 18 ASAR descending tract 006 considering the 21 August 2007 image as a common master image (Figure 3C,D) and produced 104 IFGs (Supplemental File S3A,B).

2.2. Available GPS Data and Broadband Seismic Data

We used ten different available GPS sites’ data [39,41] to obtain a continuous high-resolution surface displacement velocity field of the Dobi graben (Figure 2). We choose these Ten GPS stations (OTTA, DOSW, OVLK, DOIW, AO35, GARA, FARA, PDSO, GUSE and GELE) in the study area based on spatiotemporal characteristics, the criteria being that the stations have completed observations from 2007 to 2010 without notable offsets. Therefore, the surface displacement dynamics of the neighboring pixels around and at these stations have been analyzed in detail. Additionally, the locations of the broadband seismic stations (near four different spatial locations, AD15, AD16, AD17 and AD18 installed by [42]) were selected (Figure 2) to compare the time-series surface displacement dynamics.

3. Results

3.1. Post-InSAR Analysis and Quality Control

To investigate particularly whether the strain is accommodated within the Dobi graben with the influence of the local seismicity incidence of the September 2005 earthquakes of the Dabbahu–Manda Hararo segment (DMH), we analyzed the time-series surface displacement and the mean LOS velocity of InSAR using both the ascending and descending tract of the ASAR images. Considering the different geometries of the two ASAR orbital tracts, the detected signals can be interpreted as the same signs of movement value in both geometries, showing mainly vertical movements: positive for uplifts and negative for subsidence. Likewise, opposite signs of movement value in both geometries indicate that the horizontal movement is from East-to-West (or vice versa).
Moreover, the geocoded LOS displacement and vertical surface displacements resulting from the SBA processes were imported into ESRI ArcGIS Pro 2.8 for further analysis. We then generated a multidimensional raster dataset to represent and compare the vertical displacements with other environmental, geodesic, and geophysical phenomenological quantities (variables can be considered as one kind of dimension) that occur over the study area (two-dimensional, Latitude, and Longitude), through time (another dimension). Building multidimensional datasets helps us to understand better what governs the strain accommodation and transfer in Dobi and its vicinity.
Additionally, the multidimensional raster dataset approach swiftly profiles the time-series variation. Several options generate a temporal profile chart; the prominent one is multiple locations with one variable, such as at any randomly selected points, or any small polygons delineated as a spatial subset area, for example, Region 1 and Region 2 to represent the SE and the NE portions of the Dobi graben’s rift axis, respectively.
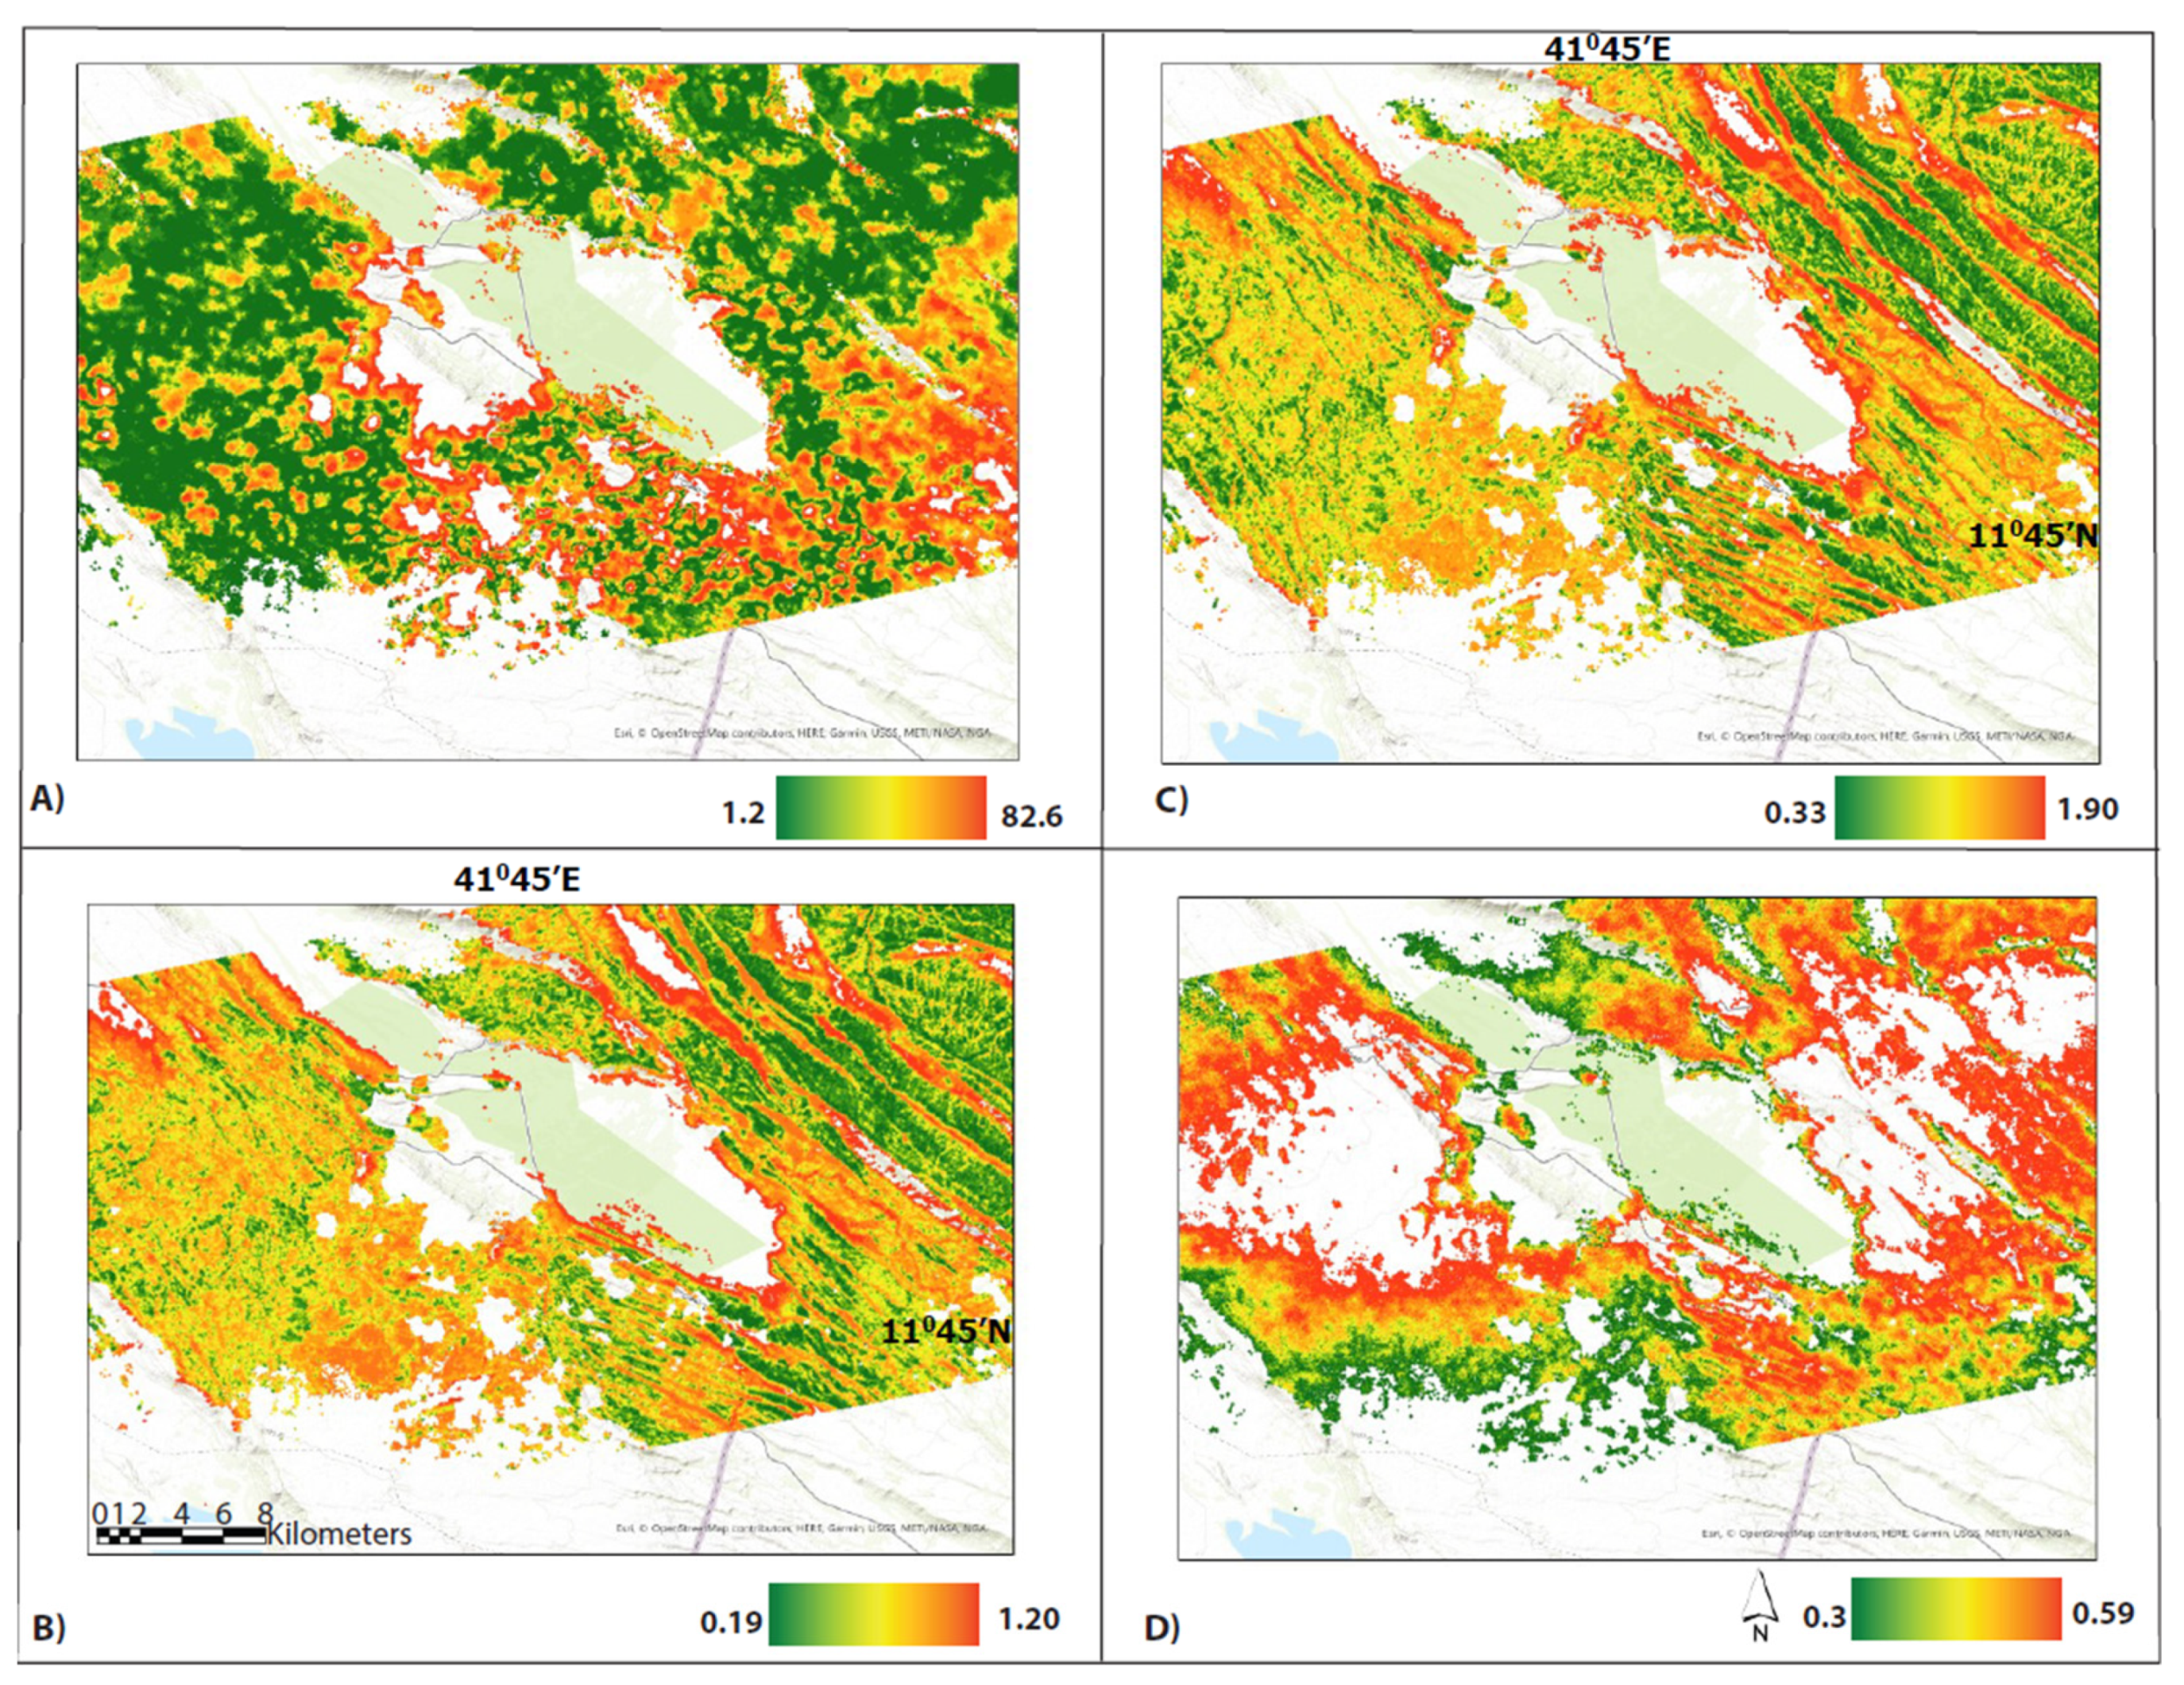
To better understand the SBA InSAR surface displacement from both geometries, we additionally focused on those pixels consisting of the location and the velocity of the available GPS data with respect to the fixed Nubia plate in the region [39,41]. Yet, the quality of the InSAR results needed to be checked using several indices. Among the several indices, the Root Mean Square Error (RMSE), multitemporal interferometric coherence, velocity precision (Vp), and Height Precision (HP) have direct links to the quality of the phase changes in both the ascending and descending tract (Figure 4 and Figure 5).
These indices, especially the RMSE, interferometric coherence and VP, are primarily used to filter out the extreme proxies or noises (Figure 4A and Figure 5A). Likewise, HP estimates from the phase component that is linearly proportional to the normal baseline (Figure 4B and Figure 5B). In comparison, VP is directly related to phase elements such as the mathematical combination of the band wavelength and standard deviation from the mean velocity (Figure 4C and Figure 5C).
For example, VP is an additional option for quality control and can be calculated from the standard deviation of the displacement error as a function of the signal wavelength [34,43]. Our results revealed that the spatial distribution of the VP varies as it moves beyond one standard deviation away from the mean LOS velocity. For example, 5% of the VP value for the Dobi graben is beyond one standard deviation away from the VP’s mean value (exhibiting a coherence value less than 0.35), and these pixels are filtered out and removed to further reduce noises that presumably are introduced during interferometric generation. Finally, the interferometric-coherence measures the similarity in the reflective ground properties (phase-coherence) at the timing of two SAR acquisitions, and this phase coherent ranges between 0 and 1 [34,43] (Figure 4D and Figure 5D). A value of 0 indicates complete loss of coherence between the master and slave images, while a value of 1 indicates no phase noise or complete coherence between the master and slave images. Given only the points with a coherence value of 0.35 or over, a multitemporal coherence image is derived from a total of 1,414,227 distributed pixels that exhibit coherence values ranging from 0.35 to 1 (Figure 4D and Figure 5D).

3.2. The Line of Sight (LOS) of Displacement Using Ascending Tract 257

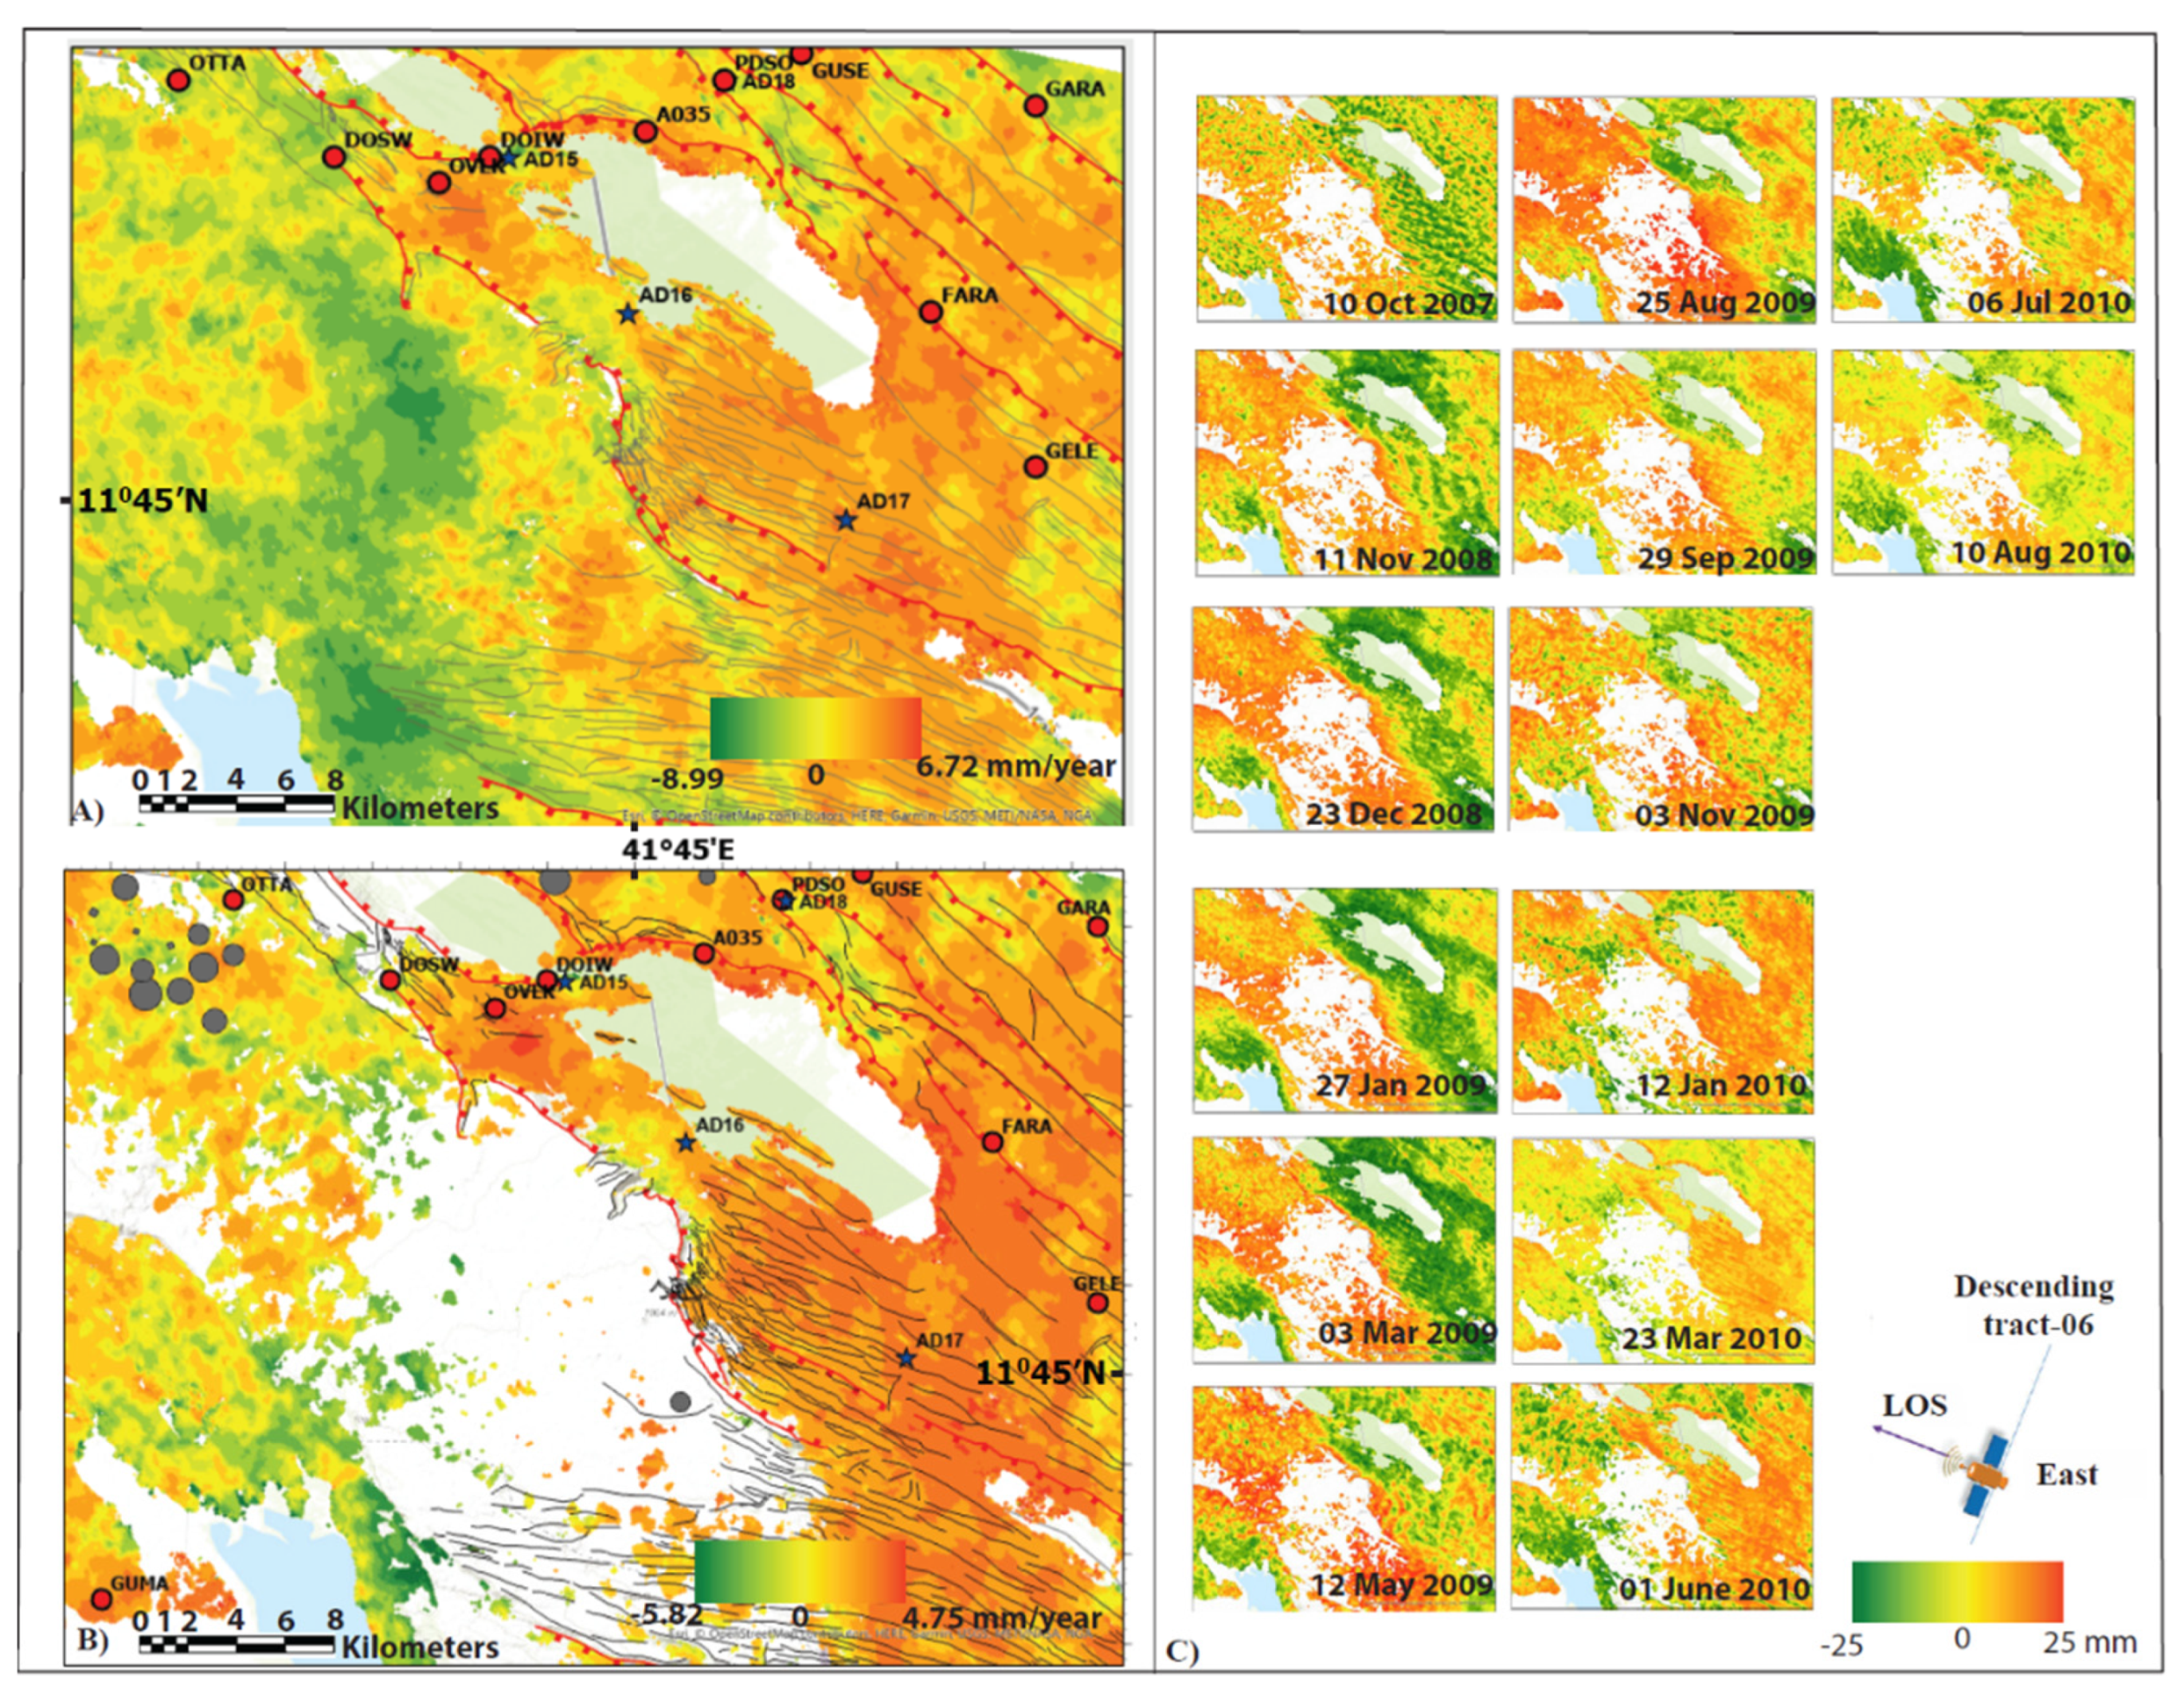
The SBA results revealed a significant loss of coherence value that is apparent in most of the Dobi graben and the SE part of the Unda Gamarri horst (Figure 4D and Figure 5D). The former is perhaps due to the swing in unconsolidated sediments that cover most of the rift axial. The latter presumably indicates surface deformation due to the frequent geodynamic processes, including the strain localization and distribution that shaped the region for decades. For example, both the LOS and time-series measurements exhibited a negative LOS in millimeters in the Gumma graben, Siyarrou horst, Isso Dedat horst and Kambourta (Figure 6 and Figure 7). On the contrary, Figure 6 and Figure 7 also show a positive LOS in millimeters in the Und Gamari horst, the Dobi relay zone and the Dobi imbrication zone. An additional in-depth visualization also verified a distinct horizontal and considerably significant strain distribution and accommodation at the available GPS site locations [39,43] near OTTA, DOSW, OVLK, DOIW, AO35, GARA, FARA, PDSO, GUSE and GELE and at the locations of the pixels near the four different spatial sites of the broadband seismic stations, the AD15, AD16, AD17 and AD18 installed by [42].
Along with the documented kinematics of the 1989 Dobi seismic sequence [12,44] our mean LOS velocity and the time-series InSAR analysis also detected an optimum gradient of the horizontal velocities to the Eastern and Western part of the rift axis (Figure 6A–D). The horizontal strain gradient proved by our displacement measurements revealed both a positive LOS value and a negative value for various parts of the region. Positive LOS values correspond to movement toward the sensor, and negative values correspond to movement away from the sensor.
The positive LOS value mainly dominates the region where the Dobi graben forms half grabens or asymmetrical grabens mainly composed of extensional imbrication fans that widen Southeastward toward the Gammarri tear zone. The former especially comprises the D2 fault, D1a faults, Dobi relay zone and Dobi imbrication zone (Figure 2 and Figure 6A,C). Overall, this region (east of the rift axis) shows positive LOS signs of movement, particularly at OTTA, DOSW, OVLK and DOIW, as well as at the two broadband seismic sites AD16 and AD17 (Figure 6A–C). For instance, our InSAR time-series displacement rate at OTTA is compared with the 11.35 mm/year VE with respect to the Nubian plate (VE with respect to Nub) GPS velocities near the Dobi relay zone and the 7.19 VE with respect to Nub at OVLK [39,41].
Contrastingly, the InSAR signal attained from other GPS locations [39,41], especially at AO35, FARA and GELE, detected horizontal movement that corresponds to a backward sense of movement from the sensor (Figure 6A,B,D). Hence, the surface movement detected in these GPS sites is the opposite sign of motion to the LOS during the time-series period mentioned above (Figure 6 and Figure 7). Our InSAR time-series displacement rate is in accord with the 11.5 VE with respect to Nub, 13.64 VE with respect to Nub, and 11.95 VE with respect to Nub at the A035, FARA and GELE locations, respectively, mainly situated between the Kadda Dobi and Gumma grabens.

3.3. The LOS of Displacement Using Descending Tract 006

The LOS displacement measurement of the tract 006 shows a significant loss of coherence in the LOS deformations. These low coherence values are apparent in most of the graben at Dobi and the entire portion of the Unda Gamarri horst (Figure 8 and Figure 9). In addition, our result reveals a positive LOS in millimeters in both regions 1 and 2 designated in Figure 8A,B. All observations at the available GPS site locations [39,41], near OTTA, DOSW, OVLK, DOIW, AO35, GARA, FARA, PDSO, GUSE and GELE, and at the locations of the four different spatial sites of the broadband seismic stations, AD15, AD16, AD17 and AD18, installed by Reed et al. [42], showed positive LOS surface displacement measurement values (Figure 8A–D).
For instance, our InSAR time-series displacement rate at OTTA compares with the 11.35 mm per year VE with respect to the Nubian plate GPS velocities near the Dobi relay zone and the 7.19 VE with respect to Nub at OVLK [39,41]. This positive movement mainly dominates at all normal border faults such as the D3 fault, D2 fault, D1a fault, D1b fault and the Dobi relay zone as well as the Dobi imbrication zone from May 2005 to March 2010 (Figure 8A,C and Figure 9). An optimum positive LOS movement was detected near the area where the D1b fault and D2 fault overlap, particularly near their northwest and southeast terminations, to form a relay damaged zone. Moreover, further to the southeast, the graben includes an extensional imbrication fan geometry where the two broadband seismic sites AD16 and AD17 are situated.
Similarly, the positive LOS of displacement from the descending tract 006 signal was attained also at other GPS locations [39,41], especially at AO35, FARA and GELE (Figure 8A,D), detecting comparatively horizontal movements ~11.5 VE with respect to Nub, ~13.64 VE with respect to Nub and ~11.95 VE with respect to Nub, respectively. Hence, our InSAR time-series displacement rate is in accord with the ~13.7 mm VE with respect to Nub per year GPS velocities at and between the Kadda Dobi and Gumma grabens (DOIW and A035), and the velocity north of the Gumma graben of ~15.7 mm per year reported by [39,41].
Furthermore, our detailed examination of the surface movement orthogonal to rift axis detects a downward, vertical, cumulative surface deformation that spans from 10 October 2007 to 10 August 2010 (Figure 9). We also noticed that the strain’s distribution is significantly accommodated near the imbrication zone, which is intensely dissected with numerous normal faulting occurrences at the southeast portion of the Dobi graben, with the presence of continuous subsidence up to ~20 mm/year. The extensional imbrication zone is ~4.2 km in width, formed from individual, crescent-shaped, basaltic blocks ~2.5 km long and 0.5 km wide and bounded by steep, SW-dipping faults. South of the extensional imbrication fan, D1b constitutes a single fault plane steeply dipping to the northeast.
The maximum downward vertical movement exhibited near AD17 in the southeast Dobi is further characterized with associated obliquely creeping second-order faults that presumably play a crucial role in distributing the strain from the southeast portion of Dobi towards the Kambortha graben (Figure 6A and Figure 8A).

4. Discussion

We begin discussing our work by explaining that the ASAR interferometry measurement detection signal is only one dimension of the LOS surface deformation component. However, we can resolve this unidirectional LOS to the actual direction of displacement by combining two acquisition geometries: in our case, the ascending tract 257 and the descending tract 006 (Figure 6 and Figure 8). The surface movements in both geometries can be identified because the same signs of LOS value indicate predominantly vertical movements: positive for uplifting and negative for subsidence. Additionally, opposite signs of horizontal movement values in both geometries suggest that the movement is from East to West (or vice versa).
For example, the result from the ascending tract 257 exhibited a negative LOS in millimeters in the Gumma graben, Siyarrou horst, Isso Dedat horst and Kambourta, whereas the same region showed a positive LOS in millimeters as shown in the descending tract 006. Hence, considering the opposite signs of LOS movements from tract 257 and tract 006, the InSAR signal attained at most GPS sites such as AO35, FARA and GELE [39,41] of Region 2 presumably illustrates horizontal movement to the NW direction. Region 2 also includes the southwest dipping faults (K1b and K1a) and northeast dipping fault (K2), showing an opposite sense of movement with respect to LOS and having a proxy dip component of 15 mm/year. The sense of surface movement perceived in this region is likely due to the presence of dip-slip components on faults K1b and K1a in addition to the possible dextral en échelon fault segments that strike in N110°E ± 10°. The NW-trending maximum displacement signal traced from our LOS time-series analysis is consistent with a number of deformational mechanisms which have been proposed to describe the evolution of the Dobi graben and other northwest-trending grabens in the central Afar [1,2,15,20,21,25,26,30,41,42,44,45].
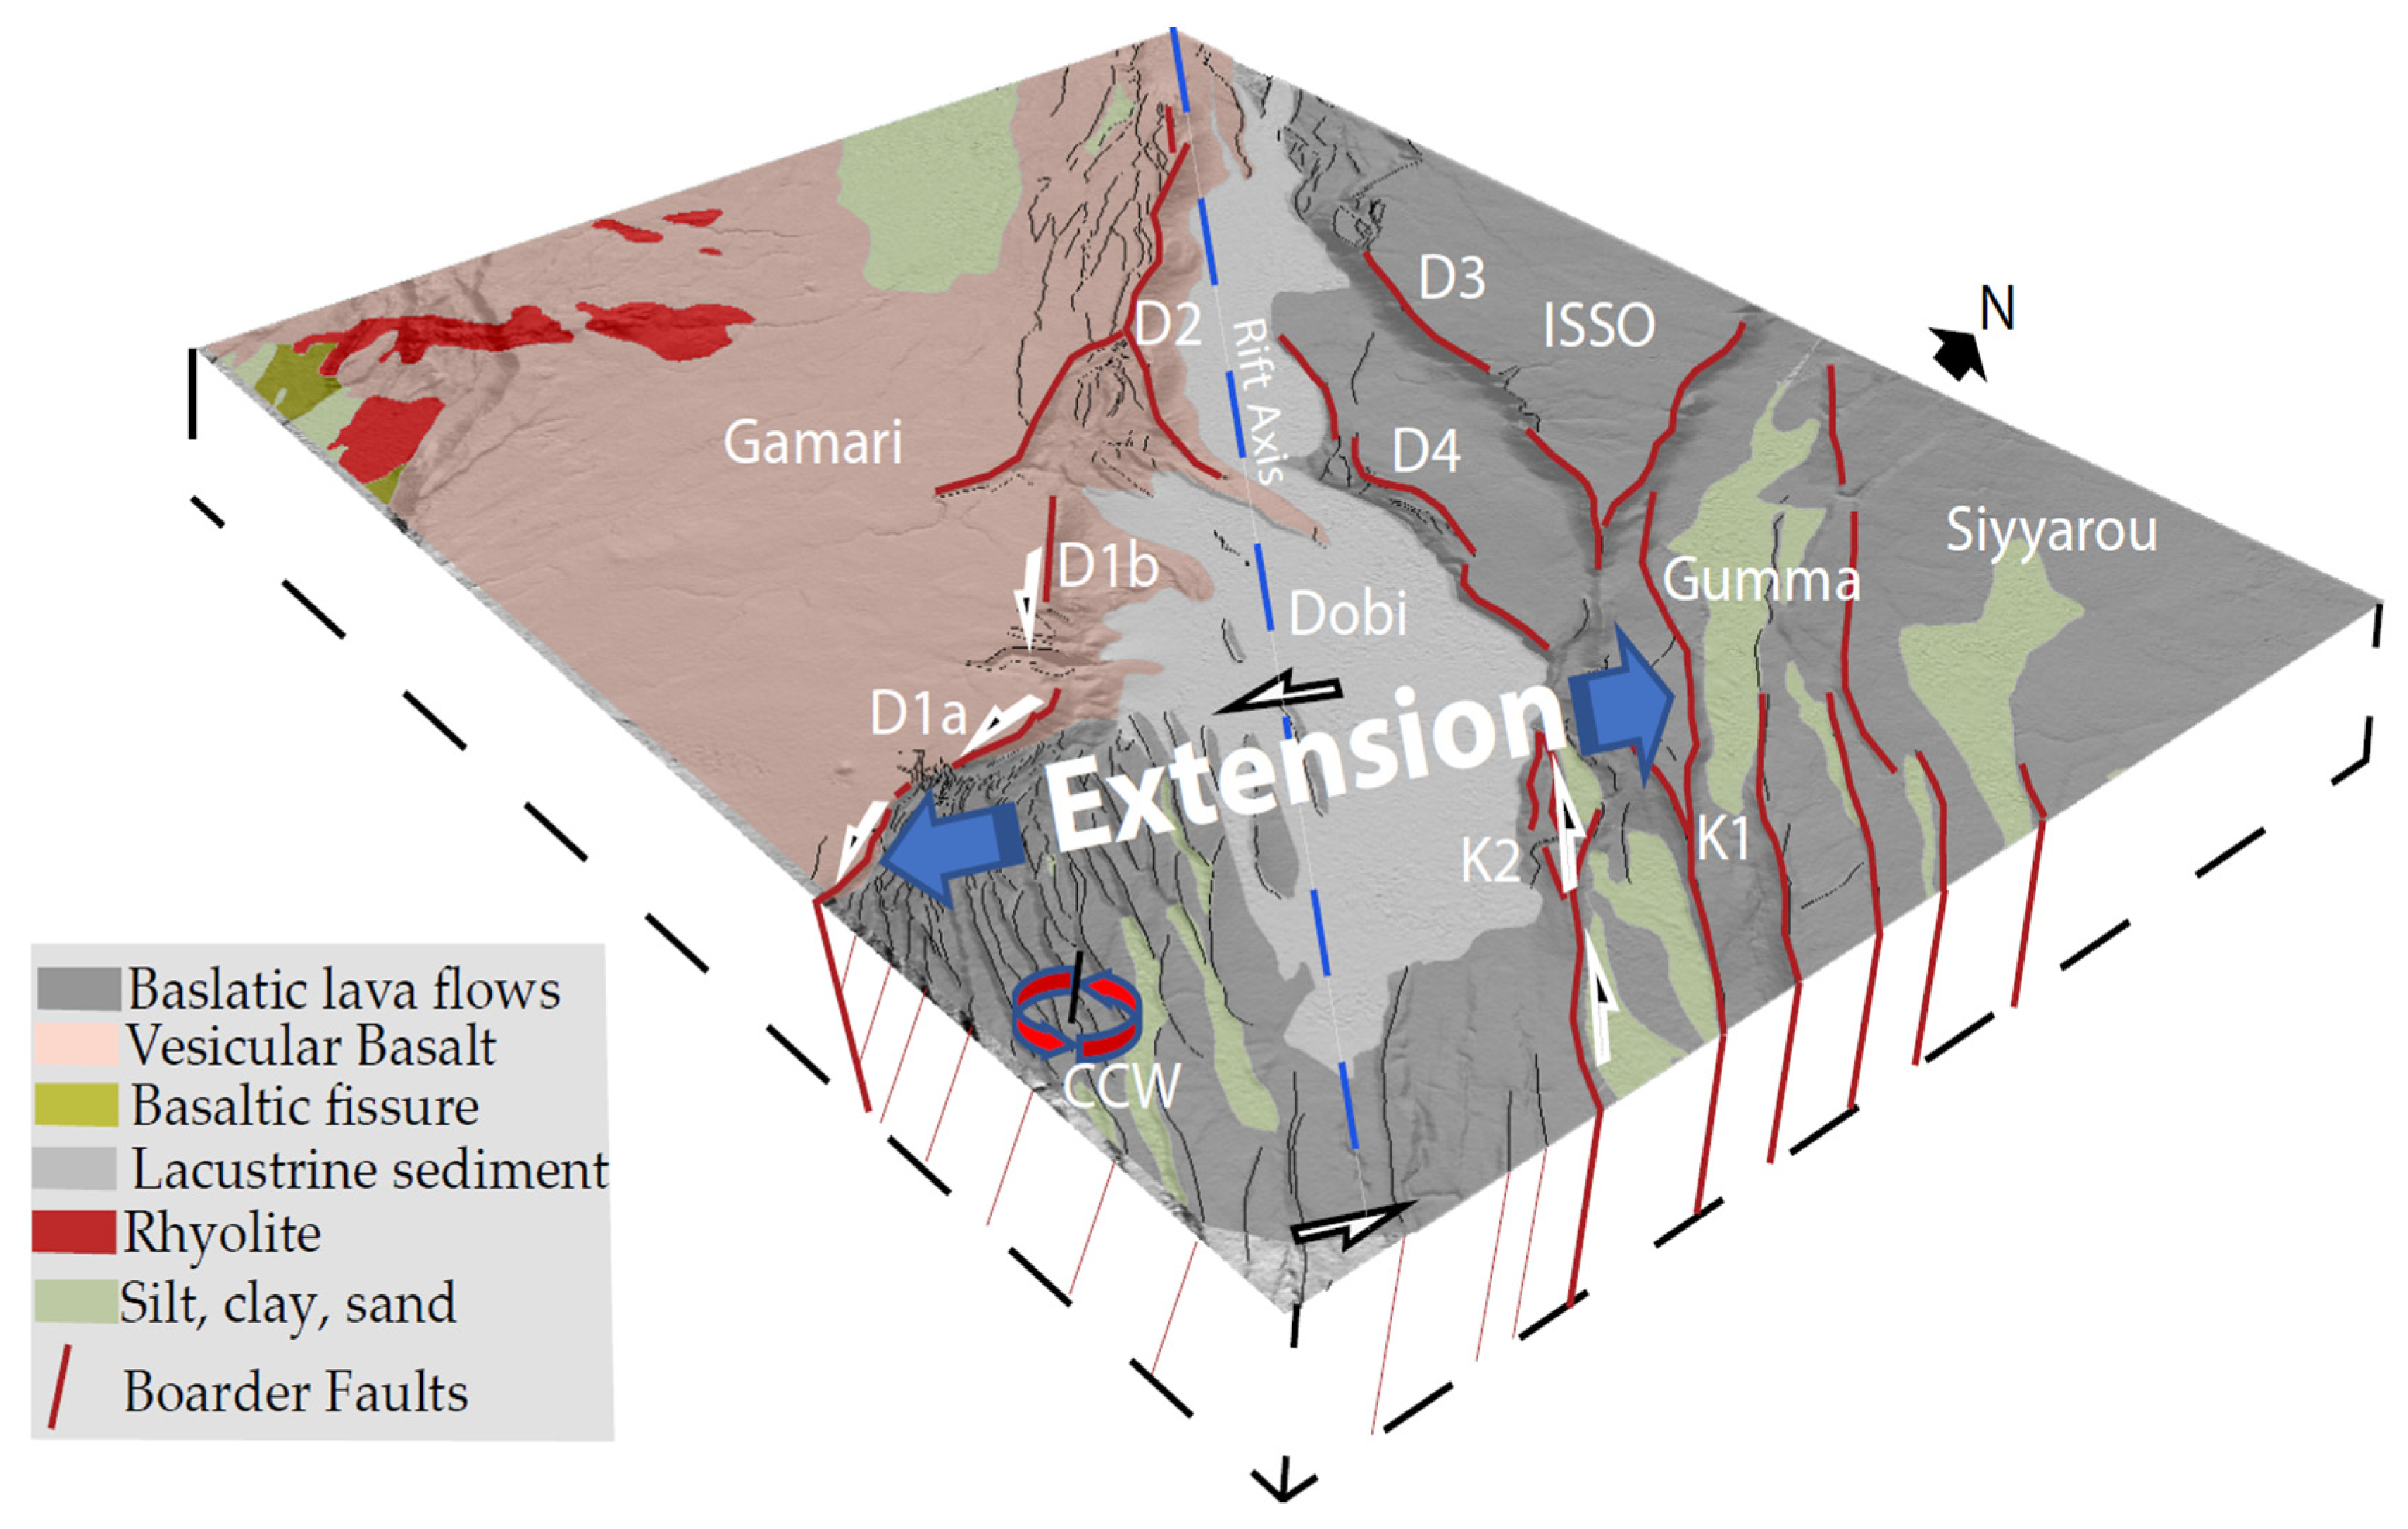
On the contrary, Region 1, which comprises the southeast and southwest portions of the Dobi graben (encompasses the available GPS site locations OTTA, DOSW, OVLK and DOIW and the broadband seismic sites AD17 and AD18), exhibited a positive LOS sign of movement in both the ascending and the descending tract. The detected displacement mechanism can be interpreted as the surface of this region is moving to the southeast (Figure 6 and Figure 8). For instance, consider the maximum slip that is accommodated at the northeast termination of the D1a fault. The strain accommodation suggested the tendency of the fault plane to slip laterally toward the southeast. In addition to the possible lateral slip component, the fault D1a also exhibits an extensional dip-slip component toward the 110° ± 10° intra-basinal fault. Additionally, the lateral slip components along the 110° ± 10° intra-basinal faults also tended to move toward D1a (see pockets of the negative LOS at the imbrication zone, Figure 2, Figure 6A and Figure 8A). However, the D1a fault plane acted as a barrier on the 110° ± 10° intra-basinal faults from further slippage because of insufficient room in the area (Figure 10), which resulted in substantial friction among blocks and a comparative encroachment of D1a into the region. Consequently, the northwestern tip of D1a was forced to move SE, which commenced a sinistral shear couple at both ends of D1a (Figure 2, Figure 6A, Figure 8A and Figure 10). These sinistral shear couples then sheered orthogonal to the N30°E extension direction to alleviate the space/room problem in the imbrication fan region (Figure 10). The presence of a sinistral shear couple at both extreme ends of the D1a fault segment presumably caused the D1a and the multiple N110°E-trending parallel second-order fault planes to slightly rotate counter-clockwise about the vertical axis. This slight counter-clockwise rotation might have resulted in Supplementary, left-lateral, strike-slip movements detected on the northeast-dipping D1a and D1b and the right-lateral strike-slip movements seen on the second order N110°E ± 10° striking faults, the K1 and K2 faults, respectively (Figure 2, Figure 6A, Figure 8A and Figure 10). Moreover, the paleomagnetic study [3] also indicated that blocks surrounding the extensional imbrication zone area had not rotated considerably as compared to the surrounding rift structures found in the Central Afar (Gamarri Tear zone, −2.4° ± 8.0°; Galafi–Kadda Hawli area, −1.3° ± 7.8°); these findings are in agreement with the slight counter-clockwise rotation interpretation described above. [12] also specified that the extensional imbrication zone may be subjected to a local counter-clockwise rotation, which is different from that of the larger-scale regional clockwise rotation presented in the Central Afar.
Furthermore, our detailed examination of the rift-perpendicular surface movement using both the descending tract 006 and the ascending tract 257 indicated the presence of possible dip-slip components that contribute to vertical displacements that spanned during the time-series acquisition periods (Figure 6 and Figure 8). The maximum downward vertical movement is exhibited near AD17 and the SW-dipping second-order, intra-basinal fault strikes between N110°E ± 10°E [12]. This fault represents the northeastern boundary of the Dobi-Hanle accommodation and strain distribution zone with numerous small normal intra-basinal faults that form this extensional imbrication zone and distributed strain from the southeast to northeast. We also found that the strain distribution is obliquely lateral to the regional extensional direction (N30°E). Moreover, these positive LOS signals also exhibited a relatively distinct LOS high-and-low stripping pattern, which is likely characterized by numerous closely spaced and relatively small offset faults’ scarps. These small normal faults are distributed across the imbrication zone with fault profile geometries showing maximum displacement at the points where their lateral strain propagation is arrested. The distribution of these small normal faults’ offsets is consistent with the explanation provided for these narrow, non-volcanic grabens, such as the Dobi, Hanle and Guma grabens, which is presumably a transfer strain from the southernmost RSR to central Afar [1,2,15,16,21,26,30,41,46].
Both the ascending and descending tract ASAR displacement analyses assume crustal thinning and extension are associated with normal faulting, which is reactivated through repeated episodes of tensile stress releases and is responsible for the ongoing deformation. Our results mainly highlighted that the Dobi graben is primarily associated with significant extensional boundary faults linked by a series of extensional accommodation domains such as the Dobi relay zone, southeast of the imbrication zone, Kambourta graben and northeast of the Hanle graben where the general structural architecture is linked by a series of extensional faults bounded by a rift-perpendicular zone of shear. Furthermore, a continuous, traced pattern of the positive LOS oblique to the normal faults, which were observed striking uninterruptedly in the northeast direction, might indicate the transfer of strain as a distribution of deformation from the southernmost RSR, which is also supported by the northeast migration of the triple junction’s argument.

5. Conclusions

Results from our InSAR analyses suggest that the extension processes in the Dobi graben and its vicinity are influenced by the differential stress distributed from the southern segments of the RSR. Creeping, associated mostly with normal faulting, causes subsidence in the graben, and strain is distributed obliquely across the rift axis. Our study yields a plausible, if not unique, scenario for the oblique, positive LOS signals observed in different parts of the Dobi graben which are especially associated with normal faults, indicating that strain is localized as a fault displacement (subsidence). Therefore, the results from our analyses, using high-resolution ASAR data along the active rift of the Dobi graben and the surrounding area, provide a unique opportunity to understand the role of the weak slip strain on the present-day Dobi graben and the surrounding area deformation.
Our results mainly highlighted that the Dobi graben is mostly associated with the major extensional boundary faults linked by a series of extensional accommodation domains such as the Dobi relay zone, southeast of the imbrication zone, the Kambourta graben and northeast of the Hanle graben where the general structural architecture is linked by a series of extensional faults bounded by a rift-perpendicular zone of shear.

6. Patents

This section is not mandatory but may be added if there are patents resulting from the work reported in this manuscript.

Supplementary Materials

The following supporting information can be downloaded at: https://www.mdpi.com/article/10.3390/rs14081845/s1. File S1A: Parameters used to form a Single Look Complex (SLC), Descending orbit 006; File S1B: Parameters used to form a Single Look Complex (SLC), Ascending orbit 257; File S2A: Interferogram Ascending; File S2B: Interferogram Reflat Ascending; File S3A: interferogram Descending; File S3B: interferogram Reflat Descending; File S4: Statistical characterization to explain the geometrical interval classification of Figure 8A in depth; File S5: Detailed statistical description of Figure 9A,B.

Author Contributions

Conceptualization, Z.S.D.; methodology, Z.S.D.; software, Z.S.D.; validation, Z.S.D.; formal analysis, Z.S.D.; investigation, Z.S.D.; resources, Z.S.D.; data curation, Z.S.D.; writing—original draft preparation, Z.S.D.; writing—review and editing, Z.S.D. and G.R.; funding acquisition Z.S.D. All authors have read and agreed to the published version of the manuscript.

Funding

This research received no external funding.

Acknowledgments

We are grateful to our colleagues from Wichita State University, Oklahoma State University and Addis Ababa University who read the draft manuscript and provided comments that greatly assisted the research and greatly improved the manuscript. This is Wichita State University Department of Geology’s contribution # 2022-01. This work was supported by the Wichita State University, Department of Geology.

Conflicts of Interest

The authors declare no conflict of interest.

References

  1. Tapponnier, P.; Armijo, R.; Manighetti, I.; Courtillot, V. Bookshelf faulting and horizontal block rotations between overlapping rifts in Southern Afar. Geophys. Res. Lett. 1990, 17, 1–4. [Google Scholar] [CrossRef]
  2. Manighetti, I.; Tapponnier, P.; Courtillot, V.; Gallet, Y.; Jacques, E.; Gillot, P.Y. Strain transfer between disconnected, propagating rifts in Afar. J. Geophys. Res. Solid Earth 2001, 106, 13613–13665. [Google Scholar] [CrossRef]
  3. Kidane, T.; Courtillot, V.; Manighetti, I.; Audin, L.; Lahitte, P.; Quidelleur, X.; Gillot, P.-Y.; Gallet, Y.; Carlut, J.; Haile, T. New paleomagnetic and geochronologic results from Ethiopian Afar: Block rotations linked to rift overlap and propagation and determination of a ~2 Ma reference pole for stable Africa. J. Geophys. Res. 2003, 108, 2102. [Google Scholar] [CrossRef] [Green Version]
  4. Demissie, Z.S.; Kevin, M.; Bridges, D.; Abdelsalam, M.G.; Atekwana, E.A. Upper lithospheric structure of the Dobi graben, Afar Depression from magnetic and Gravity data. J. Afr. Earth Sci. 2018, 147, 136–151. [Google Scholar] [CrossRef]
  5. Buck, W.R. Modes of continental lithospheric extension. J. Geophys. Res. 1991, 96, 20161–20178. [Google Scholar] [CrossRef]
  6. Buck, W.R. Consequences of Asthenospheric Variability on Continental Rifting, in Rheology and Deformation of the Lithosphere at Continental Margins; Columbia University Press: New York, NY, USA, 2004; Volume 62, pp. 1–30. [Google Scholar]
  7. Buck, W.R. The role of magma in the development of the Afro-Arabian Rift System. Geol. Soc. Lond. Spec. Publ. 2006, 259, 43–54. [Google Scholar] [CrossRef]
  8. Corti, G.; Bonini, M.; Conticelli, S.; Innocenti, F.; Manetti, P.; Sokoutis, D. Analogue modelling of continental extension: A review focused on the relations between the patterns of deformation and the presence of magma. Earth Sci. Rev. 2003, 63, 169–247. [Google Scholar] [CrossRef]
  9. Grandin, R.; Socquet, A.; Jacques, E.; Mazzoni, N.; de Chabalier, J.-B.; King, G.C.P. Sequence of rifting in Afar, Manda-Hararo rift, Ethiopia, 2005–2009: Time-space evolution and interactions between dikes from interferometric synthetic aperture radar and static stress change modeling. J. Geophys. Res. 2010, 115, B10413. [Google Scholar] [CrossRef] [Green Version]
  10. Belachew, M.; Ebinger, C.; Cote, D.; Keir, D.; Rowland, J.V.; Hammond, O.S.; Ayele, A. Comparison of dike intrusions in an incipient seafloor-spreading segment in Afar, Ethiopia: Seismicity perspectives. J. Geophys. Res. 2011, 116. [Google Scholar] [CrossRef] [Green Version]
  11. Ebinger, C.; van Wijk, J.J.; Keir, D. The time scales of continental rifting: Implications for global processes. Geol. Soc. Am. Spec. 2013, 500, 371–396. [Google Scholar] [CrossRef]
  12. Jacques, E.; Kidane, T.; Tapponnier, P.; Manighetti, I.; Gaudemer, Y.; Meyer, B.; Ruegg, J.C.; Audin, L.; Armijo, R. Normal faulting during the August 1989 earthquakes in Central Afar: Sequential triggering and propagation of rupture along the Dobi Graben. Bull. Seismol. Soc. Am. 2011, 101, 994–1023. [Google Scholar] [CrossRef]
  13. Pagli, C.; Yun, S.; Ebinger, C.; Keir, D.; Wang, H. Strike-slip tectonics during rift linkage. Geology 2019, 47, 31–34. [Google Scholar] [CrossRef]
  14. Acocella, V.; Yoshida, T.; Yamada, R.; Funiciello, F. Structural control on late Miocene to Quaternary volcanism in the NE Honshu arc, Japan. Tectonics 2008, 27. [Google Scholar] [CrossRef]
  15. Manighetti, I.; Tapponnier, P.; Gillot, P.Y.; Jacques, E.; Courtillot, V.; Armijo, R.; Ruegg, J.-C.; King, G. Propagation of rifting along the Arabia-Somalia plate boundary: Into Afar. J. Geophys. Res. Solid Earth 1998, 103, 4947–4974. [Google Scholar] [CrossRef]
  16. McKenzie, D.P.; Davies, D.; Molnar, P. Plate tectonics of the Red Sea and East Africa. Nature 1970, 226, 243–248. [Google Scholar] [CrossRef]
  17. Barberi, F.; Varet, J. The Erta Ale volcanic range (Danakil depression, northern Afar, Ethiopia). Bull. Volcanol. 1970, 36, 848–917. [Google Scholar] [CrossRef]
  18. Acton, G.D.; Stein, S.; Engeln, J. Block rotation and continental extension in Afar: A comparison to oceanic microplate systems. Tectonics 1991, 10, 501–526. [Google Scholar] [CrossRef]
  19. Eagles, G.; Gloaguen, R.; Ebinger, C. Kinematics of the Danakil microplate. Earth Planet. Sci. Lett. 2002, 203, 607–620. [Google Scholar] [CrossRef] [Green Version]
  20. Courtillot, E.V. Opening of the Gulf of Aden and Afar by progressive tearing. Phys. Earth Planet. 1980, 21, 343–350. [Google Scholar] [CrossRef]
  21. Souriot, T.; Brun, J.P. Faulting and block rotation in the Afar triangle: The Danakil “crank arm” model. Geology 1992, 20, 911–914. [Google Scholar] [CrossRef]
  22. Collet, B.; Taud, H.; Parrot, J.F.; Bonavia, F.; Chorowicz, J. A new kinematic approach for the Danakil block using a Digital Elevation Model representation. Techtonophysics 2000, 316, 343–357. [Google Scholar] [CrossRef]
  23. Lahitte, P.; Gillot, P.-Y.; Kidane, T.; Courtillot, V.; Bekele, A. New age constraints on the timing of volcanism in central Afar, in the presence of propagating rifts. J. Geophys. Res. 2003, 108, 2123. [Google Scholar] [CrossRef]
  24. Garfunkel, Z.; Beyth, M. Constraints on the structural development of Afar imposed by the kinematics of the major surrounding plates, in The Afar Volcanic Province within the East African Rift System. Geol. Soc. Lond. Spec. Publ. 2006, 259, 23–42. [Google Scholar] [CrossRef]
  25. Mohr, P.A. Ethiopian rift and plateaus: Some volcanic petrochemical differences. J. Geophys. Res. 1971, 76, 1967–1984. [Google Scholar] [CrossRef] [Green Version]
  26. Abbate, E.; Passerini, P.; Zan, L. Strike-slip faults in a rift area: A transect in the Afar Triangle, East Africa. Tectonophysics 1995, 241, 67–97. [Google Scholar] [CrossRef]
  27. Hoffstetter, R.; Beyth, M. The Afar Depression: Interpretation of the 1960-2000 earthquakes. Geophys. J. Int. 2003, 155, 715–732. [Google Scholar] [CrossRef] [Green Version]
  28. McClusky, S.; Reilinger, R.; Ogubazghi, G.; Amleson, A.; Healeb, B.; Vernant, P.; Kogan, L. Kinematics of the southern Red Sea-Afar Triple Junction and implications for plate dynamics. Geophys. Res. Lett. 2010, 37. [Google Scholar] [CrossRef] [Green Version]
  29. Saria, E.; Calais, E.; Stamps, D.; Delvaux, D.; Hartnady, C. Present-day kinematics of the East African Rift. J. Geophys. Res. 2014, 119, 3584–3600. [Google Scholar] [CrossRef]
  30. Hayward, N.J.; Ebinger, C.J. Variations in the along-axis segmentation of the Afar Rift system. Tectonics 1996, 15, 244–257. [Google Scholar] [CrossRef]
  31. Doubre, C.; Peltzer, G. Fluid-controlled faulting process in the Asal Rift, Djibouti, from 8 yr of radar interferometry observations. Geology 2007, 35, 69–72. [Google Scholar] [CrossRef]
  32. Bridges, D.L.; Mickus, K.; Gao, S.S.; Abdelsalam, M.G.; Alemu, A. Magnetic stripes of a transitional continental rift in Afar. Geology 2012, 40, 203–206. [Google Scholar] [CrossRef]
  33. Berardino, P.; Fornaro, G.; Lanari, R.; Sansosti, E. A new algorithm for surface deformation monitoring based on small baseline differential SAR interferograms. IEEE Trans. Geosci. Remote Sens. 2002, 40, 2375–2383. [Google Scholar] [CrossRef] [Green Version]
  34. Vassileva, M.; Tonolo, F.G.; Riccardi, P.; Lecci, D.; Boccardo, P.; Chiesa, G. Satellite SAR interferometric techniques in support to emergency mapping. Eur. J. Remote Sens. 2017, 50, 464–477. [Google Scholar] [CrossRef] [Green Version]
  35. Hooper, A.; Segall, P.; Zebker, H. Persistent scatterer interferometric synthetic aperture radar for crustal deformation analysis, with application to Volcán Alcedo, Galápagos. J. Geophys. Res. 2007, 112. [Google Scholar] [CrossRef] [Green Version]
  36. Ghulam, A.; Grzovic, M.; Maimaitijiang, M.; Sawut, M. InSAR monitoring of land subsidence for sustainable urban planning. In Remote Sensing for Sustainability; Weng, Q., Ed.; CRC Press: Boca Raton, FL, USA, 2016. [Google Scholar]
  37. Peltzer, G.; Crampe, F.; Hensley, S.; Rosen, P. Transient strain accumulation and fault interaction in the Eastern California shear zone. Geology 2001, 29, 975–978. [Google Scholar] [CrossRef]
  38. Costantini, M.; Falco, S.; Malvarosa, F.; Minati, F. A New Method for Identification and Analysis of Persistent Scatterers in Series of SAR Images. IEEE Trans. Geosci. Remote Sens. 2008, 2, II-449. [Google Scholar] [CrossRef]
  39. Deprez, A.; Doubre, C.; Masson, F.; Ulrich, P. Erratum: Seismic and aseismic deformation along the East African Rift System from a reanalysis of the GPS velocity field of Africa. Geophys. J. Int. 2015, 200, 556. [Google Scholar] [CrossRef] [Green Version]
  40. Sarmap. Getting Started with SARscape for Windows. Available online: https://www.sarmap.ch/tutorials/Getting_started.pdf (accessed on 22 February 2022).
  41. Doubre, C.; Deprez, A.; Masson, F.; Socquet, A.; Lewi, E.; Grandin, R.; Nercessian, A.; Ulrich, P.; Chabalier, D.J.; Saad, I.; et al. Current deformation in Central Afar and triple junction kinematics deduced from GPS and InSAR measurements. Geophys. J. Int. 2016, 208, 936–953. [Google Scholar] [CrossRef]
  42. Reed, C.A.; Almadani, S.; Gao, S.; Elsheikh, A.A.; Cherir, S.; Abdelsalam, M.G.; Thurmond, A.K.; Liu, K.H. Receiver function constraints on crustal seismic velocities and partial melting beneath the Red Sea rift and adjacent regions, Afar Depression. J. Geophys. Res. 2014, 119, 2138–2152. [Google Scholar] [CrossRef]
  43. Just, D.; Bamler, R. Phase statistics of interferograms with applications to synthetic aperture radar. Appl. Opt. 1994, 33, 4361–4368. [Google Scholar] [CrossRef]
  44. Jacques, E.; Ruegg, J.C.; Lépine, J.C.; Tapponnier, P.; King, G.C.P.; Omar, A. Relocation of M ≥ 2 events of the 1989 Dôbi seismic sequence in Afar: Evidence for earthquake migration. Geophys. J. Int. 1999, 138, 447–469. [Google Scholar] [CrossRef] [Green Version]
  45. Courtillot, V.; Achache, J.; Landre, F.; Bonhommet, N.; Montigny, R.; Féraud, G. Episodic spreading and rift propagation: New paleomagnetic and geochronologic data from the Afar nascent passive margin. J. Geophys. Res. 1984, 89, 3315–3333. [Google Scholar] [CrossRef]
  46. Gupta, A.; Scholz, H.C. Brittle strain regime transition in the Afar depression: Implications for fault growth and seafloor spreading. Geology 2000, 28, 1087–1090. [Google Scholar] [CrossRef] [Green Version]
Figure 1. (A) Digital elevation model of Africa. The mint-colored area represents the region affected by the East Africa Rift System, and the small red polygon in the Horn of Africa represents the Afar Depression; (B) The EARS. The northern tip is the AD comprised by the East Central Block (ECB) in the center. The eastern and the western branch of the EARS exist south of MER; (C) Tectonic framework of the Afar Depression (AD) shown in Shuttle Radar Topographic Mission (SRTM) digital elevation model (DEM). The white rectangle is a polygonal inset of the study area that includes the Dobi graben and its associated tectonic settings. Solid red lines indicate major rift propagators, mainly the Red Sea Rift (RSR) and Gulf of Aden Rift (GAR). The element of rifts’ and blocks’ structures in the AD are represented by black lines and second-order faults with gray lines [2]. Clockwise rotation of the NW-trending blocks [3] are displayed with black curve arrow lines, and both NE- and SW-directed, dextral, strike-slip shear-couples are indicated with broad gray colored arrow lines.
Remotesensing 14 01845 g001
Figure 2. Structural map of the Dobi graben produced from the interpretation of 0.46 m spatial resolution panchromatic images collected by Worldview-2 satellite and 1-arc second (30 m) Shuttle Radar Topography Mission’s (SRTM) digital elevation model (DEM). Light blue polygon represents the portion of the ascending tract 257 orbit considered and the orange polygon represent the descending 006 tract. The ticked red line represents the first-order normal faults that bound the graben, while the gray line represents the second-order normal fault. The orange dot points represent the available GPS sites in the region and the light green stars represent the broadband seismic data of the Reciver Function. The nomenclature of the faults is strictly adopted after that of [12].
Remotesensing 14 01845 g002
Figure 3. Small Baseline Algorithm (SBA) network representing a master and slaves interferogram that are linked to each other only when the normal and temporal baseline values are within the input thresholds. (A,B) show the descending tract 006 orbit connection graph representing all the ASAR co-registered to the 10 October 2007 acquisition date, anticipated as a super master image; (C,D) show the ascending tract 257 orbit connection graph representing all the ASAR co-registered to the 9 January 2007 acquisition date anticipated as a super master image.
Remotesensing 14 01845 g003
Figure 4. The quality of the InSAR results from ascending tract 257 needed to be checked using several indices: (A) The Root Mean Square Error (RMSE); (B) Height Precision (HP); (C) Velocity Precision (VP) and (D) multi-temporal interferometric coherence.
Remotesensing 14 01845 g004
Figure 5. The quality of the InSAR results from descending tract 006 needed to be checked using several indices: (A) The Root Mean Square Error (RMSE); (B) Height Precision (HP); (C) Velocity Precision (VP) and (D) multi-temporal interferometric coherence, where the red-colored area is highly coherent. All the quality-control indices have a direct link to the quality of the phase-changes in both the ascending and descending tracts.
Remotesensing 14 01845 g005
Figure 6. (A) The mean velocity at the LOS of the satellite for the ascending tract 257. It is referenced in the scale bar that ~0 mm/year surface deformation is a yellowish color, anything to the right is measured as a positive mean value and the negative mean value is to the left, spanning to a green color; (B) The multidimensional time profiling of the surface displacement velocity for the ascending tract 257 that is referenced temporally in the master scene (9 January 2007): the blue line represents the average of all the pixels confined in Region 1, and the orange line represents the mean LOS velocity derived from all the pixels found in Region 2; (C) The multidimensional time profiling of the surface displacement velocity for all the pixels that consist of the GPS sites in Region 1; (D) The multidimensional time profiling of the surface displacement velocity for all the pixels that consist of the GPS sites in Region 2.
Remotesensing 14 01845 g006
Figure 7. (A) The mean velocity at the LOS of the satellite for the ascending tract 257 before post-GIS processing utilizing the quality control indexes mentioned in Figure 4 for pixel multitemporal coherency; (B) The mean velocity at the LOS of the satellite after extracting the noisy pixels applying the quality control indexes criteria; (C) Time-series displacement measurement corresponding to the measurement (in mm/year) of each scene with respect to the 9 January 2007 master image acquisition. The different colors and symbols represent displacement (in mm/year) along the LOS.
Remotesensing 14 01845 g007
Figure 8. (A) The mean velocity at the LOS of the satellite for the descending tract 006. Surface deformation referenced in the scale bar denotes ~0 mm/year as a yellowish color, anything to the right is measured as positive mean values and the negative mean values are to the left spanning to the green color; (B) The multidimensional time profiling of the surface displacement in mm for the descending tract 006 that is referenced temporally to the master scene (10 October 2007): the blue line represents the average of all the pixels confined in Region 1 and the orange line represents the average displacement in mm derived from all the pixels found in Region 2; (C) The multidimensional time profiling of the surface displacement (mm) for all the pixels that consist of the GPS sites in Region 1; (D) The multidimensional time profiling of the surface displacement for all the pixels that consist of the GPS sites in Region 2. See Supplemental File S4.
Remotesensing 14 01845 g008
Figure 9. (A) The mean velocity at the LOS of the satellite for the descending tract 006, before post-GIS processing utilizing those quality control indexes mentioned in Figure 5 for pixel multitemporal coherency; (B) The mean velocity at the LOS of the satellite after extracting the noisy pixels employing the quality control indexes criteria; (C) Time-series displacement measurement corresponding to the measurement (in mm/year) of each scene with respect to the 9 January 2007 master image acquisition. The different colors and symbols represent displacement (in mm/year) along the LOS. See Supplemental File S5.
Remotesensing 14 01845 g009
Figure 10. Surface displacement model for the Dobi graben, presumably interpreted as deformation resembling bookshelf faulting, the vertical counterclockwise rotation resulting from differential strain transfer between right-stepping Dobi and Hanle grabens to Dobi fault D1. Halo black arrows exerted a shear couple at the NW-trending normal fault, which exhibited locally sinistral strike-slip shear.
Remotesensing 14 01845 g010
Publisher’s Note: MDPI stays neutral with regard to jurisdictional claims in published maps and institutional affiliations.