Article

Design of an FPGA-Based High-Quality Real-Time Autonomous Dehazing System

Department of Electronics Engineering, Dong-A University, Busan 49315, Korea
*
Author to whom correspondence should be addressed.
These authors contributed equally to this work.
Remote Sens. 2022, 14(8), 1852; https://doi.org/10.3390/rs14081852
Submission received: 7 March 2022 / Revised: 28 March 2022 / Accepted: 8 April 2022 / Published: 12 April 2022
(This article belongs to the Section Remote Sensing Image Processing)

Abstract

:
Image dehazing, as a common solution to weather-related degradation, holds great promise for photography, computer vision, and remote sensing applications. Diverse approaches have been proposed throughout decades of development, and deep-learning-based methods are currently predominant. Despite excellent performance, such computationally intensive methods as these recent advances amount to overkill, because image dehazing is solely a preprocessing step. In this paper, we utilize an autonomous image dehazing algorithm to analyze a non-deep dehazing approach. After that, we present a corresponding FPGA design for high-quality real-time vision systems. We also conduct extensive experiments to verify the efficacy of the proposed design across different facets. Finally, we introduce a method for synthesizing cloudy images (loosely referred to as hazy images) to facilitate future aerial surveillance research.

Graphical Abstract

1. Introduction

Image acquisition, for example outdoor imaging and remote sensing, is highly problematic owing to numerous natural factors, notably bad weather conditions. Under these adverse effects, acquired images are subject to various types of degradation, ranging from color distortion to visibility reduction. Consequently, high-level computer vision algorithms—which generally assume clean input images—may incur a sharp drop in performance, creating great demand for visibility restoration, as can be seen by the rapid development of myriad algorithms for image dehazing, deraining, and desnowing over the past two decades. In this paper, we restrict the discussion to image dehazing because haze (or equivalently fog) appears to be more prevalent than rain and snow. Furthermore, as haze and cloud originate from atmospheric scattering and absorption, image dehazing algorithms also find applications in remote sensing.

1.1. Image Dehazing in Remote Sensing

Remote sensing applications such as aerial surveillance, battlefield monitoring, and resource management fundamentally impact on many aspects of modern society, including transportation, security, agriculture, and so on. Despite their crucial importance, these applications are prone to failure in areas of cloud cover, because light waves are subject to atmospheric scattering and absorption when traversing cloud banks. As a result, remotely sensed images become unfavorable for subsequent high-level applications, rendering image dehazing highly relevant for visibility restoration.
For example, Figure 1 demonstrates the negative effects of cloud and the beneficial effects of image dehazing on an aerial surveillance application. Specifically, Figure 1a is a clean image from the Aerial Image Dataset (AID) [1], and Figure 1b is its corresponding synthetic cloudy image. Cloud is synthesized herein due to the sheer impracticality of remotely sensing the same area in two different weather conditions. We will discuss synthetic cloud generation in detail in Section 4.2.2. Figure 1c is the result of dehazing Figure 1b using a recent algorithm developed by Cho et al. [2]. The three images on the second row are the final outcomes of processing Figure 1a–c with a YOLOv4-based object recognition algorithm [3]. In addition, it is noteworthy that the haziness degree evaluator (HDE) [4] serves as a basis for discriminating Figure 1a as a clean image.
It can be observed that the recognition algorithm detected nine airplanes from the clean image in Figure 1a. In contrast, the number of detected airplanes in Figure 1e was significantly lower. The detection rate dropped 66.67 % from nine to three detected airplanes. This observation implies that bad weather conditions such as cloud and haze have a negative impact on high-level remote sensing applications.
To address this problem, we preprocessed the synthetic cloudy image using a dehazing algorithm developed by Cho et al. [2]. As Figure 1c shows, the visibility improved; however, the airplane under the dense veil of cloud remains obscured. The corresponding detection result in Figure 1f demonstrates a considerable increase ( 133.33 % ) in detection rate from three (in Figure 1e) to seven detected airplanes. This observation, in turn, implies the crucial importance of image dehazing in remote sensing applications.
However, another issue arises regarding whether to apply image dehazing, because cloud occurs occasionally, while most image dehazing algorithms assume a hazy/cloudy input. Obviously, dehazing a clean image results in untoward degradation, as Figure 2 demonstrates. Although the dehazed image in Figure 2b appears to be passable, without any noticeable distortion, its corresponding detection results in Figure 2d exhibit a sharp drop ( 66.67 % ) in detection rate from nine to three detected airplanes. The algorithm also misrecognized two airplanes as birds compared to only one misrecognition in Figure 2c. This example, coupled with the previous one, emphasizes the need for an autonomous image dehazing algorithm.

1.2. Real-Time Processing

Remotely sensed images usually possess high resolution, leading to a computationally heavy burden for subsequent algorithms. For example, the S-65A35 camera of the SAPPHIRE series, widely available on aerial surveillance systems, can deliver a superb resolution of 9344 × 7000 pixels at 35.00 frames per second (fps) [5]. As a result, virtually every embedded surveillance system downscales the acquired image sequence to a reasonable size before supplying the sequence to other algorithms, for computational efficiency and to enable real-time processing. A good example of this is an aerial surveillance system known as ShuffleDet [6], which downscales the input image to a resolution of 512 × 512 to achieve a processing speed of 14.00 fps.
Regarding the implementation of image dehazing, the software implementation per se usually fails to meet the real-time processing requirement. To support this claim, we adopt Table 1 from Ngo et al. [7]. The authors measured the processing time of nine algorithms [2,7,8,9,10,11,12,13,14] whose source code is publicly available, for different image resolutions. The simulation environment in this study was MATLAB R2019a, and the host computer was equipped with an Intel Core i9-9900K (3.6 GHz) CPU, with 64 GB RAM, and an Nvidia TITAN RTX graphics computing unit (GPU). The run-time evaluation in Table 1 demonstrates that none of the nine algorithms could deliver real-time processing. Even with such a small resolution as 640 × 480 , the fastest algorithm, developed by Zhu et al. [11], exhibited a processing speed of 4.55 fps (≈1/0.22), approximately one fifth of the required speed of 25.00 fps.
Hence, there are currently two main approaches toward real-time processing. The first approach aims to reduce the development time by focusing on flexibility, portability, and programming abstraction. Under this approach, the embedded system usually needs to be equipped with powerful computing platforms such as GPUs and low-power GPUs. In the previous example of ShuffleDet, Azimi [6] presented an implementation on the Nvidia Jetson TX2 board including a low-power GPU named Tegra X2 [15]. Although this approach can meet the growing demand for high computing performance, it is not the best choice compared with field-programmable gate arrays (FPGAs), which are at the center of the second approach toward real-time processing. Wielage et al. [16] verified that a Xilinx Virtex UltraScale+ FPGA was 6.5 × faster and consumed 4.3 × less power than the Tegra X2 GPU, to support the preceding claim. For this reason, we present herein an FPGA implementation of an autonomous dehazing system for aerial surveillance.

1.3. Contributions

Our contribution in this paper is threefold:
  • An FPGA-based implementation of an autonomous dehazing algorithm that can satisfactorily handle high-quality clean and hazy/cloudy images in real time.
  • An in-depth discussion of FPGA implementation techniques to achieve real-time processing on high-resolution images (DCI 4K in particular).
  • An efficient method for synthesizing cloudy images from a clean dataset (AID).
The first is attributed to self-calibration on haze conditions, which results from the utilization of the HDE. The second is achieved through a pipelined architecture for improving throughput and a number of design techniques for reducing propagation delay. The third is the desired result of simulating haze/cloud using the low-frequency parts of a random distribution, with the density of synthetic haze/cloud controlled by the HDE. Thus far, it can be observed that the HDE plays an essential role in the proposed system, and therein lies the cause of its limitations, as discussed later in Section 4.3.

2. Literature Review

Image dehazing is a fundamental problem in computer vision, and is rooted in studies on atmospheric scattering and absorption phenomena. As witnessed by the work of Vincent [17] and Chavez [18], early research on image dehazing started five decades ago. Through the long history of development, there have been various approaches to restoring the scene radiance. Polarimetric dehazing [19,20], image fusion [21,22], and image enhancement [7,10] are cases in point. It is also noteworthy that each approach has resulted in hundreds of papers, and therein lies the sheer impracticality of reviewing them all. Consequently, we focus our discussion on the single-image approach that relies on an acquired red–green–blue (RGB) image.
To facilitate understanding of the review, we first briefly formalize the image dehazing problem. Given a hazy RGB image I R H × W × 3 of size H × W , the atmospheric scattering model (ASM) [23] decomposes it into two terms, known as the direct attenuation and the airlight, as Equation (1) shows. Herein, J R H × W × 3 is the scene radiance, t [ 0 , 1 ] H × W is the transmission map, A R 1 × 1 × 3 is the global atmospheric light, and x represents the spatial coordinates of pixels. Direct attenuation and airlight correspond to J t and A ( 1 t ) , respectively. The former signifies the multiplicative attenuation of reflected light waves in the transmission medium, while the latter represents the additive influence of the illumination.
I ( x ) = J ( x ) t ( x ) + A [ 1 t ( x ) ] .
Based on the ASM, most image dehazing algorithms develop two mapping functions f A : R H × W × 3 R 1 × 1 × 3 and f t : R H × W × 3 R H × W that estimate the global atmospheric light and the transmission map, given the input image I . Researchers usually denote these two estimates as A ^ and t ^ , and they restore the scene radiance J by rearranging Equation (1) as follows:
J ( x ) = I A ^ min ( t ^ , t 0 ) + A ^ ,
where a small positive t 0 helps avoid division by zero. Recently, deep learning models have also found an application in image dehazing. Some early models [13,14] also learned the mapping functions f A : R H × W × 3 R 1 × 1 × 3 and f t : R H × W × 3 R H × W , whereas recently developed models [24,25] learned an end-to-end mapping function f J : R H × W × 3 R H × W × 3 . Although image dehazing is achievable in various ways, it is worth recalling that this astonishing operation is a preprocessing step, since this imposes strict requirements on its implementation. A crucial requirement is real-time processing, as discussed in Section 1.2.
According to a recent systematic review [26], image dehazing algorithms in the literature fall into three categories: image processing, machine learning, and deep learning. Table 2 summarizes essential information on each category, and we exemplify them by one or two representative methods in the following sections.

2.1. Representative Single-Image Dehazing Algorithms

The categorization in Table 2 based on the primary technique employed to restore the scene radiance and how the algorithm exploits image data can give an early indication of the real-time processing capability of an image dehazing method. Generally, the first two categories—image processing and machine learning—can handle the input image sequence or video in real time. Conversely, the third category, deep learning, suffers from some practical difficulties in achieving real-time processing.

2.1.1. Image Processing

Image dehazing methods founded on traditional computer vision techniques usually favor human perception [29] because they are rooted in hand-engineered image features such as contrast and saturation, which greatly influence the perceptual image quality. Perhaps the most well-known research in this category is the dark channel prior of He et al. [9], inspired by the dark-object subtraction method of Chavez [18]. He et al. [9] developed f t : R H × W × 3 R H × W from the following two assumptions:
  • The scene radiance J exhibits an extremely dark channel whose intensities approach zero in non-sky patches; 
  • The transmission map t is locally homogeneous.
The first is based on the colorfulness of objects, i.e., one of the color channels should be very low for the color to manifest itself. The second is based on the depth-dependent characteristic of the transmission map. Depth information is mostly smooth except at discontinuities in an image, and so is the transmission map. Mathematically, the equivalent expressions are:
  • min y Ω ( x ) { min c { R , G , B } [ J c ( y ) ] } = 0 , where Ω ( x ) denotes an image patch centered at x, and c denotes a color channel; 
  • min y Ω ( x ) [ t ( y ) ] = t ( x ) .
A transmission map estimate resulting from these two assumptions suffers from block artifacts, rendering a refinement step essential. Accordingly, He et al. [9] utilized soft matting [30]. Despite an excellent dehazing performance, the method of He et al. [9] has two main drawbacks: failures in sky regions and high computational cost. These shortcomings have resulted in a series of follow-up studies [31,32,33].
Regarding the mapping function f A : R H × W × 3 R 1 × 1 × 3 , He et al. [9] developed a robust approach that remains widely used. Under this approach, the top 0.1 % of the brightest pixels in the dark channel of the input image serve as candidates for singling out the atmospheric light. From among these, the pixel with highest intensity in the RGB color space is chosen. Consequently, this approach is fairly robust against the problem of incorrectly selecting white objects as atmospheric light.

2.1.2. Machine Learning

As image dehazing methods from the first category are based on hand-engineered features, they may fail in particular circumstances. A prime example is the fact that the dark channel prior proposed by He et al. [9] does not hold for sky regions. Therefore, some hidden regularities learned from relevant image datasets can improve performance in those cases.
Zhu et al. [11] developed the color attenuation prior in that manner. Through extensive observations on outdoor images, they discovered that the scene depth correlated with saturation and brightness. They then assumed that a linear model sufficed for expressing that correlation and devised the simple expression f t : R H × W × 3 R H × W . Next, they utilized maximum likelihood estimates to find the model’s parameters. The input data consisted of a synthetic dataset with haze-free and corresponding synthesized hazy images. The dehazing method of Zhu et al. [11] was relatively fast and efficient, as were the methods in some of the follow-up studies [28,34,35].
Another notable approach is the learning framework proposed by Tang et al. [27]. This framework comprises two main steps: feature extraction and transmission map inference. Tang et al. [27] implemented the former in a multi-scale manner, and they utilized random forest regression to realize the latter. Many deep learning models developed thereafter bear a fundamental similarity to this framework. Despite an excellent dehazing performance, the implementation of Tang et al. [27] incurs a heavy computational burden, hindering its broad application in practice.

2.1.3. Deep Learning

An early attempt at applying deep learning models to image dehazing can be traced back to the DehazeNet developed by Cai et al. [13]. They adopted a similar approach to that of He et al. [9] to devise the mapping function f A : R H × W × 3 R 1 × 1 × 3 . To estimate the transmission map, they utilized a convolutional neural network (CNN). The CNN’s functionality is similar to that of the learning framework of Tang et al. [27]. The main steps include: (i) feature extraction, (ii) feature augmentation, and (iii) transmission map inference, corresponding to: (i) feature extraction and multi-scale mapping, (ii) local extrema, and (iii) the nonlinear regression presented by Cai et al. [13].
Recently, end-to-end networks that learn the mapping function f J : R H × W × 3 R H × W × 3 have been gaining popularity. These networks are usually based on the encoder–decoder architecture, which has been proven to be highly efficient due to its astonishing ability to learn a robust representation of image features from a low to a high level of abstraction. The FAMED-Net approach developed by Zhang and Tao [24] is a prime example. FAMED-Net is a densely connected CNN whose architecture is designed based upon multi-scale encoders and image fusion. It is also one of a few deep models that can fulfill the real-time processing requirement. Zhang and Tao [24] realized FAMED-Net using a powerful Nvidia Titan Xp, yielding a processing speed of 35.00 fps on 620 × 460 image resolution.

2.2. Summary

Image dehazing has long development history and dates back to the early 1970s. As a result, hundreds of studies have been recorded in the literature. However, it is fortunately unnecessary to review all of them. A recent systematic review [26] collated information from influential studies and categorized the results into image processing, machine learning, and deep learning approaches. This categorization can serve as an early indication of the real-time processing capability of image dehazing algorithms. The first two categories are generally capable, whereas the last one rarely is.
Moreover, most image dehazing methods assume a clean input image, but this assumption is uncertain in practice, rendering an autonomous dehazing method highly relevant. Therefore, we present herein an FPGA-based autonomous dehazing system to fulfill the aforementioned requirements: real-time processing and autonomy.

3. Autonomous Dehazing System

To achieve autonomous dehazing, it is necessary to answer the following questions:
  • How can the haze condition be determined from a single input image?
  • How can an input image be dehazed according to its haze condition?
Regarding the first question, a practical solution is to use a metric such as the HDE. This no-reference metric proportionally quantifies the haze density of the input image and can be considered as the following mapping function f H D E : R H × W × 3 R . Because the HDE yields a normalized score between zero and unity, it is highly appropriate for controlling the dehazing process. Hence, an elegant answer to the second question is to exploit the HDE score to adjust the dehazing power in proportion to the haze condition of the input image.
This idea is the underlying principle of the autonomous dehazing algorithm in [7], which fails to meet the real-time processing requirement, as Table 1 demonstrates. Based on this algorithm, the following first introduces the autonomous dehazing process and then discusses major real-time processing hindrances. After that, Section 3.2 describes in detail the proposed FPGA implementation for surmounting those hindrances, enabling real-time processing for even high-quality (DCI 4K) images.

3.1. Base Algorithm

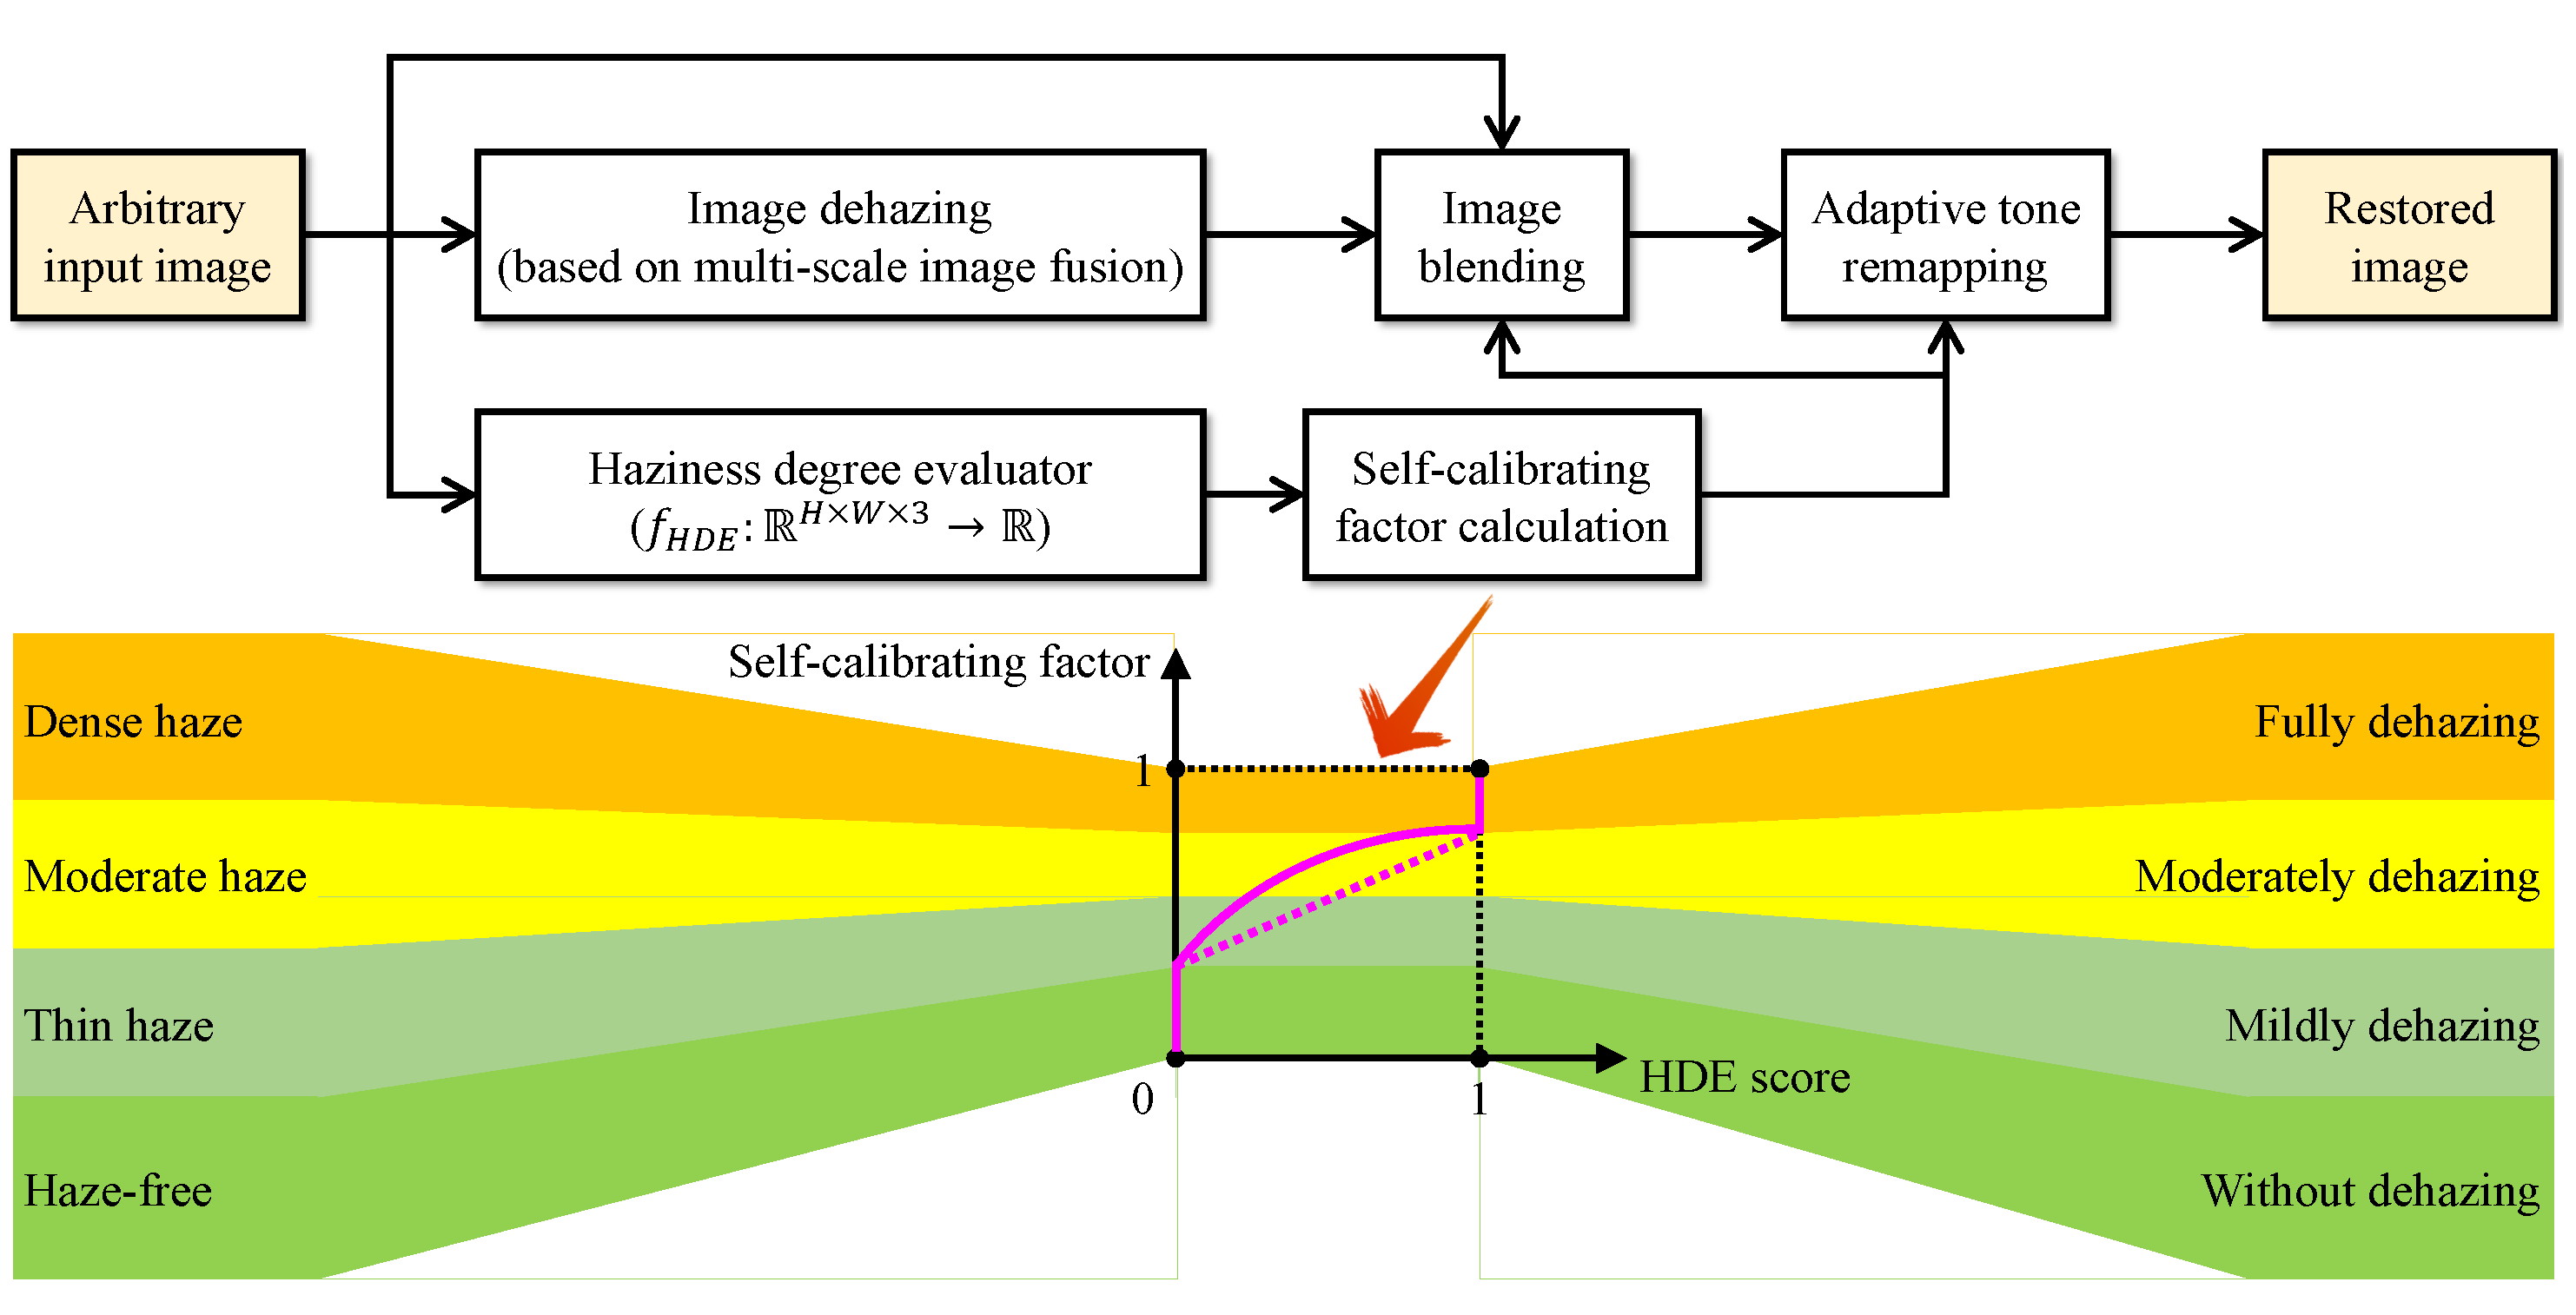
Figure 3 illustrates the main steps constituting the autonomous dehazing algorithm, which accepts and handles arbitrary images. The fundamental idea is to combine the input image with its corresponding dehazed result according to the HDE score. More specifically, the algorithm first senses the haze condition of the input image and then adjusts the dehazing power correspondingly. If the condition is haze-free, the dehazing power becomes zero to keep the input image intact, because it is unnecessary to dehaze a haze-free image. Otherwise, the dehazing power varies in proportion to the sensed haze condition (thin, moderate, or dense haze). This haze-condition-appropriate processing scheme is robust against image distortion caused by excessive dehazing, as the evaluation results in [7] demonstrated.
According to [4], Equation (3) gives the HDE score ρ I of an RGB image I , where Ψ represents the whole image domain, and hence the representation | Ψ | denotes the total number of pixels. The variable B keeps Equation (3) from growing too lengthy; its expression is given in Equation (4), where κ is a user-defined parameter that was set to 1 in [7], I m c is the difference between two extremum channels, and  σ I is the standard deviation of the image luminance. Finally, I m Ω and A ^ denote the dark channel and the global atmospheric light estimate discussed earlier in Section 2.
ρ I = 1 | Ψ | x Ψ I m Ω ( x ) + B ( x ) B 2 ( x ) B ( x ) A ^ ( x ) I m Ω ( x ) A ^ ( x ) ,
B ( x ) = I m c ( x ) σ I ( x ) κ , where κ 0 and κ I m c ( x ) σ I ( x ) A ^ ( x ) I m Ω ( x ) ,
I m Ω ( x ) = min y Ω ( x ) min c { R , G , B } I c ( y ) ,
I m c ( x ) = max c { R , G , B } I c ( y ) min c { R , G , B } I c ( y ) .
Based on the HDE score ρ I , the self-calibrating factor calculation block utilizes four additional user-defined parameters ( ρ 1 , ρ 2 , α , and  θ ) to compute a weighting factor for image blending and adaptive tone remapping blocks. The self-calibrating factor calculation follows Equations (7) and (8).
ω = ( 1 ρ ^ I ) θ ,
where ω weights the contribution of the input image I in the image blending block, and  ρ ^ I is a result of applying the mapping function f : R R ,
ρ ^ I = { 0 ρ I < ρ 1 ρ I ρ 1 ρ 2 ρ 1 α ρ 1 ρ I ρ 2 1 ρ I > ρ 2 .
Provided that J is the dehazed result of I , Equation (9) shows the restored image R , which is the output of the adaptive tone remapping block. This post-processing block first enhances the luminance and then emphasizes the chrominance accordingly, lest color distortion occurs. Equation (9) displays this as P ω { · } to imply that it is also guided by the self-calibrating factor.
R = P ω ω I + ( 1 ω ) J .
The algorithm in [7] computes the dehazed result J based on multi-scale image fusion. This image dehazing approach belongs to the image processing category and is based on underexposure. Because this phenomenon occurs when inadequate incoming light hits the camera sensor, a postulation exists in the literature that underexposure can alleviate the negative effects of atmospheric scattering and absorption [36]. Therefore, fusing images at different exposure degrees is analogous to image dehazing. Additionally, for adapting this idea to the single-image approach, researchers have widely utilized gamma correction to artificially underexpose an input image. Readers interested in a detailed treatment of this dehazing approach are referred to [7,36]. Meanwhile, Algorithm 1 below provides a corresponding formal description.
Algorithm 1 Multi-scale image dehazing
Input: An RGB image I R H × W × 3 , the number of artificially underexposed images K Z 0 + and corresponding gamma
    values { γ k | γ k 1 and k Z 0 + [ 1 , K ] } , and the number of scales N Z 0 + , N l o g 2 [ min ( H , W ) ]
Output: The restored image J R H × W × 3
Auxiliary functions:  u 2 ( · ) and d 2 ( · ) denote upsampling and downsampling by a factor of two
BEGIN
  1:
Create input pyramid:  I n k | k Z 0 + [ 1 , K ] and n Z 0 + [ 1 , N ]
(a)
First scale:           I 1 k = I γ k | k Z 0 + [ 1 , K ]
(b)
Remaining scales:    I n k = d 2 ( I n 1 k ) | k Z 0 + [ 1 , K ] and n Z 0 + [ 2 , N ]
  2:
Create Laplacian pyramid:  L n k | k Z 0 + [ 1 , K ] and n Z 0 + [ 1 , N ]
(a)
Last scale:            L N k = I N k | k Z 0 + [ 1 , K ]
(b)
Remaining scales:    L n k = I n k u 2 ( I n + 1 k ) | k Z 0 + [ 1 , K ] and n Z 0 + [ 1 , N 1 ]
  3:
Create guidance pyramid:  G n k | k Z 0 + [ 1 , K ] and n Z 0 + [ 1 , N ]
(a)
First scale:           G 1 k = 1 min y Ω ( x ) min c { R , G , B } I 1 k c ( y ) | k Z 0 + [ 1 , K ]
(b)
Remaining scales:    G n k = d 2 ( G n 1 k ) | k Z 0 + [ 1 , K ] and n Z 0 + [ 2 , N ]
  4:
Normalize guidance pyramid:  G ˜ n k = G n k / k G n k | k Z 0 + [ 1 , K ] and n Z 0 + [ 1 , N ]
  5:
Fuse Laplacian pyramid:
(a)
Temporary results:    T n = k G ˜ n k L n k | n Z 0 + [ 1 , N ]
(b)
Last scale:    J N = T N
(c)
Remaining scales:      J n = T n + u 2 ( J n + 1 ) | n Z 0 + [ 1 , N 1 ]
  6:
Output assignment: J = J 1
END
The input data for multi-scale image dehazing include an RGB image I R H × W × 3 of size H × W , a number of artificially underexposed images K Z 0 + and the corresponding gamma values { γ k | γ k 1 and k Z 0 + [ 1 , K ] } , and the number of scales N Z 0 + . The representation Z 0 + denotes a set of non-negative integers, and thus k Z 0 + [ 1 , K ] means that k is a non-negative integer lying between 1 and K. Based on the image size, N must be smaller than its maximum value of l o g 2 [ min ( H , W ) ] . Two auxiliary functions u 2 ( · ) and d 2 ( · ) denote upsampling and downsampling by a factor of two.
The first step is to create an input pyramid { I n k | k Z 0 + [ 1 , K ] and n Z 0 + [ 1 , N ] } (hereinafter referred to as { I n k } for short). After that, there follows the computation of Laplacian and guidance pyramids ( { L n k } and { G n k } ). It is noteworthy that Algorithm 1 computes the guidance pyramid according to the dark channel prior [9], due to its strong correlation with haze density. Before performing multi-scale fusion, it is essential to normalize the guidance pyramid to prevent the out-of-range problem. Finally, the fifth step demonstrates multi-scale fusion, beginning at the last scale and finishing at the first, whose result is the restored image J . Figure 4 depicts an example where K = 3 and N = 3 . Substituting the restored image J into Equation (9) yields the final result R .
Despite the excellent performance, the autonomous dehazing algorithm in [7] fails to deliver real-time processing, as shown by the run-time comparison in Table 1. A major reason is the multi-scale fusion scheme, because this algorithm sets N = l o g 2 [ min ( H , W ) ] . This setting is beneficial to the restored image’s quality, but it carries a heavy burden of memory, thus prolonging the processing time. The problem worsens from the perspective of hardware implementation because multi-scale fusion requires multiple frame buffers for upsampling and downsampling.
Furthermore, the minimum filtering operation is also at the root of the failure to achieve real-time processing. From the perspective of software implementation, the ideal complexity of filtering operations is O ( H × W ) , which comprises two for loops to filter an H × W image. Consequently, the processing time increases in proportion to the image size, hindering high-quality real-time processing. The following presents an FPGA implementation where the computing capability suffices for handling DCI 4K images in real-time to surmount the aforementioned challenges.

3.2. FPGA Implementation

The challenges of improving computing performance are rooted in software implementation, and parallelization is often a practical solution. In parallel computing, a task divides into several sub-tasks, which central processors can execute independently, combining the results upon completion. For example, Figure 5 illustrates a naive parallelization of the autonomous dehazing algorithm discussed above, in which multi-scale image dehazing and a haziness degree evaluator occur simultaneously. In contrast, self-calibrating factor calculation, image blending, and adaptive tone remapping are dependent and thus occur sequentially. This computation flow consists of four stages, and the first accounts for most of the heavy computations. Accordingly, we assume that it is responsible for nine tenths of the entire algorithm, which, fortunately, supports parallelization. Following Amdahl’s law [37], it is theoretically possible to achieve at most a 10 × speedup in processing time [= 1 / ( 1 0.9 ) ].
The run-time comparison results in Table 1 demonstrate that it took 0.65 s to handle a 640 × 480 image. Hence, even if we apply parallelization with the maximum 10 × speedup, the corresponding processing speed of 15.38 fps (≈1/0.065) would still be less than required. Consequently, FPGA implementation is essential for real-time processing, and the following play key roles in the proposed design.

3.2.1. Pipelined Architecture

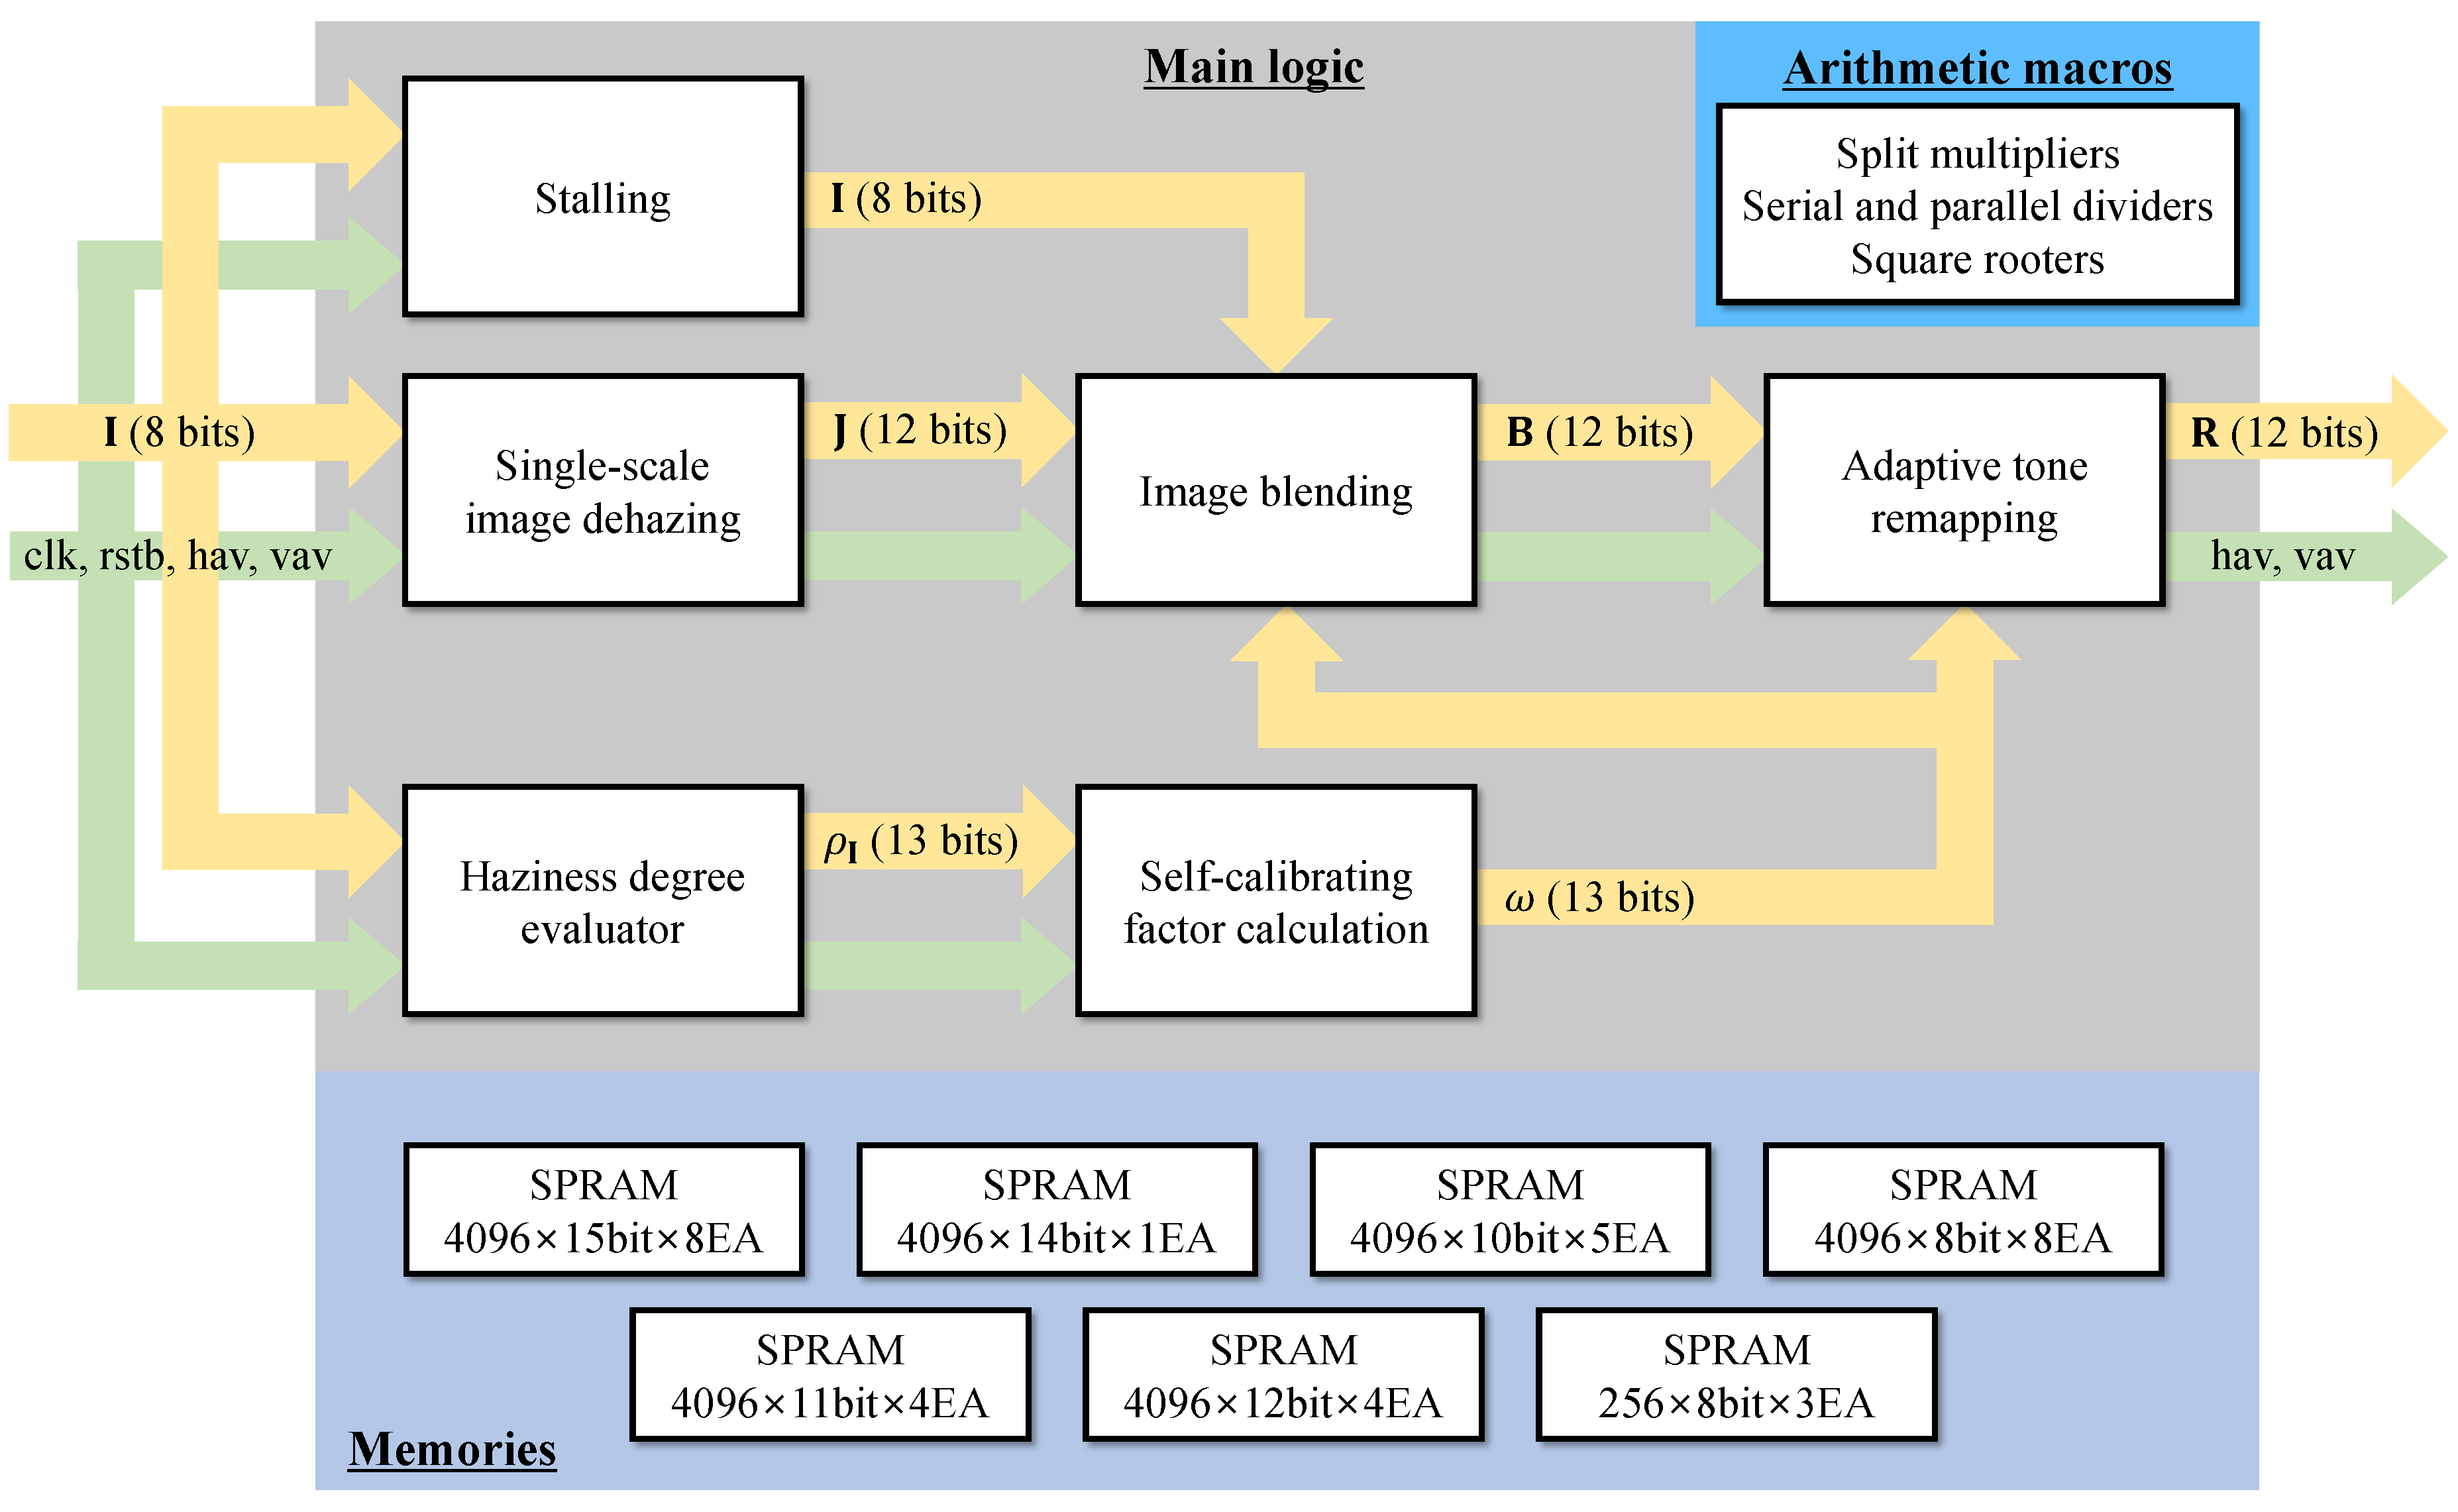
Figure 6 illustrates the pipelined architecture for a real-time FPGA implementation of the base algorithm. The three primary components are the main logic, arithmetic macros, and memories. The first realizes the computation flow depicted in Figure 5, in which computation-intensive operations (such as multiplication, division, and taking square roots) are offloaded onto the second. Meanwhile, the third is analogous to a cache, consisting of SPRAMs for the temporary storage of data.
Input data include an RGB image I and timing signals, namely, clock, reset, and horizontal and vertical active video (denoted as clk, rstb, hav, and vav in Figure 6). The image I simultaneously undergoes the following three blocks: stalling, single-scale image dehazing, and haziness degree evaluator. It is noteworthy that single-scale image dehazing is a special case of Algorithm 1 where N = 1 and K = 5 . We restricted the proposed FPGA implementation to single-scale dehazing to circumvent the heavy burden of frame buffers. In addition, to avoid race conditions when combining the input I and its dehazed result J , we utilized stalling to delay I until J is available. After that, image blending combines I and J to produce the blended image B , which, in turn, undergoes adaptive tone remapping for luminance enhancement and chrominance emphasis. The proposed FPGA implementation then outputs the restored image R , together with its corresponding horizontal and vertical active video signals.
As briefly mentioned, arithmetic macros are responsible for heavy computations. Thus, the design of all modules in the main logic becomes straightforward because they only account for lightweight operations (such as addition, subtraction, and data routing). However, to avoid digression, we set out the discussion of arithmetic macros in Appendix A and Appendix B, except for split multipliers. These circuits are aimed at reducing the propagation delay of large multiplications, and we explain their operation principle later in Section 3.2.3.
Regarding the haziness degree evaluator, Equation (3) demonstrates that its calculation involves global average pooling. Therefore, we exploited the high similarity between video frames to design this block. As a result, its output ρ I becomes available during the vertical blank period, and the calculation of the self-calibrating factor ω takes place immediately thereafter. Hence, the  ω value of a frame self-calibrates the next frame, thus enabling real-time processing of video data. Meanwhile, for processing still images, the proposed FPGA implementation needs a rerun to correctly self-calibrate the image blending and adaptive tone remapping blocks.
To implement this hardware architecture, we utilized the Verilog hardware description language (IEEE Standard 1364-2005) [38] and register-transfer level (RTL) design abstraction. The former supports generality, portability, and plug-and-play capability, while the latter eases the hardware design burdens. For example, as the RTL methodology focuses on modeling the signal flow, it is simple and convenient to describe all modules in the main logic following the description in Section 3.1. In particular, the plug-and-play capability allows reuse of existing RTL designs, and the adaptive tone remapping is a case in point. Cho et al. [39] implemented and packaged this module as intellectual property, facilitating its integration into the proposed implementation.
The pipelined architecture in Figure 6 improves the system’s throughput, whereas the processing speed depends on the propagation delay of combinational logic circuits (CLCs). Accordingly, the following describes two techniques for reducing the propagation delay:
  • Fixed-point design for minimizing the signal’s word length to reduce the size of CLCs;
  • Split multiplying for breaking large multiplications (represented by a large CLC) into smaller ones and inserting pipeline registers (PRs) between them, thus reducing propagation delay.

3.2.2. Fixed-Point Design

Fixed-point representation is a concept in computing that represents fractional numbers using only a fixed number of digits. Consequently, it sacrifices accuracy to reduce the representational burden. The fixed-point representation Q f of a real number Q is given below, where U denotes the number of fractional digits (or fractional bits when dealing with binary numbers).
Q f = Q · 2 U + s g n ( Q ) · 1 2 ,
s g n ( Q ) = { 1 Q < 0 0 Q = 0 1 Q > 1 .
Fixed-point design refers to a method of finding the optimal fixed-point representation of all system signals, and an error tolerance Δ is a prerequisite for that purpose. Specifically, given Q, its integer part determines the number of integer bits. Meanwhile, the absolute difference | Q f Q · 2 U | is compared with Δ to determine and adjust the number of fractional bits. Herein, given the eight-bit input image data, we determined the word length of the signals in Figure 6 based on an error tolerance of ± 1 least significant bit. The results were { 12 , 13 , 13 , 12 , 12 } bits for { J , ρ I , ω , B , R } , respectively.

3.2.3. Customized Split Multiplier

Split multiplying is analogous to the grid method that is often taught at primary school. Under this approach, the  S M -bit multiplicand M and the S E -bit multiplier E arbitrarily divide into S M 1 -bit M 1 , S M 2 -bit M 2 , S E 1 -bit E 1 , and  S E 2 -bit E 2 , where S M 1 + S M 2 = S M and S E 1 + S E 2 = S E . The product P can then be expressed as follows:
P = M · E = ( M 1 2 S M 2 + M 2 ) · ( E 1 2 S E 2 + E 2 ) = ( M 1 E 1 2 S M 2 + M 2 E 1 ) 2 S E 2 + ( M 1 E 2 2 S M 2 + M 2 E 2 ) .
Hence, a large multiplication M · E divides into four smaller ones: M 1 E 1 , M 2 E 1 , M 1 E 2 , and  M 2 E 2 . By inserting four additional PRs to store the results of these multiplications, the latency increases by one clock cycle. However, the propagation delay incurred for computing each of M 1 E 1 , M 2 E 1 , M 1 E 2 , and  M 2 E 2 is significantly smaller than that for computing the original multiplication M · E .
As described thus far, the proposed FPGA implementation is the final result of a sophisticated design process. We adopted pipelining and fixed-point design to improve the throughput and processing speed, respectively. In addition, we also utilized split multiplying to break large multiplications into smaller ones, further reducing the propagation delay until achieving real-time processing for DCI 4K resolution.

4. Evaluation

This section provides the hardware implementation results and compares the proposed FPGA implementation with existing benchmark designs to verify its efficacy. A performance evaluation then follows to demonstrate the autonomous dehazing capability on outdoor and aerial images.

4.1. Hardware Resources

For hardware implementation, the target FPGA device was a Zynq-7000 XC7Z045-2FFG900 equipped with a Xilinx Zynq-7000 SoC ZC706 evaluation kit [40], and the tool was Xilinx Vivado v2019.1 [41]. We selected this FPGA device to facilitate the comparison with existing real-time designs [35,42] whose target was also Zynq-7000 XC7Z045-2FFG900.

4.1.1. Implementation Results

Table 3 summarizes the implementation results of the proposed autonomous dehazing system. Given the total hardware resources available in the mid-size FPGA device mentioned above, less than one third was required to realize the proposed system. More precisely, it took 53,216 slice registers, 49,799 slice look-up tables (LUTs), 45 RAM36E1s, and 22 RAM18E1s out of the corresponding 437,200, 218,600, 545, and 1090. The minimum period reported in Table 3 is equivalent to the maximum propagation delay among all CLCs of the system. This specifies the minimum interval at which the system produces new output data; thus, its reciprocal is the maximum frequency. As reported, the proposed system can handle at most 271.37 Mpixels per second.
Let f max denote that maximum frequency. Then, the following equation demonstrates the calculation of maximum processing speed ( M P S ) in fps.
M P S = f max ( H + B ver ) ( W + B hor ) ,
where H and W are the image height and width, and  B ver and B hor denote the vertical and horizontal blank periods. Herein, the three variables f max , B ver , and  B hor were design-dependent. Accordingly, if hardware designers fail to consider the blank periods, a design with an impressive f max may deliver a slow M P S . In this study, we implemented the proposed system to operate correctly with minimum periods of one clock cycle ( B hor = 1 ) and one image line ( B ver = 1 ). Table 4 summarizes the M P S values for different image resolutions, ranging from Full HD to DCI 4K. Thus, the proposed FPGA implementation can handle DCI 4K images/videos at 30.65 fps, which satisfies the real-time processing requirement.

4.1.2. Comparison with Benchmark Designs

In the literature on image dehazing, a few real-time implementations exist, and those developed by Park and Kim [43] and Ngo et al. [35,42] are cases in point. The first design realizes the well-known algorithm of He et al. [9], in which Park and Kim [43] improve the atmospheric light estimation for video processing. The second design [42] improves the dehazing method of Tarel and Hautiere [8] by devising an excellent edge-preserving smoothing filter to replace the standard median one. Finally, the third design [35] is an improved version of the method of Zhu et al. [11]. It has remedied several visually unpleasant problems such as background noise, color distortion, and post-dehazing false enlargement of bright objects.
Table 5 below summarizes the implementation results of the four designs. A conspicuous observation is that the proposed autonomous dehazing system requires the least hardware resources. Despite its compact size, its processing speed is virtually the same as the fastest implementation in [35]. Finally, the proposed system is equipped with the unique feature of autonomous dehazing, as demonstrated in the following.

4.2. Performance

This section evaluates the dehazing performance of the proposed system against five state-of-the-art methods, including those proposed by He et al. [9], Zhu et al. [11], Cai et al. [13], Berman et al. [12], and Cho et al. [2]. The evaluation is performed on two types of images—outdoor and aerial—to demonstrate the breadth of applications of the proposed system. An essential difference between these two is the area of inspection. Outdoor images depict an area close to the camera, and they serve as data for understanding the environment within which the camera operates. In contrast, aerial images depict a larger inspection area, and they serve as data for monitoring a changing situation.

4.2.1. Outdoor Images

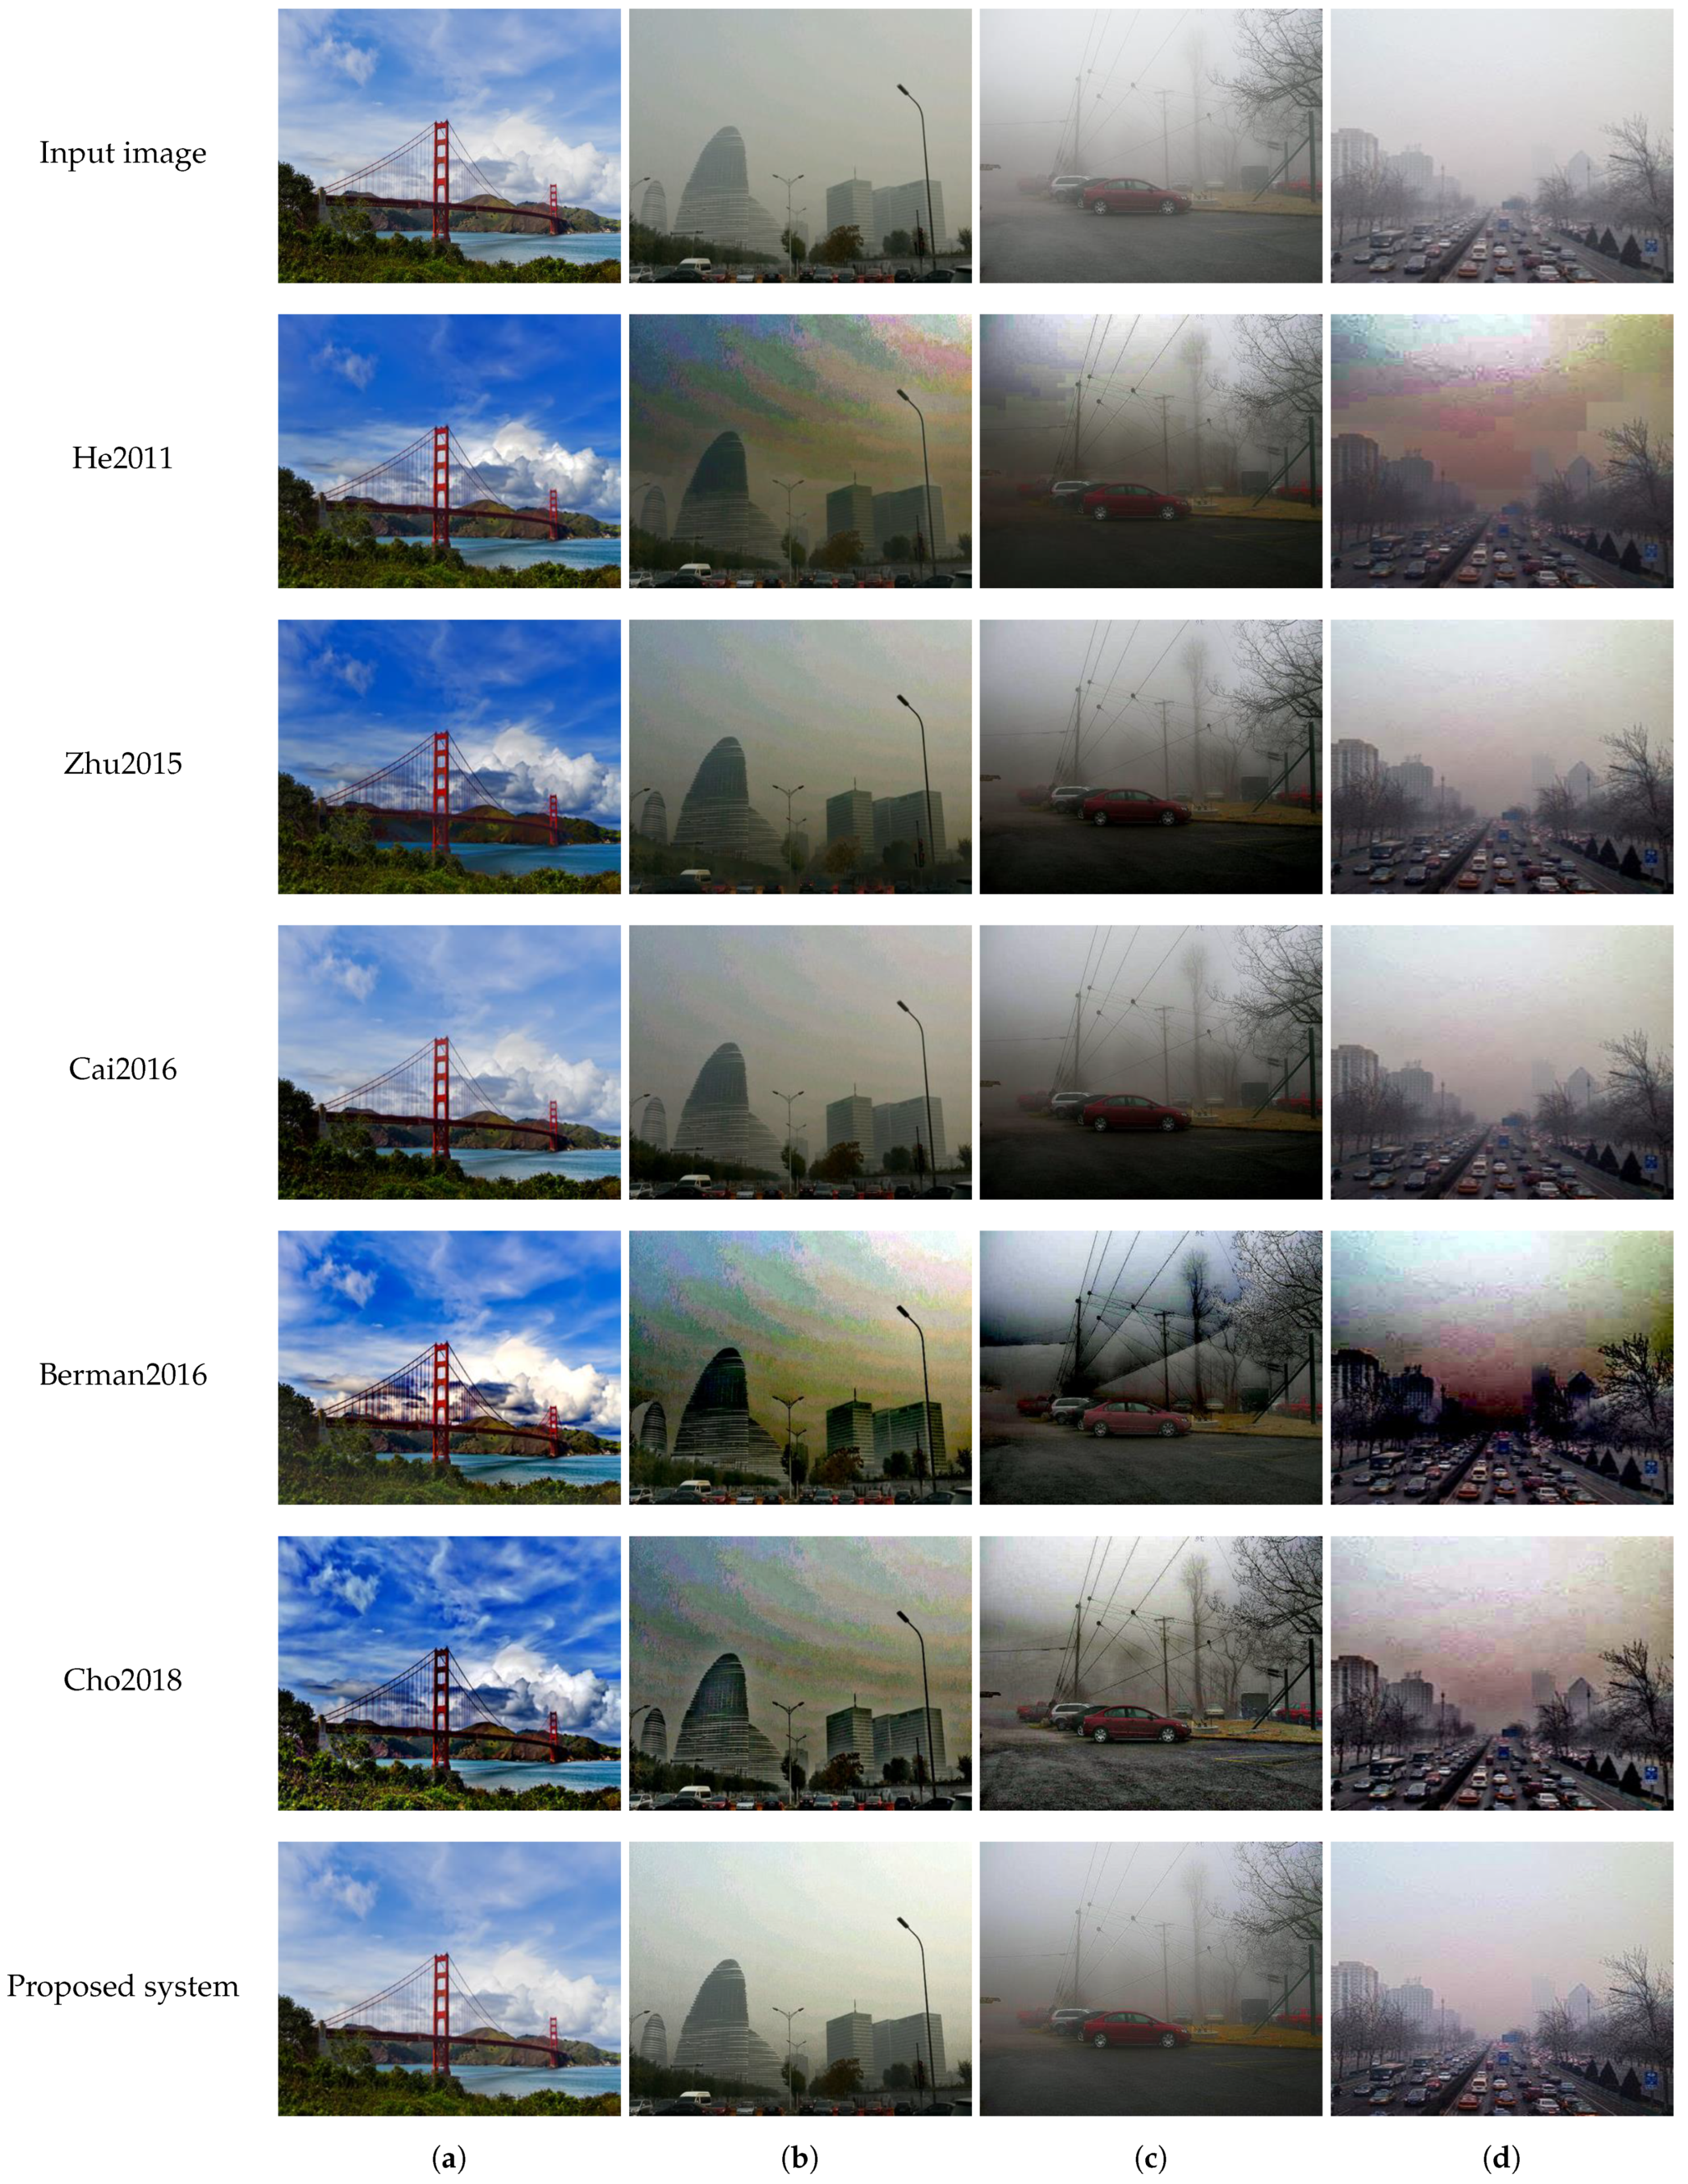
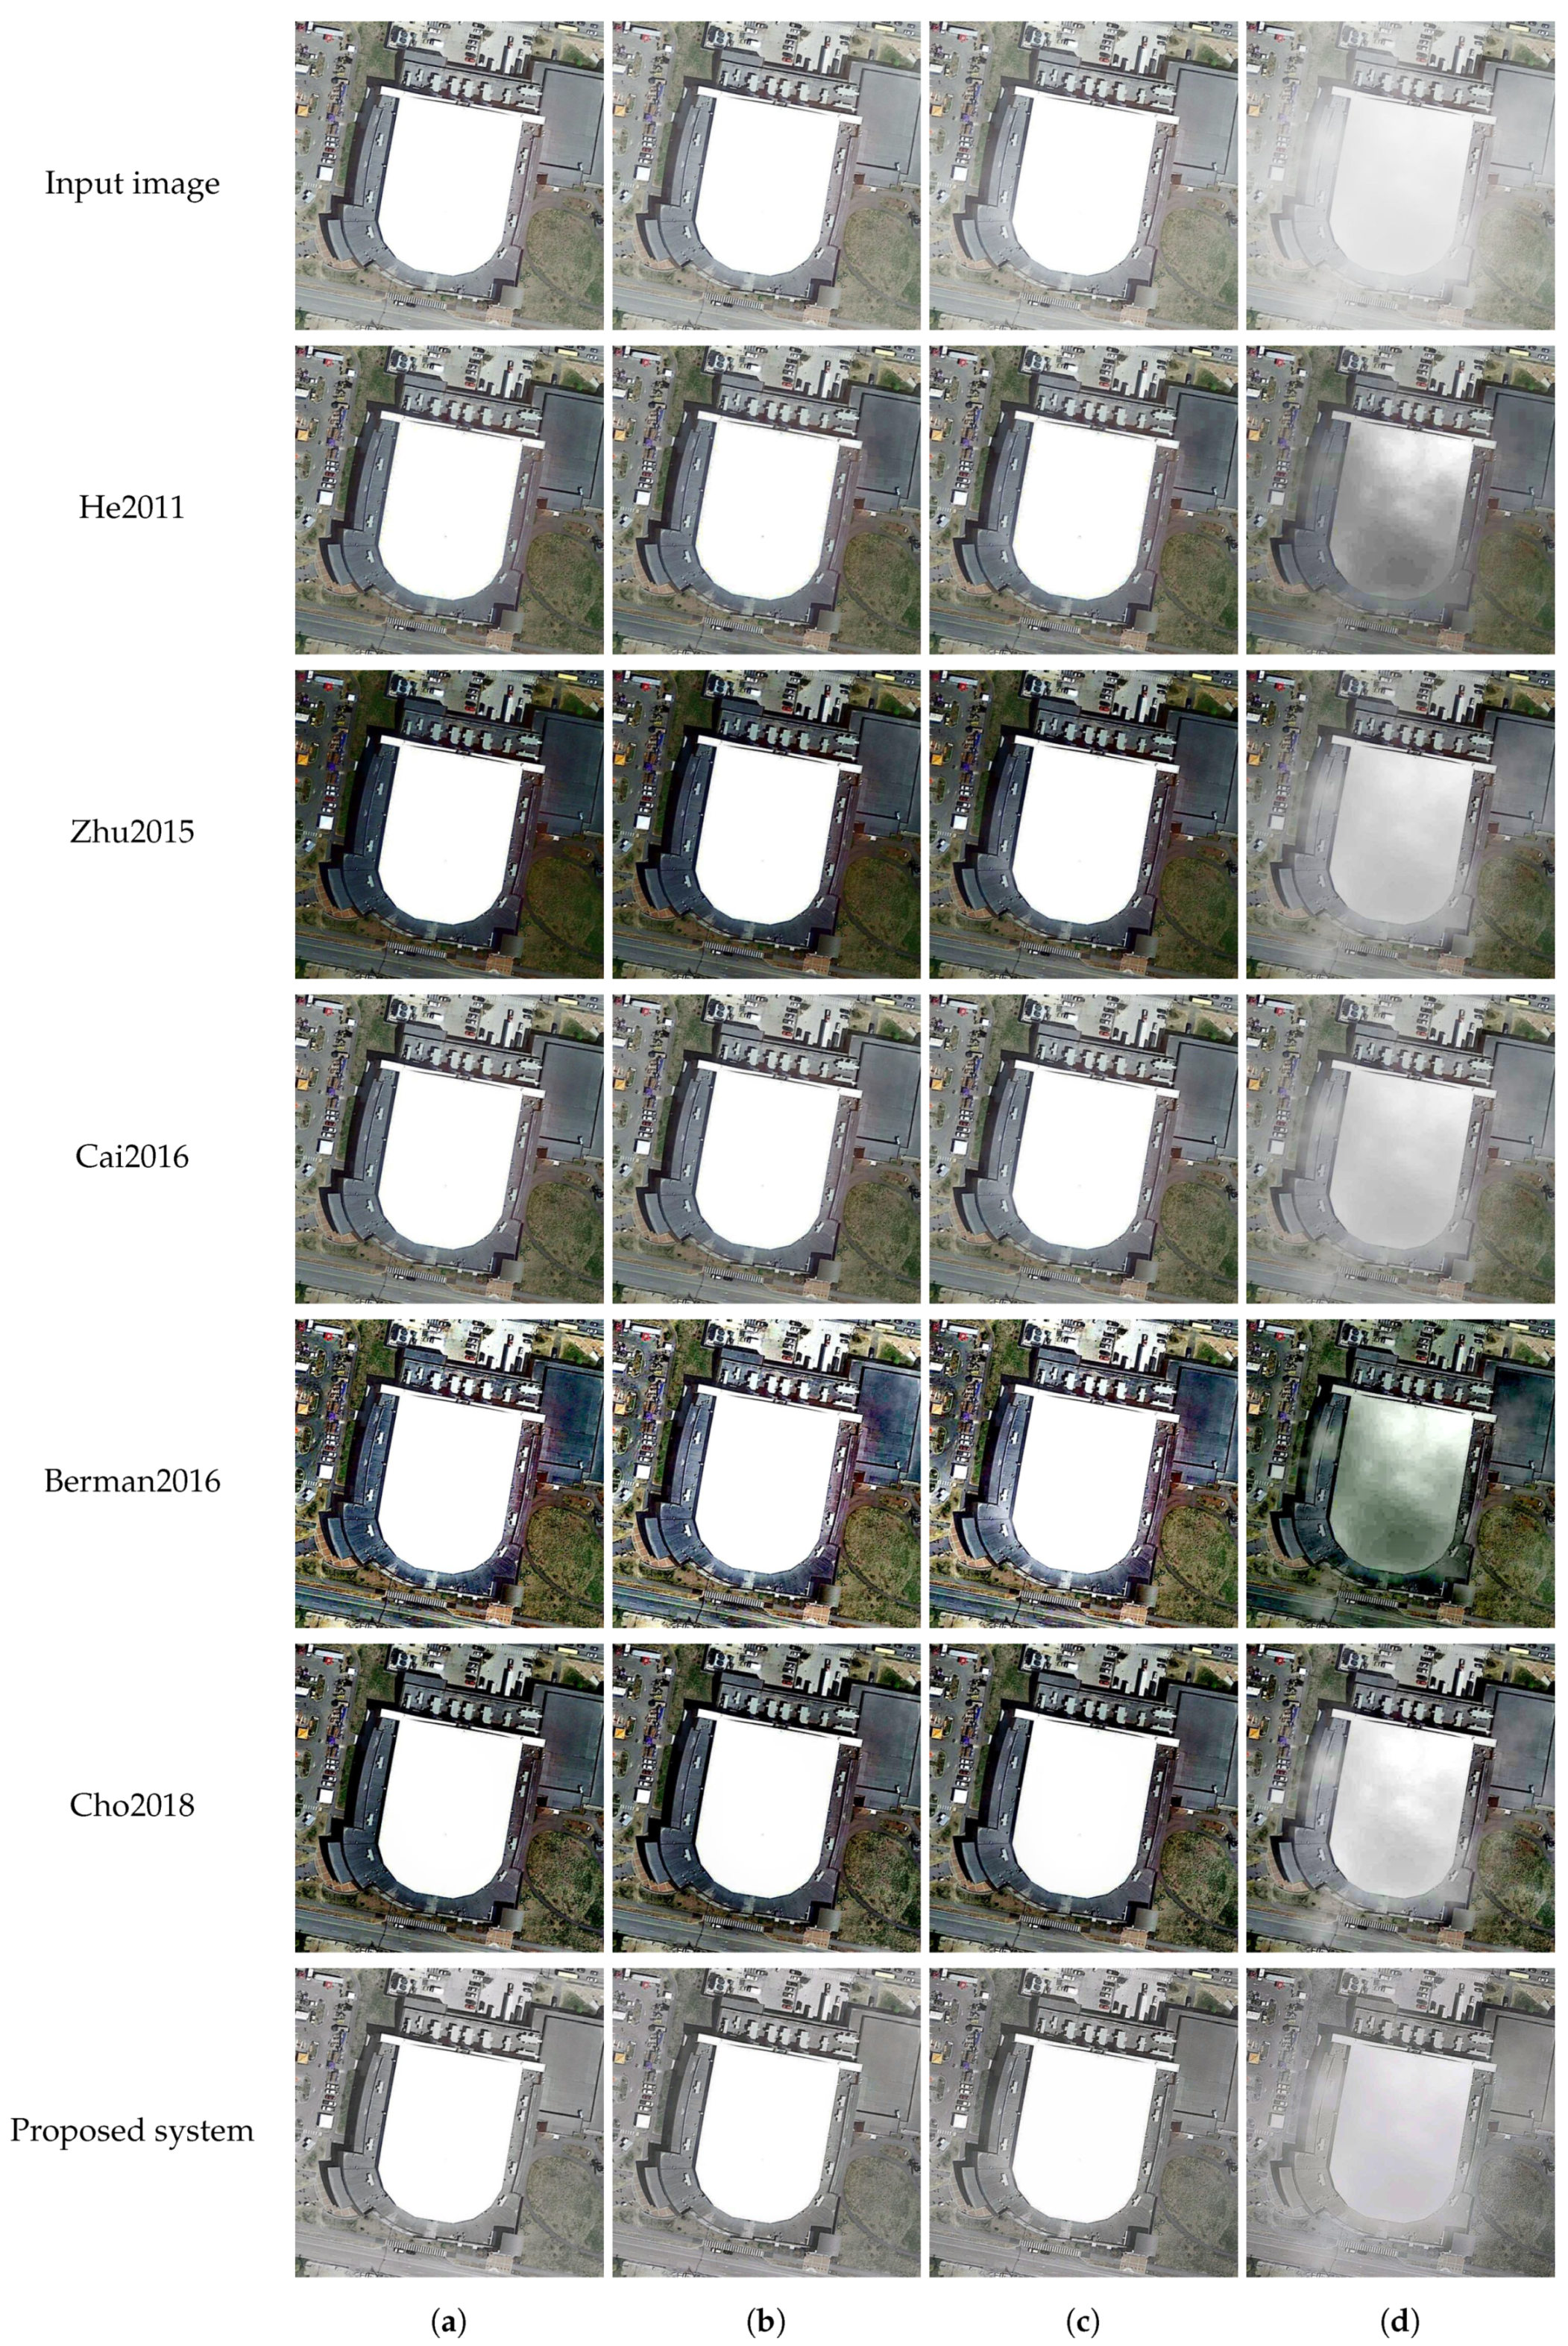
Because the aforementioned methods usually deliver satisfactory performance, images demonstrated hereinafter are those for which dehazing-related artifacts are easily noticeable. Figure 7 shows four representative outdoor images and the corresponding results of applying six dehazing methods in which the haze condition is determined based on the HDE score. Following [7], we adopt two thresholds { ρ 1 , ρ 2 } = { 0.8811 , 0.9344 } to discriminate the haze condition. Let ρ I be the input image’s HDE score. Then, its haze condition is one of the following:
  • Haze-free if ρ I < ρ 1 ;
  • Thin haze if ρ 1 ρ I < ( ρ 1 + ρ 2 ) / 2 ;
  • Moderate haze if ( ρ 1 + ρ 2 ) / 2 ρ I < ρ 2
  • Dense haze if ρ I ρ 2 .
It emerges from Figure 7 is that the five benchmark methods could not handle haze-free images correctly, as can be seen by the severe color distortion (dark-blue sky), except for the method of Cai et al. [13], where it can be seen that the powerful CNN is versatile enough to adapt to various haze conditions. However, slight degradation is noticeable in the near-field plants. The proposed system, in contrast, successfully discriminates this image as haze-free and zeroes the dehazing power through ω = 1 in Equation (9). Consequently, it leaves the haze-free image intact and thus free of any visually unpleasant artifacts.
In addition, except for the deep CNN of Cai et al. [13], the benchmark methods exhibit post-dehazing artifacts in thin, moderate, and dense haze. Their dehazing power is too strong and not well adapted to the local content of images, as can be seen in the excess haze removal in the upper half and the persistence of haze in the lower half. For the same reason as that mentioned above, the results of Cai et al. [13] demonstrate a less severe problem. The proposed system takes a step forward and displays more satisfactory results than the benchmark methods. It automatically adjusts the dehazing power lest excess haze removal occurs. This desirable behavior is attributed to the elegant use of HDE scores to guide the image blending and adaptive tone remapping blocks.
Furthermore, we utilized three full-reference metrics, namely, mean squared error (MSE), structural similarity (SSIM) [44], and feature similarity extended to color images (FSIMc) [45] to assess the dehazing performance quantitatively. In these three metrics, the smaller the MSE the better, whereas the opposite applies to SSIM and FSIMc. In addition, as these are full-reference metrics, we employed the following fully annotated datasets: FRIDA2 [46], D-HAZY [47], O-HAZE [48], I-HAZE [49], and Dense-Haze [50]. FRIDA2 consists of 66 graphics-generated images of road scenes, based on which Tarel et al. [46] synthesized four hazy image groups (in total, 66 haze-free and 264 hazy images). Similarly, D-HAZY is composed of 1472 indoor images whose corresponding hazy images are synthesized with scene depths captured by a Microsoft Kinect camera. In contrast, O-HAZE, I-HAZE, and Dense-Haze comprise 45, 30, and 55 pairs of real hazy/haze-free images depicting indoor, outdoor, and both indoor and outdoor scenes, respectively. Another facet to consider is that input images to a dehazing system are not necessarily hazy. Hence, we employed both the haze-free and hazy images of those datasets and an additional 500IMG dataset [35] consisting of 500 haze-free images collected in our previous work.
Table 6 summarizes the quantitative evaluation results, where we boldface the top three results in red, green, and blue, respectively, for ease of interpretation. Thus, it is clearly seen that the proposed system demonstrates the best performance regardless of haze conditions. In particular, it attains virtually perfect scores for haze-free images, attributed to the excellent performance of HDE in haze condition discrimination. In addition, even the results on hazy images per se show a clear gap between this and the second-best method.
Overall, the methods of He et al. [9] and Cai et al. [13] share the following two positions. Table 6 shows that the former is situational. On the one hand, it exhibits the top scores on D-HAZY due to its well-known excellence in indoor dehazing. On the other hand, its inherent failure to handle sky regions results in poor performance on FRIDA2. Conversely, the latter is versatile as it performs relatively well on all datasets. It is also noteworthy that SSIM does not account for the chrominance information; hence, the method of He et al. [9] is ranked second overall under this metric. However, under FSIMc, which accounts for chrominance, the DehazeNet of Cai et al. [13] is ranked second, consistently with the qualitative evaluation results in Figure 7.
The remaining three methods of Berman et al. [12], Cho et al. [2], and Zhu et al. [11] occupy the last three positions. Quantitative results on Dense-Haze demonstrate that the two methods of Berman et al. [12] and Cho et al. [2] are effective for haze removal. However, as the qualitative evaluation shows, they are susceptible to severe post-dehazing artifacts. The method of Zhu et al. [11] suffers from several problems such as color distortion and background noise (as pointed out by Ngo et al. [34]), resulting in its poor performance.

4.2.2. Aerial Images

In the aerial surveillance literature, no real datasets exist comprising pairs of hazy (or cloudy) images and their corresponding ground-truth reference. This is due to the sheer impracticality of capturing the same area under different weather conditions. Therefore, we propose a method to synthesize hazy images for evaluating image dehazing algorithms in aerial surveillance.
According to Equation (1), the global atmospheric light A and transmission map t are prerequisites for hazy image synthesis. As  A remains constant across the entire image domain, it is a common practice to derive A from the uniform distribution. In contrast, synthesizing t is a difficult task. On the one hand, Zhu et al. [11] proposed creating a pixel-wise random transmission map whose values were uniformly distributed. On the other hand, Jiang et al. [28] added a constant haze layer to a clean image by utilizing a scene-wise random transmission map. These two approaches are unrealistic because they do not reflect the true distribution of haze. To address this problem, we propose synthesizing haze/cloud as a set of low-frequency randomly distributed values, as shown in Algorithm 2.
Algorithm 2 Synthetic haze/cloud generation
Input: Image size H , W Z 0 + and cut-off frequency F c [ 0 , π ]
Output: Transmission map t [ 0 , 1 ] H × W
Auxiliary functions: N ( H , W ) generates a H × W image of random Gaussian noise,
   { F ( · ) , I ( · ) } denote forward and inverse Fourier transforms, and  L ( X , F c ) denotes
   low-pass filtering the image X with the cut-off frequency F c
BEGIN
  1:
Create Gaussian noise:  v = N ( H , W )
  2:
Perform Fourier transform:  V = F ( v )
  3:
Filter out high frequencies:  V ˜ = L ( V , F c )
  4:
Perform inverse Fourier transform:  v i = I ( V ˜ )
  5:
Normalize:  t = v i min ( v i ) / max ( v i ) min ( v i )
END
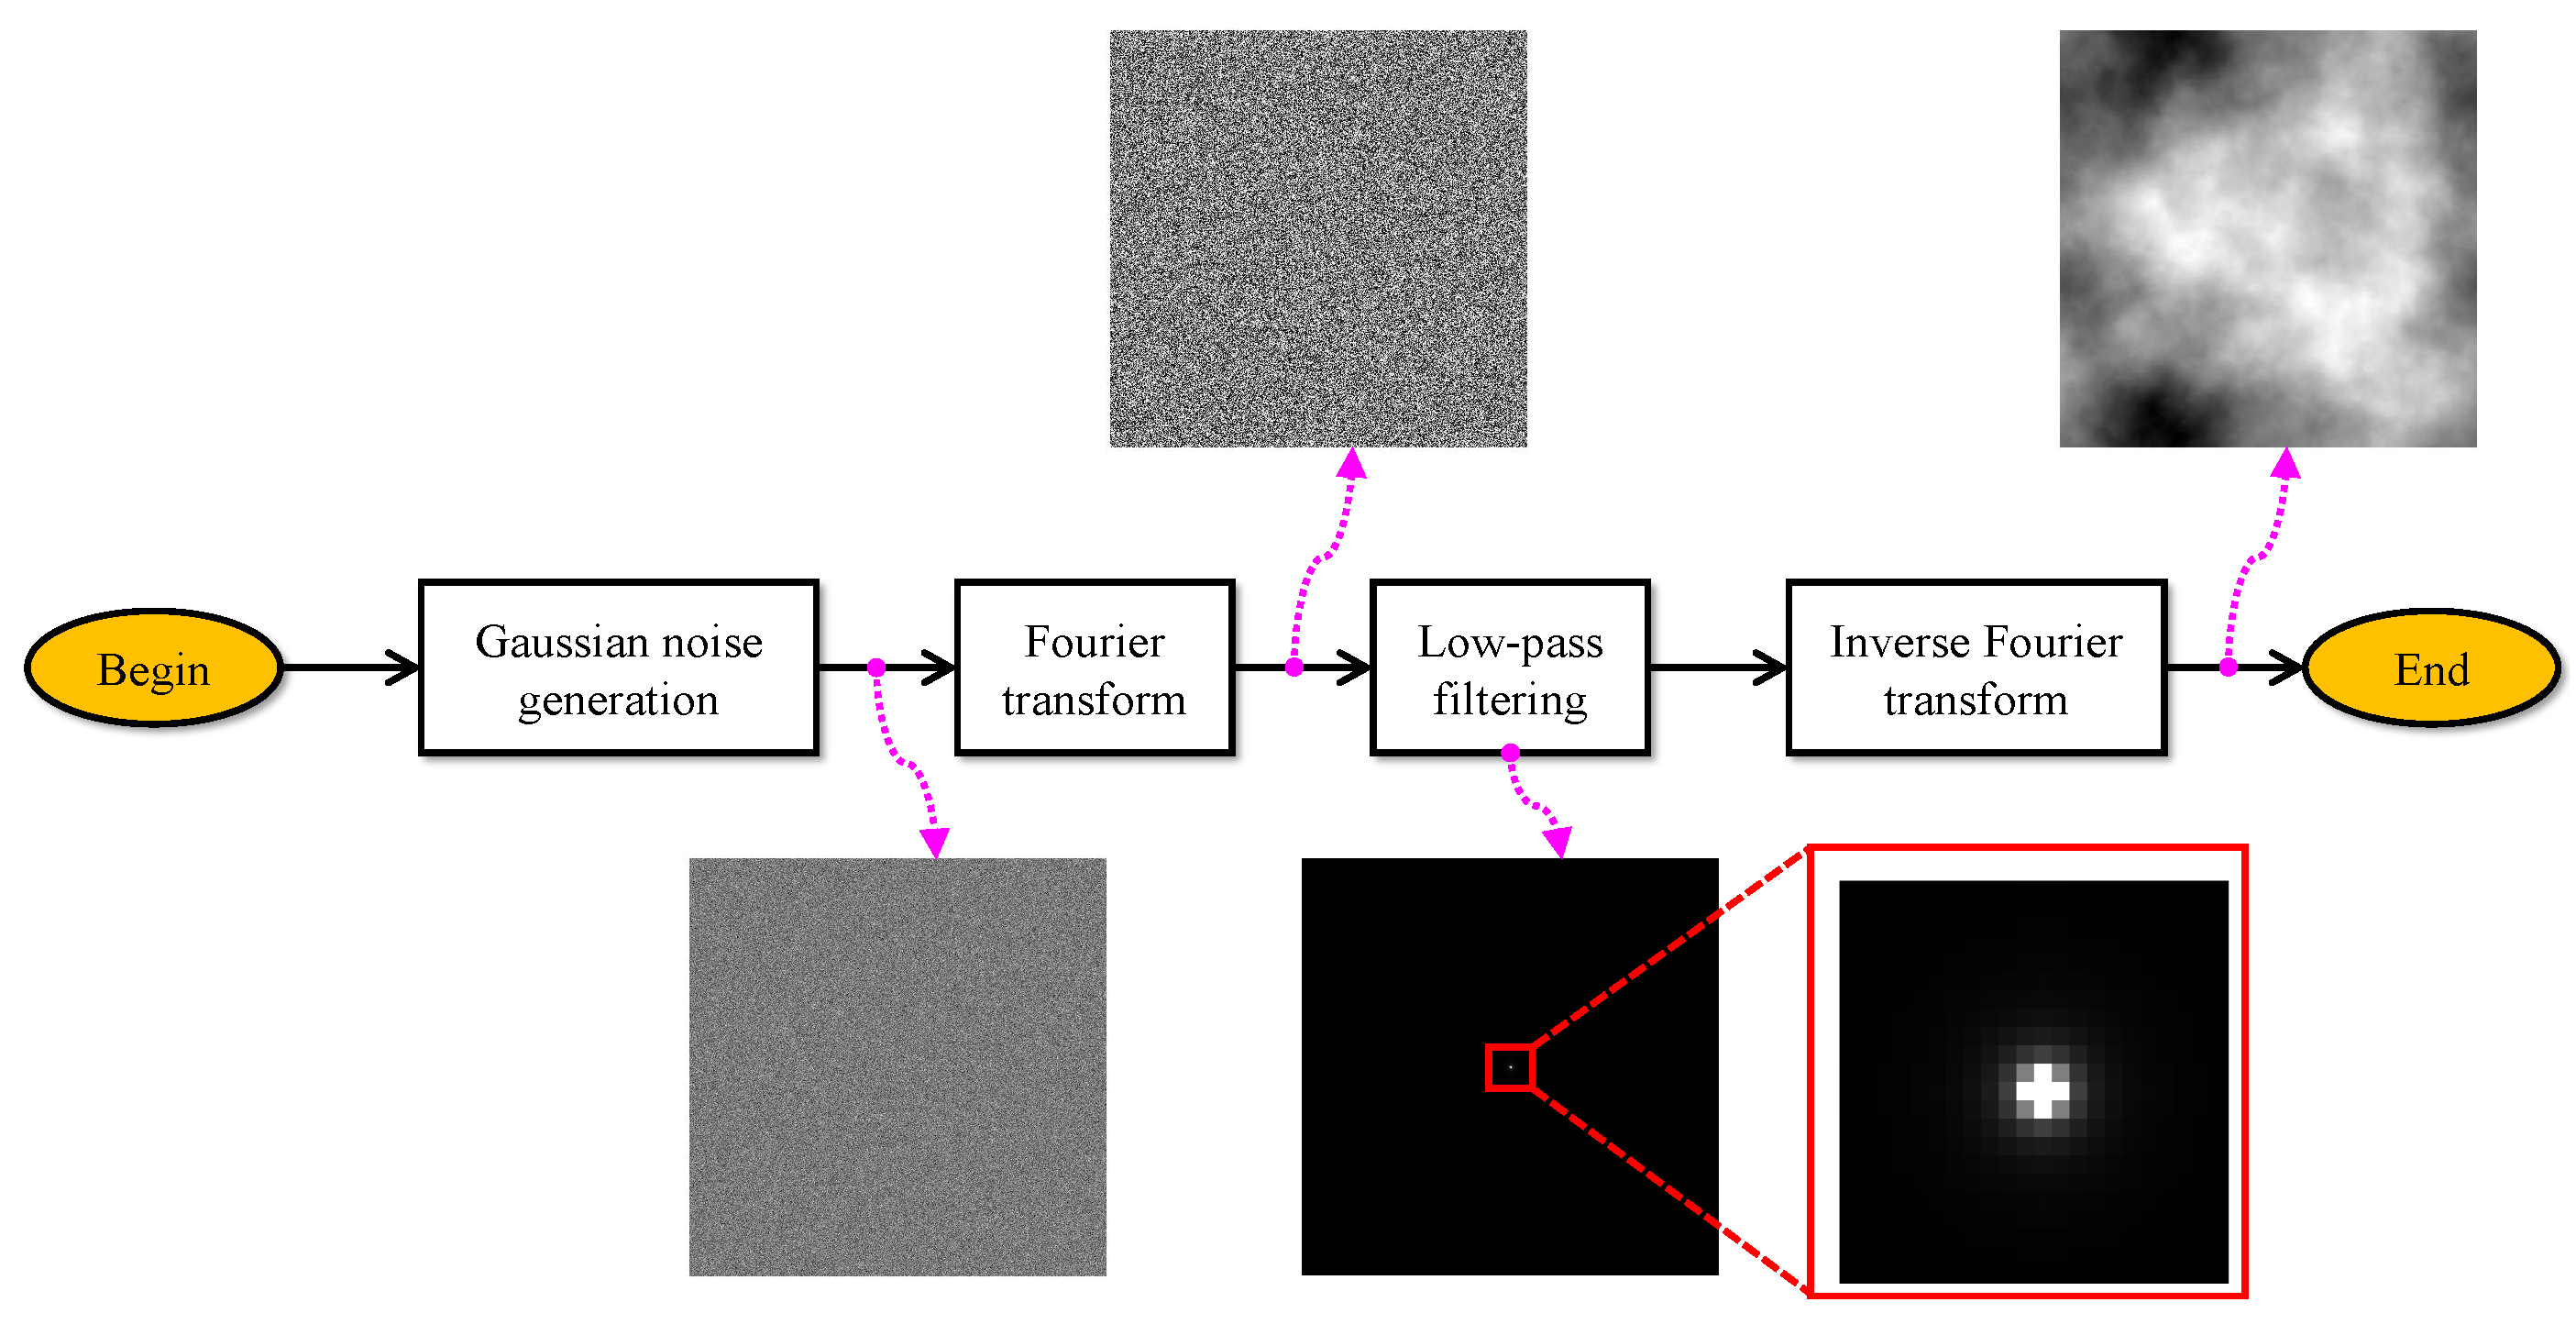
The underlying idea is to create an image of random Gaussian noise that consists of low and high frequencies. Then, by filtering out the high-frequency information, what remains closely resembles a real haze/cloud distribution. Figure 8 serves as an intuitive illustration of Algorithm 2.
Using the random haze/cloud distribution discussed above, we synthesized hazy/cloudy images from their clean counterparts based on Equation (1), as shown in Algorithm 3. For customization, we exploited the HDE [4] to guide the generation to arrive at an image that possessed a desirable HDE score. In Algorithm 3, the haze density control D ρ R 0 + and its step δ are responsible for varying the haze density to meet the predetermined HDE score. In addition, to help to avoid the generation of an infinite loop, we adopted the HDE tolerance Δ ρ and a maximum number of iterations M I . An example of this synthetic hazy/cloudy image generation is shown in Figure 1b.
Figure 9 and Figure 10 demonstrate the dehazing performance of the proposed system and the benchmark methods on synthetic aerial hazy images, where their corresponding haze-free images are from AID [1]. As with the assessment of outdoor images, the benchmark methods suffered from color distortion and halo artifacts, causing a marked difference between their results and the corresponding haze-free reference at the top left. Table 7 summarizes the MSE, SSIM, and FSIMc scores on synthetic aerial images in Figure 9 and Figure 10. It can be observed that the proposed system shares the top performance with the two methods of Cai et al. [13] and He et al. [9]. More specifically, its performance is within the top two for images with thin and moderate haze as well as for haze-free images. However, for densely hazy images, the performance is slightly worse than that of the aforementioned two benchmark methods. This is due to the fact that the benchmark methods often suffer from severe color distortion in the sky, whereas aerial images generally cover territorial areas. Therefore, the reduced performance for aerial images with dense haze is explicable.
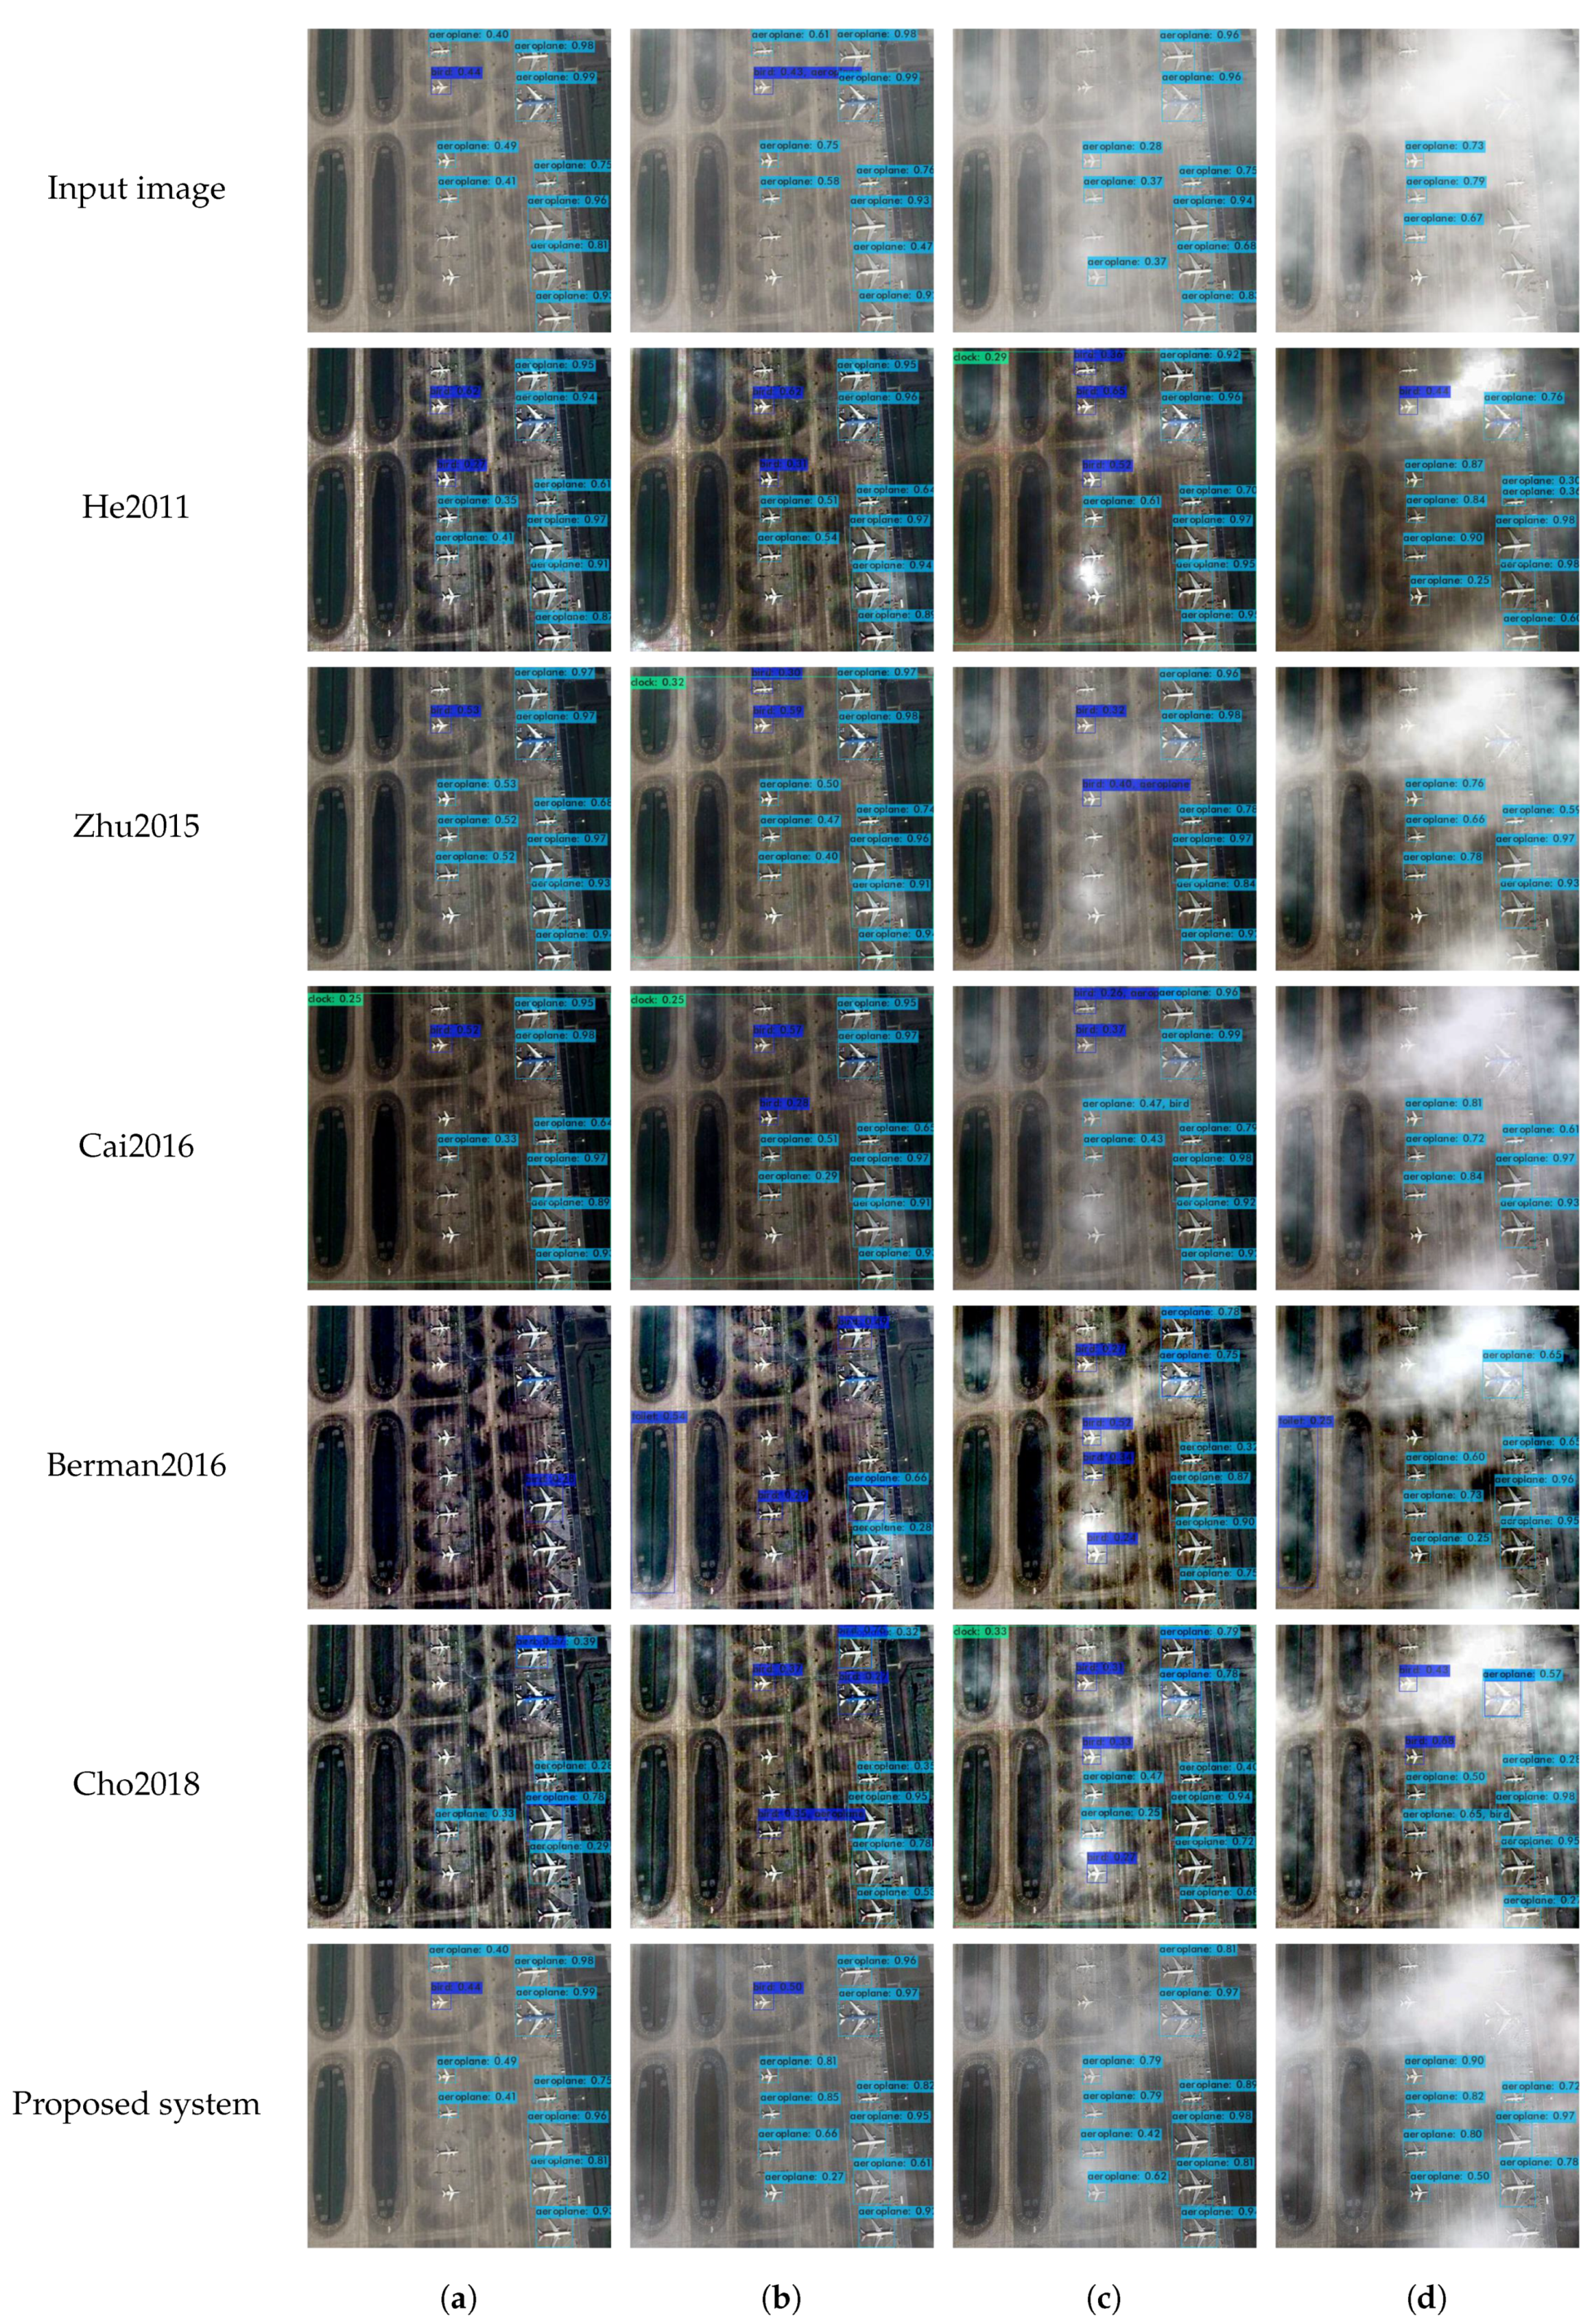
Finally, we assessed the performance of a YOLOv4-based high-level object recognition algorithm (mentioned in Section 1.1) on the dehazed results depicted in Figure 9. Table 8 summarizes the detection results, while Figure 11 illustrates them visually. The term Failure in Table 8 denotes the number of incorrectly detected objects. It is also noteworthy that the detection results reported in the table were aggregated based on the confidence level. The results for the method of Zhu et al. [11] for a moderately hazy image in Figure 11 can be taken as an example. The recognition algorithm yielded two detection results for the airplane near the center of the image: bird with 40 % confidence and airplane with 31 % confidence. Therefore, the final result for that airplane was the label with the higher confidence level, i.e., bird. Obviously, the algorithm incurred a Failure in this case, and the underlying reason was probably color distortion occurring due to excess haze removal.
Based on Table 8 and Figure 11, the proposed system is clearly superior to the benchmark methods because it does not cause any additional Failures compared with the input image. Two Failures for haze-free and thin haze images are inherent in the input image itself. In contrast, the benchmark methods are prone to excess haze removal, and therein lies the cause of many Failures.
Algorithm 3 Synthetic hazy/cloudy image generation
Input: Clean image J R H × W × 3 , cut-off frequency F c [ 0 , π ] , haze density control
   D ρ R 0 + and its step δ , desirable HDE score ρ d [ 0 , 1 ] , HDE tolerance Δ ρ , and
  maximum iteration M I
Output: Synthetic hazy/cloudy image I R H × W × 3
Auxiliary functions: T ( H , W , F c ) generates a H × W transmission map described in
  Algorithm 2, r a n d u ( x , y ) generates a uniformly distributed number in the range [ x , y ] ,
   D ( I ) calculates the HDE score of the image I , and  s g n ( · ) is the sign function defined in
  Equation (11)
BEGIN
   1:
Derive global atmospheric light:  A = r a n d u ( 0.8 , 1 )
   2:
Derive transmission map:  t = T ( H , W , F c )
   3:
Synthesize hazy/cloudy image:  I = J t D ρ + A [ 1 t D ρ ]
   4:
Calculate HDE score:  ρ I = D ( I )
   5:
Initialize:  i = 0 , ε = ρ I ρ d
   6:
while  ε > Δ ρ AND i < M I  do
   7:
    Adjust haze density:  D ρ = [ D ρ s g n ( ε ) ] δ 1 ε
   8:
    Repeat steps 3 and 4
   9:
    Update:  i = i + 1 , ε = ρ I ρ d
 10:
end while
END

4.3. Limitations

The preceding evaluation demonstrates that the superiority of the proposed system over the five benchmark methods can be attributed to the self-calibrating factor. As this factor’s calculation depends on the HDE, the same applies to the proposed system. In other words, it inherits the HDE’s limitations. According to Ngo et al. [4], the HDE is prone to the following two problems:
  • Misclassifying haze-free images with a broad and smooth background as mildly hazy;
  • Misclassifying hazy night-time images as haze-free.
If one of these two situations arises, the proposed system may produce post-dehazing artifacts due to incorrect self-calibration. However, it is noteworthy that the degradation degree is virtually unnoticeable, as demonstrated in [7]. Furthermore, these limitations are seldom a matter of concern because of the HDE’s exceptional accuracy of 96 % in hazy/haze-free image classification.

5. Conclusions

This paper presented an FPGA-based autonomous dehazing system that could handle real-time DCI 4K images/videos. Starting from the position that the currently predominant deep approach represented overkill, we analyzed a non-deep approach for autonomous image dehazing. Under this approach, the fundamental idea was to combine the input image and its dehazed result according to the haze condition. After that, we adopted pipelining, fixed-point design, and split multiplying to devise a 4K-capable FPGA implementation. We then conducted a comparative evaluation with other benchmark hardware designs to verify its efficacy. In addition, we presented a performance evaluation on outdoor and aerial images to demonstrate its effectiveness in various circumstances, rendering the proposed implementation highly relevant to real-life systems (such as autonomous driving vehicles and aerial surveillance).
Furthermore, we pointed out two inherent limitations of the proposed system: handling haze-free images with a broad and homogeneous background and handling hazy night-time images. Since the adopted HDE discriminated the haze condition of these images incorrectly, the self-calibration feature did not function as intended. Such limitations notwithstanding, the proposed system is deemed to be reliable due to the HDE’s high reliability for haze condition discrimination.

Author Contributions

Conceptualization, B.K.; methodology, B.K., D.N. and S.L.; software, D.N. and S.L.; data curation, S.L.; writing—original draft preparation, D.N.; writing—review and editing, B.K., D.N. and S.L.; supervision, B.K. All authors have read and agreed to the published version of the manuscript.

Funding

This research was funded by research funds from Dong-A University, Busan, Korea.

Data Availability Statement

Data are available in a publicly accessible repository. The data presented in this study are openly available in [1,46,47,48,49,50] and FigShare at 10.6084/m9.figshare.14729052.v1.

Conflicts of Interest

The authors declare no conflict of interest.

Appendix A

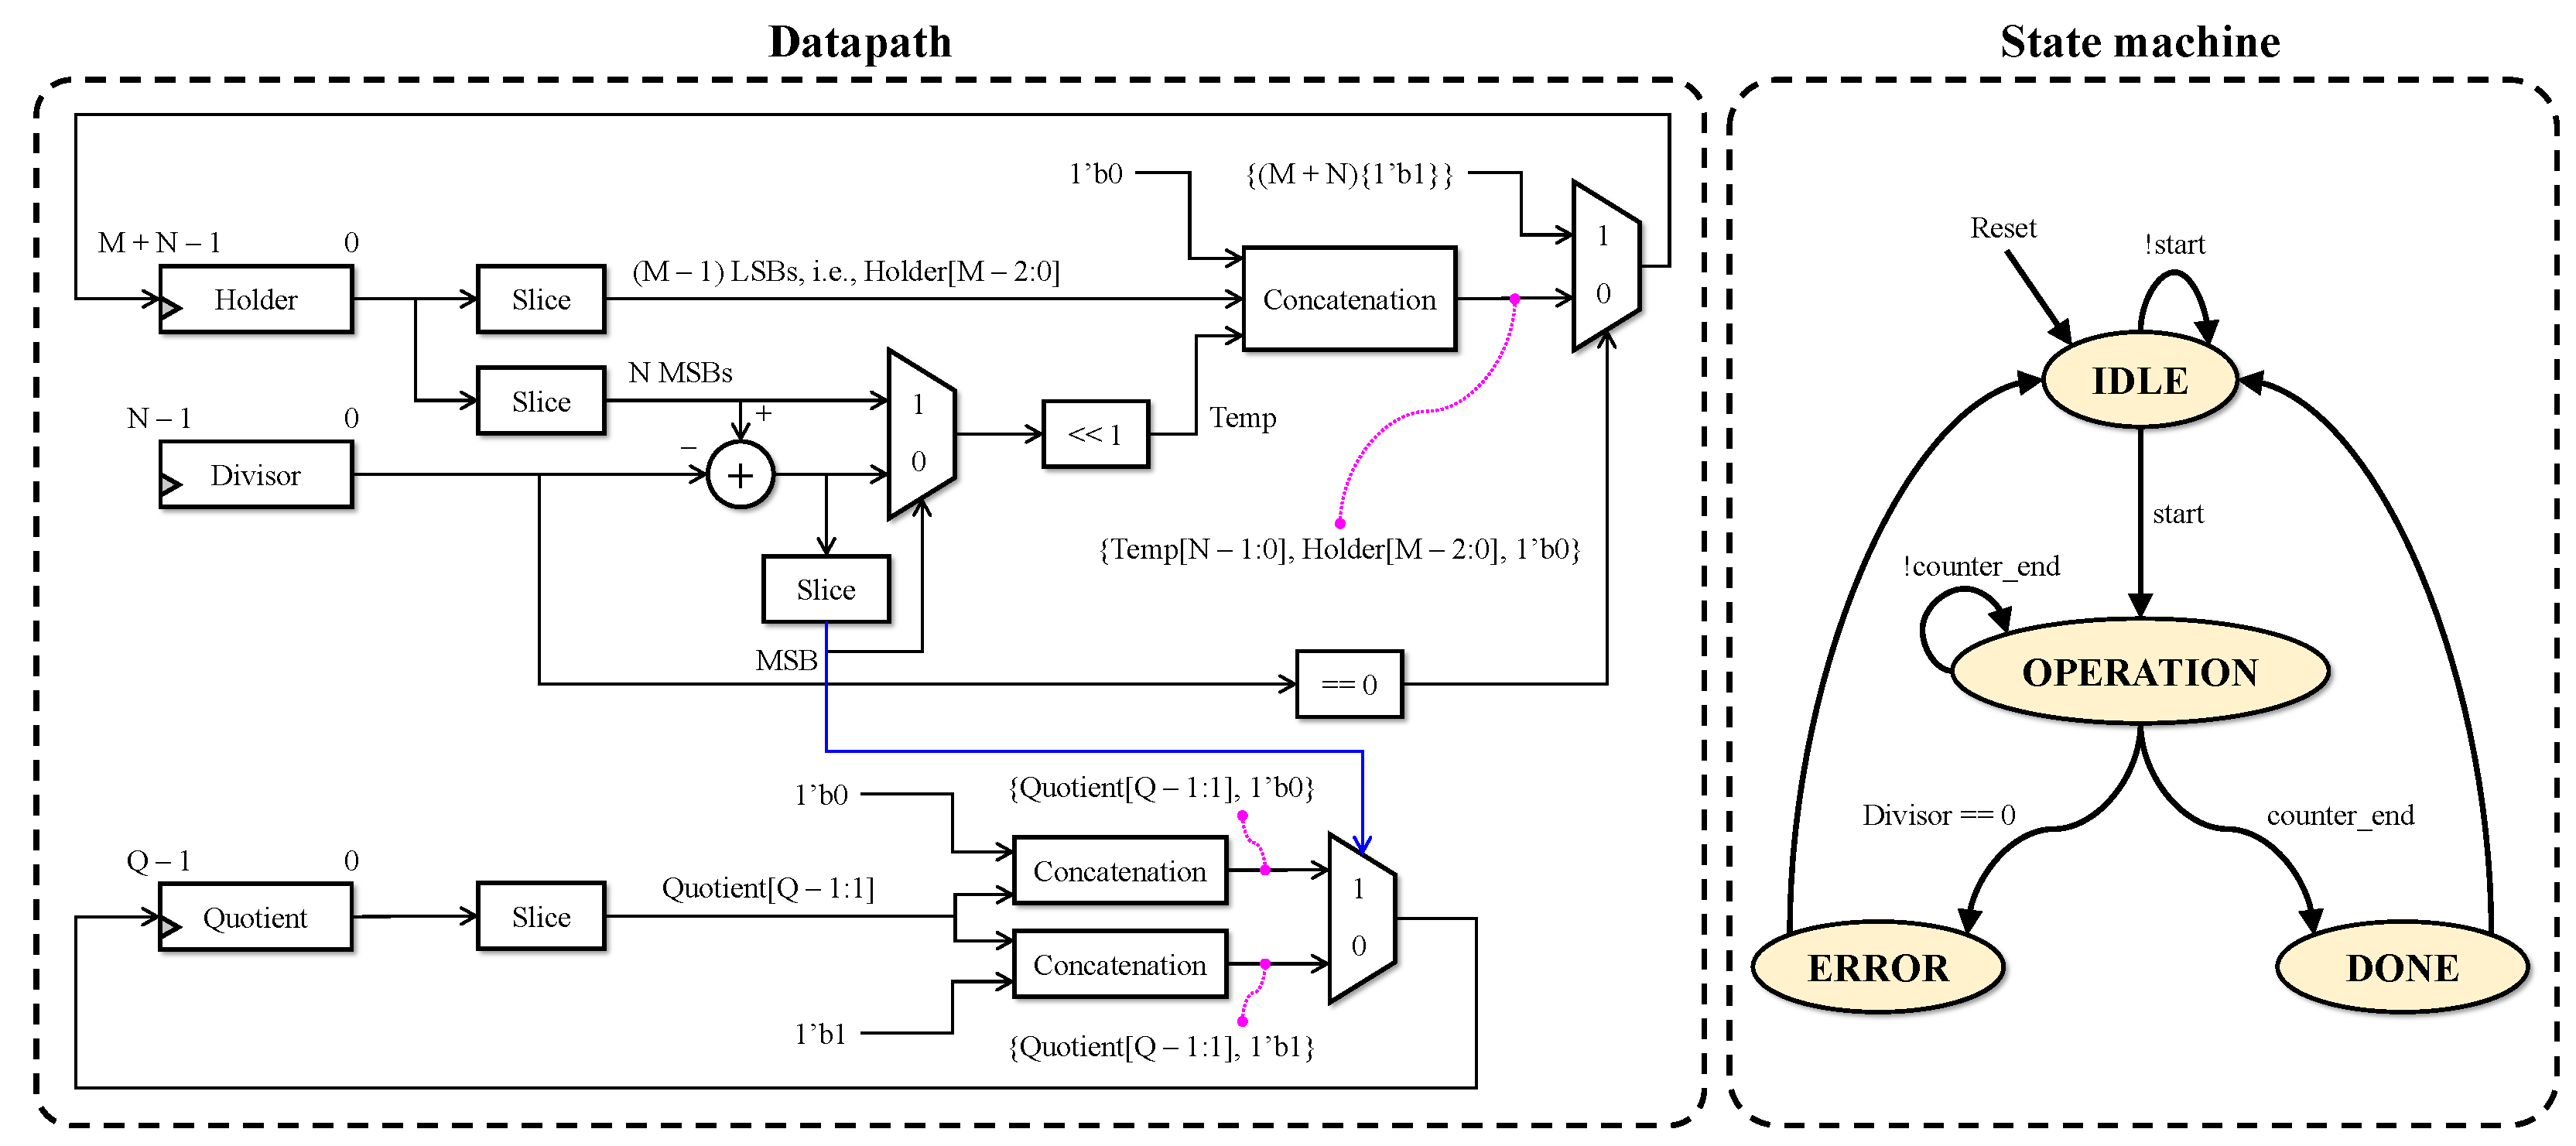
This appendix discusses the design of serial and parallel dividers in arithmetic macros. Figure A1 depicts the datapath and state machine for realizing the former type, which is appropriate for dividing user-defined parameters. The datapath consists of three main registers: the ( M + N ) -bit holder, N-bit divisor, and Q-bit quotient. There is also an implicit counter to signify the completion of division. Upon the transition from IDLE to OPERATION, the holder is loaded with an M-bit dividend at the least significant positions and zero-padded to ( M + N ) bits.
According to the state machine, the operation is relatively straightforward. Upon reset, the serial divider is in the IDLE state. When the start signal occurs, this changes to the OPERATION state, and loads the dividend and divisor into holder and divisor registers. In this state, if the divisor is equal to zero, the divider changes to the ERROR state and produces a flag to signify division by zero. After that, it returns to the IDLE state. Otherwise, it starts the implicit counter and compares the divisor to every bit of the dividend, beginning with the most significant bit and proceeding according to the comparison result. It also generates quotient bits, and shifts them to the quotient register at the least significant position. When the quotient register captures all Q bits, the counter produces a signal to trigger a transition to the DONE state. The divider then returns to the IDLE state and waits for the next call.
Figure A1. Datapath and state machine of the serial divider. The blue arrow is adopted to signify no intersection. MSB and LSB stand for most significant bit and least significant bit.
Remotesensing 14 01852 g0a1
It is noteworthy that the serial divider cannot accept new input data during operation. Therefore, it is inappropriate for dividing back-to-back pixel data. To address this problem, we eliminate the state machine, and put Q copies of the datapath (without an implicit counter) into a processing pipeline. In this context, the holder, divisor, and quotient registers of a particular copy are connected to those of the next copy, as Figure A2 shows. This parallel divider can handle a continuous pixel data flow but it requires more hardware resources than the serial divider.
Figure A2. Datapath of the parallel divider.
Remotesensing 14 01852 g0a2

Appendix B

This appendix discusses the design of square rooters in arithmetic macros. There are serial and parallel square rooters, but we utilized only the parallel design in the proposed autonomous dehazing system. Figure A3 depicts the datapath of the parallel square rooter. The input datum is an M-bit squarand, and the output datum is an S-bit sqrt. The operation principle is similar to that of dividers, except that the square rooter takes every two-bit group of the squarand (beginning with most significant bits) for comparison.
Figure A3. Datapath of the parallel square rooter. Blue arrows are adopted to signify no intersection, and MSB stands for most significant bit.
Remotesensing 14 01852 g0a3

References

  1. Xia, G.S.; Hu, J.; Hu, F.; Shi, B.; Bai, X.; Zhong, Y.; Zhang, L.; Lu, X. AID: A Benchmark Data Set for Performance Evaluation of Aerial Scene Classification. IEEE Trans. Geosci. Remote Sens. 2017, 55, 3965–3981. [Google Scholar] [CrossRef] [Green Version]
  2. Cho, Y.; Jeong, J.; Kim, A. Model-Assisted Multiband Fusion for Single Image Enhancement and Applications to Robot Vision. IEEE Robot. Autom. Lett. 2018, 3, 2822–2829. [Google Scholar] [CrossRef]
  3. Bochkovskiy, A.; Wang, C.Y.; Liao, H.Y. YOLOv4: Optimal Speed and Accuracy of Object Detection. arXiv 2020, arXiv:2004.10934. [Google Scholar]
  4. Ngo, D.; Lee, G.; Kang, B. Haziness degree evaluator: A knowledge-driven approach for haze density estimation. Sensors 2021, 21, 3896. [Google Scholar] [CrossRef] [PubMed]
  5. Adimec. Technical Specifications for S-65A35 CoaXPress. Available online: https://www.adimec.com/cameras/machine-vision-cameras/sapphire-series/s-65a35-with-gpixel-gmax3265-65mp-sensor/ (accessed on 16 December 2021).
  6. Azimi, S. ShuffleDet: Real-Time Vehicle Detection Network in On-Board Embedded UAV Imagery. In Computer Vision—ECCV 2018, Proceedings of the European Conference on Computer Vision, Munich, Germany, 8–14 September 2018; Leal-Taixe, L., Roth, S., Eds.; Lecture Notes in Computer Science; Springer: Cham, Switzerland, 2019; pp. 88–99. [Google Scholar] [CrossRef] [Green Version]
  7. Ngo, D.; Lee, S.; Lee, G.D.; Kang, B. Automating a Dehazing System by Self-Calibrating on Haze Conditions. Sensors 2021, 21, 6373. [Google Scholar] [CrossRef]
  8. Tarel, J.; Hautiere, N. Fast visibility restoration from a single color or gray level image. In Proceedings of the 2009 IEEE 12th International Conference on Computer Vision, Kyoto, Japan, 27 September–2 October 2009; pp. 2201–2208. [Google Scholar] [CrossRef]
  9. He, K.; Sun, J.; Tang, X. Single Image Haze Removal Using Dark Channel Prior. IEEE Trans. Pattern Anal. Mach. Intell. 2011, 33, 2341–2353. [Google Scholar] [CrossRef]
  10. Ngo, D.; Lee, S.; Nguyen, Q.; Ngo, T.; Lee, G.; Kang, B. Single Image Haze Removal from Image Enhancement Perspective for Real-Time Vision-Based Systems. Sensors 2020, 20, 5170. [Google Scholar] [CrossRef]
  11. Zhu, Q.; Mai, J.; Shao, L. A Fast Single Image Haze Removal Algorithm Using Color Attenuation Prior. IEEE Trans. Image Process. 2015, 24, 3522–3533. [Google Scholar] [CrossRef] [Green Version]
  12. Berman, D.; Treibitz, T.; Avidan, S. Non-local Image Dehazing. In Proceedings of the 2016 IEEE Conference on Computer Vision and Pattern Recognition (CVPR), Las Vegas, NV, USA, 27–30 June 2016; pp. 1674–1682. [Google Scholar] [CrossRef]
  13. Cai, B.; Xu, X.; Jia, K.; Qing, C.; Tao, D. DehazeNet: An End-to-End System for Single Image Haze Removal. IEEE Trans. Image Process. 2016, 25, 5187–5198. [Google Scholar] [CrossRef] [Green Version]
  14. Ren, W.; Liu, S.; Zhang, H.; Pan, J.; Cao, X.; Yang, M. Single Image Dehazing via Multi-scale Convolutional Neural Networks. In Proceedings of the 2016 European Conference on Computer Vision (ECCV), Amsterdam, The Netherlands, 11–14 October 2016; pp. 154–169. [Google Scholar] [CrossRef]
  15. Nvidia. Jetson TX2 Module. Available online: https://developer.nvidia.com/embedded/jetson-tx2 (accessed on 16 December 2021).
  16. Wielage, M.; Cholewa, F.; Fahnemann, C.; Pirsch, P.; Blume, H. High Performance and Low Power Architectures: GPU vs. FPGA for Fast Factorized Backprojection. In Proceedings of the 2017 Fifth International Symposium on Computing and Networking (CANDAR), Aomori, Japan, 19–22 November 2017; pp. 351–357. [Google Scholar] [CrossRef]
  17. Vincent, R. An ERTS Multispectral Scanner experiment for mapping iron compounds. In Proceedings of the Eight International Symposium on Remote Sensing of Environment, Ann Arbor, MI, USA, 2–6 October 1972; pp. 1239–1247. [Google Scholar]
  18. Chavez, P.S., Jr. Atmospheric, solar, and MTF corrections for ERTS digital imagery. In Proceedings of the American Society of Photogrammetry, Fall Technical Meeting, Phoenix, AZ, USA, 26–31 October 1975; p. 69. [Google Scholar]
  19. Liang, J.; Ju, H.; Ren, L.; Yang, L.; Liang, R. Generalized Polarimetric Dehazing Method Based on Low-Pass Filtering in Frequency Domain. Sensors 2020, 20, 1729. [Google Scholar] [CrossRef] [Green Version]
  20. Liang, J.; Ren, L.; Liang, R. Low-pass filtering based polarimetric dehazing method for dense haze removal. Opt. Express 2021, 29, 28178–28189. [Google Scholar] [CrossRef]
  21. Ancuti, C.; Ancuti, C. Single Image Dehazing by Multi-Scale Fusion. IEEE Trans. Image Process. 2013, 22, 3271–3282. [Google Scholar] [CrossRef] [PubMed]
  22. Ancuti, C.; Ancuti, C.; De Vleeschouwer, C.; Bovik, A. Day and Night-Time Dehazing by Local Airlight Estimation. IEEE Trans. Image Process. 2020, 29, 6264–6275. [Google Scholar] [CrossRef] [PubMed]
  23. Lee, Z.; Shang, S. Visibility: How Applicable is the Century-Old Koschmieder Model? J. Atmos. Sci. 2016, 73, 4573–4581. [Google Scholar] [CrossRef]
  24. Zhang, J.; Tao, D. FAMED-Net: A Fast and Accurate Multi-Scale End-to-End Dehazing Network. IEEE Trans. Image Process. 2020, 29, 72–84. [Google Scholar] [CrossRef] [Green Version]
  25. Li, R.; Pan, J.; He, M.; Li, Z.; Tang, J. Task-Oriented Network for Image Dehazing. IEEE Trans. Image Process. 2020, 29, 6523–6534. [Google Scholar] [CrossRef]
  26. Ngo, D.; Lee, S.; Ngo, T.; Lee, G.D.; Kang, B. Visibility Restoration: A Systematic Review and Meta-Analysis. Sensors 2021, 21, 2625. [Google Scholar] [CrossRef]
  27. Tang, K.; Yang, J.; Wang, J. Investigating Haze-Relevant Features in a Learning Framework for Image Dehazing. In Proceedings of the 2014 IEEE Conference on Computer Vision and Pattern Recognition, Columbus, OH, USA, 23–28 June 2014; pp. 2995–3002. [Google Scholar] [CrossRef] [Green Version]
  28. Jiang, Y.; Sun, C.; Zhao, Y.; Yang, L. Fog Density Estimation and Image Defogging Based on Surrogate Modeling for Optical Depth. IEEE Trans. Image Process. 2017, 26, 3397–3409. [Google Scholar] [CrossRef]
  29. Li, B.; Ren, W.; Fu, D.; Tao, D.; Feng, D.; Zeng, W.; Wang, Z. Benchmarking Single Image Dehazing and Beyond. IEEE Trans. Image Process. 2019, 28, 492–505. [Google Scholar] [CrossRef] [Green Version]
  30. Levin, A.; Lischinski, D.; Weiss, Y. A Closed-Form Solution to Natural Image Matting. IEEE Trans. Pattern Anal. Mach. Intell. 2008, 30, 228–242. [Google Scholar] [CrossRef] [Green Version]
  31. He, K.; Sun, J.; Tang, X. Guided image filtering. IEEE Trans. Pattern Anal. Mach. Intell. 2013, 35, 1397–1409. [Google Scholar] [CrossRef]
  32. Li, Z.; Zheng, J.; Zhu, Z.; Yao, W.; Wu, S. Weighted guided image filtering. IEEE Trans. Image Process. 2015, 24, 120–129. [Google Scholar] [CrossRef] [PubMed]
  33. Sun, Z.; Han, B.; Li, J.; Zhang, J.; Gao, X. Weighted Guided Image Filtering with Steering Kernel. IEEE Trans. Image Process. 2020, 29, 500–508. [Google Scholar] [CrossRef] [PubMed]
  34. Ngo, D.; Lee, G.; Kang, B. Improved Color Attenuation Prior for Single-Image Haze Removal. Appl. Sci. 2019, 9, 4011. [Google Scholar] [CrossRef] [Green Version]
  35. Ngo, D.; Lee, S.; Lee, G.; Kang, B. Single-Image Visibility Restoration: A Machine Learning Approach and Its 4K-Capable Hardware Accelerator. Sensors 2020, 20, 5795. [Google Scholar] [CrossRef] [PubMed]
  36. Galdran, A. Image dehazing by artificial multiple-exposure image fusion. Signal Process. 2018, 149, 135–147. [Google Scholar] [CrossRef]
  37. Amdahl, G. Validity of the single processor approach to achieving large scale computing capabilities. In Proceedings of the Spring Joint Computer Conference, Atlantic City, NJ, USA, 18–20 April 1967; pp. 483–485. [Google Scholar] [CrossRef]
  38. IEEE Std 1364-2005 (Revision of IEEE Std 1374-2001); IEEE Standard for Verilog Hardware Description Language. IEEE: New York, NY, USA, 2006; pp. 1–590. [CrossRef]
  39. Cho, H.; Kim, G.J.; Jang, K.; Lee, S.; Kang, B. Color Image Enhancement Based on Adaptive Nonlinear Curves of Luminance Features. J. Semicond. Technol. Sci. 2015, 15, 60–67. [Google Scholar] [CrossRef]
  40. Xilinx. Zynq-7000 SoC Data Sheet: Overview (DS190). Available online: https://www.xilinx.com/support/documentation/data_sheets/ds190-Zynq-7000-Overview.pdf (accessed on 30 December 2021).
  41. Xilinx. Vivado Design Suite User Guide: Release Notes, Installation, and Licensing (UG973). Available online: https://www.xilinx.com/support/documentation/sw_manuals/xilinx2019_1/ug973-vivado-release-notes-install-license.pdf (accessed on 31 December 2021).
  42. Ngo, D.; Lee, G.; Kang, B. A 4K-Capable FPGA Implementation of Single Image Haze Removal Using Hazy Particle Maps. Appl. Sci. 2019, 9, 3443. [Google Scholar] [CrossRef] [Green Version]
  43. Park, Y.; Kim, T. A video dehazing system based on fast airlight estimation. In Proceedings of the 2017 IEEE Global Conference on Signal and Information Processing (GlobalSIP), Montreal, QC, Canada, 14–16 November 2017; pp. 779–783. [Google Scholar] [CrossRef]
  44. Wang, Z.; Bovik, A.; Sheikh, H.; Simoncelli, E. Image quality assessment: From error visibility to structural similarity. IEEE Trans. Image Process. 2004, 13, 600–612. [Google Scholar] [CrossRef] [Green Version]
  45. Zhang, L.; Zhang, L.; Mou, X.; Zhang, D. FSIM: A Feature Similarity Index for Image Quality Assessment. IEEE Trans. Image Process. 2011, 20, 2378–2386. [Google Scholar] [CrossRef] [Green Version]
  46. Tarel, J.; Hautiere, N.; Caraffa, L.; Cord, A.; Halmaoui, H.; Gruyer, D. Vision Enhancement in Homogeneous and Heterogeneous Fog. IEEE Intell. Transp. Syst. Mag. 2012, 4, 6–20. [Google Scholar] [CrossRef] [Green Version]
  47. Ancuti, C.; Ancuti, C.; Vleeschouwer, C. D-HAZY: A dataset to evaluate quantitatively dehazing algorithms. In Proceedings of the 2016 IEEE International Conference on Image Processing (ICIP), Phoenix, AZ, USA, 25–28 September 2016; pp. 2226–2230. [Google Scholar] [CrossRef]
  48. Ancuti, C.; Ancuti, C.; Timofte, R.; Vleeschouwer, C. O-HAZE: A Dehazing Benchmark with Real Hazy and Haze-Free Outdoor Images. In Proceedings of the 2018 IEEE/CVF Conference on Computer Vision and Pattern Recognition Workshops (CVPRW), Salt Lake City, UT, USA, 18–22 June 2018; pp. 867–8678. [Google Scholar] [CrossRef] [Green Version]
  49. Ancuti, C.; Ancuti, C.; Timofte, R.; De Vleeschouwer, C. I-HAZE: A dehazing benchmark with real hazy and haze-free indoor images. arXiv 2018, arXiv:1804.05091. [Google Scholar]
  50. Ancuti, C.; Ancuti, C.; Sbert, M.; Timofte, R. Dense-Haze: A Benchmark for Image Dehazing with Dense-Haze and Haze-Free Images. In Proceedings of the 2019 IEEE International Conference on Image Processing (ICIP), Taipei, Taiwan, 22–25 September 2019; pp. 1014–1018. [Google Scholar] [CrossRef] [Green Version]
Figure 1. Illustration of the negative effects of cloud and beneficial effects of image dehazing on an aerial surveillance application. First row: (a) a clean image and its corresponding (b) synthetic cloudy image and (c) dehazed result. Second row: (df) results obtained after processing (ac) using a YOLOv4-based high-level object recognition algorithm. Notes: cyan labels represent airplanes, and navy-blue labels represent birds.
Remotesensing 14 01852 g001
Figure 2. Illustration of the negative effects of image dehazing on an aerial surveillance application when the input image is clean. (a,b) A clean image and its corresponding dehazed result. (c,d) Detection results obtained after processing of (a,b) by a YOLOv4-based high-level object recognition algorithm. Notes: (a,c) were adopted from Figure 1a,d. Cyan labels represent airplanes, and navy-blue labels represent birds.
Remotesensing 14 01852 g002
Figure 3. Block diagram of the autonomous dehazing algorithm in [7].
Remotesensing 14 01852 g003
Figure 4. Illustration of the multi-scale image dehazing in Algorithm 1 with K = 3 and N = 3 .
Remotesensing 14 01852 g004
Figure 5. Illustration of a naive parallelization of the autonomous dehazing algorithm.
Remotesensing 14 01852 g005
Figure 6. Pipelined architecture of the proposed FPGA implementation.
Remotesensing 14 01852 g006
Figure 7. Qualitative evaluation of different image dehazing methods on outdoor images. (ad) correspond to four haze conditions: haze-free, thin, moderate, and dense. The ρ I values of input images are 0.7853 , 0.8986 , 0.9216 , and 0.9388 , respectively. He2011, Zhu2015, Cai2016, Berman2016, and Cho2018 denote five benchmark methods of He et al. [9], Zhu et al. [11], Cai et al. [13], Berman et al. [12], and Cho et al. [2].
Remotesensing 14 01852 g007
Figure 8. Intuitive illustration of synthetic haze/cloud generation.
Remotesensing 14 01852 g008
Figure 9. Qualitative evaluation of different image dehazing methods on an aerial image depicting an airport. (ad) correspond to four haze conditions: haze-free, thin, moderate, and dense. The ρ I values of input images are 0.8771 , 0.9026 , 0.9279 , and 0.9594 , respectively. He2011, Zhu2015, Cai2016, Berman2016, and Cho2018 denote five benchmark methods of He et al. [9], Zhu et al. [11], Cai et al. [13], Berman et al. [12], and Cho et al. [2].
Remotesensing 14 01852 g009
Figure 10. Qualitative evaluation of different image dehazing methods on an aerial image depicting a city center. (ad) correspond to four haze conditions: haze-free, thin, moderate, and dense. The ρ I values of input images are 0.8581 , 0.8974 , 0.9135 , and 0.9556 , respectively. He2011, Zhu2015, Cai2016, Berman2016, and Cho2018 denote five benchmark methods of He et al. [9], Zhu et al. [11], Cai et al. [13], Berman et al. [12], and Cho et al. [2].
Remotesensing 14 01852 g010
Figure 11. Detection results for a YOLOv4-based high-level object recognition algorithm operating on images in Figure 9. (ad) correspond to four haze conditions: haze-free, thin, moderate, and dense. The ρ I values of input images are 0.8771 , 0.9026 , 0.9279 , and 0.9594 , respectively. He2011, Zhu2015, Cai2016, Berman2016, and Cho2018 denote five benchmark methods of He et al. [9], Zhu et al. [11], Cai et al. [13], Berman et al. [12], and Cho et al. [2]. Notes: cyan labels represent airplanes, navy-blue labels represent birds, and green labels represent clocks.
Remotesensing 14 01852 g011
Table 1. Processing time in seconds of different image dehazing methods for different image resolutions.
Resolution 640 × 480 800 × 600 1024 × 768 1920 × 1080 4096 × 2160
Method
Tarel and Hautiere [8]0.280.590.761.519.02
He et al. [9]12.6419.9432.3794.25470.21
Ngo et al. [10]0.260.390.641.687.18
Zhu et al. [11]0.220.340.551.516.39
Berman et al. [12]2.655.546.615.7434.39
Cho et al. [2]0.510.661.243.6011.62
Cai et al. [13]1.532.393.8810.6847.35
Ren et al. [14]0.540.881.533.4317.90
Ngo et al. [7]0.651.121.884.9420.36
Table 2. Summary of image dehazing categories.
CategoryDescriptionRepresentative Studies
Image processingUses traditional computer vision techniques and only the input RGB image[7,8,9,10]
Machine learningUses machine learning techniques additionally to exploit the hidden regularities in relevant image datasets[11,12,27,28]
Deep learningUses deep neural networks with powerful representation capability to learn relevant mapping functions[13,14,24,25]
Table 3. Hardware implementation results for the proposed autonomous dehazing system. LUT stands for look-up table, and the symbol # denotes quantities.
Xilinx Vivado v2019.1
DeviceXC7Z045-2FFG900
Slice Logic UtilizationAvailableUsedUtilization
Slice registers (#)437,20053,21612.17%
Slice LUTs (#)218,60049,79922.78%
RAM36E1/FIFO36E1s545458.26%
RAM18E1/FIFO18E1s1090222.02%
Minimum period3.685 ns
Maximum frequency271.37 MHz
Table 4. Maximum processing speeds in frames per second for different image resolutions. The symbol # denotes quantities.
StandardResolutionRequired Clock Cycles (#)Processing Speed ( MPS )
Full HD 1920 × 1080 2,076,601130.68
Quad HD 2560 × 1440 3,690,40173.53
4KUW4K 3840 × 1600 6,149,44144.13
UHD TV 3840 × 2160 8,300,40132.69
DCI 4K 4096 × 2160 8,853,61730.65
Table 5. Comparison with existing benchmark designs. The symbol # denotes quantities.
Hardware UtilizationPark and Kim [43]Ngo et al. [42]Ngo et al. [35]Proposed Design
Registers (#)53,40070,86457,84853,216
LUTs (#)64,00056,66453,56949,799
DSPs (#)42000
Memory (Mbits)3.21.52.41.4
Maximum frequency (MHz)88.70236.29271.67271.37
Maximum resolutionSVGADCI 4KDCI 4KDCI 4K
Autonomous dehazingUnequippedUnequippedUnequippedEquipped
Table 6. Average mean squared error (MSE), structural similarity (SSIM), and feature similarity extended to color images (FSIMc) scores on different datasets. Top three results are boldfaced in red, green, and blue.
MethodHe et al. [9]Zhu et al. [11]Cai et al. [13]Berman et al. [12]Cho et al. [2]Proposed System
DatasetMSESSIMFSIMcMSESSIMFSIMcMSESSIMFSIMcMSESSIMFSIMcMSESSIMFSIMcMSESSIMFSIMc
FRIDA2Hazy0.07440.59690.77460.07440.54730.79180.06790.62890.79630.07050.66030.73230.15590.55170.67920.06360.73780.8007
Haze-free0.02950.78700.95860.07050.44140.91020.04300.59010.97030.02640.73380.87700.22610.53570.66680.00160.98900.9977
D-HAZYHazy0.03090.83480.90020.04830.79840.88800.05280.79160.88740.04920.74730.83950.06060.72120.83160.06690.76140.8691
Haze-free0.02110.90490.95410.03170.79570.89680.01110.88230.98430.03590.79940.86810.03360.72520.82810.00170.99110.9953
O-HAZEHazy0.02000.77090.84230.02260.66470.77380.02660.69990.78650.02550.80240.86050.01960.77450.85040.02720.75620.8277
Haze-free0.00860.92210.96450.03350.65080.86790.01350.83840.98390.02570.70540.82530.02270.67310.81580.00001.00001.0000
I-HAZEHazy0.05350.65800.82080.03620.68640.82520.03200.71160.84820.02750.79590.88230.03440.76930.86070.02810.77930.8611
Haze-free0.03610.80300.93350.04410.63530.87160.02730.67040.97510.03110.74910.86080.03170.71840.83240.00010.99970.9998
Dense-HazeHazy0.05490.46620.64190.06460.41710.57730.07930.39230.55730.05970.52250.71690.05490.52540.68670.06520.43180.5939
Haze-free0.02120.87900.94140.04580.60770.85080.02030.77670.97760.03470.73210.83390.02410.71470.82370.00020.99930.9996
500IMGHaze-free0.01170.93500.95630.03200.76680.87950.00700.89670.98700.02420.81930.88550.01960.78520.86050.00010.99940.9996
TotalHazy0.06210.62070.77460.06340.57640.76930.06150.62030.77250.06000.67200.76080.11390.59730.72280.05750.70370.7845
Haze-free0.01500.90790.95480.03640.71220.87980.01270.84580.98400.02540.79560.87640.04180.74630.83780.00030.99820.9993
Overall0.03230.80250.88860.04630.66230.83920.03060.76300.90630.03810.75020.83400.06820.69160.79640.02130.89010.9204
Table 7. Average MSE, SSIM, and FSIMc scores on synthetic aerial hazy images. Top three results for each image are boldfaced in red, green, and blue.
MethodHe et al. [9]Zhu et al. [11]Cai et al. [13]Berman et al. [12]Cho et al. [2]Proposed System
ImageMSESSIMFSIMcMSESSIMFSIMcMSESSIMFSIMcMSESSIMFSIMcMSESSIMFSIMcMSESSIMFSIMc
Figure 9Haze-free0.02710.72610.82540.01930.85700.95070.06150.61870.96630.05810.49020.75280.03870.52330.71320.00001.00001.0000
Thin0.02690.77540.87350.01240.90930.96160.04340.75390.96780.03240.62710.76050.03190.58480.74070.00280.96850.9778
Moderate0.02060.82980.91340.01210.88480.95720.01480.87400.95910.03460.59900.77910.02110.66600.78420.00810.88880.9387
Dense0.03170.74860.87690.05700.73050.87330.04570.75340.87190.04800.64480.79610.04660.65020.79230.05810.74500.8641
Figure 10Haze-free0.01100.95950.96530.08240.69840.87920.01310.95780.98600.04710.73630.81690.05060.77200.87190.00001.00001.0000
Thin0.01100.95120.95600.06810.75460.91330.00990.96440.98260.03300.76500.82110.04730.77730.87170.00160.98360.9823
Moderate0.01080.94930.95420.05500.80520.92860.00790.96930.98240.03650.75900.81840.04290.79550.88030.00410.96460.9648
Dense0.04250.80620.86640.02470.86290.90370.01570.88380.90860.10460.63090.81780.02680.85080.90270.01850.85640.8724
Table 8. Summary of detection results for a YOLOv4-based high-level object recognition algorithm operating on images in Figure 9. The symbol # denotes quantities.
CaseHaze-FreeThinModerateDense
Method Airplane (#)Failure (#)Airplane (#)Failure (#)Airplane (#)Failure (#)Airplane (#)Failure (#)
Input91919030
He et al. [9]91827491
Zhu et al. [11]91936260
Cai et al. [13]72838260
Berman et al. [12]01236471
Cho et al. [2]41538472
Proposed system9110110070
Publisher’s Note: MDPI stays neutral with regard to jurisdictional claims in published maps and institutional affiliations.