Article

Temporal and Spatial Changes in Evapotranspiration and Its Potential Driving Factors in Mongolia over the Past 20 Years

1
College of Geographic Science, Inner Mongolia Normal University, Hohhot 010022, China
2
Inner Mongolia Key Laboratory of Remote Sensing and Geographic Information Systems, Inner Mongolia Normal University, Hohhot 010022, China
*
Author to whom correspondence should be addressed.
Remote Sens. 2022, 14(8), 1856; https://doi.org/10.3390/rs14081856
Submission received: 26 January 2022 / Revised: 23 March 2022 / Accepted: 23 March 2022 / Published: 12 April 2022

Abstract

:
Evapotranspiration (ET) plays an important role in the study of regional long-term water cycles. The water cycle in Mongolia has been seriously affected by global warming and the intensification of human activities. A significant relationship exists between climate factors and ET. In this paper, the temporal and spatial fluctuations and stability of ET in Mongolia from 2001 to 2020 were studied by using MOD16A2 ET, MOD13A2 NDVI and the climate data of ERA5-Land. ET trends were analysed by using the Breaks for Additive Season and Trend (BFAST) software package, Theil–Sen median trend analysis, Mann–Kendall method and Hurst index. The correlations between ET and temperature (Tem), precipitation (Pre), net solar radiation (Nsr), soil moisture (Swl) and human activities were determined by partial correlation analysis and a geographic detector. In the past 20 years, ET increased significantly in 49.4% of Mongolia, and NDVI also showed a significant increasing trend. BFAST detected two mutation years. ET decreased rapidly from 2006 to 2007 and increased rapidly from 2015 to 2016. In addition to winter, the meteorological factor that had a significant positive impact on ET in the east and west was Pre, whereas the impact of Tem was more obvious in central Mongolia. In winter, Tem had a great impact on ET. In the vegetation growing season, the joint action of NDVI and Pre greatly positively contributed to ET. The geographical detector showed that the influence of annual human factors on ET was weakened by changes in NDVI and Pre. In the growing season, Tem and Nsr increased nonlinearly to ET, and other natural and human factors showed bivariate enhancement. These results will help to understand the responses of ET changes to natural factors and human activities in Mongolia and provide data support for future research on ET and the water cycle.
Keywords:
ET; Mongolia; Hurst; BFAST; MOD16A2

1. Introduction

Evapotranspiration (ET) refers to the total water vapour flux transmitted to the atmosphere by surface soil and vegetation, mainly involving the evaporation of soil moisture and the transpiration of water by vegetation. ET is an important component of the land–water–air cycle and surface water–heat balance [1,2,3] and is the second largest component of the terrestrial water cycle (after precipitation), with approximately 60% of annual terrestrial precipitation returning to the atmosphere via ET. As an important process in the global climate system, ET affects not only the exchange of water, carbon and energy but also the distribution of energy and water, regional surface temperature and atmospheric humidity. Therefore, climate change is significantly correlated with ET [4,5,6,7,8]. Due to the increasing severity of global warming from human activities, the water cycle around the world is accelerating [9,10], corresponding to changes in ET [11,12]. As an important parameter of global climate change and the water cycle, ET occurs via complex mechanisms and is influenced by many factors, mainly precipitation, net radiation, wind speed, and temperature, and their influences on the difference in water vapour pressure [13,14]. Either directly or indirectly, soil moisture also influences ET as an important climate factor [15,16]. Previous studies have shown that vegetation transpiration accounts for approximately 56–74% of evapotranspiration. At the same time, the increase in CO2 concentration is believed to lead to the closure of vegetation stomata, thus affecting transpiration. Therefore, the gap between the increased precipitation and evaporation in the north will become larger in the future, and flood disasters will ultimately occur [17]. With the change in the water cycle, the risk of flooding and drought will increase. This will inevitably have an impact on ecology and human society. Therefore, the monitoring of ET is of great significance.
Accurate study of the temporal and spatial distribution of regional surface ET and its response to different climatic factors plays a positive role in monitoring regional droughts and floods, agricultural management and the development, management and scientific allocation of water resources [18,19]. However, uninterruptible monitoring systems are not common [20]. Various surface parameters, such as surface temperature, vegetation coverage, and soil moisture, especially under the influence of the combined effects of human activities and the regional ecological environment, have a profound impact on the spatiotemporal pattern of ET [21]. The ET time series can be obtained from ground-based observation data. Previous studies [17,18] typically used the Penman–Monteith method to estimate ET based on field-based eddy covariance flux towers and tower-based meteorological data, but site observations of ET, especially in arid areas with a sparse site density, cannot provide the spatial distribution characteristics of ET with an adequate resolution; in contrast, remote sensing technology can reflect the spatial nonuniformity of ET and accommodate the needs of research on global and regional scales. Among the existing spaceborne datasets, the Moderate Resolution Imaging Spectroradiometer (MODIS) MOD16A2 data product is relatively easy to acquire and use. With its high simulation accuracy and spatiotemporal resolution, the MOD16A2 dataset has been successfully utilized for the dynamic monitoring of global and regional ET and reflects the state of ET on the surface to some extent. For instance, Kim et al. [22] used vorticity-related data from 17 stations in the Asian Flux Network to verify the MOD16A2 product and analyse the application of the dataset under different climate conditions. MOD16A2GF is an improved version of MOD16A2 that removes poor-quality inputs of the 8-day leaf area index and photosynthetically active radiation fraction (LAI/FPAR) based on the quality control (QC) label of each pixel; if any LAI/FPAR pixel does not meet the quality check criteria, the pixel value is determined by linear interpolation.
Global climate change has altered the elements of the Earth’s water cycle and evaporation [3]. Water resources restrict agricultural and socioeconomic development in drylands. An especially salient example is Mongolia, which is located within an arid and semiarid climate and receives relatively little rainfall. Hence, Mongolia is characterized by a fragile ecological environment; desertification in southern Mongolia is particularly severe [23]. However, on a global scale, evapotranspiration accounts for approximately 60% of the total land precipitation [24]. Moreover, observation stations are relatively sparse in Mongolia, and few ET studies have been conducted in this region. Thus, using MOD16A2GF to study the temporal and spatial changes and future trends of ET in Mongolia is of great importance for improving the ability to cope with climate change, and the outcomes can serve as a benchmark for promoting sustainable regional socioeconomic development.
At present, researchers are focused primarily on the general trends of ET. The Sen gradient is a nonparametric method that is not affected by outliers or the distribution of skewness; thus, it is typically used to quantify the overall trend of an ET time series [25]. However, this method can be used to estimate only the magnitude of ET change and cannot determine the trend of the slope; thus, the results are not statistically significant. Therefore, researchers are increasingly using the Mann–Kendall test to assess monotonic trends (linear or nonlinear). This strategy is more reliable than using parameter statistics (for example, the usual least squares method). Thus, the Mann–Kendall method is considered highly suitable for studying ET trends [26]. From the trend analysis of ET, we can understand the dynamic changes in ET and the signs that it may be disturbed by other factors in space. According to these analysis results, Mongolia can take countermeasures to a certain extent through controllable means, especially for addressing the negative effects caused by global warming.
We investigated ET time series trends in this study. To adequately describe these ET trends with the aim of providing information that would facilitate better decision making, we introduced the Hurst index estimated by the rescaled range (R/S) method to predict the future trends of ET and ascertain whether evaporative trends have long-term memory. The R/S method, which provides specific information about correlations and sustainability, is an effective indicator for studying complex time series processes [27,28]. Hence, combining the R/S and trend methods to evaluate future ET trends can provide an in-depth understanding of the continuity and direction of those trends. However, studying only the interannual changes in ET inevitably ignores the detailed changes in the ET time series. For a detailed description of ET changes, the transient disturbances in the time series need to be evaluated [29]. High-frequency time series can describe the entire process of vegetation change in a short period of time.
Accordingly, the Breaks for Additive Season and Trend (BFAST) package has been widely used to detect seasonal, gradual and abrupt changes in time series in many different regions. In particular, abrupt changes cannot be detected by the common trend analysis often used in the past. According to these mutation details, combined with the natural and human factors affecting ET, we can better determine which factors may be the main factors at a certain time in the past. These parts that may have been ignored in the past must be understood. For example, abrupt changes in vegetation cover due to climate change or human activities can be described [30,31,32,33,34].
Furthermore, many studies have sought to quantify the relationships between ET and meteorological factors but have characterized these relationships as linear, resulting in inadequate conclusions and the inability to quantify the contributions and interactions of ET drivers. To clarify the correlations between ET and the factors (including nonlinear relationships) that influence it, we developed a geographic detector model to investigate potential factors and explanatory variables from a spatial perspective and determine the influence of vegetation changes. We accurately identified these various complex factors in our previous studies [35,36]. In addition to climate and meteorological factors, human activities strongly affect the structure and function of terrestrial ecosystems, and the response of vegetation is a result of these influences. Nevertheless, the response of vegetation ultimately affects vegetation transpiration, which further impacts ET.
The main objectives of our research work are to understand the following:
  • The temporal and spatial variation characteristics of ET in Mongolia over the past 20 years;
  • Possible future development trends of ET in Mongolia;
  • Whether a mutation of ET occurred in the past in Mongolia, and if so, which factors may have led to it;
  • Response of ET in Mongolia to natural and human factors.

2. Materials and Methods
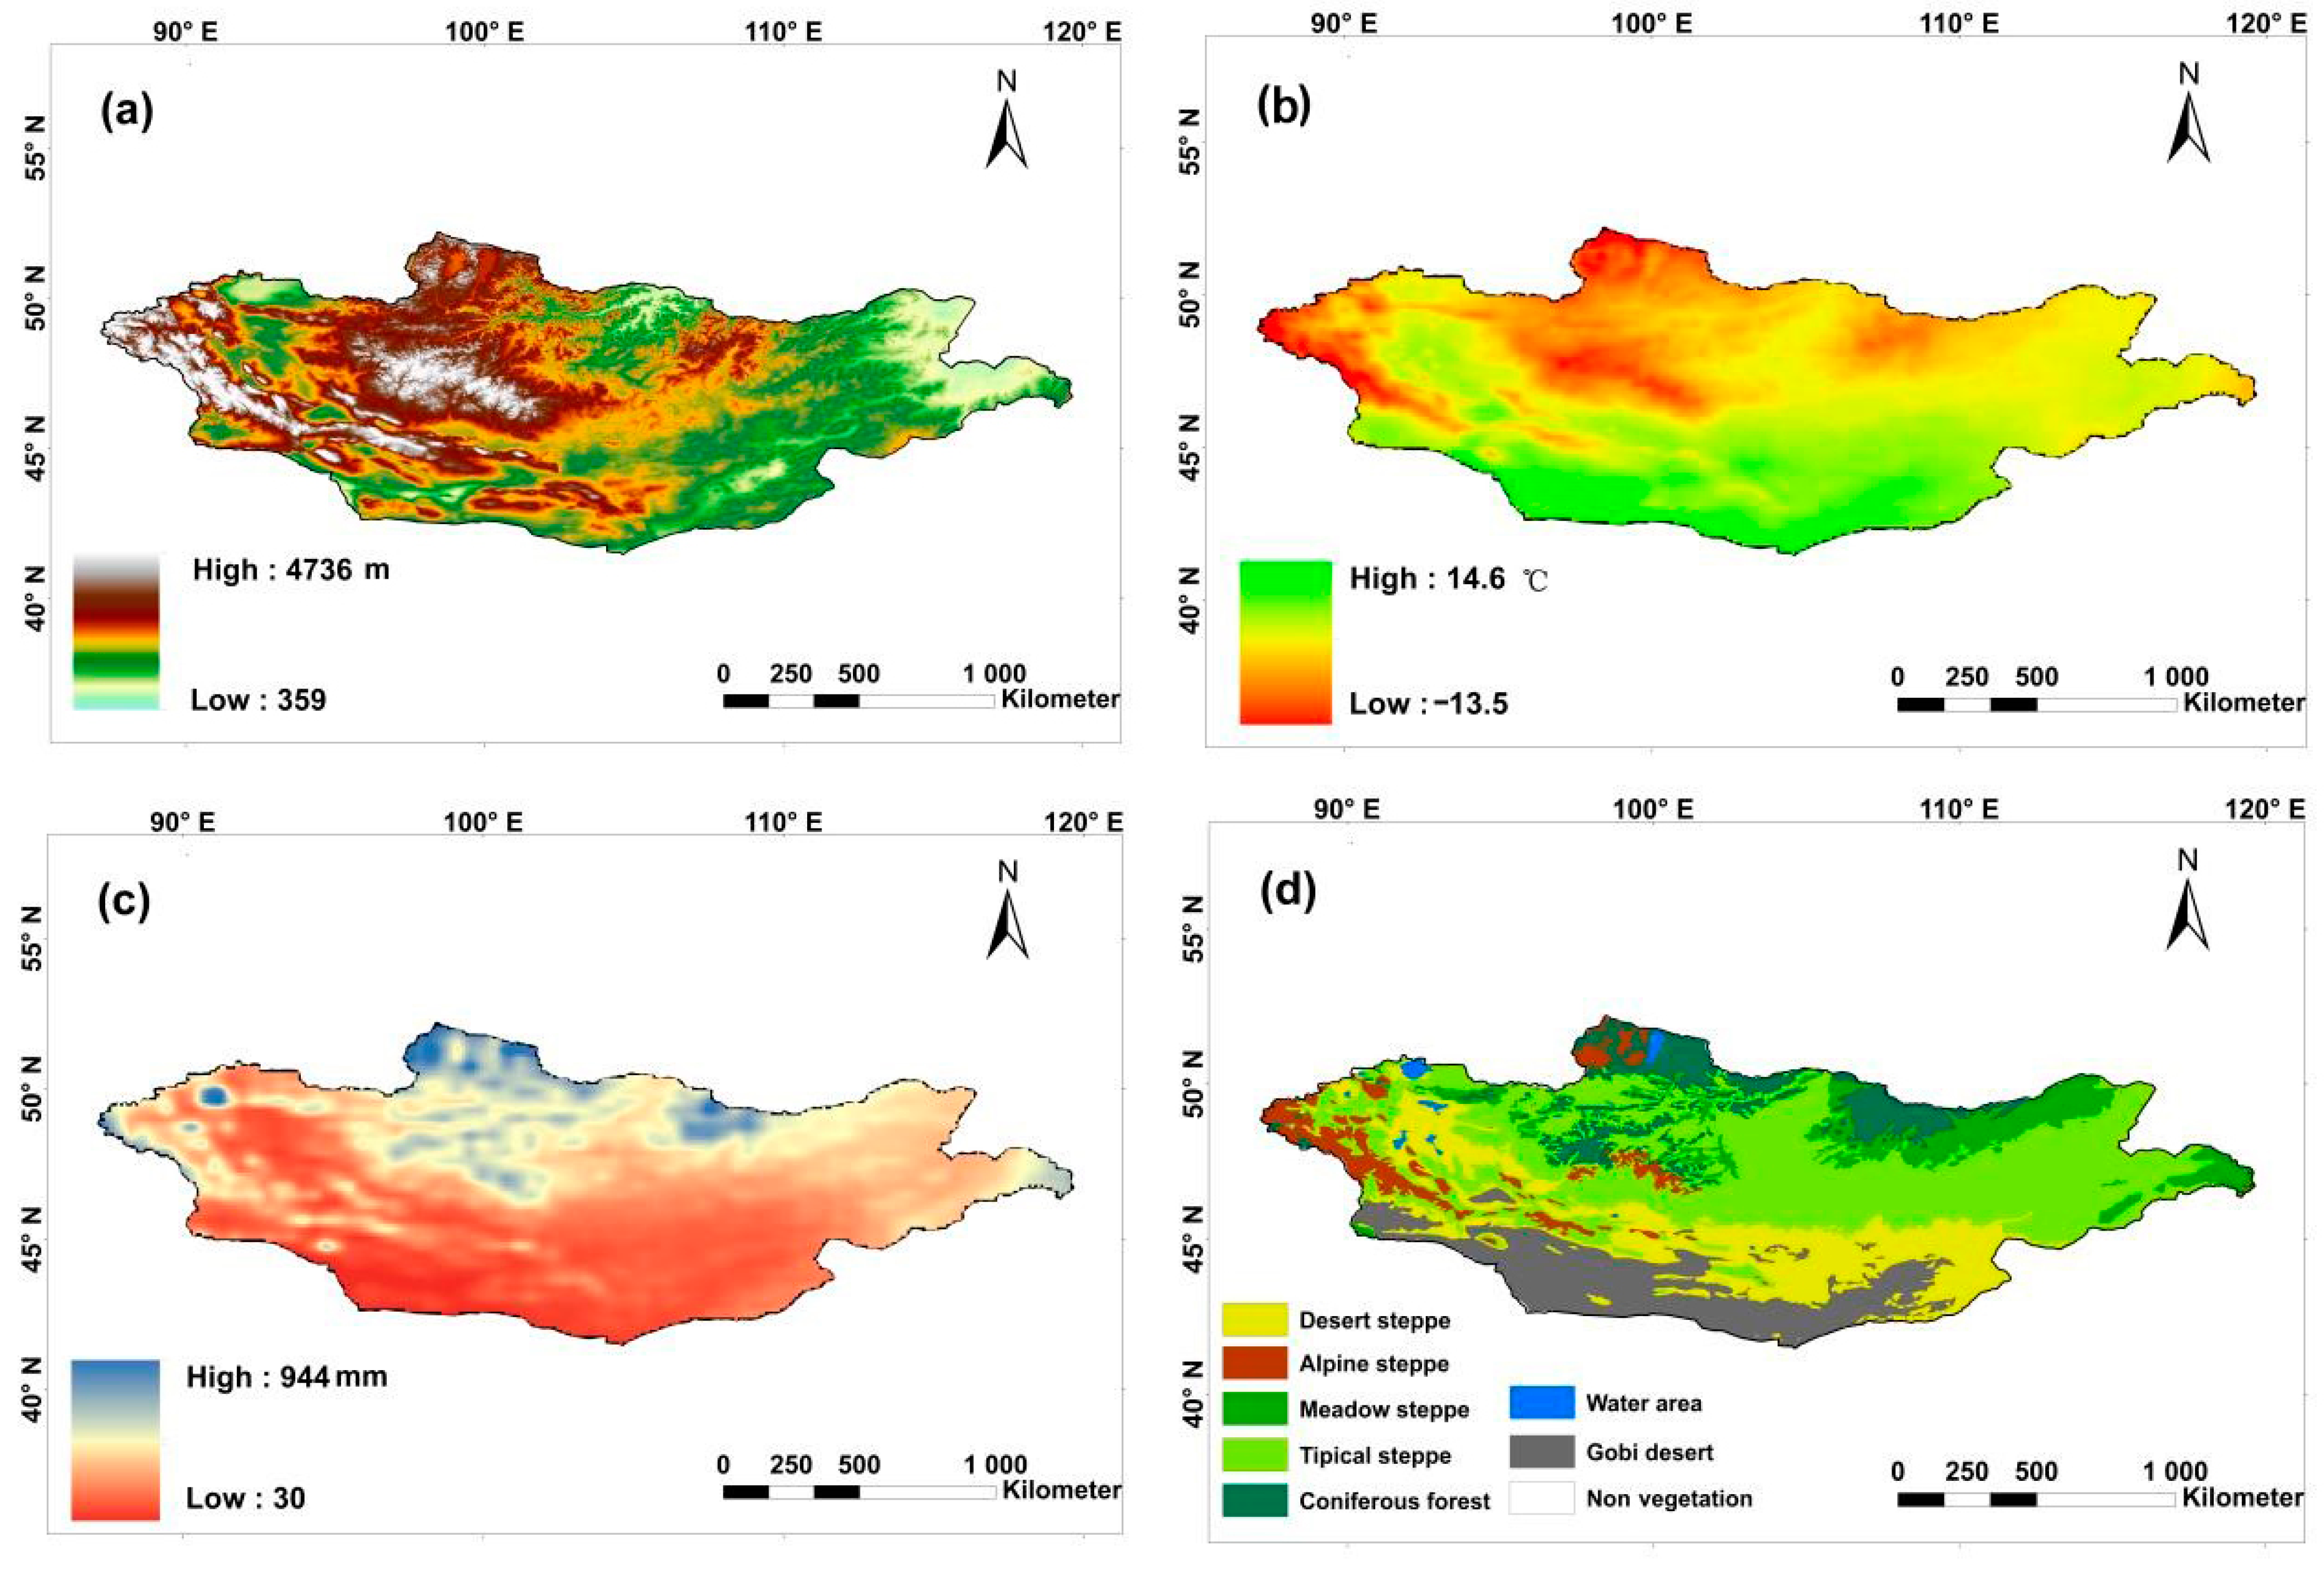
2.1. Study Area

Mongolia is a landlocked country in central Asia spanning an area of 1,566,500 km2 within 41°42′ N–51°36′ N and 87°54′ E–119°54′ E. Located atop the Mongolian Plateau, the nation of Mongolia borders China to the east, south and west and Russia’s Siberia to the north. The western, northern and central parts of the country are mostly mountainous, while the eastern part comprises hilly plains. The terrain gradually decreases in elevation from west to east, and the average elevation is approximately 1580 m (Figure 1a). To the south is the Gobi Desert, which stretches across a total area of more than 15,000 km2. The climate of Mongolia is a mix of typical continental arid and semiarid climate conditions [37], under which the winters are extremely cold and the summers are exceedingly warm [38], with the lowest temperature in winter reaching −40 °C and the highest temperature in summer reaching 35 °C (Figure 1b). The distribution of annual precipitation is the reverse of that of temperature, decreasing from >350 mm in the northern mountainous area to <50 mm (Figure 1c) in the southern Gobi Desert [39]. Under the influence of the climate distribution, the vegetation types of Mongolia are forest, grassland and sparsely vegetated desert from north to south (Figure 1d). Given the characteristics of these climate conditions and vegetation types, grassland animal husbandry is the most important economic base of Mongolia, supporting more than 80% of the output value of agriculture and animal husbandry. Data on vegetation types were obtained from the National Atlas of Mongolia, and a 1:1,000,000 scale vegetation map was rasterized at 0.083° [40].

2.2. Data Sources

2.2.1. MOD16A2 (ET)

The MOD16A2 Version 6 evapotranspiration/latent heat flux (ET/LE) product is a year-end gap-filled 8-day composite dataset produced at 500 m pixel resolution. The algorithm used to compile the MOD16 data product is based on the logic of the Penman–Monteith equation and includes inputs of daily meteorological reanalysis data along with Moderate Resolution Imaging Spectroradiometer (MODIS) remotely sensed data products, such as vegetation property dynamics, albedo, and land cover (further details can be found at https://lpdaacsvc.cr.usgs.gov/appeears/, accessed on 3 September 2021). We obtained the ET dataset from the AρρEEARS website. Then, seasonal and interannual time series were extracted and synthesized.

2.2.2. MOD13A1 (NDVI)

The MOD13A1 Version 6 product provides a vegetation index (VI) value on a perpixel basis. The algorithm for this product chooses the best available pixel value from all acquisitions in a 16-day period at a 500 m pixel resolution. The criteria for classifying the best pixel are low cloud cover, a low viewing angle, and the highest normalized difference vegetation index (NDVI)/enhanced vegetation index (EVI) value. The product contains two primary vegetation layers. The first comprises the NDVI, which here refers to the existing continuous National Oceanic and Atmospheric Administration–Advanced Very-High-Resolution Radiometer (NOAA-AVHRR)-derived NDVI. The second vegetation layer constitutes the EVI, which has improved sensitivity over regions with high biomass. In addition to these two vegetation layers, this product provides two quality assurance (QA) layers and reflectance bands 1 (red), 2 (near-infrared), 3 (blue), and 7 (mid-infrared) as well as four observation layers. Stage-3 validation was achieved for all MODIS MOD/MYD13 vegetation products [41]. We obtained the ET dataset from AρρEEARS website by applying for a registered account at https://lpdaacsvc.cr.usgs.gov/appeears/, accessed on 3 September 2021. Then, the annual NDVI from 2001 to 2020 was extracted by the maximum synthesis method.

2.2.3. Climate Dataset

The meteorological data used in this study mainly comprised the total precipitation (Pre), volumetric soil water layer (0–7 cm, Swl), land skin temperature (Tem), and land surface net solar radiation (Nsr); all data spanned the period from 2001 to 2020. ERA5-Land provides a consistent overview of the water and energy cycles at the surface over several decades. When complete, ERA5-Land will contain a detailed record from 1950 onwards with a temporal resolution of 1 h. The native spatial resolution of the ERA5-Land reanalysis dataset is 9 km on a reduced Gaussian grid (TCo1279). The data in the Climate Data Store (CDS) have been regridded to a regular latitude/longitude grid of 0.1° × 0.1°. The data presented here are a postprocessed subset of the full ERA5-Land dataset. Monthly averages of the variables were precalculated to facilitate many applications requiring easy and fast access to the data when submonthly fields were not required (further details are available at https://cds.climate.copernicus.eu/cdsapp#!/dataset/reanalysis-era5-land-monthly-means?tab=overview, accessed on 3 September 2021). We obtained the climate data from 2001 to 2020 and resampled them according to the ET product of MOD16A2. Finally, we obtained grid data with a resolution of 500 m.

2.2.4. Topographic Dataset

The topographic data were obtained from the Advanced Spaceborne Thermal Emission and Reflection Radiometer (ASTER) Global Digital Elevation Model (GDEM) V1 (https://www.gscloud.cn, accessed on 3 September 2021). Through image mosaicking, we obtained a DEM of the study area with a spatial resolution of 30 m. For the convenience of calculation, we resampled the obtained DEM data according to the ET product of MOD16A2. Finally, grid data with a 500 m resolution were obtained.

2.2.5. Socioeconomic Dataset

The socioeconomic data used in this study included statistical numbers of livestock (Stock), human population (Pop), and gross domestic product (GDP) from 2001 to 2020. These datasets were obtained from the Mongolian Statistical Information Service (http://www.1212.mn/ (accessed on 3 September 2021)). For the convenience of calculation, we resampled the obtained CCI-LC climate products according to the ET product of MOD16A2. Finally, grid data with a 500 m resolution were obtained.
All data sources used in this study are described in Table 1.

2.3. Methods

2.3.1. Theil–Sen Median Trend Analysis

The Theil–Sen median trend analysis and Mann–Kendall test can be combined to effectively judge the trend of long time series data and consequently have been extensively applied to analyse long vegetation time series [42]. The advantage of this combined approach is that it does not require the data to obey a certain distribution, has strong resistance to data errors, and has a solid statistical theoretical basis for the significance test, making the results more scientific and credible. The Theil–Sen estimator calculates the median of the slope of ET data combinations and is calculated as follows:
S E T = M e d i a n ( E T i E T j j i ) ,   2001     i   <   j     2020
When SET > 0, it reflects an increasing ET trend; otherwise, it reflects a decreasing ET trend.
The Mann–Kendall test is a nonparametric statistical method that ascertains the significance of a trend. Similar to the above estimator, this test does not require the sample to obey a certain distribution, and it is not disturbed by a few outliers [43,44,45]. The calculation formula is as follows: set ETi = 2000, 2001, …, 2010. The Z statistics are defined as follows:
Z = { S 1 s ( S ) ,   S > 0 0 ,   S > 0 S + 1 s ( S ) ,   S > 0 ,   S = j = 1 n 1 i = j + 1 n s g n ( ET j ET i )
s g n ( ET j ET i ) = { 1 , ET j ET i > 0 0 , ET j ET i = 0 1 , ET j ET i < 0 , s ( S ) = n ( n 1 ) ( 2 n + 5 ) 18
where ETi and ETj represent the ET values in years i and j, respectively, n represents the length of the time series, sgn is the signum function, and the value range of the statistic Z is (−∞, +∞). At a given significance level α, when |Z| > u1α/2, the changes in the trend are considered significant. Generally, taking α = 0.05, we evaluated the significance of the ET time series change trend at the 0.05 confidence level [46]. In this study, we calculated the annual mean of ET, NDVI and climate data. The interannual trend of 20-year interannual data was analysed. In addition, we analysed the trend of 8-day ET in each stage with reference to the mutation points obtained by BFAST analysis.

2.3.2. BFAST Package

The BFAST method was first proposed by Verbesselt in 2010 [47] and was initially used to identify disturbances in time series models (with trend/season/regressor terms) using remote sensing data. The BFAST algorithm, which is widely applicable for use in meteorological, hydrological, economic and other fields, is an additive decomposition model that employs the parameters of fitted piecewise linear trends and a seasonal trend model [48]. The calculation formula of BFAST for long time series is defined as follows:
Yt = Tt + St + et, t = 1, 2, 3……n
Tt = αi + βit
M = (αi − 1 − αi) + (βi − 1 − βi)t
S t = k 1 j α j , k   s i n ( 2 π k t f ) + δ j , k
where Yt is the 8-day ET from 2001–2020 in Mongolia, Tt is the trend component (trend), St is the seasonal component (seasonal), and et is the remainder (remainder). The long-term trend component, Tt, is piecewise linear with segment-specific slopes and intercepts on m + 1 different segments. Thus, there are m breakpoints, τi−1, …, τm, where i = 1, 2, …… m, and we define τ0 = 0 and τm+1 = n.
The order of magnitude of the breakpoints, M, may be calculated using the intercepts, αi and βi, of the trend component Tt between ti−1 and ti. To fit the frequency, we define t0 = 0 for tj < ttj+1, where j is the breakpoint position, j = 1, … m, with m breakpoints in total; k is the number of harmonic terms; and αj,k and δj,k are the segment-specific amplitude and phase, respectively. In our study, the annual ET of Mongolia from 2001 to 2020, the average value of ET in the growing season and the average value of NDVI in the growing season were used for mutation point analysis. We also masked the 8-day annual ET data of different vegetation types for mutation point analysis.

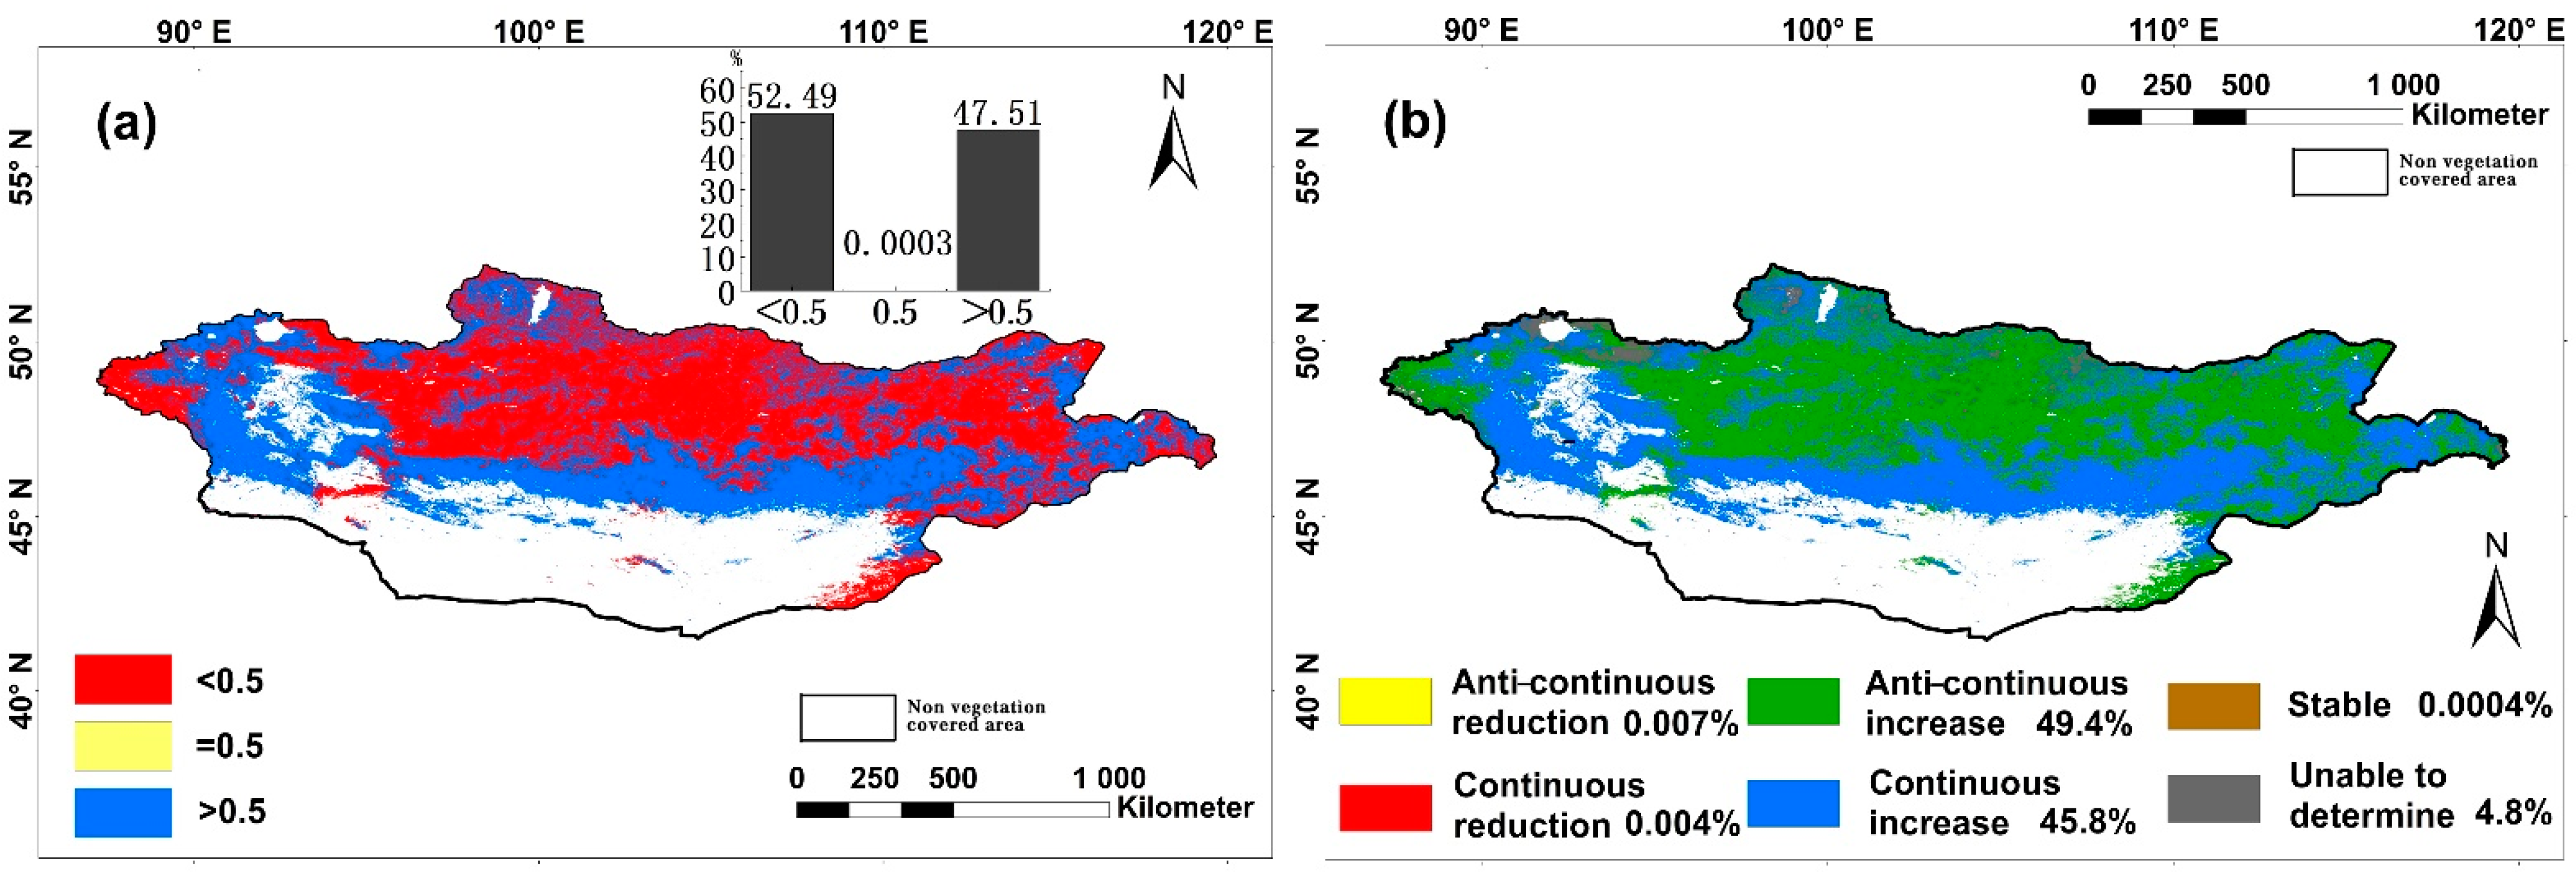
2.3.3. Hurst Index and R/S Analysis

The Hurst index has been widely used in research on the urban environment, economy, population development and climate change prediction. The Hurst index and R/S analysis have been particularly utilized to develop the fractal theory of time series [49]. The mathematical principle is as follows: for a time series (ET(t)), t = 1, 2, …, n, for any integer τ ≥ 1, its mean sequence is defined as follows:
E T ¯ ( τ ) = 1 τ t = 1 τ E T ( τ ) τ = 1 , 2 ,   , n
X ( t , τ ) = t = 1 t ( E T ( t ) E T ¯ ( τ ) ) 1 t τ
R ( τ ) = m a x 1 t τ X ( t , τ ) m i n 1 t τ X ( t , τ ) τ = 1 ,   2 ,   ,   n  
S ( τ ) = [ 1 τ t = 1 τ ( E T ( t ) E T ¯ ( τ ) ) 2 ] 1 2 τ = 1 ,   2 ,   ,   n
For the ratio R ( τ ) / S ( τ ) R / S , a relationship R / S τ H indicates that the Hurst phenomenon is present in the analysed time series, where H is the Hurst index value. H can be fitted by least squares regression according to l o g ( R / S ) n = a + H × l o g ( n ) .
Whether an ET sequence is completely random or persistent is judged according to the value of H, which is divided into three classifications: If 0.5 < H < 1, the time series is continuous. This means that future changes are consistent with past trends, and the closer H is to 1, the stronger the sustainability. If H = 0.5, the ET time series is random, and no long-term correlation exists. If 0 < H < 0.5, the time series exhibits anti-persistence; that is, the future change trend is opposite to the past change trend, and the closer H is to 0, the stronger the anti-sustainability. In our study, we calculated the annual ET as the input parameter. Although the Hurst index can be used to qualitatively predict whether the future ET trend is similar to the current ET trend, the Theil–Sen median trend analysis and Mann–Kendall test can quantify the ET trend. Therefore, we multiplied the obtained Hurst index with the reclassified ET trend after reference significance analysis and finally obtained the spatial distribution of the relationship between the predicted future ET trend and the current ET trend.

2.3.4. Geographical Detector Model

Spatial differentiation is one of the basic characteristics of geographical phenomena. Geographic detectors are tools that detect and exploit this spatial heterogeneity. The geographical detector model comprises four detectors: factor, interaction, risk, and ecological detectors [50]. In this study, we only use factor detector and interaction detector. For the differentiation and detection of factors, first detect the spatial differentiation of ET and then evaluate the influence factors (natural factors (Pre, Tem, Nsr, Swl, NDVI, CCI) and human factors (GDP, Pop, Stock)) and explain the spatial differentiation of ET. This extent is measured by the metric Q [36], which is expressed as follows:
Q = 1 h = 1 L N h σ h 2 N σ 2 = 1 S S W S S T ,   S S W = h = 1 L N h σ h 2 ,   S S T = N σ 2
where Q represents the explanatory power of the influence factors on ET. The value range of Q is (0,1). The larger the value of Q is, the more obvious the spatial differentiation of ET and the stronger the power of the influence factor to explain ET. h = 1, …, L is the classification or partition of ET or influence factors; σ h 2 and σ 2 are the variances of ET in layer h and the whole region, respectively; Nh and N signify the number of layers h and the number of units in the whole district, respectively; and SSW and SST are the sum of the within-layer variance and total variance of the entire area, respectively.
For the detection of interactions, the interaction between two influence factors is identified; that is, whether the joint action of the influence factor1 (such Pre) and influence factor2 (such Tem) increases or decreases their power to explain ET or whether the effects of these influence factors on ET are independent of each other is evaluated. R software was used to compute the interaction detector (available at https://cran.r-project.org/web/packages/GD/ (accessed on 26 January 2022)).
In this study, the annual average values of ET, natural factors and human factors are used in the analysis of annual scale. In the analysis of growing season scale, the average value of annual growing season period is used.

2.3.5. Partial Correlation Analysis

In multiple regression analysis, the correlation coefficient between two variables is calculated by excluding the influences of all other variables. Hence, in a multivariate correlation analysis, a simple correlation coefficient may not truly reflect the correlation between two variables because the relationships between variables in a multivariate system are complex and may be influenced by more than one other variable. In this case, the partial correlation coefficient is more suitable. The general process of partial correlation analysis is as follows:
(1) First-order partial correlation coefficient. For example, among the three variables ET, Tem and Pre, the partial correlation coefficient between any two variables is calculated after excluding the influence of the other variable; the result is called the first-order partial correlation coefficient:
R E T , P = R E T R E P ( 1 R E P 2 ) ( 1 R T P 2 )
where RET is the Pearson correlation coefficient between Tem and ET; REP is the Pearson correlation coefficient between Pre and ET; RTP is the Pearson correlation coefficient between Tem and Pre. RET,P, for instance, denotes the partial correlation coefficient between ET and Per when leaving Tem unchanged. The significance of each partial correlation coefficient was tested by using the classic T test. The statistical calculation formula is as follows:
t = R E T , P 1 R E T , P 2 n m 1
where n is the number of samples, m is the degrees of freedom, and RET,P is the partial correlation coefficient.
(2) Higher-order partial correlation coefficient. In general, assuming that there are k (k > 2) variables x1, x2, … xk, for any two variables xi and xj, the formula for the gth-order (gk − 2) sample partial correlation coefficient is as follows:
R i j , l 1 · l 2 l g = R i j , l 1 · l 2 l g 1 R i l g , l 1 · l 2 l g 1 R j l g , l 1 · l 2 l g 1 ( 1 R i l g , l 1 · l 2 l g 1 2 ) ( 1 R j l g , l 1 · l 2 l g 1 2 )
where R i j , l 1 l 2 l g is the gth-order partial correlation coefficient, and the right-hand side of the equation consists of the (g − 1)th-order partial correlation coefficients.
For example, there are k = 6 variables ET(E), Pre(P), Tem(T), Nsr(S), Swl(W) and NDVI(N). For two variables ET and Pre, the formula for the (g = 4)th-order (gk − 2) sample partial correlation coefficient is as follows:
R E P , T S W N = R E P , T S W R E N , T S W R P N , T S W ( 1 R E P , T S W 2 ) ( 1 R P N , T S W 2 )
In this study, we used the absolute value of partial correlation coefficient to express the degree of correlation. In order to understand the influence of natural factors on ET, we carried out partial correlation analysis of natural factors on ET at the scale of four seasons and growing season. The correlation coefficient ranges in value from −1 to +1, indicating either a negative or a positive correlation, respectively.

3. Results

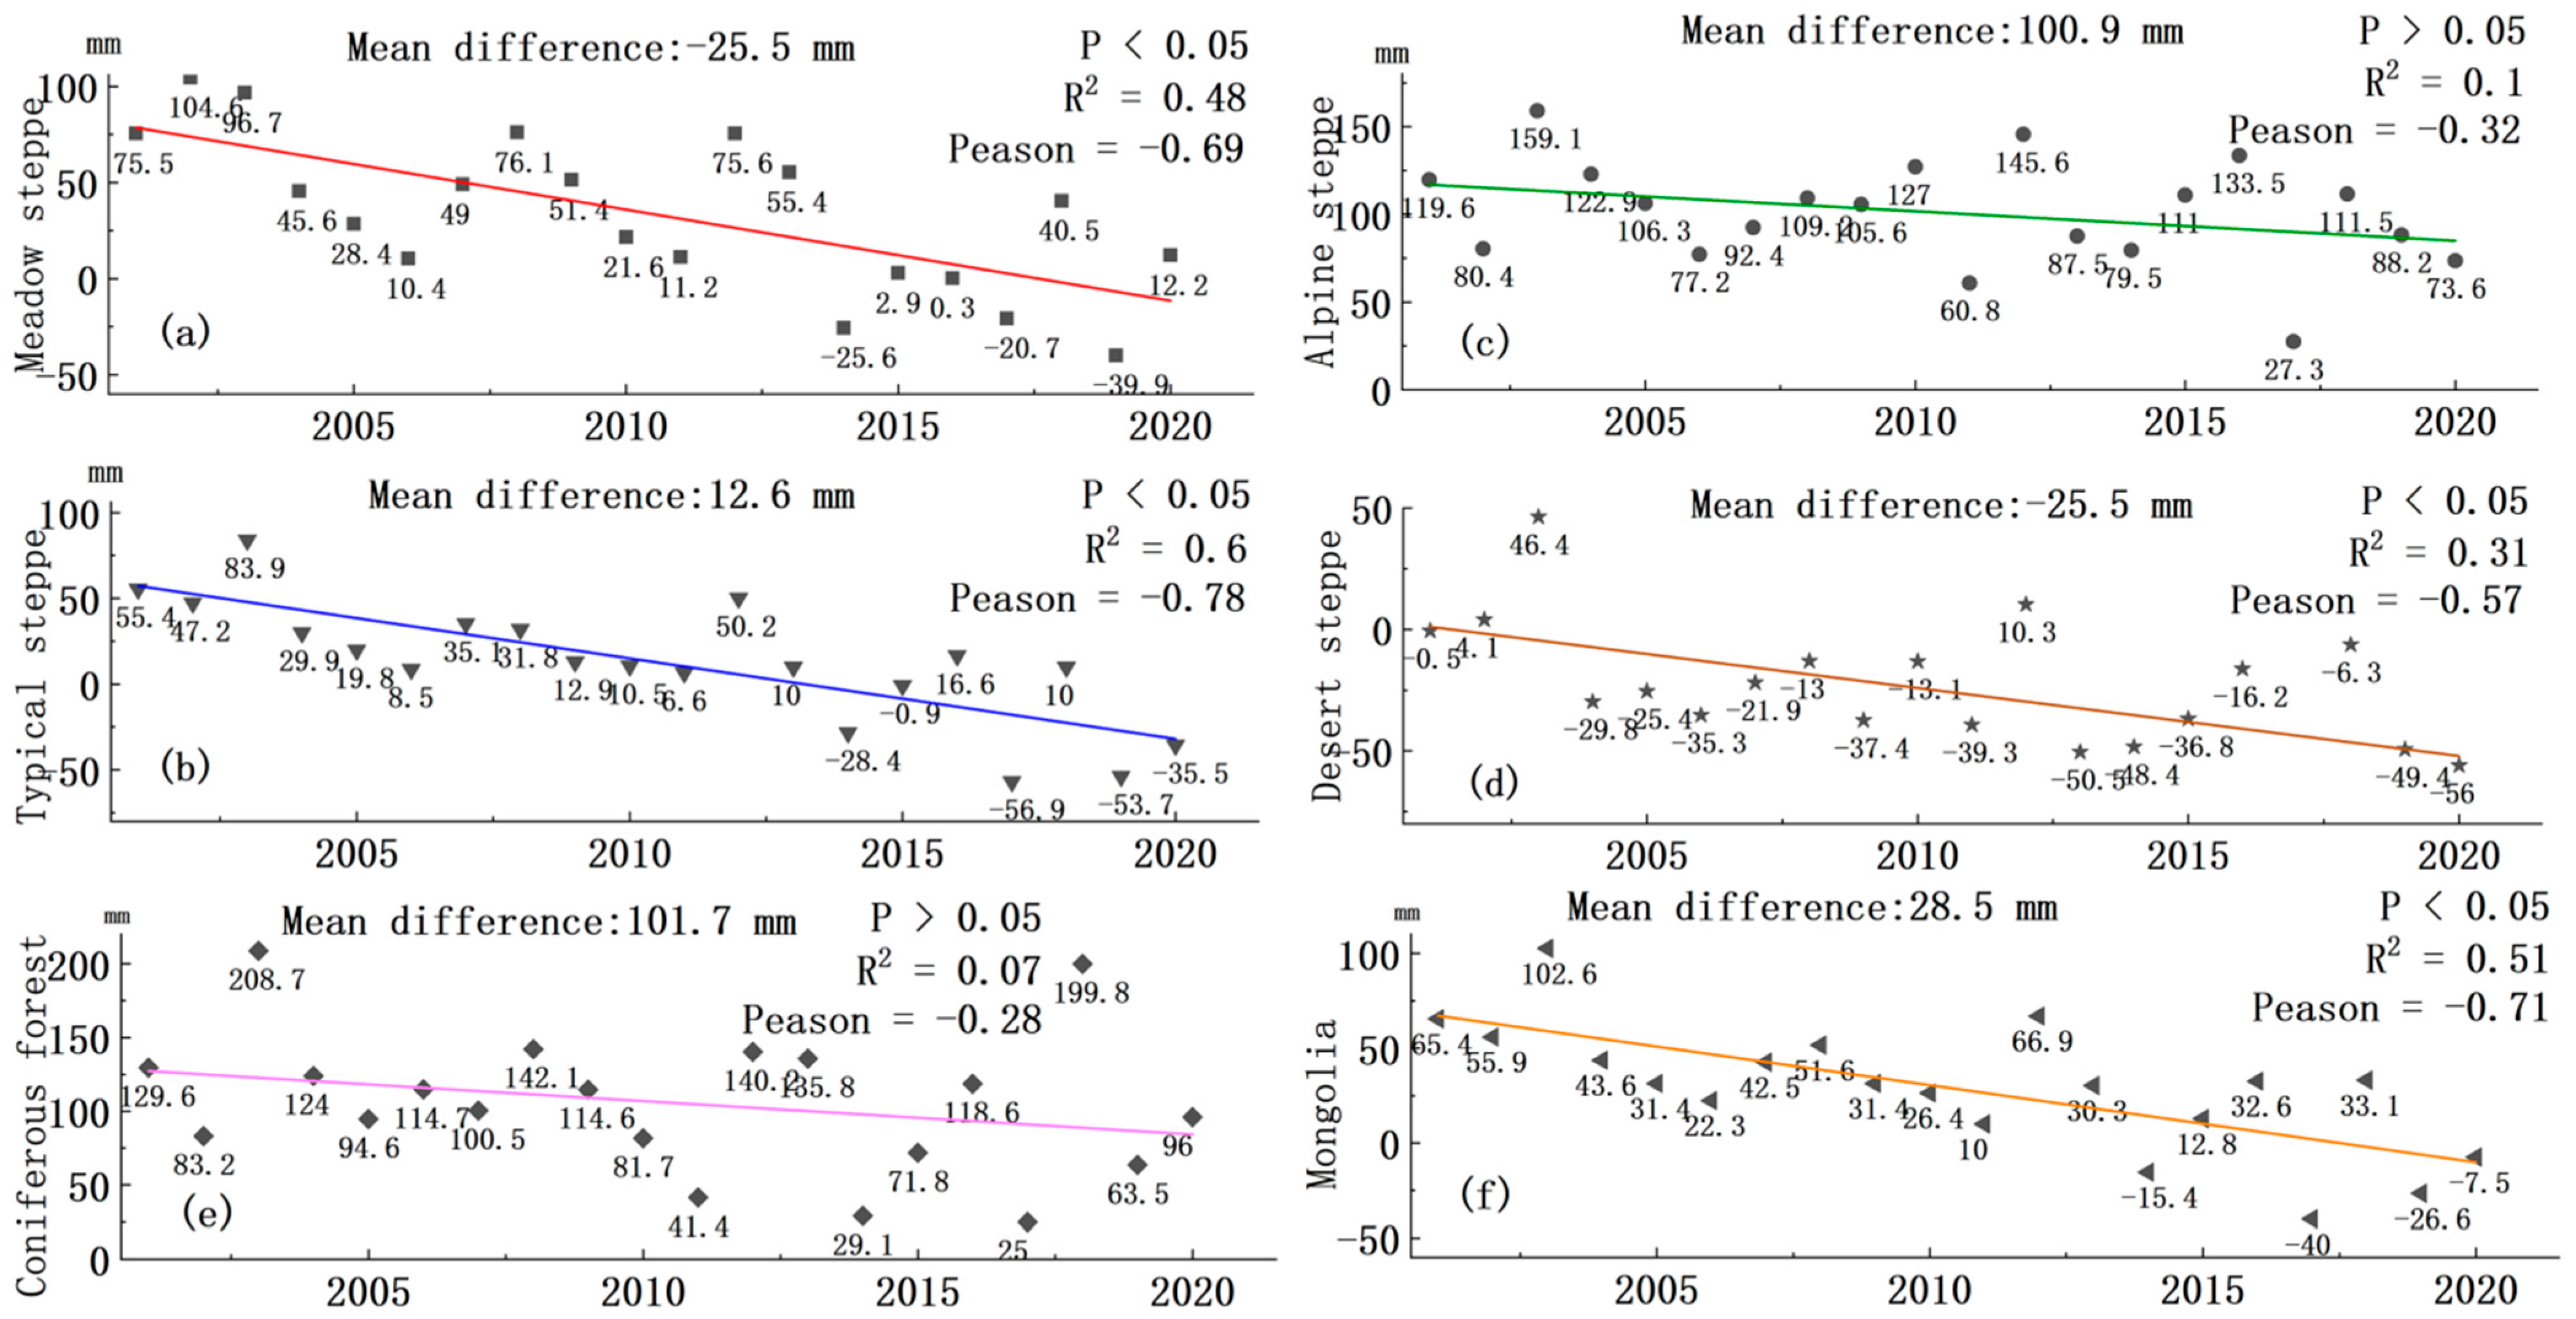
3.1. Long-Term Changes in ET and Different Climate Factors

Through the Theil–Sen median trend analysis (Figure 2), we detected the spatial trends of the annual average ET, NDVI and different climate factors (Pre, Swl, Tem, and Nsr) in Mongolia from 2001 to 2020. Figure 2a,b shows that Pre and Swl exhibited an increasing trend in the eastern, northern and northwest regions of Mongolia, and the proportions of pixels were 67.75% and 57.69%, respectively. In the eastern, northern and western regions of Mongolia, Pre and Swl increased significantly (p < 0.05), accounting for 3.86% and 6.46% of the pixels, respectively. In contrast, both factors displayed decreasing trends in the southern and central regions. Overall, these results indicate that Pre and Swl in Mongolia increased in the past 20 years. Tem increased in most areas of Mongolia (92.79% of pixels), with a significant increase (p < 0.05) in 2.01% of all pixels (Figure 2c). In addition, Nsr in the eastern region showed an increasing trend (63.32% of pixels), while that in the western region showed a decreasing trend (Figure 2d). In the past 20 years, the NDVI featured an increasing trend (93.88% of the study area), and the pixels with significant growth (p < 0.05) accounted for 30.86% of the total; the areas with extremely significant growth (p < 0.01), accounting for 11.45%, were concentrated mainly in eastern and northern Mongolia (Figure 2e). Finally, over the past 20 years, the ET increased significantly (p < 0.05) in almost all pixels (95.21%), and the proportion of pixels with extremely significant growth (p < 0.01) was 86.92% (Figure 2f). We extracted the Pre of the area using the ET values according to a mask, calculated both the annual difference (Pre-ET) and the 20-year average difference for each vegetation type and for the whole study area from 2001 to 2020, and performed univariate linear regression. Figure 3f indicates that before 2014, the difference between Pre and ET throughout Mongolia was positive; subsequently, this difference decreased significantly year by year. The 20-year mean difference was 28.5 mm. Therefore, in general, water could still be stored in Mongolia. The regional difference between alpine steppe and coniferous forest was positive over the 20-year period (Figure 3c,e), indicating that no water was lost in these two areas. In contrast, the difference between the meadow steppe and typical steppe was negative after 2014 and decreased significantly each year thereafter (Figure 3a,b). The difference in desert steppe was negative in most years and decreased significantly year by year. Simultaneously, among all vegetation types, the 20-year mean difference was negative only in the desert steppe areas. Therefore, in the whole study area, only desert steppe areas exhibited water loss.
Comparing the ET results among the various vegetation types in spring, summer and autumn reveals the following decrease in value: desert steppe < typical steppe < meadow steppe < alpine steppe < coniferous forest. The same comparison in winter yields the following order: coniferous forest < meadow steppe < typical steppe < alpine steppe < desert steppe. The different order in winter is probably because the ET source in the growing season is mainly vegetation transpiration, whereas the source of ET in the nongrowing season is mainly soil moisture and ice and snow sublimation.

3.2. Future ET Trends

In this study, the Hurst index was calculated for the annual ET data in Mongolia for each regional division and vegetation type (Figure 4a). The areal proportion of Mongolia with an ET Hurst index of less than 0.5 was 52.49%, the area with a Hurst index equal to 0.5 accounted for only 0.0003% of the total, and the regions with a Hurst index greater than 0.5 accounted for 47.51% of the country. These results show that the ET trend in most parts of Mongolia may reverse in the future; that is, that the future trend of ET will be the opposite of the current trend. While the Hurst index can be used to qualitatively predict whether the future ET trend will be similar to the current ET trend, a Theil–Sen median trend analysis and the Mann–Kendall test can quantify the ET trend. Therefore, by combining the classification results of the Hurst index with quantified ET trends, we can obtain the future spatial distribution of ET in Mongolia (Figure 4b). To reasonably predict the future ET change trends, the future change trends were divided into six levels, namely, “anti-continuous reduction” (ET will reverse the current increasing trend), “continuous reduction” (ET will continue to decrease), “anti-continuous increase” (ET will reverse the currently decreasing trend), “continuous increase” (ET will continue to increase), “stable” and “unable to determine”. “Continuous reduction” and “continuous increase” indicate areas where the Hurst index is greater than 0.05 and the Theil–Sen median trend analysis passes the significance test (p < 0.05). “Anti-continuous reduction” and “anti-continuous increase” indicate areas where the Hurst index is less than 0.05 and the Theil–Sen median trend analysis passes the significance test (p < 0.05). “Stable” indicates the areas that fail the significance test (p > 0.05) in the Theil–Sen median trend analysis, and “unable to determine” indicates the areas where the Hurst index is equal to 0.5, signifying future ET uncertainty.
The results show that the proportions of pixels in the “anti-continuous reduction” and “continuous reduction” areas are small (0.007% and 0.004%, respectively). In contrast, the proportion of pixels in the “anti-continuous increase” areas is 49.4%, mainly distributed in central, northern and eastern Mongolia; this indicates that ET may decrease in these areas with rich vegetation in the future. The proportion of pixels in the “continuous increase” areas is 45.8%, mainly distributed in southern and western Mongolia; hence, the ET in these areas characterized by mostly desert steppe and alpine steppe vegetation may continue to increase in the future. These outcomes demonstrate that, overall, the ET in Mongolia will increase in the future, but the rate of increase will weaken.

3.3. Analysis of ET Driving Factors

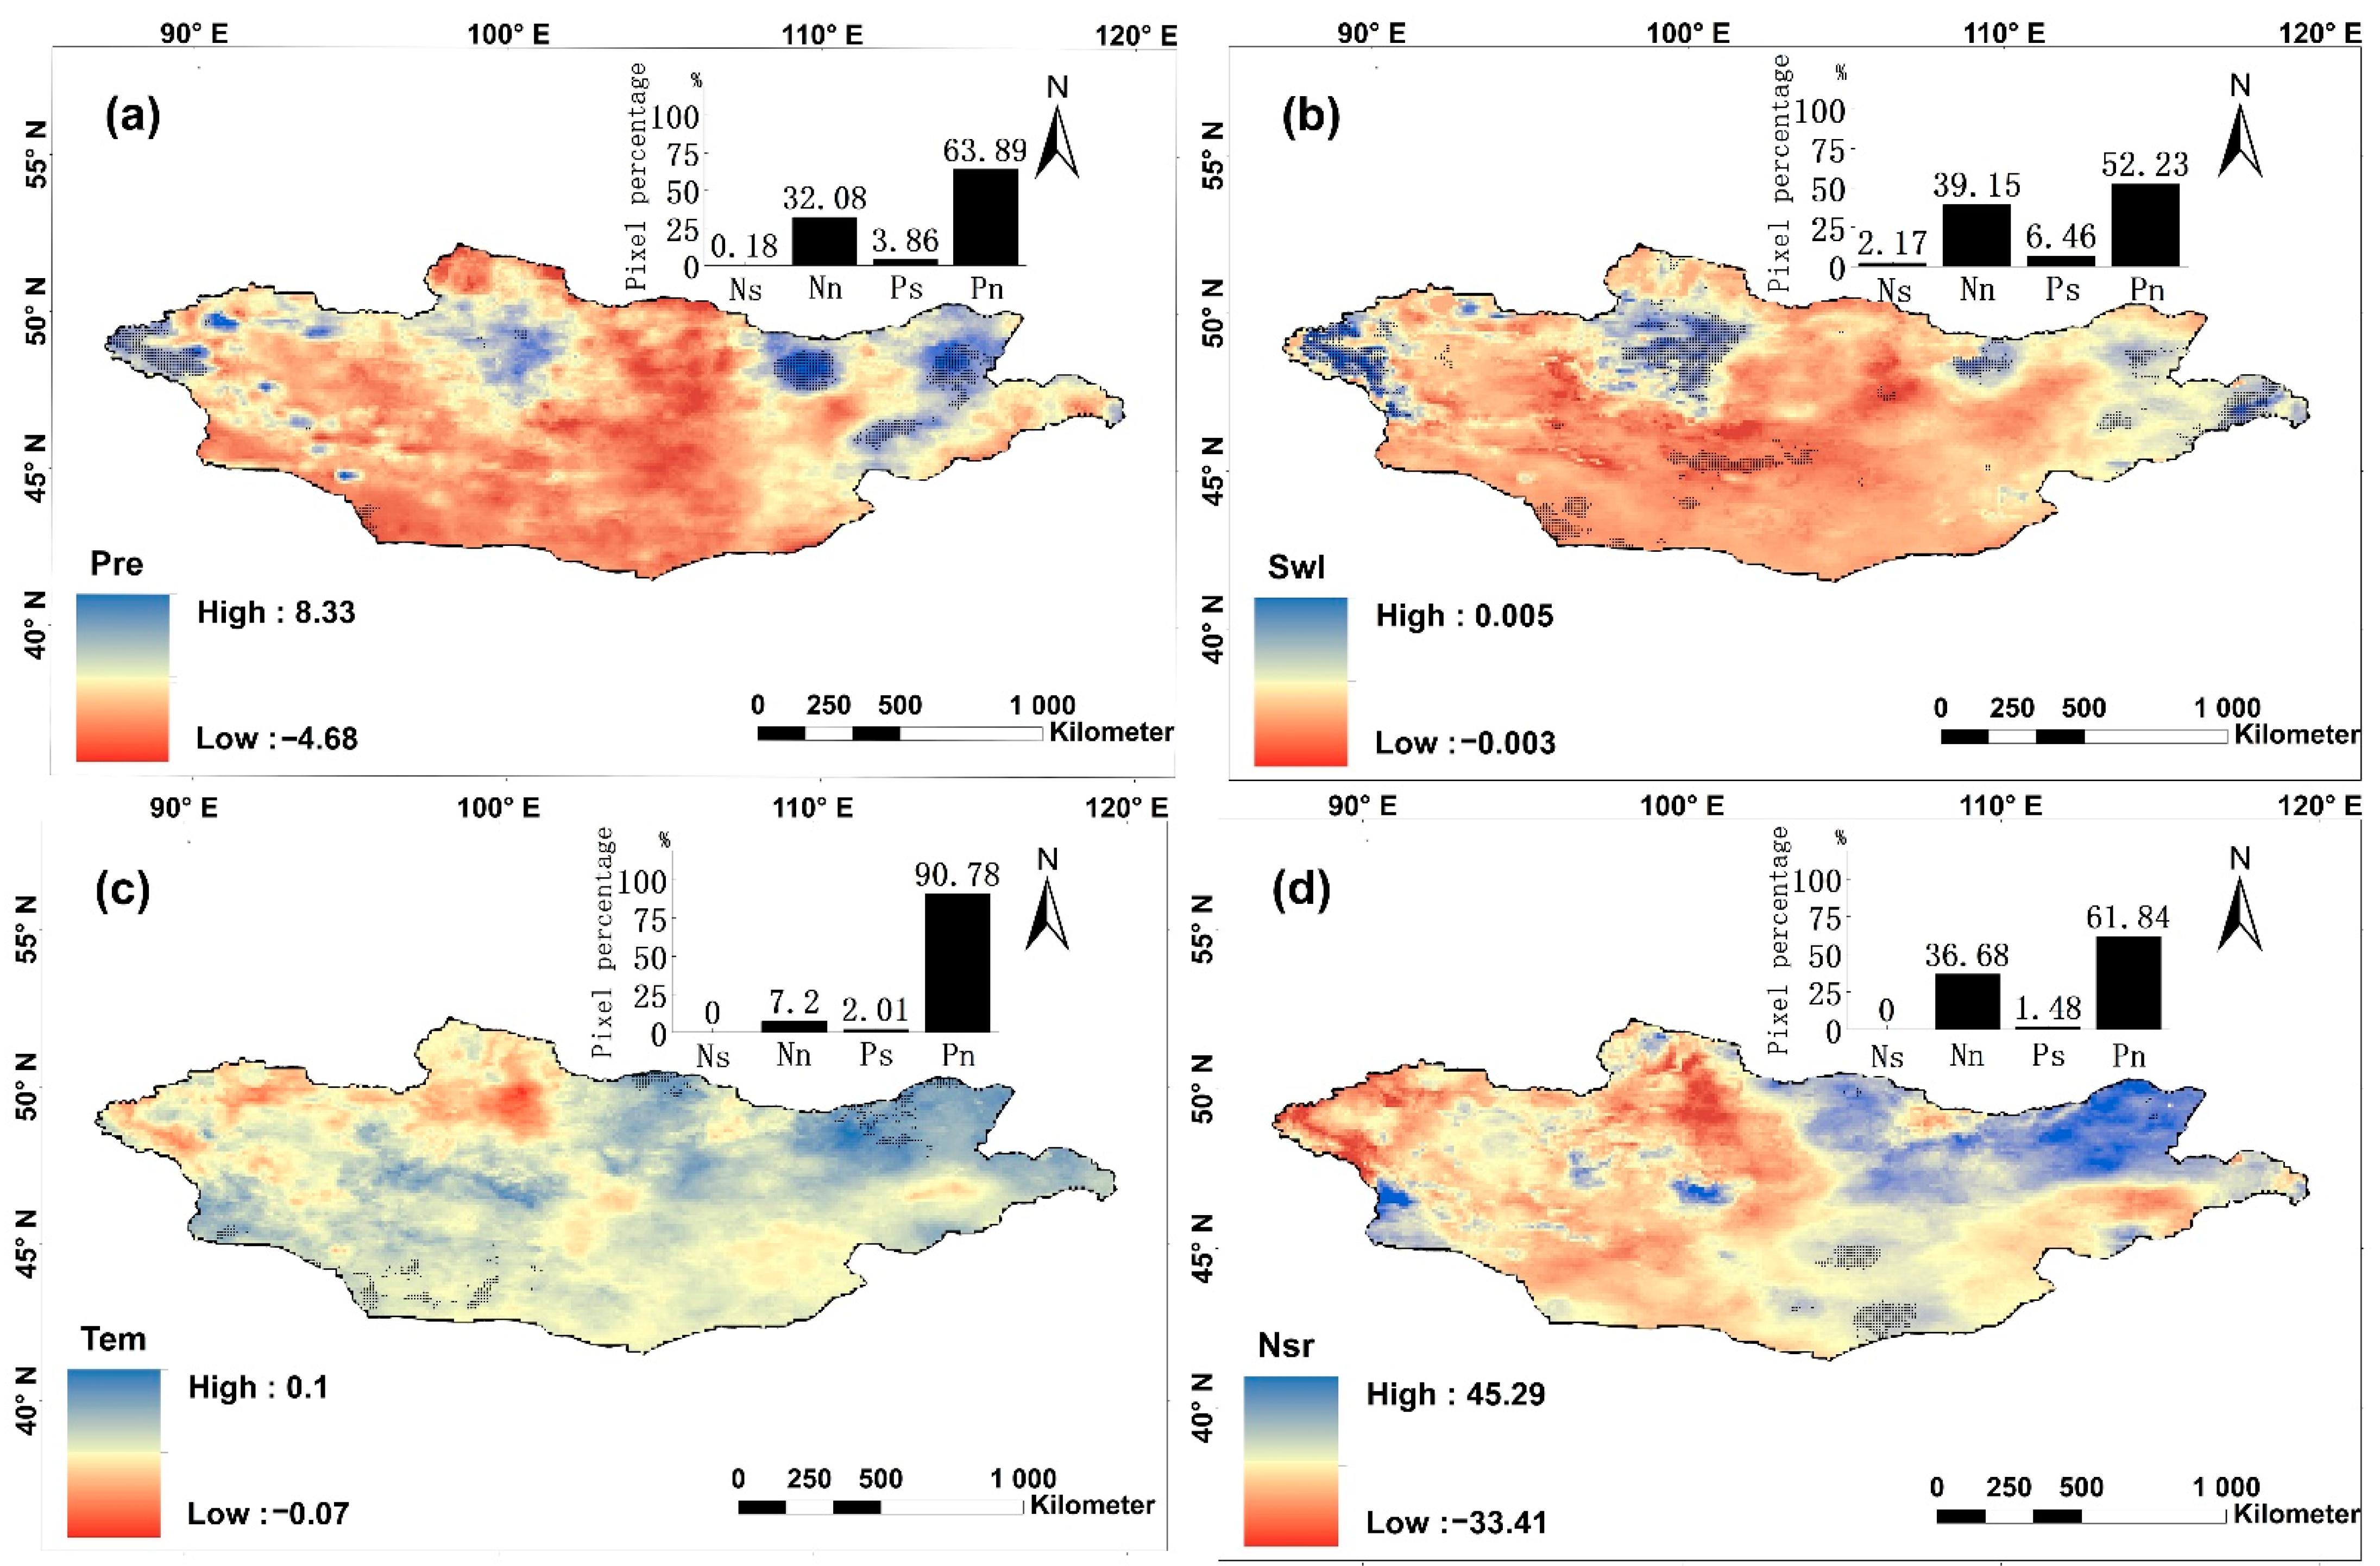
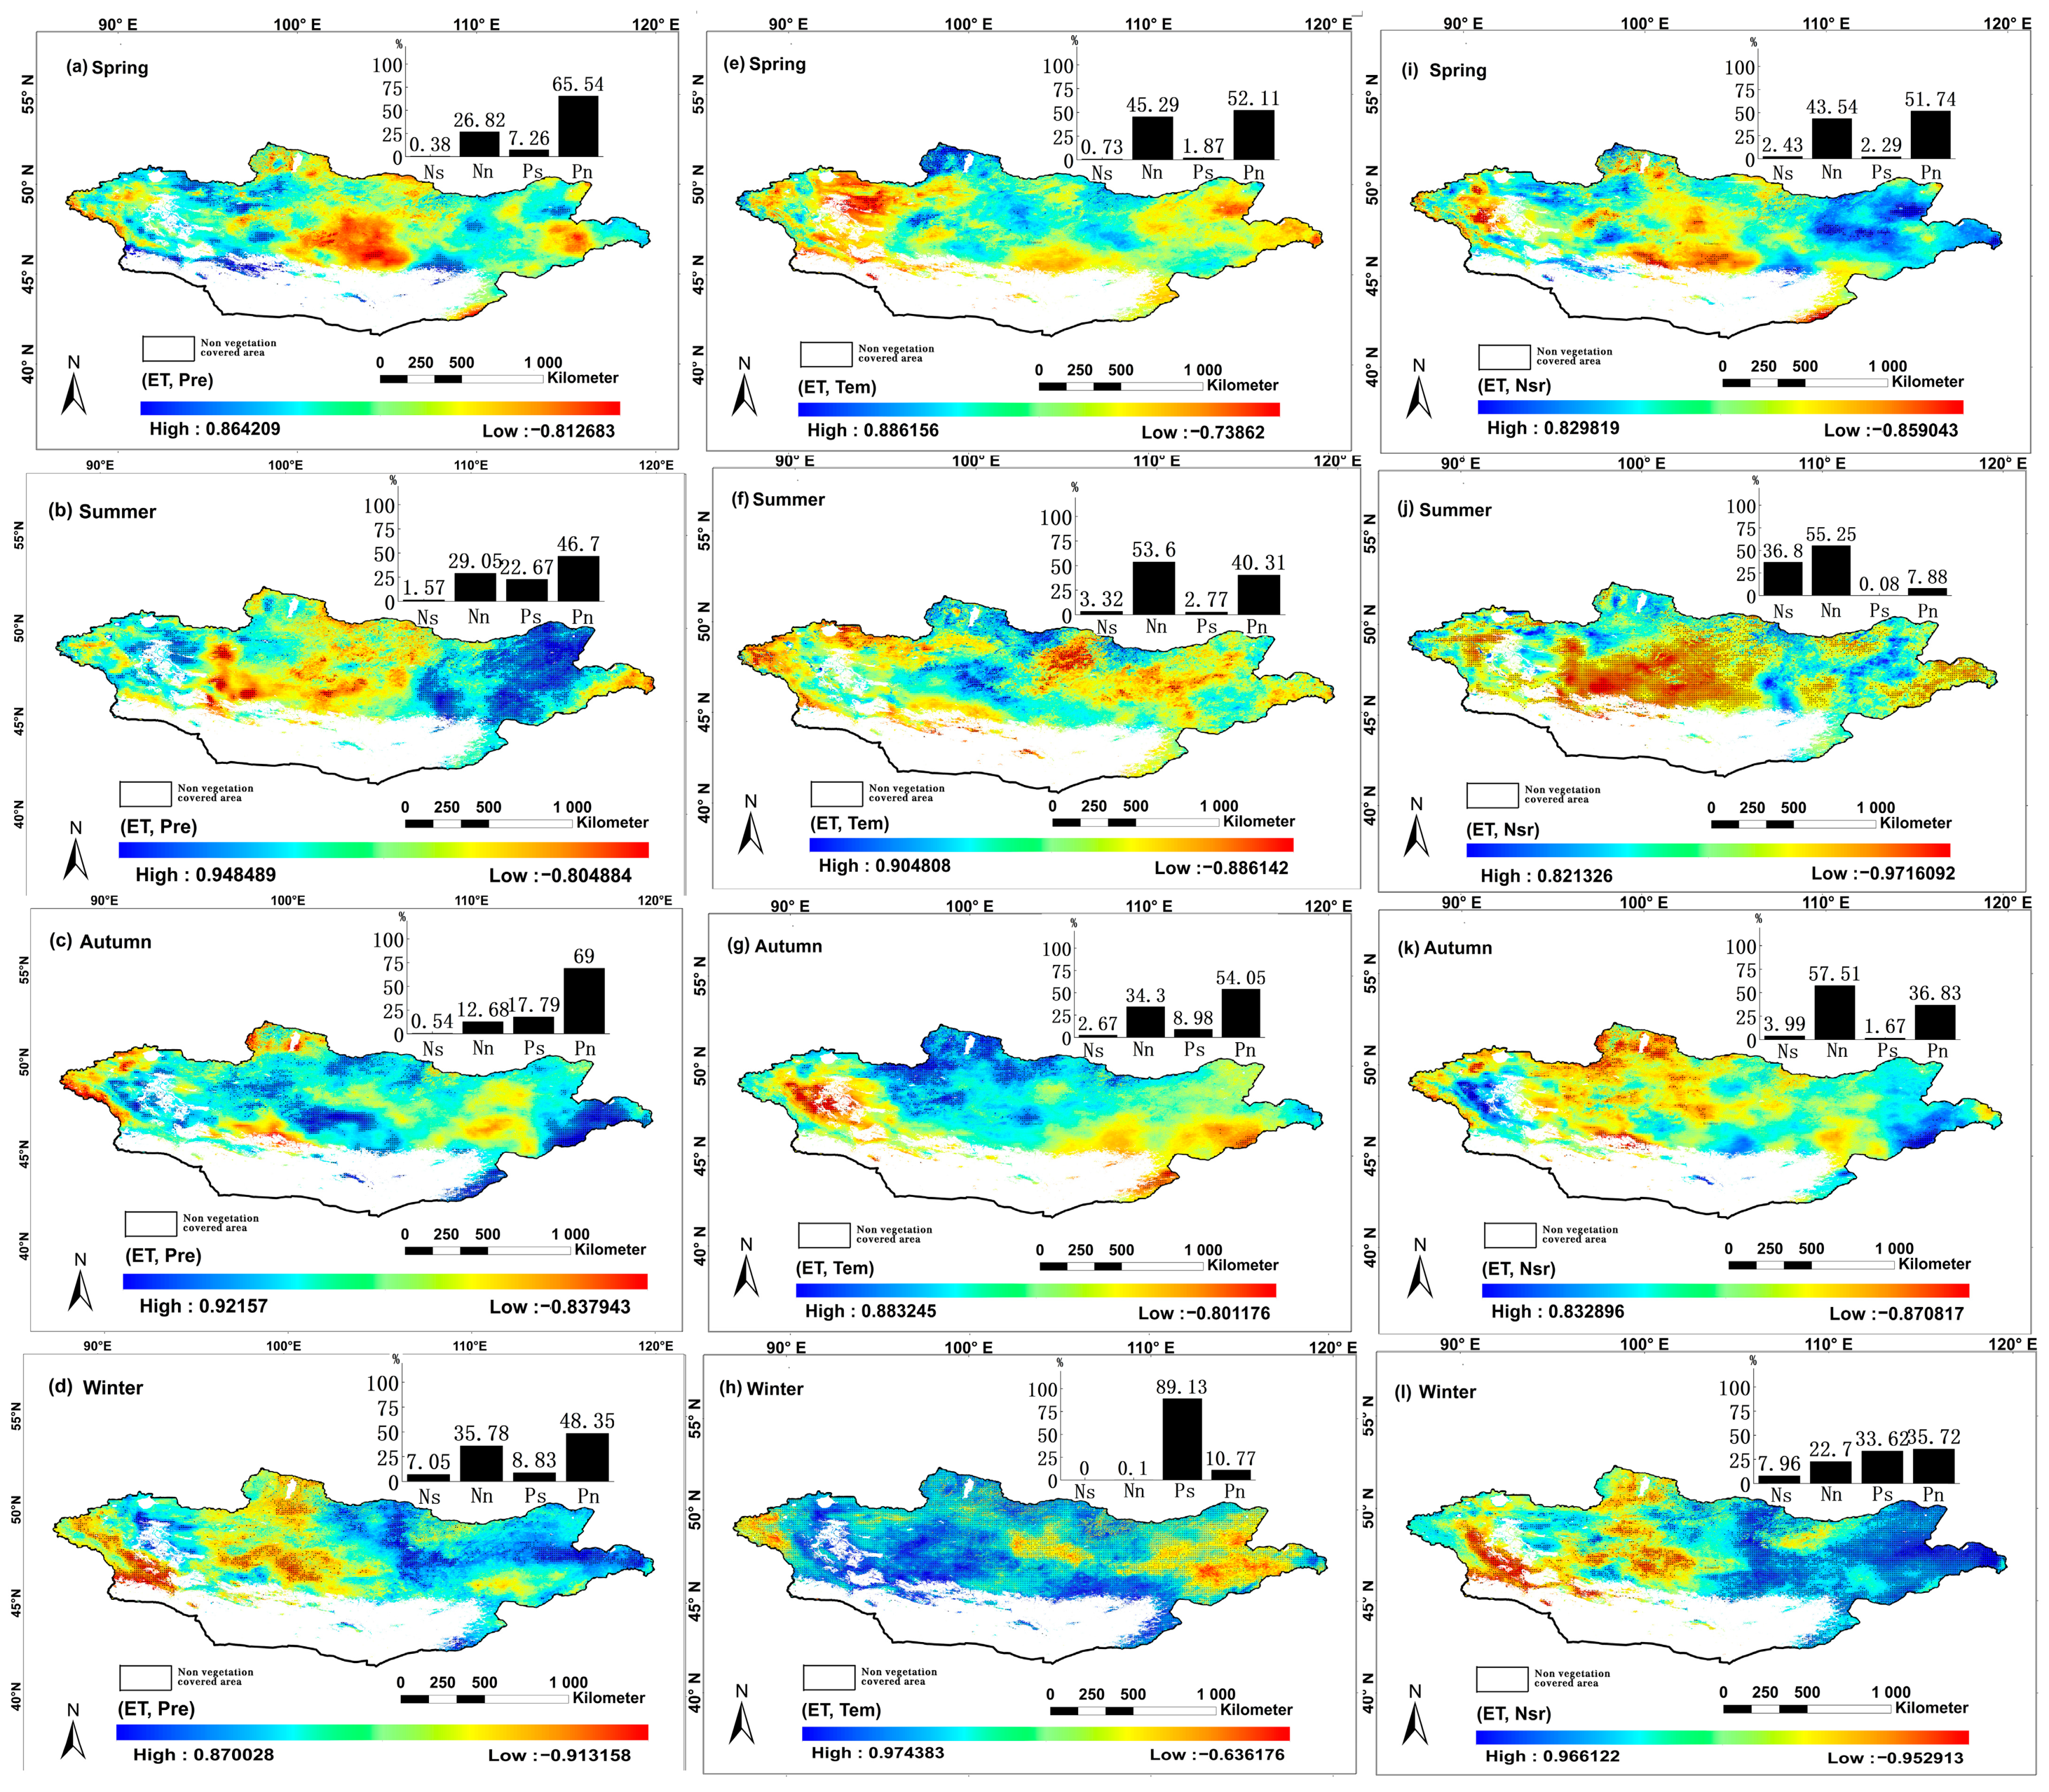
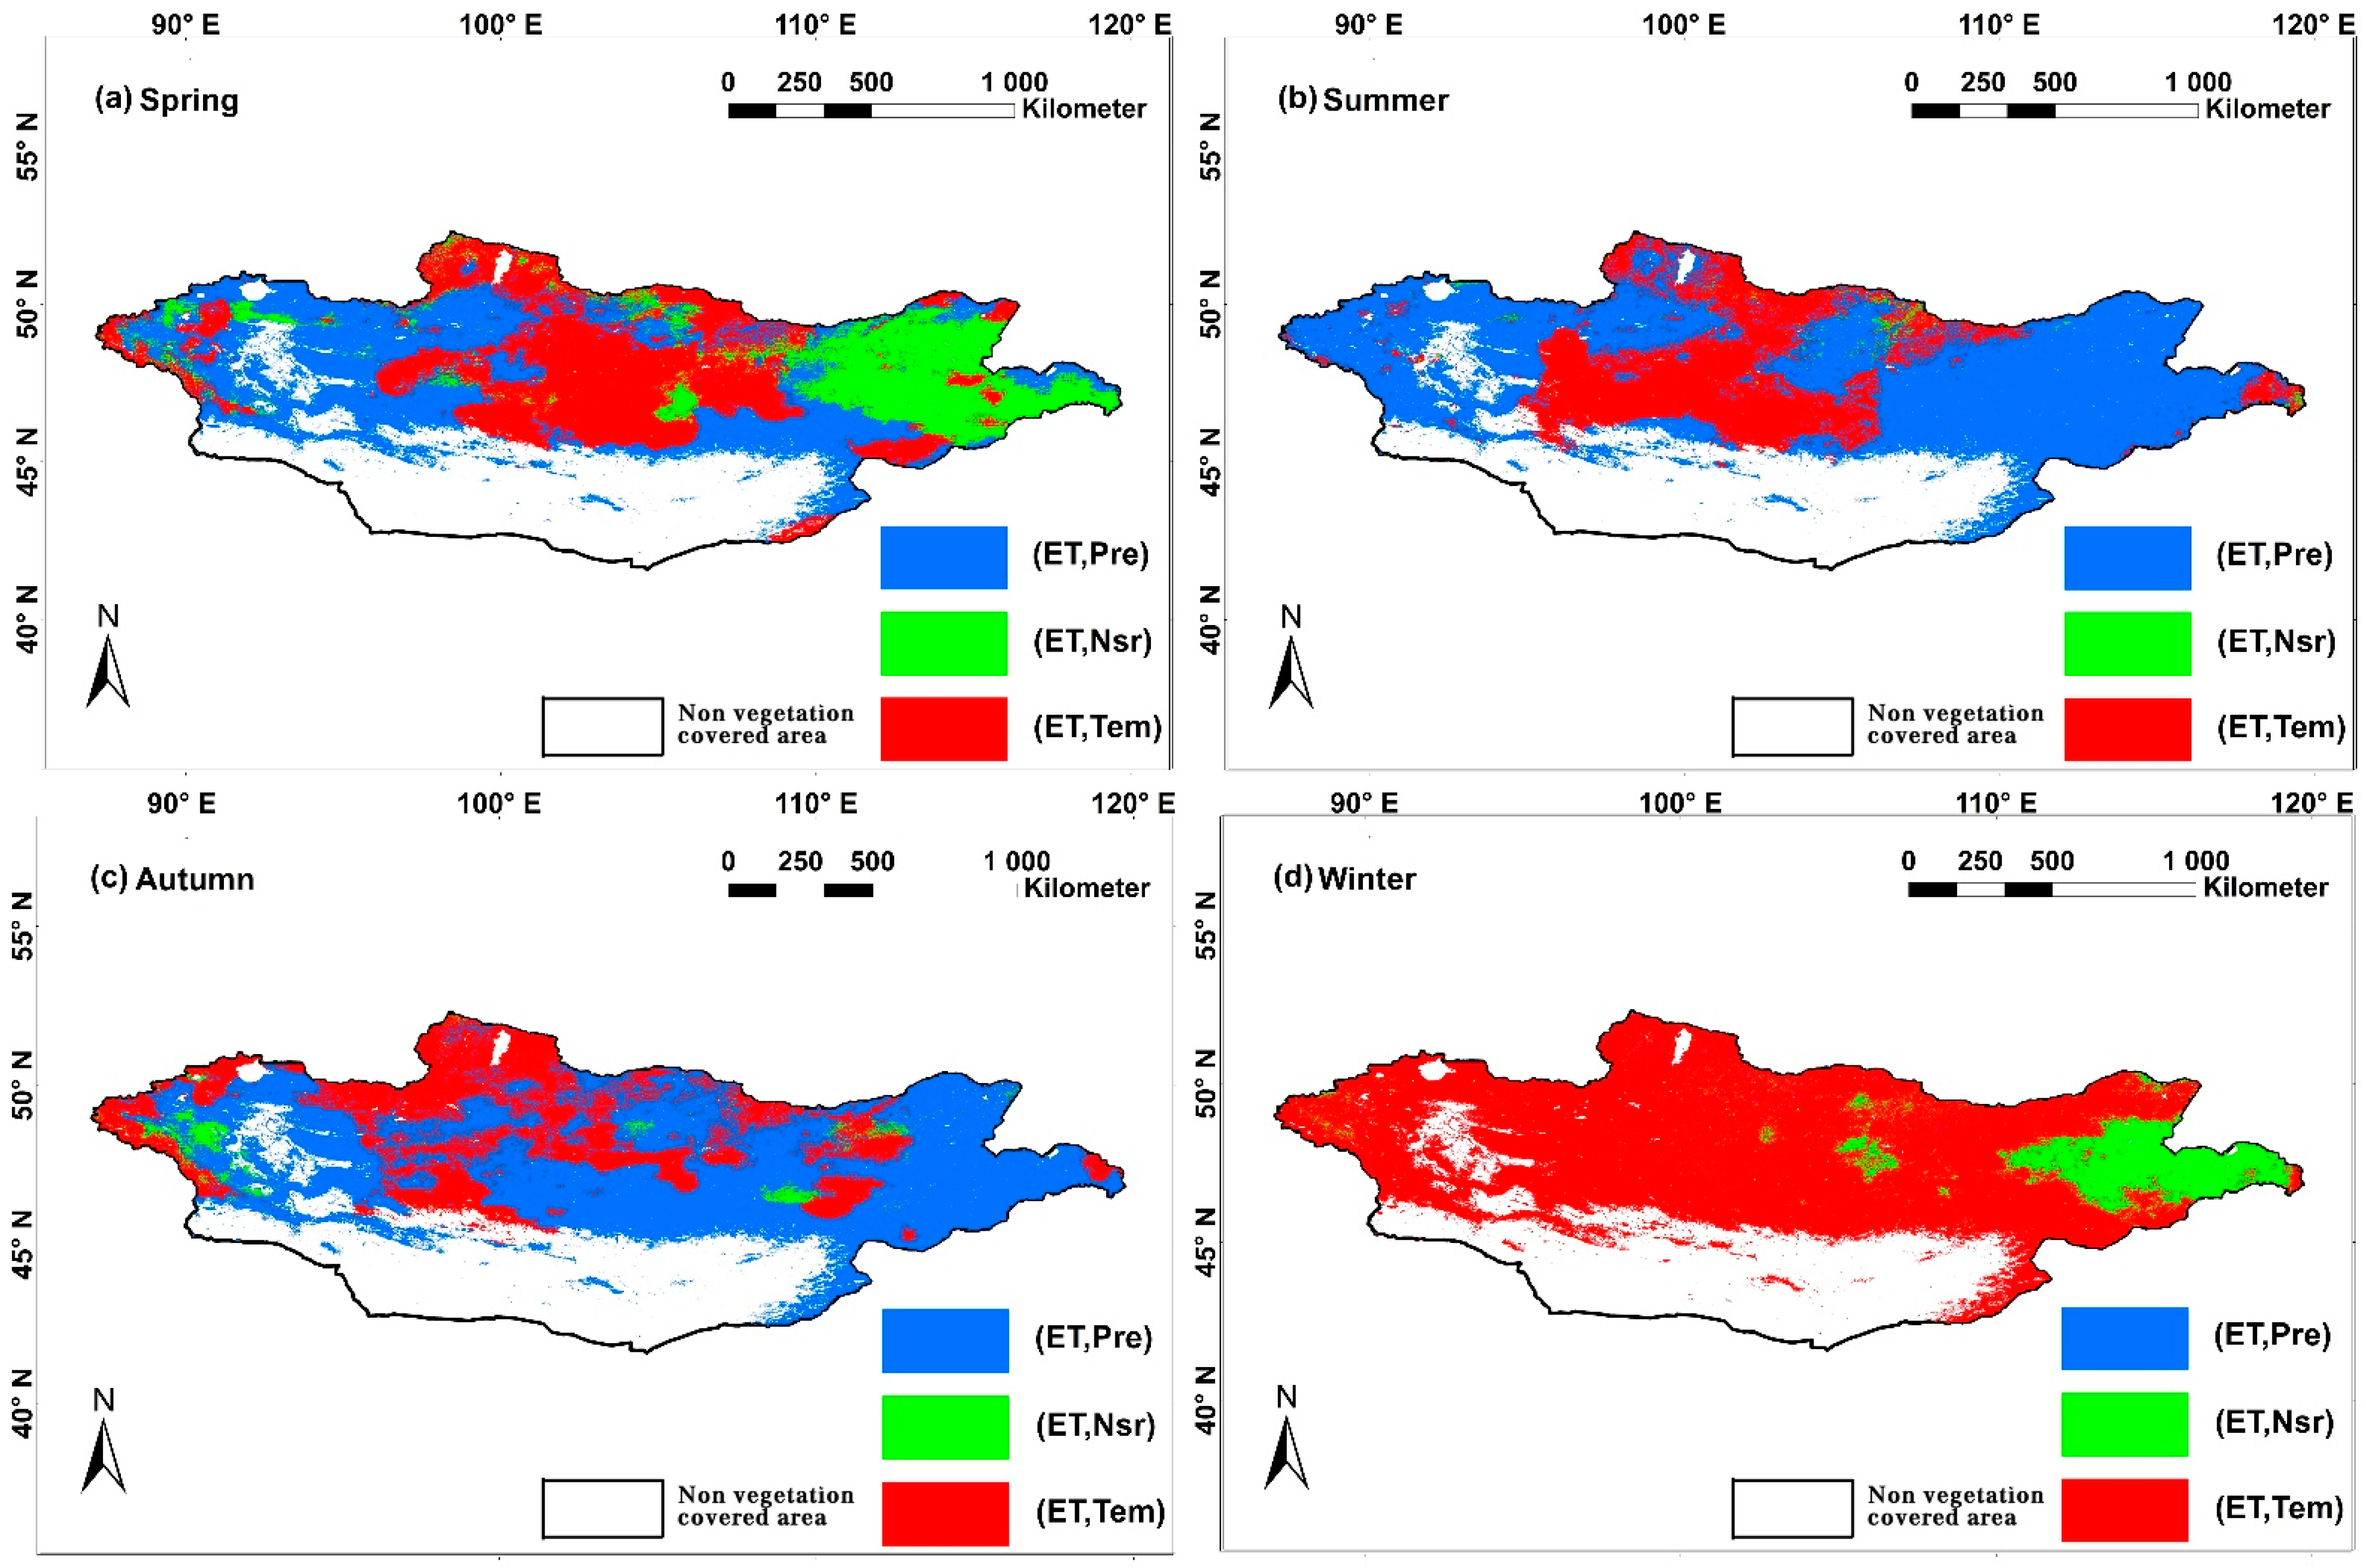
3.3.1. Seasonal Responses of ET to Meteorological Factors (Pre, Tem and Nsr)

ET exhibits different responses to different meteorological factors in different seasons. Therefore, we performed a partial correlation analysis to quantify the spatial distributions of the partial correlation coefficients between ET and each of three meteorological factors (Pre, Tem and Nsr) in the four seasons (Figure 5). In spring, the percentage of areas with a positive correlation between Pre and ET was 73.8%, and they were mainly distributed in eastern and western Mongolia, and the percentage of areas with a significant positive correlation was 7.26% (p < 0.05); the region with negative correlations between Pre and ET was mainly distributed in central Mongolia. In summer, the percentage of areas with a positive correlation between Pre and ET was 69.37%, and they were still mainly distributed in eastern and western Mongolia. The percentage of areas with a significant positive correlation was 22.67% (p < 0.05); the areas with a negative correlation between Pre and ET were still mainly distributed in central Mongolia. In autumn, the percentage of areas with a positive correlation between Pre and ET was 88.79%, and they were distributed across most of Mongolia; the percentage of areas with a significant positive correlation was 17.79% (p < 0.05). In winter, the percentage of areas with a positive correlation between Pre and ET was 57.18%, and they were mainly distributed across most of Mongolia (except the north and south). The percentage of areas with a significant positive correlation was 8.83% (p < 0.05). In spring, the percentage of areas with a positive correlation between Tem and ET was 53.98%, and they were mainly distributed in central Mongolia; the percentage of areas with a significant positive correlation was 1.87% (p < 0.05). Meanwhile, the areas with a negative correlation were mainly distributed in eastern and western Mongolia. In summer, the percentage of areas with a positive correlation between Tem and ET was 43.08%, and they were mainly distributed in central and northern Mongolia; the percentage of areas with a significant positive correlation was 2.77% (p < 0.05). Meanwhile, the areas with a negative correlation were mainly distributed in eastern and western Mongolia. In autumn, the percentage of areas with a positive correlation between Tem and ET was 63.03%, and they were mainly distributed in central and northern Mongolia; the percentage of areas with a significant positive correlation was 8.98% (p < 0.05). In winter, the percentage of areas with a positive correlation between Tem and ET was 99.9%, constituting practically all of Mongolia, and the percentage of areas with a significant positive correlation was 89.13% (p < 0.05). These findings indicate that except in winter, the spatial distribution of the correlation between Tem and ET was almost opposite that of the correlation between Pre and ET. Moreover, according to the different dominant driving factors positively correlated with ET (Figure 5), in spring, summer and autumn, the average temperature in the areas dominated by Tem (Figure 5a) was lower than that in the areas dominated by Pre and that in the areas jointly dominated by Pre and Nsr. However, the comparison results for the average precipitation show the opposite behaviour; that is, in these three seasons, excessive precipitation led to lower temperatures. Furthermore, in the areas with excessive precipitation, temperature was positively correlated with ET. Simultaneously, the temperature in the areas with slightly lower precipitation was more suitable for vegetation transpiration. Therefore, a positive correlation between Pre and ET and a negative correlation between Tem and ET were found.
In spring, the percentage of areas with a positive correlation between Nsr and ET, mainly distributed in eastern Mongolia, was 54.03%, and the percentage of areas with a significant positive correlation was 2.29% (p < 0.05). In summer, the percentage of areas with a negative correlation between Nsr and ET, constituting most of Mongolia, was 92.05%.The percentage of areas with a significant negative correlation, mainly distributed in central and southern Mongolia, was 36.8% (p < 0.05); moreover, the altitude of this area is high, and precipitation is low. In autumn, the percentage of areas with a positive correlation between Nsr and ET was 38.5%, and the percentage of areas with a significant positive correlation was 1.67% (p < 0.05). In autumn, the regions with a significant positive (negative) correlation between Tem and ET and the regions with a significant negative (positive) correlation between Nsr and ET almost coincided (Figure 5g,k). In winter, the percentage of areas with a positive correlation between Nsr and ET, mainly distributed in the low-altitude areas of eastern Mongolia, was 69.34%, and the percentage of areas with a significant positive correlation was 33.62% (p < 0.05).
Finally, by extracting the highest value, the spatial distribution of the positive correlation between the main driving factors of the four seasons and ET was obtained (Figure 6a–d). In spring, the impact of Pre in western Mongolia is more obvious, the impact of Tem in central Mongolia is more obvious, and the impact of Nsr in eastern Mongolia is more obvious, but this may be caused by less precipitation. In summer, the influence of Pre in eastern and western Mongolia is obvious, and the influence of Tem in central Mongolia is obvious. In autumn, most areas of Mongolia are greatly affected by Pre, while the north is greatly affected by Tem. In winter, TEM may be the main influence in most parts of Mongolia.

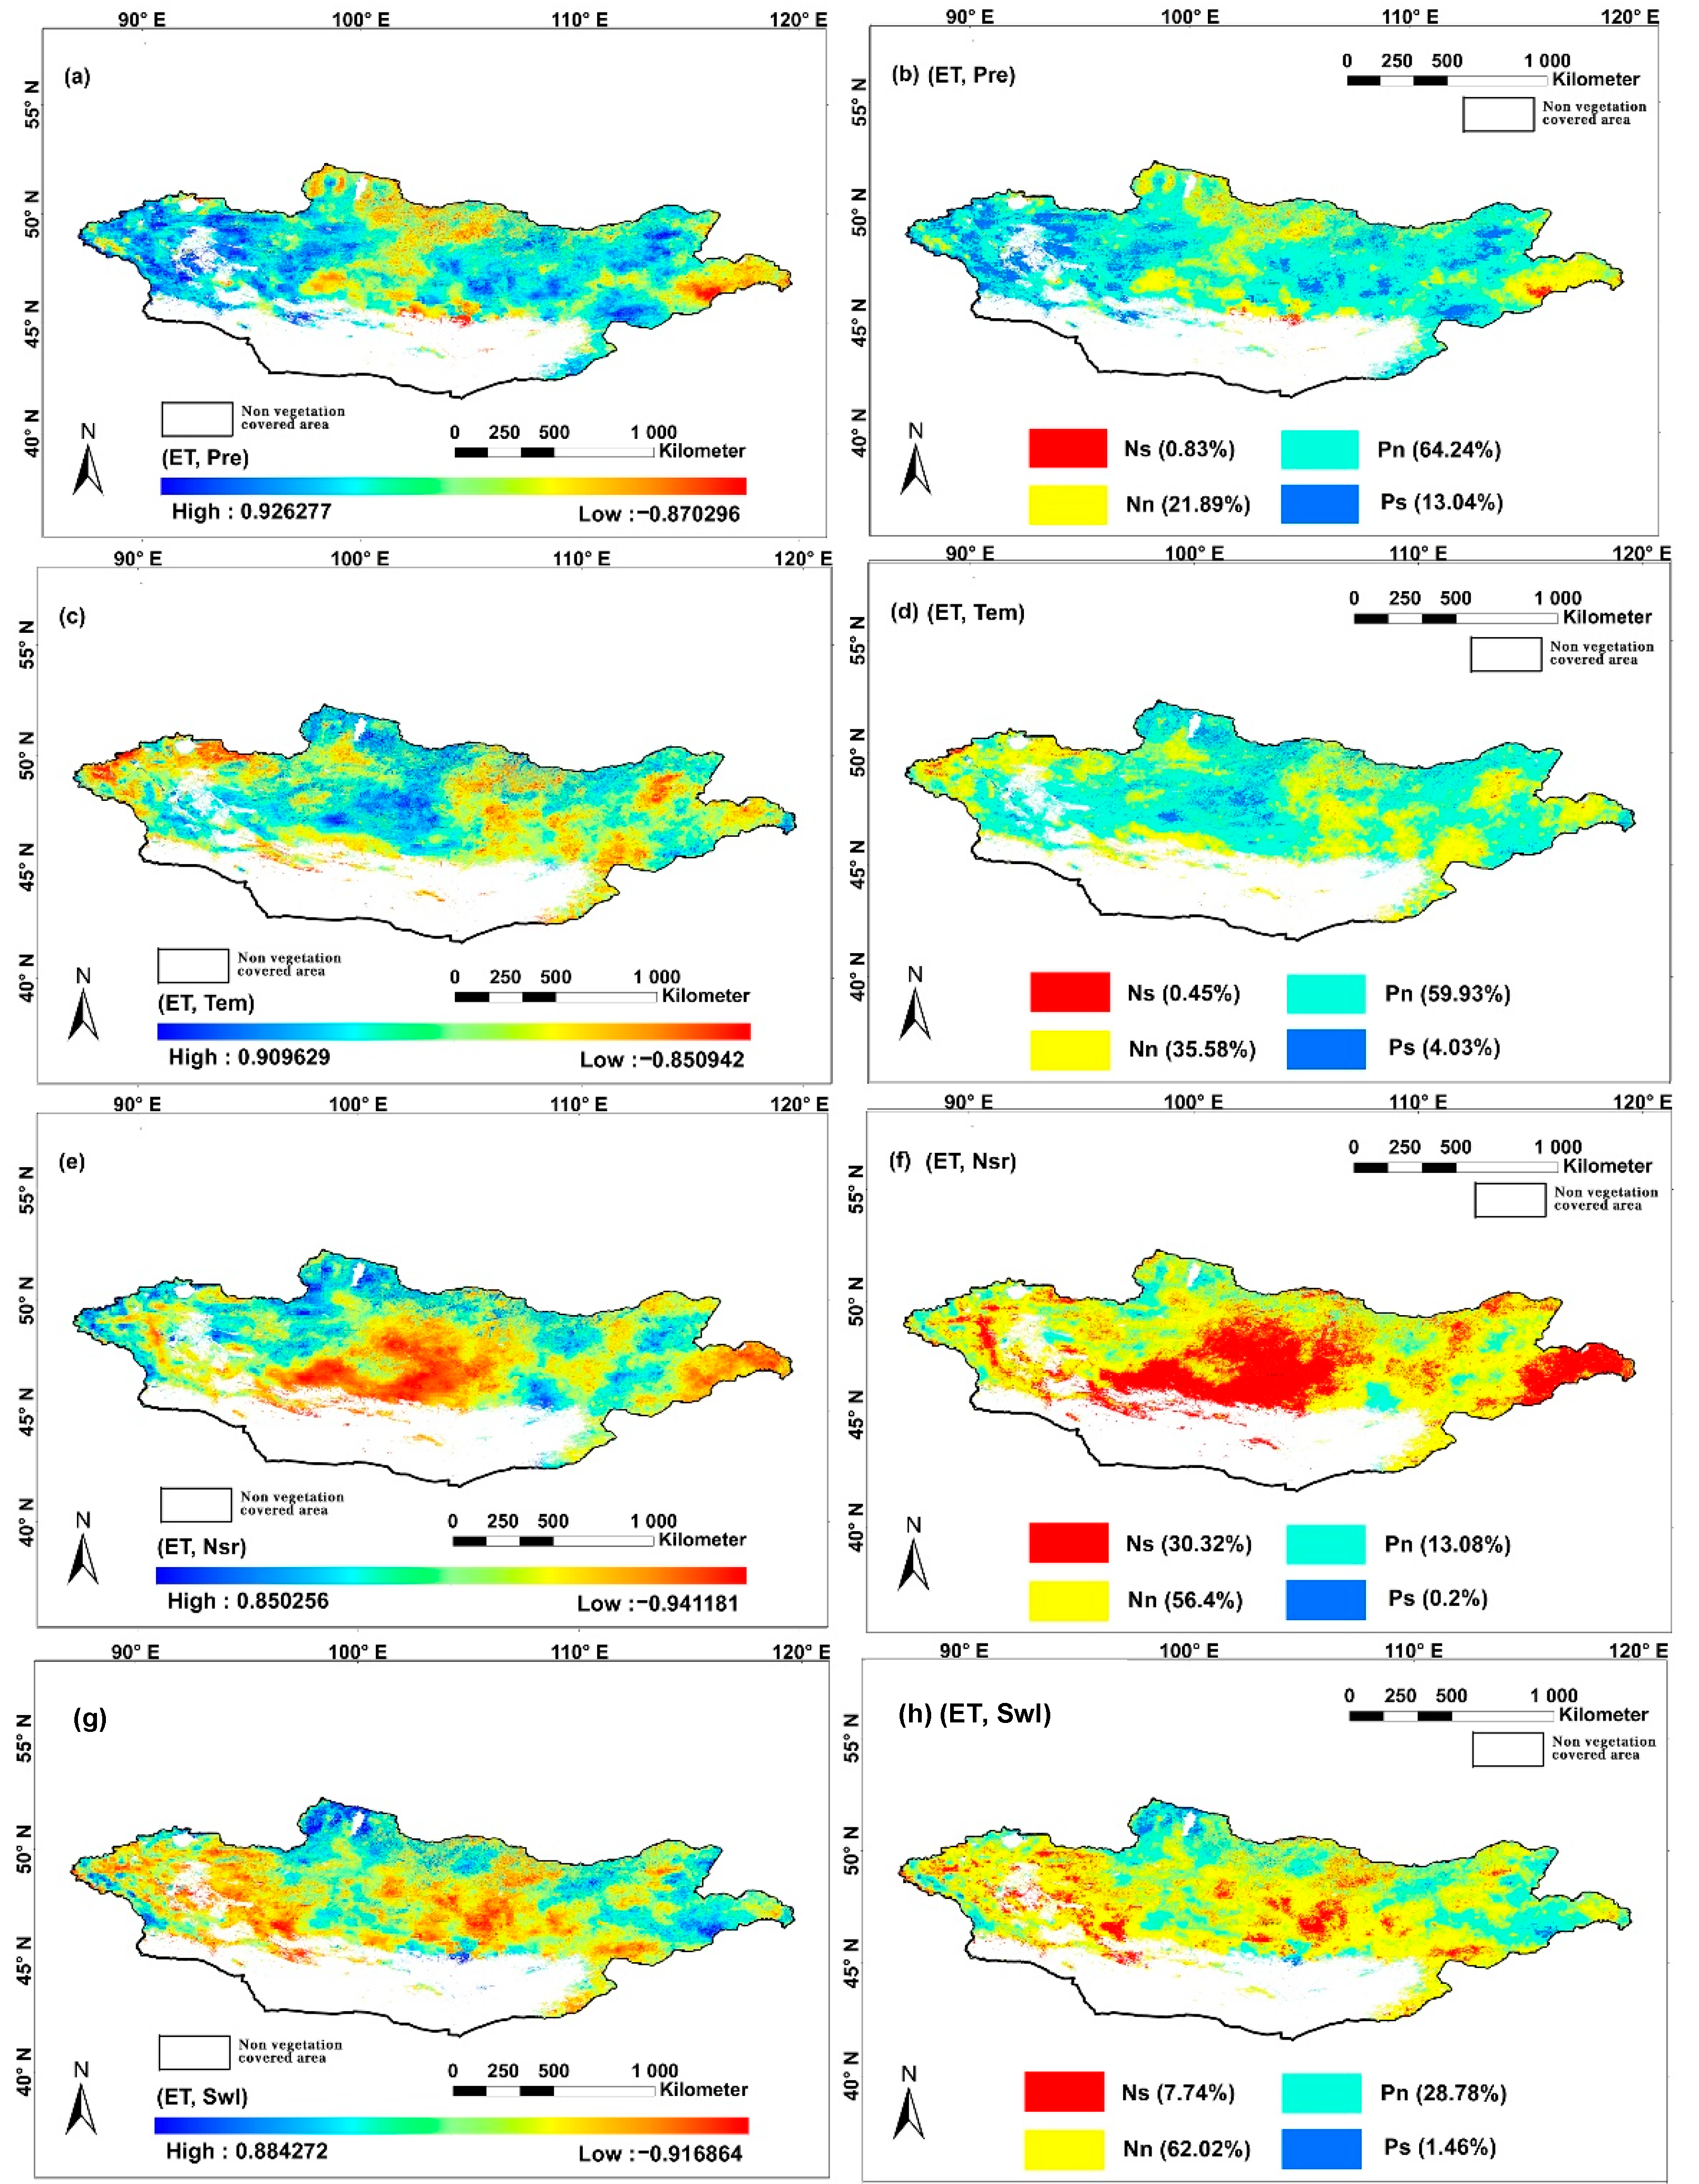
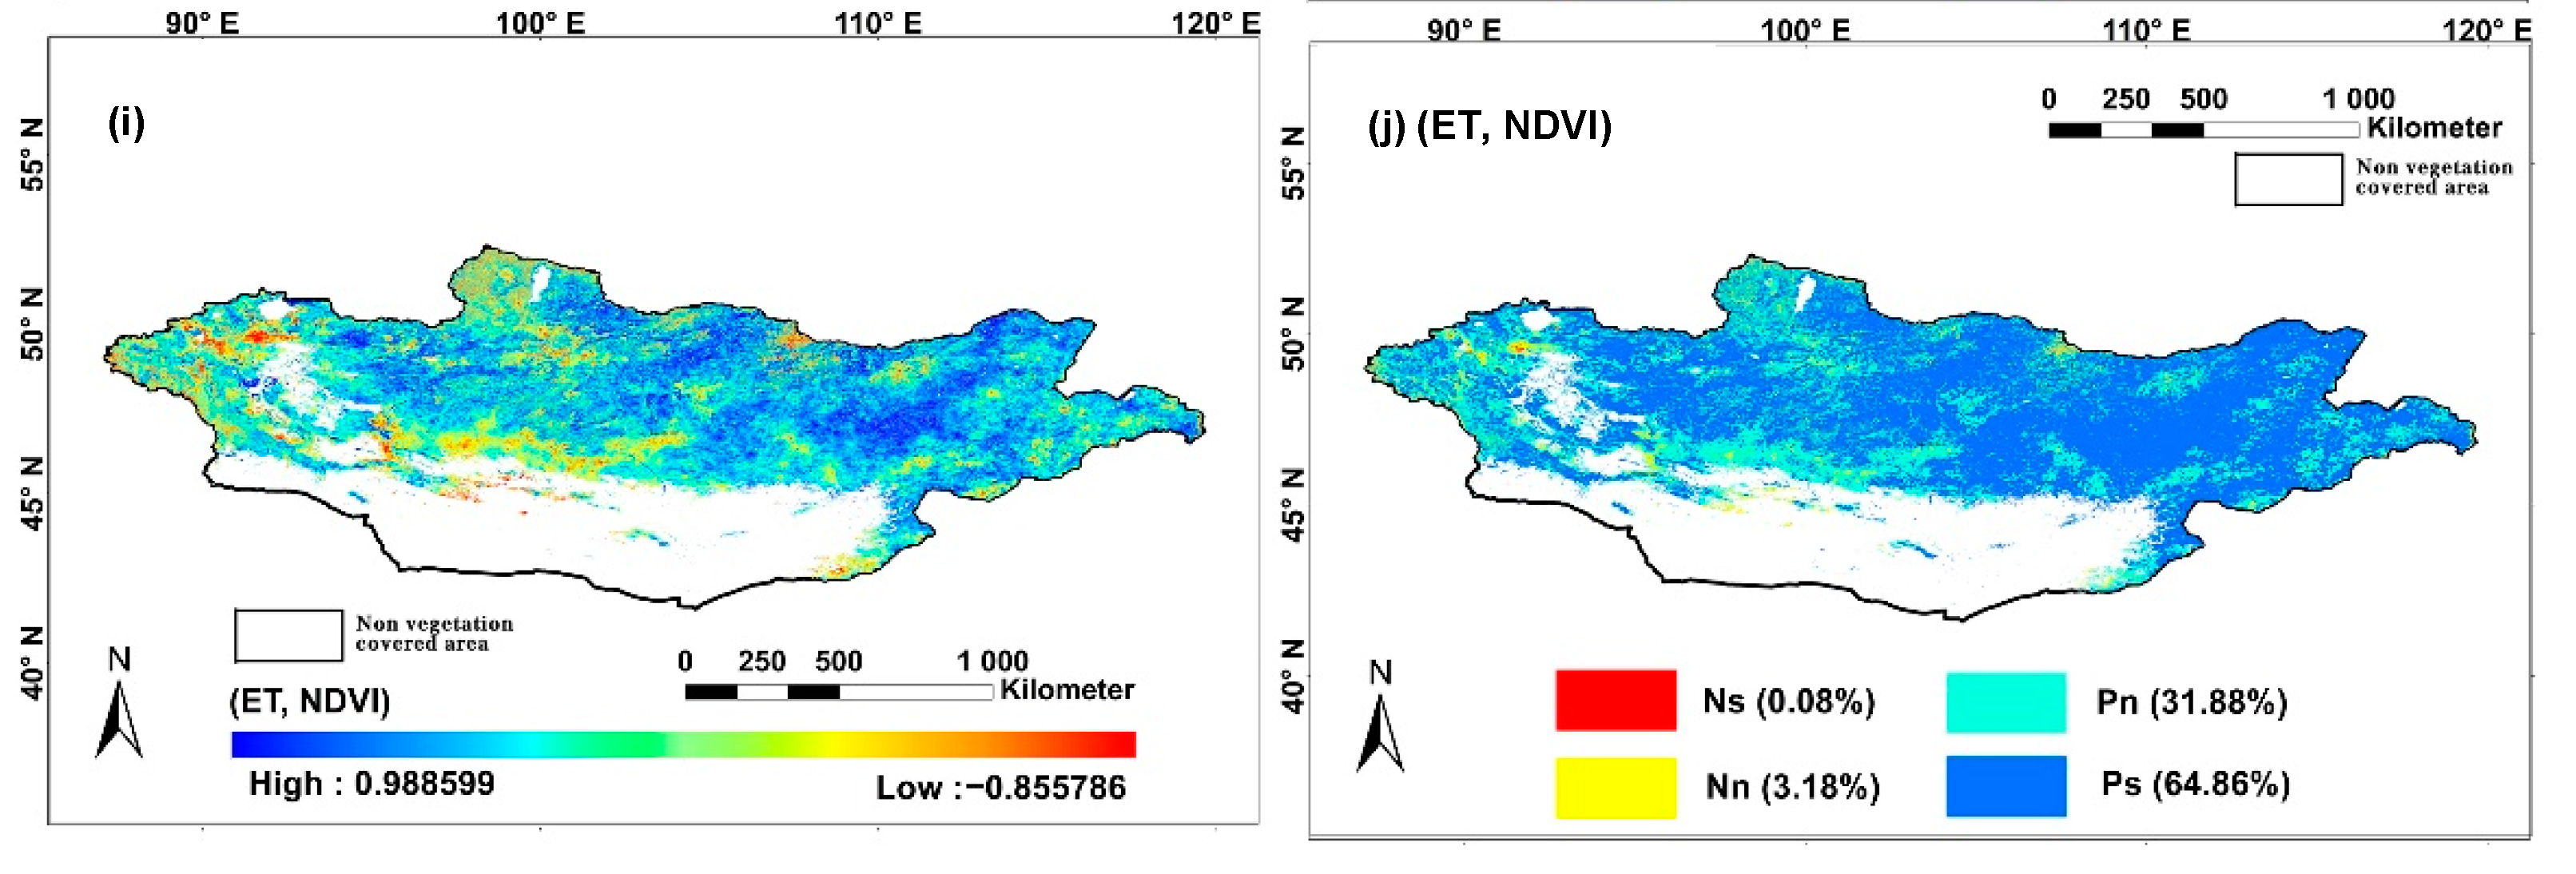
3.3.2. Responses of Interannual ET to Different Climate Factors

The greatest contribution to ET was mainly vegetation transpiration during the growing season. Therefore, we quantified the partial correlation coefficients between ET and NDVI and different climate factors in the vegetation growing season (between May and September) from 2001 to 2020 (Figure 7). The proportion of areas in which Pre was positively correlated with ET was 77.28%, and they were mainly distributed in eastern and western Mongolia, with 13.04% of areas featuring a significant positive correlation. The proportion of areas in which Tem was positively correlated with ET was 63.96%, and they were mainly distributed in central Mongolia, with 4.03% of areas featuring a significant positive correlation. The proportion of areas in which Tem was negatively correlated with ET was 36.03%, and they were mainly distributed in eastern and western Mongolia. Similar to the partial correlation coefficients in the four seasons, the spatial distribution of the negative (positive) correlation between Tem and ET was roughly consistent with the spatial distribution of the positive (negative) correlation between Pre and ET. This is partly attributable to the reduction in temperature caused by increased precipitation. In the low-temperature regions, Tem was positively correlated with ET. The proportion of areas in which Nsr and ET were negatively correlated was 86.72%, and they were mainly distributed in central, southern and eastern Mongolia; meanwhile, the proportion of areas featuring a significant negative correlation was 30.32%, and they were mainly in central and southern Mongolia, where temperatures were high, and precipitation was low.
The proportion of areas in which Swl was negatively correlated with ET was 69.76%, and they were mainly distributed in central and western Mongolia, with 7.74% of the areas featuring a significant negative correlation. When Swl was positively correlated with ET, the average NDVI (positive correlation at 0.54, significant positive correlation 0.53) and the average Pre (positive correlation 274.5 mm, significant positive correlation 271.2 mm) were higher, but the average Tem (positive correlation 14.3 °C, significant positive correlation 14.4 °C) was lower.
In the growing season, the proportion of areas featuring a positive correlation between NDVI and ET was 96.84%, constituting most of Mongolia, and the proportion of areas featuring a significant positive correlation was 64.86%. By extracting the highest (lowest) values, we obtained the spatial distributions of climate factors exhibiting a positive (negative) correlation with ET (Figure 8a,b). This means that during the growing season, the increase in NDVI under the action of precipitation and temperature contributes more vegetation transpiration and finally has a positive effect on ET. Nsr inhibited ET. In addition, the low content of soil moisture affected the production of ET.

3.3.3. Geographical Detection Model for ET Drivers

Geographic detectors can detect the power of climate factors and human factors to explain the variations in ET from a spatial differentiation perspective (including nonlinear relationships). Figure 9a shows the results of the factor detector in a whole year. Pre had the highest contribution to ET, with Q reaching 0.7327, followed by SWL and TEM, whose Q values did not exceed 0.6. For comparison, Figure 10c shows the results of the factor detector in the vegetation growth season. NDVI exhibited the highest contribution to ET, with the Q value reaching 0.8611, followed by precipitation, with a Q value of 0.7164. The Q value of human factors increased but did not exceed 0.6. This indicates that human factors affect ET mainly in the growing season. In contrast, the Q values of Swl and Tem decreased, indicating that Swl and Tem have little impact on ET in the nongrowing season.
Next, the interaction detector was used to compare the interactions between each pair of independent variables in the whole year. The annual mean results (Figure 9b) show that Pop, Stock and GDP weakened each other. The other variables showed pairwise enhancement; among them, Tem and human factors were the main interaction factors (Q = 0.8072). In the growing season, Pop, Stock and GDP weakened each other, which is consistent with the annual mean result. In addition, Tem nonlinearly enhanced Nsr. The other variables showed pairwise enhancement; among them, TEM and NDVI were the main interaction factors (Q = 0.9128). Simultaneously, the Q values between NDVI and human factors and between NDVI and Pre exceeded 0.9, while those between NDVI and Swl and between NDVI and Nsr exceeded 0.88, and the Q values between Pre and human factors exceeded 0.8.

3.4. Abrupt Changes in ET

Sudden extreme weather, such as drought, heat waves and flooding, and uncertain human activities may cause the mutation of ET. Therefore, we focused on detecting and describing such changes in the trend of the 8-day ET time series of different vegetation types in Mongolia. BFAST was used to determine the 8-day ET changes and breakpoints of different vegetation types in Mongolia (Figure 10a–f). From 2001 to 2020, the ET in Mongolia fluctuated significantly and showed an overall increasing trend. ET experienced a significant (p < 0.05) increase from 2001 to 2006, mainly in central and western Mongolia (Figure 11a,b), with a change rate of 0.096 mm per year, but from 2006 to 2007, ET experienced an extremely significant (p < 0.01) reduction, mainly in eastern, western and southern Mongolia (Figure 11c,d), with a change rate of −4.256 mm per year. These values indicate that from 2006 to 2007, a sharp decrease in ET was caused by natural factors or human activities. Furthermore, ET experienced an extremely significant (p < 0.01) increase from 2007 to 2015, mainly in southern and eastern Mongolia (Figure 11e,f), with a change rate of 0.123 mm per year. Immediately thereafter, ET experienced an extremely significant (p < 0.01) increase from 2015 to 2016, mainly in most of Mongolia (Figure 11g,h), with a change rate of 3.683 mm per year. It then experienced an extremely significant (p < 0.01) increase from 2016 to 2020, mainly in eastern Mongolia (Figure 11i,j), with a change rate of 3.374 mm per year.
The partial correlation analysis and the research results of the geographic detectors demonstrate that the NDVI had a significant effect on ET in the growing season. Therefore, we compared the BFAST results of ET in the growing season with those of the NDVI in the growing season (Figure 12a,b). Figure 12a shows that ET in the growing season experienced an extremely significant (p < 0.01) decrease from 2002 to 2007; the breakpoint years during this period include those in which ET experienced an extremely significant (p < 0.01) decrease throughout the year (2006 to 2007) (Figure 12a). Simultaneously, according to the results of the interaction detector, the interaction factor (Q value) between Tem and NDVI was the highest, and the annual average Pre had the highest explanatory power for ET. We extracted the average annual values of Pre, Tem, and NDVI in the growing season. Figure 12c,d shows that from 2006 to 2007, Pre decreased below the average value, Tem increased to its highest value in 20 years, and the NDVI (both in the whole year and in the growing season) decreased to its lowest value in 20 years. These findings suggest that the extremely significant decrease in ET from 2006 to 2007 may have been caused by reduced precipitation and a sudden decrease in the NDVI. This short-term mutation and human factors also deserve attention. In addition, the period with the largest increase in ET in the growing season (2014–2017) included the years with the largest increase in ET throughout the whole year (2015–2016). ET in the growing season provided the greatest contribution to ET in the whole year. Therefore, the BFAST results of ET throughout the year reveal the year with the highest degree of mutation. A significant correlation between NDVI and ET in the growing season was found. Figure 12b shows that the years in which the NDVI sharply increased during the growing season (2014–2018) include the years with the highest increase in ET in both the growing season and the whole year. Accordingly, the breakpoint year in which ET sharply increased was related to the sharp increase in the NDVI. However, the increasing precipitation in the same period also had a positive effect on the sharp increase in NDVI. Moreover, the reason for the sharp increase in the NDVI during the growing season may have been related to Mongolia’s campaign to plant one billion trees launched on 10 October 2010.
From 2002 to 2003, ET in typical steppe, alpine steppe and coniferous forest areas experienced an extremely significant (p < 0.01) reduction. ET in the typical steppe area experienced a second extremely significant (p < 0.01) reduction from 2007 to 2008. However, from 2003 to 2004, ET in the desert steppe area experienced an extremely significant increase (p < 0.01). Before 2014, the trend of ET in the meadow grassland area was similar to that in Mongolia. This indicates that the decrease in ET in the meadow grassland area may be the main reason for the decrease in ET in Mongolia during this period.
ET in the desert steppe area experienced an extremely significant reduction from 2017 to 2019. ET in alpine steppe and coniferous forest areas experienced an extremely significant increase (p < 0.01) from 2016 to 2017. ET in the meadow steppe area experienced an extremely significant (p < 0.01) reduction from 2014 to 2015. ET in the desert steppe area experienced an extremely significant (p < 0.01) reduction from 2017 to 2019. This result shows that the sharp increase in ET in Mongolia during this period may be due to the contribution of ET from alpine steppe and coniferous forest areas.

4. Discussion

Located atop the Mongolian Plateau, Mongolia experienced increases in both temperature and precipitation from 2001 to 2020 and correspondingly an increased NDVI. These conditions finally led to a significant increasing trend of ET in Mongolia, and the proportion of the area in which ET exhibited an extremely significant increase reached 86.92%, almost covering the entire country. This shows that vegetation transpiration has a great contribution to ET [51,52]. At the same time, we found that NDVI was highly correlated with ET during the vegetation growth season. Research on the effects of humans on vegetation has long been a topic of widespread concern [23,53,54], particularly because human influences on vegetation are common, including tree planting, grazing, policy-driven land-use conversion, ecosystem restoration, mining, and urban expansion. Therefore, human factors also influence changes in ET, but human factors usually have a direct effect on vegetation, and such anthropogenic disturbances to vegetation ultimately affect ET.
Increases in the NDVI, temperature and precipitation eventually enhance ET. Desertification is still severe in southern Mongolia, causing the ET of desert grassland to be greater than the amount of precipitation year round. This result may be caused by the significant reduction in soil moisture caused by continuous desertification (Figure 2b) and the gradual reduction in vegetation area (Figure 2e). However, the error caused by the low accuracy of MOD16A2 cannot be ignored. Although vegetation growth demands rainfall, too much rainfall can decrease temperatures, ultimately affecting the growth of vegetation [55,56]. Temperature is critical to vegetation transpiration, and excessively low temperatures can decrease vegetation transpiration, leading to a decrease in ET. Therefore, the average temperatures in the areas where ET and Pre are negatively correlated are generally lower than those in the areas with a positive correlation, and more precipitation occurs. Therefore, the positive correlation between ET and Pre basically coincides with the negative correlation between ET and Tem. In this case, reference ET is the limiting factor; in semiarid areas, temperature has a positive contribution to reference ET [57]. However, this study failed to carefully consider the influence of this parameter. Furthermore, the area with a negative correlation between Nsr and ET is large, which may be due to the influence of Nsr on precipitation and vegetation.
Studying ET trends requires paying detailed attention to the complexity of the overall system. For example, a decrease in atmospheric solar radiation transmission due to cloud cover and aerosols corresponds to an increase in downwards longwave atmospheric radiation, which slows the effect of decreased solar radiation on ET [58,59]. In addition, irrigation is an important human factor affecting ET in developed agricultural areas [60,61]. In this study, the results of the remote sensing data with low accuracy may contain some errors, especially for soil moisture, which is an important parameter. The ET product of MOD16A2 only provides the evapotranspiration data of vegetation-covered areas; thus, the evapotranspiration of water area and the non-vegetation Gobi area is not considered. Therefore, compared with the whole region on evapotranspiration, our results are lower. In addition, the mechanism affecting ET is complex and involves the interaction results of many factors. Therefore, the current analysis cannot provide clear indications about the mechanisms and dominant factors.

5. Conclusions

This study takes Mongolia as the research area and implements a Theil–Sen trend analysis, significance tests, Hurst index calculations, geographic detector models and the BFAST mutation point test. The possible trends of future changes in the NDVI are predicted, and the temporal and spatial evolutions of ET throughout Mongolia are analysed. The responses of ET to three meteorological factors (Pre, Tem, and Nsr) in different seasons and to climate factors and human factors in the growing season are also evaluated. The specific conclusions are as follows:
  • For Mongolia as a whole, more than 50% of the pixels in the study area accounted for the growth trend of ET before accounting for Swl and Nsr. Tem increased in most (92.79%) of Mongolia. The NDVI also showed an increasing trend in 93.88% of all pixels, and the percentage of pixels featuring significant growth (p < 0.05) was 30.86%. ET significantly increased (p < 0.05) in almost all pixels (95.21%).
  • Prior to 2014, the difference between Pre and ET (Pre-ET) in Mongolia was positive but declined year after year; after 2014, the difference was negative. Among the different types of vegetation, the value of this difference was negative only in the desert steppe areas. In the spring, summer and autumn, the lowest ET was in the desert steppe; in winter, the lowest ET was in coniferous forest.
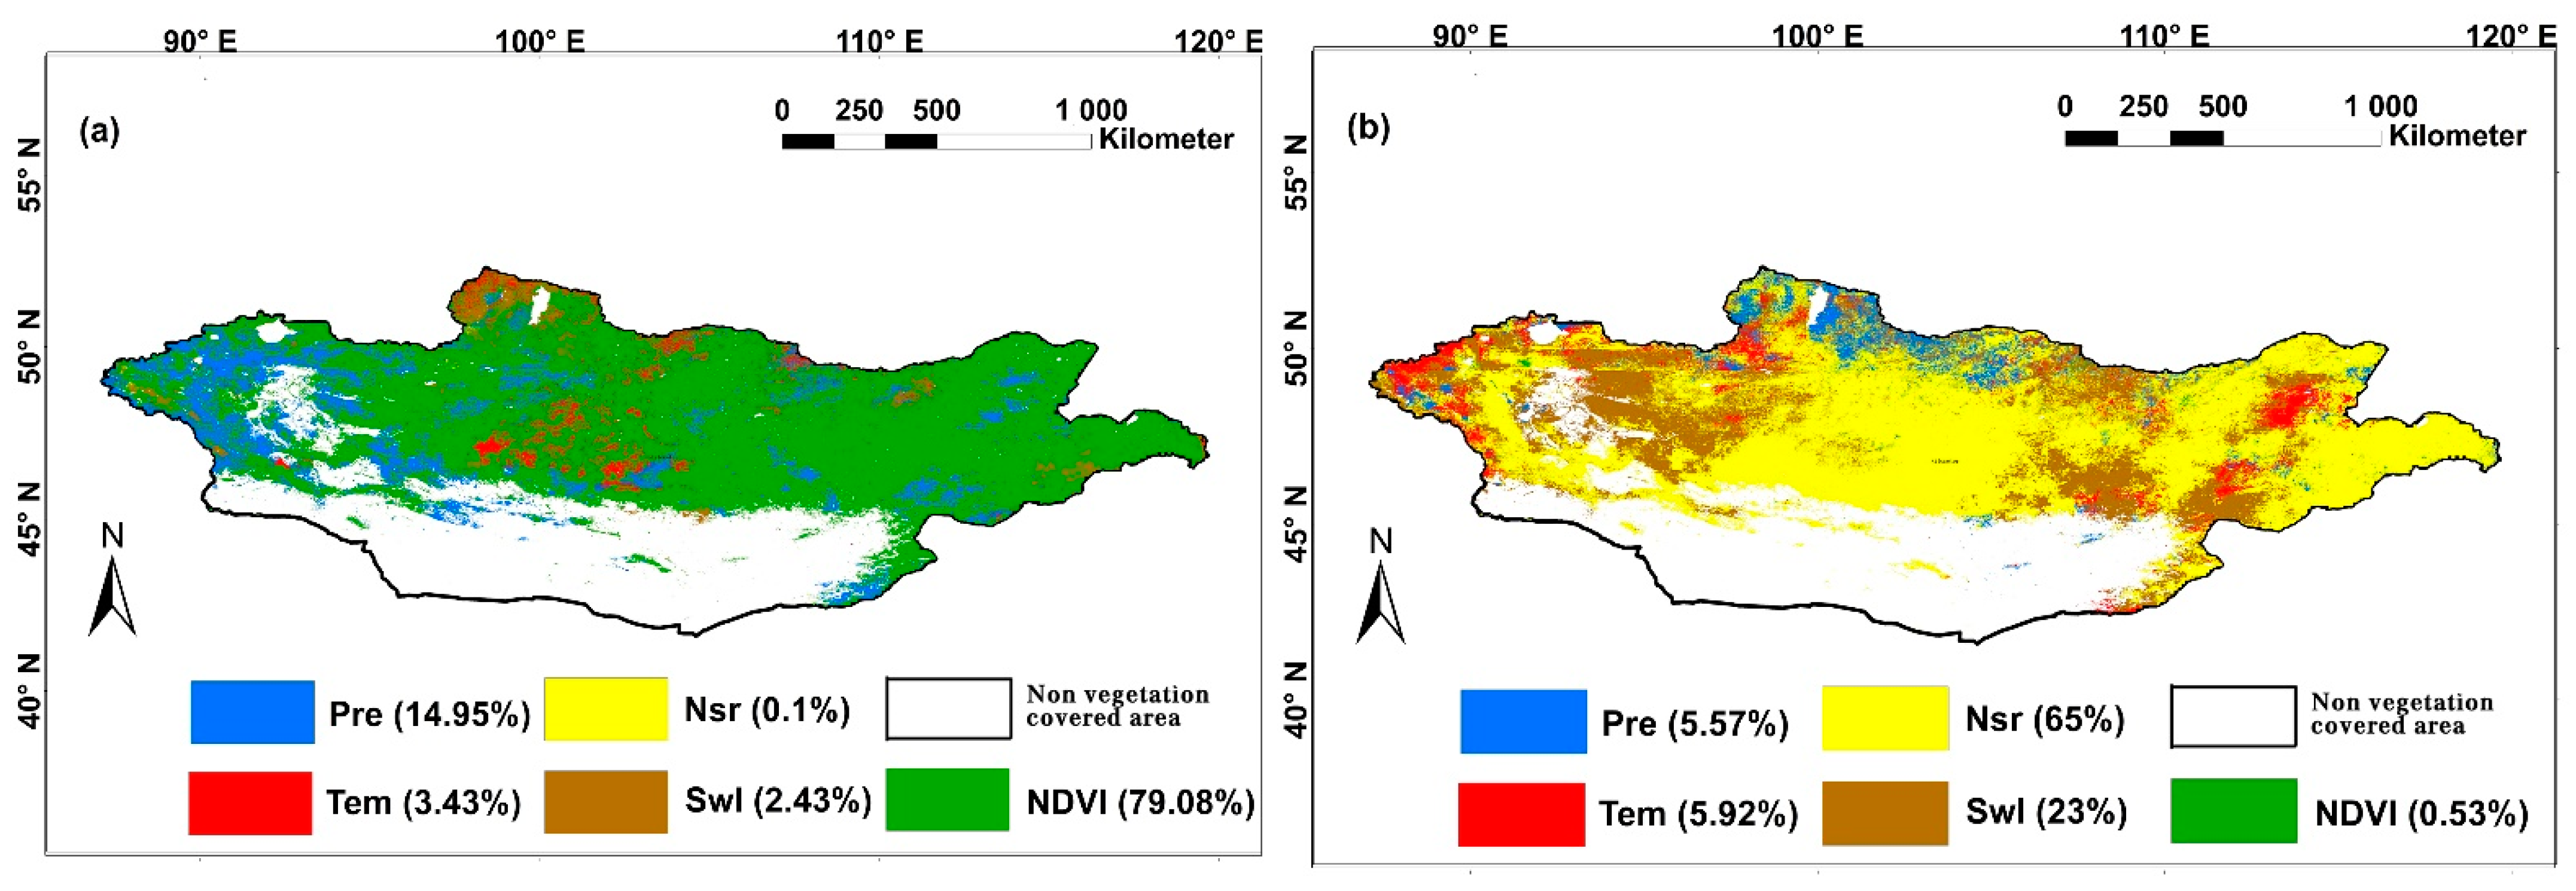
  • Pre in Mongolia has a more obvious positive impact on ET in spring, summer and autumn. This is true mainly in the east and west of Mongolia, followed by Tem mainly in the central part of Mongolia. This area has been frequently studied. In winter, Tem has a positive impact on ET in Mongolia.
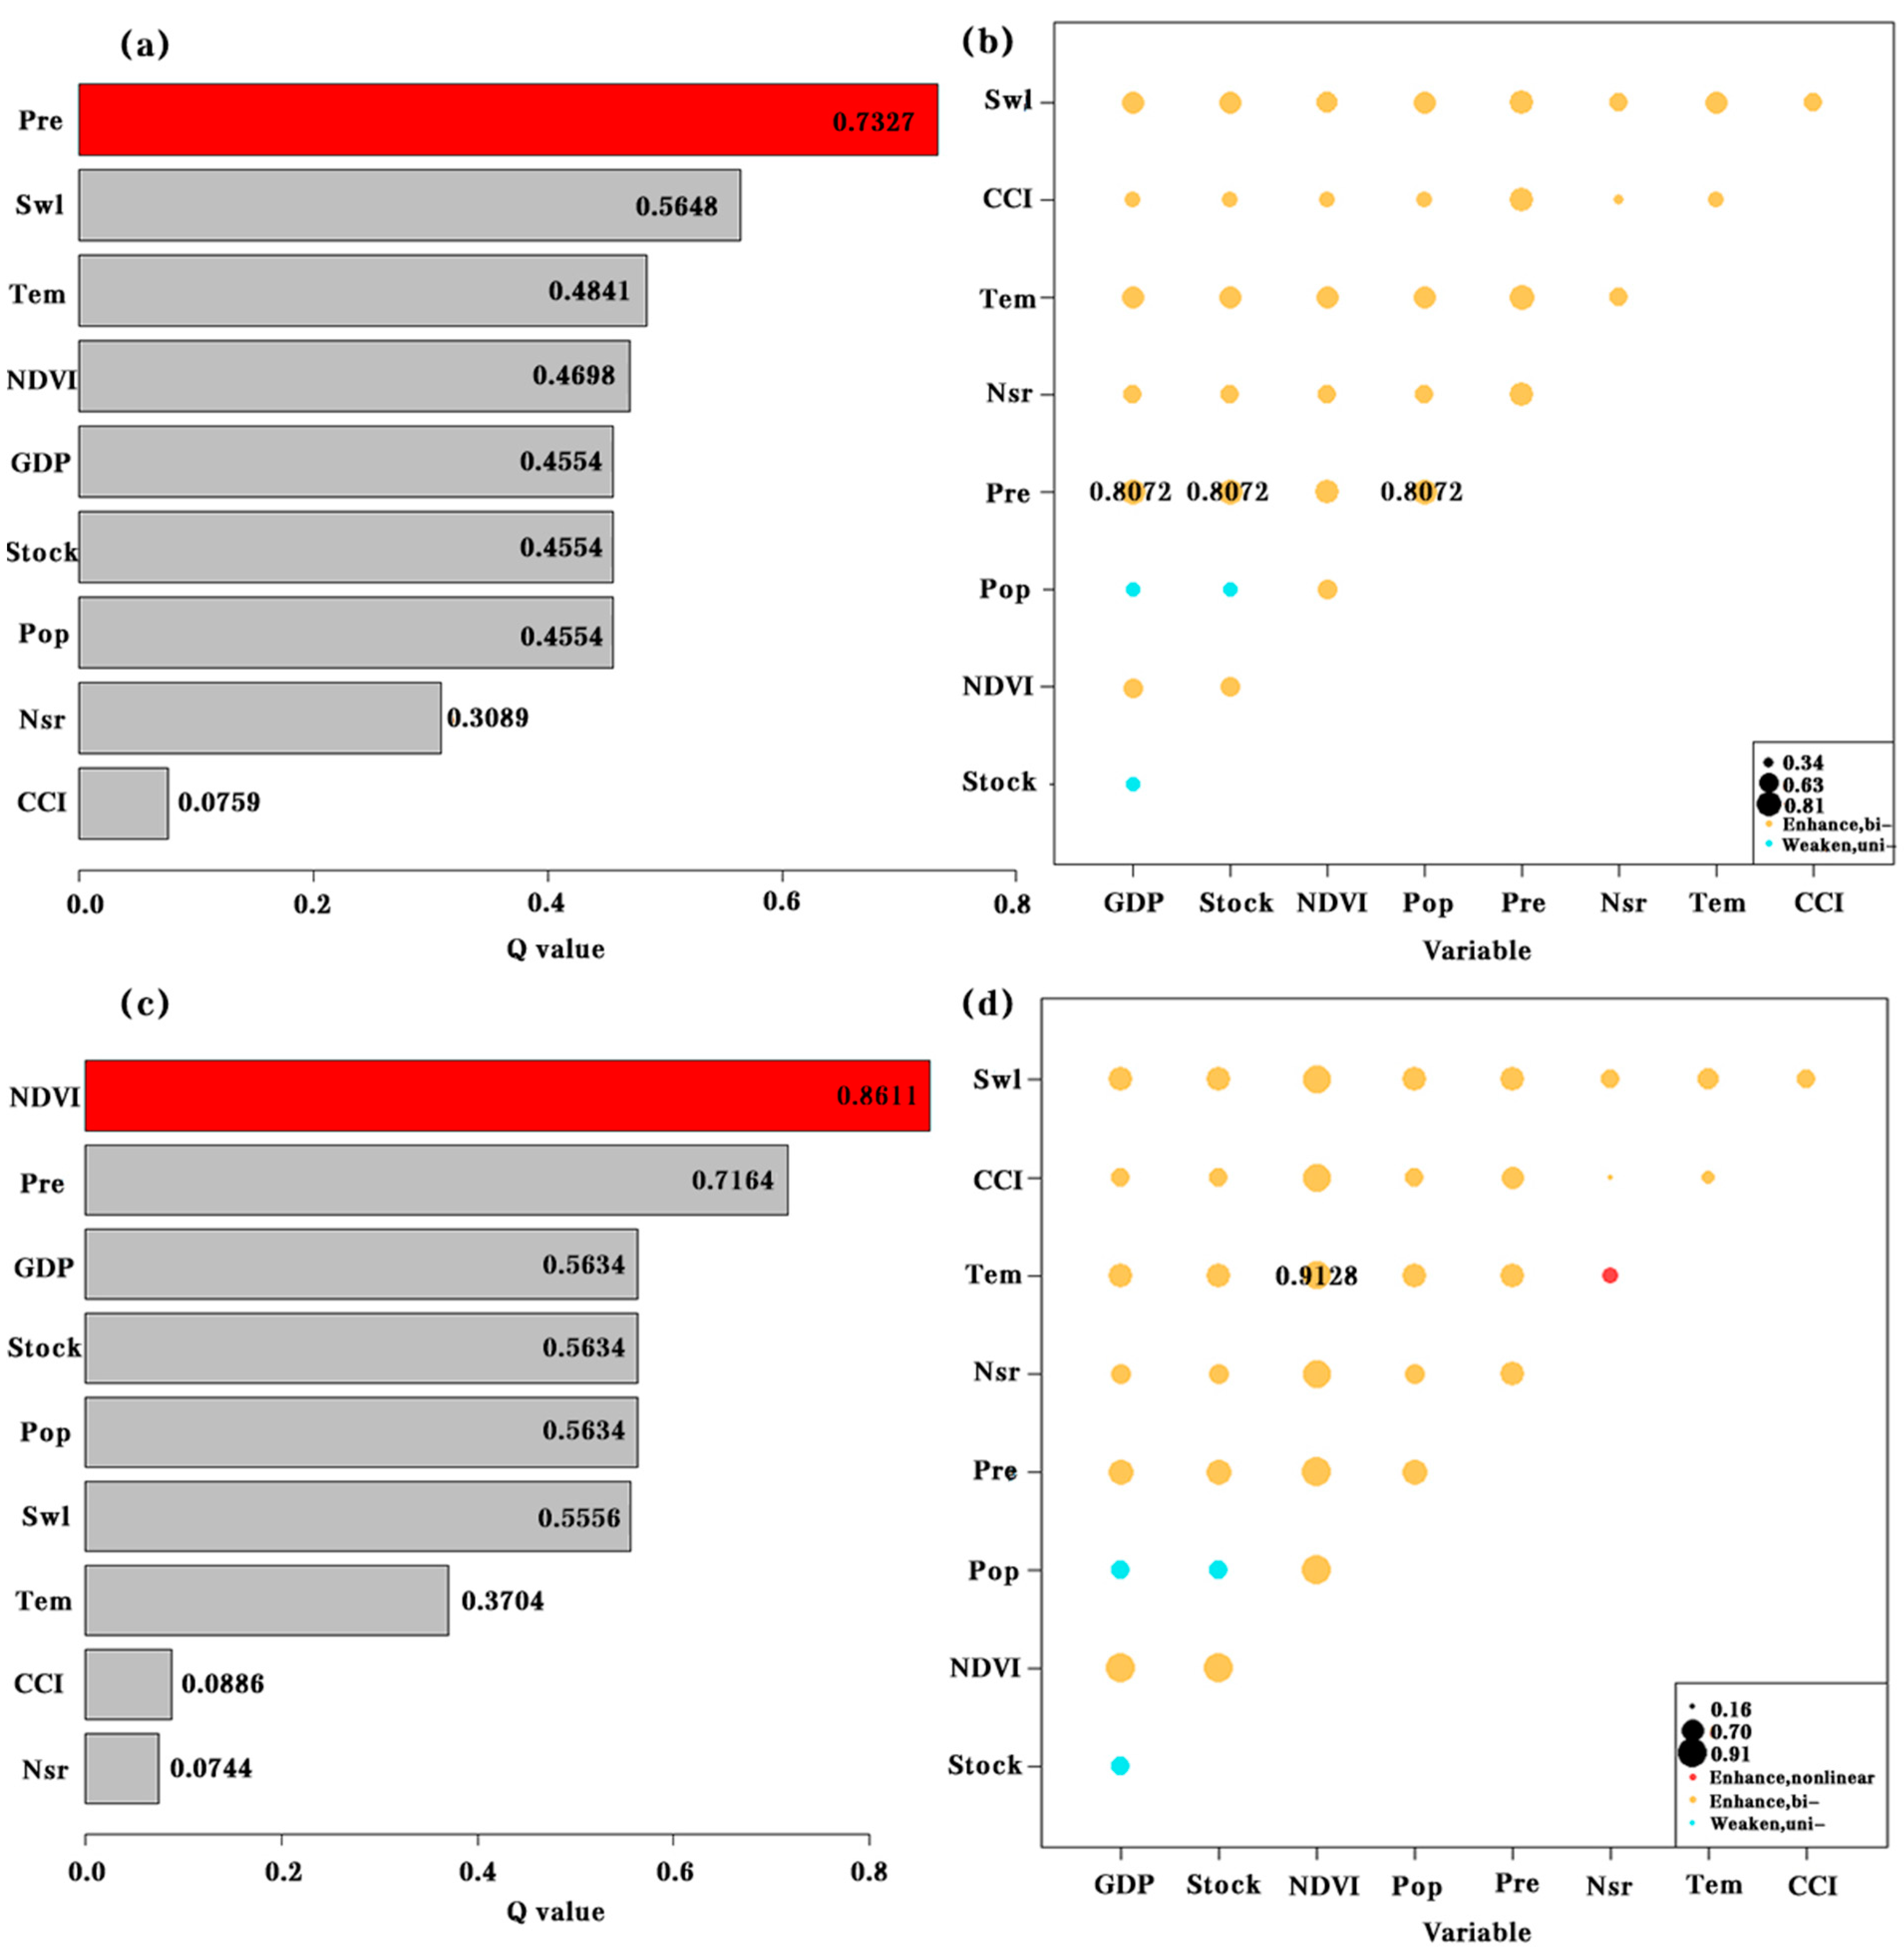
  • In the growing season, NDVI is the most important factor that has a positive impact on ET, with a pixel ratio of 96.84%, followed by Pre, with a pixel ratio of 77.28%. This means that the interaction between NDVI and Pre has a great positive impact on ET. Nsr (86.72% pixels) has a great negative impact on ET, but this may be caused by precipitation and other factors. The changes of NDVI and precipitation weaken the influence of human factors on ET. In the growing season, the effects of Tem and Nsr on ET increased nonlinearly, while other influencing factors showed a bivariate relationship.
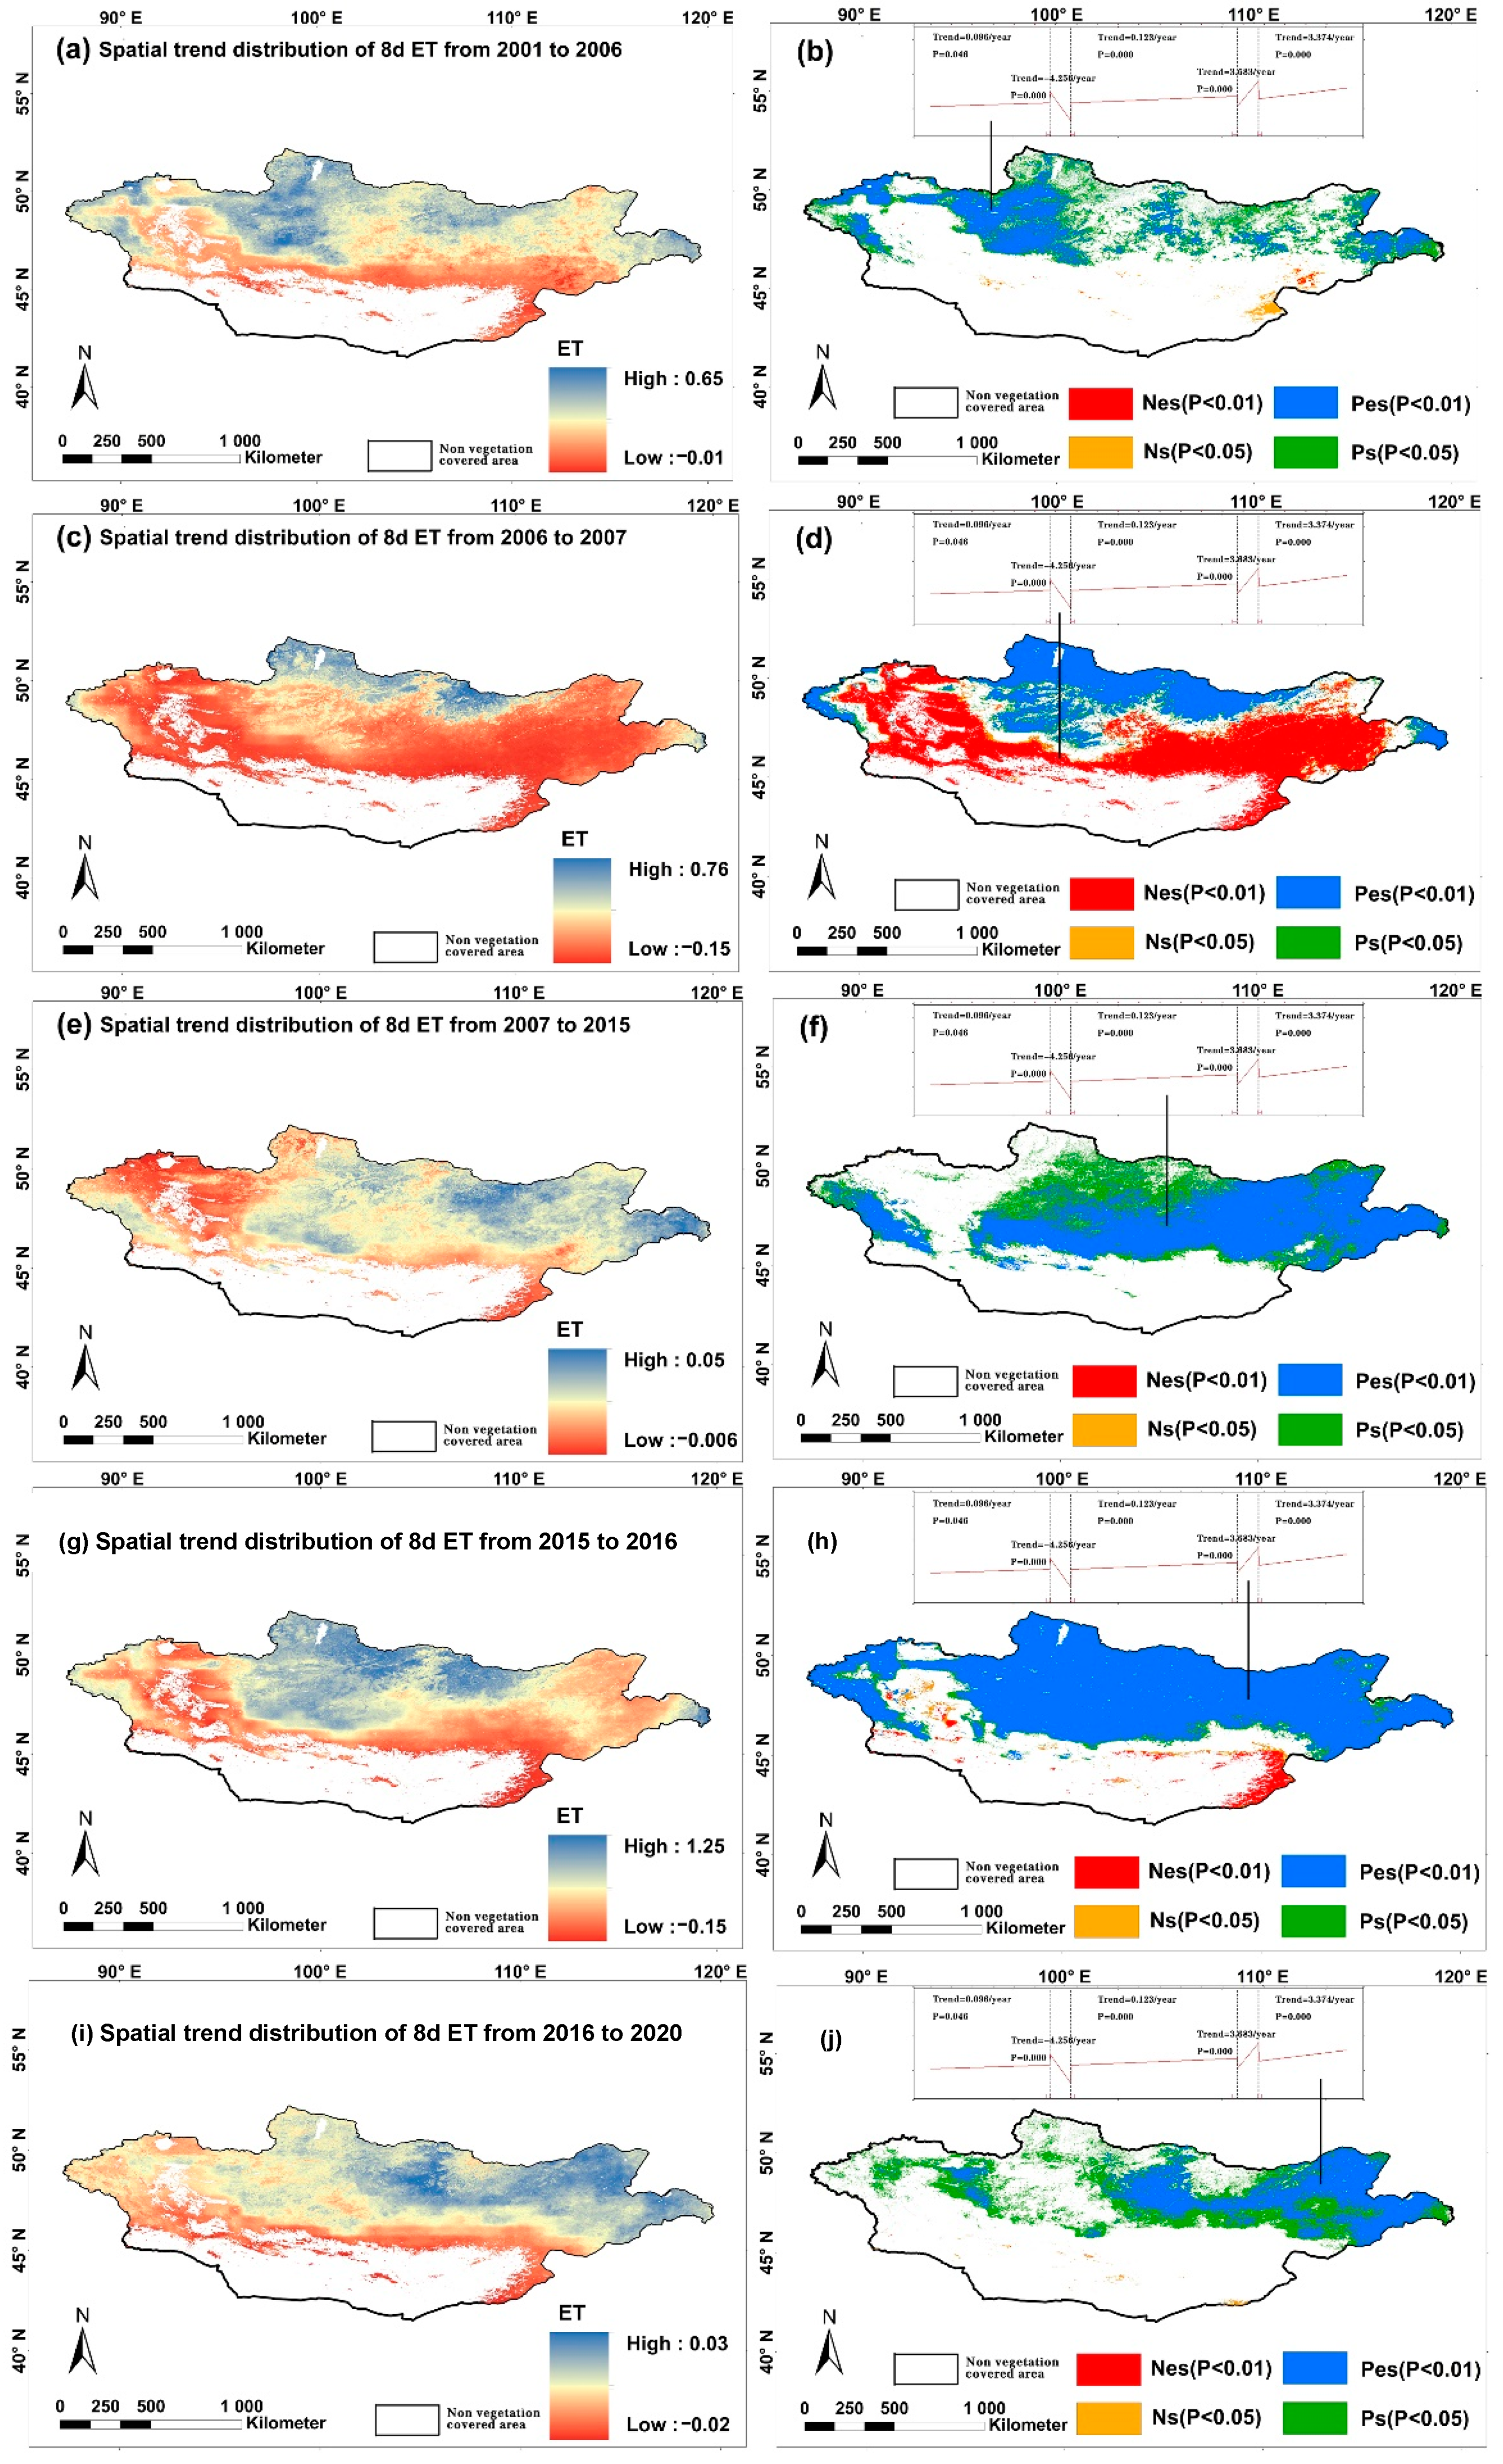
  • The trend changes detected by BFAST indicate that ET abruptly and rapidly decreased during 2006–2007 and that ET suddenly and rapidly grew during 2015–2016.

Author Contributions

C.E. analysed the data and wrote the paper. C.E. conceived and designed the experiments. Y.B. (Yuhai Bao), Y.B. (Yulong Bao), M.Y. and X.Z. revised the manuscript. Project administration, supervision, validation, review & editing have been done by T.B. All authors have read and agreed to the published version of the manuscript.

Funding

This study was supported by research on remote sensing monitoring and propagation path prediction of typical cross-border disasters in China and Mongolia (Funder: Yuhai Bao; No. 61631011), on early warning and information sharing of forest and grassland fire risk in the Mongolian Plateau under the background of climate change (Funder: Yuhai Bao; No. 4191101037), Research on Monitoring and Early Warning Methods of black Dzud in Pastoral Areas Based on Daily Snow Products (Funder: Yulong Bao; No. 2021MS04016) and the National Natural Science Foundation of China (Funder: Mei Yong; No. 41867070).

Institutional Review Board Statement

Not applicable.

Informed Consent Statement

Not applicable.

Data Availability Statement

Not applicable.

Acknowledgments

We thank the reviewers for their suggestions.

Conflicts of Interest

The authors declare no conflict of interest.

References

  1. Xiong, Y.J.; Zhao, S.H.; Tian, F.; Qiu, G.Y. An evapotranspiration product for arid regions based on the three-temperature model and thermal remote sensing. J. Hydrol. 2015, 530, 392–404. [Google Scholar] [CrossRef]
  2. Sharma, V.; Kilic, A.; Irmak, S. Impact of scale/resolution on evapotranspiration from Landsat and MODIS images. Water Resour. Res. 2016, 52, 1800–1819. [Google Scholar] [CrossRef] [Green Version]
  3. Jung, M.; Reichstein, M.; Ciais, P.; Seneviratne, S.I.; Sheffield, J.; Goulden, M.L.; Bonan, G.; Cescatti, A.; Chen, J.Q.; de Jeu, R.; et al. Recent decline in the global land evapotranspiration trend due to limited moisture supply. Nature 2010, 467, 951–954. [Google Scholar] [CrossRef]
  4. Zhang, K.; Kimball, J.S.; Nemani, R.R.; Running, S.W.; Hong, Y.; Gourley, J.J.; Yu, Z. Vegetation Greening and Climate Change Promote Multidecadal Rises of Global Land Evapotranspiration. Sci. Rep. 2015, 5, 15956. [Google Scholar] [CrossRef]
  5. Saptomo, S.K.; Setiawan, B.I.; Yuge, K. Climate change effects on paddy field thermal environment and evapotranspiration. Paddy Water Environ. 2009, 7, 341–347. [Google Scholar] [CrossRef]
  6. Nistor, M.M.; Gualtieri, A.F.; Cheval, S.; Dezsi, T.; Boan, V.E. Climate change effects on crop evapotranspiration in the Carpathian Region from 1961 to 2010. Meteorol. Appl. 2016, 23, 462–469. [Google Scholar] [CrossRef]
  7. Hulme, N.C. Evaporation and potential evapotranspiration in India under conditions of recent and future climate change. Agric. For. Meteorol. 1997, 87, 55–73. [Google Scholar]
  8. Boé, J.; Terray, L. Uncertainties in summer evapotranspiration changes over Europe and implications for regional climate change. Geophys. Res. Lett. 2008, 35, 5. [Google Scholar] [CrossRef] [Green Version]
  9. McVicar, T.R.; Roderick, M.L.; Donohue, R.J. Global review and synthesis of trends in observed terrestrial near-surface wind speeds: Implications for evaporation. J. Hydrol. 2012, 416–417, 182–205. [Google Scholar] [CrossRef]
  10. Hély, C.; Bremond, L.; Alleaume, S.; Smith, B.; Sykes, M.T. Sensitivity of African biomes to changes in the precipitation regime. Glob. Ecol. Biogeogr. 2006, 15, 258–270. [Google Scholar] [CrossRef]
  11. Gao, G.; Xu, C.-Y.; Chen, D.; Singh, V.P. Spatial and temporal characteristics of actual evapotranspiration over Haihe River basin in China. Stoch. Environ. Res. Risk Assess. 2012, 26, 655–669. [Google Scholar] [CrossRef]
  12. Czikowsky, M.J.; Fitzjarrald, D.R. Evidence of Seasonal Changes in Evapotranspiration in Eastern U.S. Hydrological Records. J. Hydrometeorol. 2009, 5, 974–988. [Google Scholar] [CrossRef]
  13. Xie, H.; Zhu, X. Reference evapotranspiration trends and their sensitivity to climatic change on the Tibetan Plateau (1970–2009). Hydrol. Process. 2013, 27, 3685–3693. [Google Scholar] [CrossRef]
  14. Huntington, T.G. Evidence for intensification of the global water cycle: Review and synthesis. J. Hydrol. 2006, 319, 83–95. [Google Scholar] [CrossRef]
  15. Zhou, F.; Wang, T.; Ciais, P.; Piao, S.; Mao, J.; Shi, X.; Zeng, Z. A worldwide analysis of spatiotemporal changes in water balance-based evapotranspiration from 1982 to 2009. J. Geophys. Res. Atmos. JGR 2014, 19, 1186–1202. [Google Scholar]
  16. Marshall, M.; Funk, C.; Michaelsen, J. Examining evapotranspiration trends in Africa. Clim. Dyn. 2012, 38, 1849–1865. [Google Scholar] [CrossRef]
  17. Good, S.P.; Noone, D.; Bowen, G. Hydrologic connectivity constrains partitioning of global terrestrial water fluxes. Science 2015, 349, 175–177. [Google Scholar] [CrossRef] [Green Version]
  18. Zhang, K.X.; Pan, S.M.; Zhang, W.; Xu, Y.H.; Cao, L.G.; Hao, Y.P.; Wang, Y. Influence of climate change on reference evapotranspiration and aridity index and their temporal-spatial variations in the Yellow River Basin, China, from 1961 to 2012. Quat. Int. 2015, 380, 75–82. [Google Scholar] [CrossRef]
  19. Bai, Y.; Zhang, J.H.; Zhang, S.; Yao, F.M.; Magliulo, V. A remote sensing-based two-leaf canopy conductance model: Global optimization and applications in modeling gross primary productivity and evapotranspiration of crops. Remote Sens. Environ. 2018, 215, 411–437. [Google Scholar] [CrossRef]
  20. Walter, M.T.; Wilks, D.S.; Parlange, J.-Y.; Schneider, R.L. Increasing Evapotranspiration from the Conterminous United States. J. Hydrometeorol. 2004, 5, 405–408. [Google Scholar] [CrossRef]
  21. Sharma, S.; Rajan, N.; Cui, S.; Maas, S.; Casey, K.; Ale, S.; Jessup, R. Carbon and evapotranspiration dynamics of a non-native perennial grass with biofuel potential in the southern US Great Plains. Agric. For. Meteorol. 2019, 269, 285–293. [Google Scholar] [CrossRef]
  22. Kim, H.W.; Hwang, K.; Mu, Q.; Lee, S.O.; Choi, M. Validation of MODIS 16 Global Terrestrial Evapotranspiration Products in Various Climates and Land Cover Types in Asia. KSCE J. Civ. Eng. 2012, 16, 229–238. [Google Scholar] [CrossRef]
  23. Meng, X.Y.; Gao, X.; Li, S.Y.; Lei, J.Q. Spatial and Temporal Characteristics of Vegetation NDVI Changes and the Driving Forces in Mongolia during 1982–2015. Remote Sens. 2020, 12, 603. [Google Scholar] [CrossRef] [Green Version]
  24. Oki, T.; Kanae, S. Global Hydrological Cycles and World Water Resources. Science 2006, 313, 1068–1072. [Google Scholar] [CrossRef] [PubMed] [Green Version]
  25. Sen, Z. Innovative Trend Analysis Methodology. J. Hydrol. Eng. 2012, 17, 1042–1046. [Google Scholar] [CrossRef]
  26. Gocic, M.; Trajkovic, S. Analysis of changes in meteorological variables using Mann-Kendall and Sen’s slope estimator statistical tests in Serbia. Glob. Planet. Chang. 2013, 100, 172–182. [Google Scholar] [CrossRef]
  27. Wang, F.; Shao, W.; Yu, H.J.; Kan, G.Y.; He, X.Y.; Zhang, D.W.; Ren, M.L.; Wang, G. Re-evaluation of the Power of the Mann-Kendall Test for Detecting Monotonic Trends in Hydrometeorological Time Series. Front. Earth Sci. 2020, 8, 12. [Google Scholar] [CrossRef]
  28. Rivas-Tabares, D.A.; Saa-Requejo, A.; Martin-Sotoca, J.J.; Tarquis, A.M. Multiscaling NDVI Series Analysis of Rainfed Cereal in Central Spain. Remote Sens. 2021, 13, 568. [Google Scholar] [CrossRef]
  29. Wanyama, D.; Moore, N.J.; Dahlin, K.M. Persistent Vegetation Greening and Browning Trends Related to Natural and Human Activities in the Mount Elgon Ecosystem. Remote Sens. 2020, 12, 2113. [Google Scholar] [CrossRef]
  30. Zhang, P.P.; Cai, Y.P.; Yang, W.; Yi, Y.J.; Yang, Z.F.; Fu, Q. Contributions of climatic and anthropogenic drivers to vegetation dynamics indicated by NDVI in a large dam-reservoir-river system. J. Clean Prod. 2020, 256, 120477. [Google Scholar] [CrossRef]
  31. Xue, Z.H.; Du, P.J.; Feng, L. Phenology-Driven Land Cover Classification and Trend Analysis Based on Long-term Remote Sensing Image Series. IEEE J. Sel. Top. Appl. Earth Observ. Remote Sens. 2014, 7, 1142–1156. [Google Scholar] [CrossRef]
  32. Permatasari, P.A.; Fatikhunnada, A.; Liyantono; Setiawan, Y.; Syartinilia; Nurdiana, A. Analysis of Agricultural Land Use Changes in Jombang Regency, East Java, Indonesia Using BFAST Method. Procedia Environ. Sci. 2015, 33, 27–35. [Google Scholar] [CrossRef] [Green Version]
  33. Militino, A.F.; Moradi, M.; Ugarte, M.D. On the Performances of Trend and Change-Point Detection Methods for Remote Sensing Data. Remote Sens. 2020, 12, 1008. [Google Scholar] [CrossRef] [Green Version]
  34. Watts, L.M.; Laffan, S.W. Effectiveness of the BFAST algorithm for detecting vegetation response patterns in a semi-arid region. Remote Sens. Environ. 2014, 154, 234–245. [Google Scholar] [CrossRef]
  35. Wang, J.F.; Zhang, T.L.; Fu, B.J. A measure of spatial stratified heterogeneity. Ecol. Indic. 2016, 67, 250–256. [Google Scholar] [CrossRef]
  36. Wang, J.F.; Li, X.H.; Christakos, G.; Liao, Y.L.; Zhang, T.; Gu, X.; Zheng, X.Y. Geographical Detectors-Based Health Risk Assessment and its Application in the Neural Tube Defects Study of the Heshun Region, China. Int. J. Geogr. Inf. Sci. 2010, 24, 107–127. [Google Scholar] [CrossRef]
  37. Hilker, T.; Natsagdorj, E.; Waring, R.H.; Lyapustin, A.; Wang, Y.J. Satellite observed widespread decline in Mongolian grasslands largely due to overgrazing. Glob. Chang. Biol. 2014, 20, 418–428. [Google Scholar] [CrossRef] [Green Version]
  38. Angerer, J.; Han, G.; Fujisaki, I.; Havstad, K. Climate Change and Ecosystems of Asia with Emphasis on Inner Mongolia and Mongolia. Rangelands 2008, 30, 46–51. [Google Scholar] [CrossRef] [Green Version]
  39. Bao, G.; Bao, Y.H.; Sanjjava, A.; Qin, Z.H.; Zhou, Y.; Xu, G. NDVI-indicated long-term vegetation dynamics in Mongolia and their response to climate change at biome scale. Int. J. Climatol. 2015, 35, 4293–4306. [Google Scholar] [CrossRef]
  40. Bao, G.; Bao, Y.H.; Qin, Z.H.; Xin, X.P.; Bao, Y.L.; Bayarsaikan, S.; Zhou, Y.; Chuntai, B. Modeling net primary productivity of terrestrial ecosystems in the semi-arid climate of the Mongolian Plateau using LSWI-based CASA ecosystem model. Int. J. Appl. Earth Obs. Geoinf. 2016, 46, 84–93. [Google Scholar] [CrossRef]
  41. Didan, K. MOD13A1 MODIS/Terra Vegetation Indices 16-Day L3 Global 500m SIN Grid V006, [NDVI]. NASA EOSDIS Land Processes DAAC. 2015. Available online: https://lpdaacsvc.cr.usgs.gov/appeears/ (accessed on 3 September 2021).
  42. Fensholt, R.; Langanke, T.; Rasmussen, K.; Reenberg, A.; Prince, S.D.; Tucker, C.; Scholes, R.J.; Le, Q.B.; Bondeau, A.; Eastman, R.; et al. Greenness in semi-arid areas across the globe 1981-2007-an Earth Observing Satellite based analysis of trends and drivers. Remote Sens. Environ. 2012, 121, 144–158. [Google Scholar] [CrossRef]
  43. Lunetta, R.S.; Knight, J.F.; Ediriwickrema, J.; Lyon, J.G.; Worthy, L.D. Land-cover change detection using multi-temporal MODIS NDVI data. Remote Sens. Environ. 2009, 105, 142–154. [Google Scholar] [CrossRef]
  44. Kendall, M.G. Rank Correlation Methods. Br. J. Psychol. 1990, 25, 86–91. [Google Scholar] [CrossRef]
  45. Bao, G.; Jin, H.; Tong, S.Q.; Chen, J.Q.; Huang, X.J.; Bao, Y.H.; Shao, C.L.; Mandakh, U.; Chopping, M.; Du, L.T. Autumn Phenology and Its Covariation with Climate, Spring Phenology and Annual Peak Growth on the Mongolian Plateau. Agric. For. Meteorol. 2021, 298, 108312. [Google Scholar] [CrossRef]
  46. Verbesselt, J.; Zeileis, A.; Herold, M. Near real-time disturbance detection using satellite image time series. Remote Sens. Environ. 2012, 123, 98–108. [Google Scholar] [CrossRef]
  47. Verbesselt, J.; Hyndman, R.; Newnham, G.; Culvenor, D. Detecting trend and seasonal changes in satellite image time series. Remote Sens. Environ. 2010, 114, 106–115. [Google Scholar] [CrossRef]
  48. Verbesselt, J.; Hyndman, R.; Zeileis, A.; Culvenor, D. Phenological change detection while accounting for abrupt and gradual trends in satellite image time series. Remote Sens. Environ. 2010, 114, 2970–2980. [Google Scholar] [CrossRef] [Green Version]
  49. Wessels, K.J.; Prince, S.D.; Malherbe, J.; Small, J.; Frost, P.E.; VanZyl, D. Can human-induced land degradation be distinguished from the effects of rainfall variability? A case study in South Africa. J. Arid. Environ. 2007, 68, 271–297. [Google Scholar] [CrossRef]
  50. Su, Y.; Li, T.X.; Cheng, S.K.; Wang, X. Spatial distribution exploration and driving factor identification for soil salinisation based on geodetector models in coastal area. Ecol. Eng. 2020, 156, 105961. [Google Scholar] [CrossRef]
  51. Zhu, X.J.; Yu, G.R.; Hu, Z.M.; Wang, Q.F.; He, H.L.; Yan, J.H.; Wang, H.M.; Zhang, J.H. Spatiotemporal variations of T/ET (the ratio of transpiration to evapotranspiration) in three forests of Eastern China. Ecol. Indic. 2015, 52, 411–421. [Google Scholar] [CrossRef] [Green Version]
  52. Dong, G.; Zhao, F.Y.; Chen, J.Q.; Qu, L.P.; Jiang, S.C.; Chen, J.Y.; Shao, C.L. Divergent forcing of water use efficiency from aridity in two meadows of the Mongolian Plateau. J. Hydrol. 2021, 593, 125799. [Google Scholar] [CrossRef]
  53. Jin, H.; Bao, G.; Chen, J.Q.; Chopping, M.; Jin, E.; Mandakh, U.; Jiang, K.; Huang, X.J.; Bao, Y.H.; Vandansambuu, B. Modifying the maximal light-use efficiency for enhancing predictions of vegetation net primary productivity on the Mongolian Plateau. Int. J. Remote Sens. 2020, 41, 3740–3760. [Google Scholar] [CrossRef]
  54. Guo, E.L.; Wang, Y.F.; Wang, C.L.; Sun, Z.Y.; Bao, Y.L.; Mandula, N.; Jirigala, B.; Bao, Y.H.; Li, H. NDVI Indicates Long-Term Dynamics of Vegetation and Its Driving Forces from Climatic and Anthropogenic Factors in Mongolian Plateau. Remote Sens. 2021, 13, 688. [Google Scholar] [CrossRef]
  55. Guo, L.H.; Wu, S.H.; Zhao, D.S.; Yin, Y.H.; Leng, G.Y.; Zhang, Q.Y. NDVI-Based Vegetation Change in Inner Mongolia from 1982 to 2006 and Its Relationship to Climate at the Biome Scale. Adv. Meteorol. 2014, 2014, 12. [Google Scholar] [CrossRef]
  56. Fang, J.Y.; Piao, S.L.; Zhou, L.M.; He, J.S.; Wei, F.Y.; Myneni, R.B.; Tucker, C.J.; Tan, K. Precipitation patterns alter growth of temperate vegetation. Geophys. Res. Lett. 2005, 32, 5. [Google Scholar] [CrossRef] [Green Version]
  57. Zhang, B.; Zhang, T.F. Responses of reference crop evapotranspiration in Loess Plateau of Northwest China to climate change in 1961–2010 and estimation of future trend. Chin. J. Ecol. 2013, 38, 111–113. [Google Scholar]
  58. Stanhill, G.; Cohen, S. Global dimming: A review of the evidence for a widespread and significant reduction in global radiation with discussion of its probable causes and possible agricultural consequences. Agric. For. Meteorol. 2001, 107, 255–278. [Google Scholar] [CrossRef]
  59. Cohen, S.; Ianetz, A.; Stanhill, G. Evaporative climate changes at Bet Dagan, Israel, 1964–1998. Agric. For. Meteorol. 2002, 111, 83–91. [Google Scholar] [CrossRef]
  60. Ullah, M.K.; Habib, Z.; Saim, M. Spatial Distribution of Reference and Potential Evapotranspiration Across the Indus Basin Irrigation Systems; IEEE: Manhattan, NY, USA, 2001. [Google Scholar]
  61. Payero, J.O.; Tarkalson, D.D.; Irmak, S.; Davison, D.; Petersen, J.L. Effect of timing of a deficit-irrigation allocation on corn evapotranspiration, yield, water use efficiency and dry mass. Agric. Water Manag. 2009, 96, 1387–1397. [Google Scholar] [CrossRef] [Green Version]
Figure 1. Spatial distributions of the elevation (a), temperature (b), precipitation (c) and vegetation type (d) in Mongolia.
Remotesensing 14 01856 g001
Figure 2. Spatial trends of the annual average values of ET and natural factors in Mongolia from 2001 to 2020. Black dots indicate significant changes (p < 0.05). The inset histograms display the percentages of Pn (not significantly positive), Ps (significantly positive), Ns (significantly negative) and Nn (not significantly negative) values. Precipitation (a); soil moisture (b); temperature (c); Net solar radiation (d); NDVI (e); ET (f). The ET product of MOD16A2 only provides the evapotranspiration data of the vegetation-covered area; thus, there is a blank area in (f), the same as below.
Remotesensing 14 01856 g002aRemotesensing 14 01856 g002b
Figure 3. Difference in Pre and ET in different vegetation types from 2001 to 2020: (a) meadow steppe, (b) typical steppe, (c) alpine steppe, (d) desert steppe, (e) coniferous forest, and (f) all of Mongolia.
Remotesensing 14 01856 g003
Figure 4. Spatial distributions of the Hurst index and future NDVI trends in Mongolia during 2001–2020: (a) Hurst index and (b) future NDVI trends.
Remotesensing 14 01856 g004
Figure 5. Spatial distributions of the partial correlation coefficients between ET and three meteorological factors in all four seasons in Mongolia from 2001 to 2020: (ad) Pre, (eh) Tem, and (il) Nsr. The black dots show a significant correlation (p < 0.05). The inset histograms display the percentages of Pn (not significantly positive), Ps (significantly positive), Nn (significantly negative) and Ns (not significantly negative) values.
Remotesensing 14 01856 g005
Figure 6. Spatial distributions of the positive correlations of the main meteorological driving factors of ET in all four seasons in Mongolia from 2001 to 2020: (a) spring, (b) summer, (c) autumn, and (d) winter.
Remotesensing 14 01856 g006
Figure 7. Spatial distributions of the partial correlation coefficients between climate factors and ET in the growing season from 2001 to 2020: (a,b) Pre, (c,d) Tem, (e,f) Nsr, (g,h) Swl, and (i,j) NDVI. The percentages of Ns (significant negative correlation), Nn (nonsignificant negative correlation), Pn (nonsignificant positive correlation), and Ps (significant negative correlation) values are shown.
Remotesensing 14 01856 g007aRemotesensing 14 01856 g007b
Figure 8. Spatial distributions of the dominant climate factors in the growing season from 2001 to 2020: (a) dominant factors positively correlated with ET; (b) dominant factors negatively correlated with ET.
Remotesensing 14 01856 g008
Figure 9. (a,b) Results of the factor detector and interaction detector between climate factors, human factors and average ET in Mongolia from 2001 to 2020; (c,d) results of the factor detector and interaction detector between climate factors and human factors and average ET in the growing season of Mongolia from 2001 to 2020.
Remotesensing 14 01856 g009
Figure 10. Abrupt breakpoints in BFAST-detected shifts in the 8-day ET for 2001–2020 at the boundary of Mongolia and for the different vegetation types in Mongolia: (a) boundary of Mongolia, (b) meadow steppe, (c) typical steppe, (d) alpine steppe, (e) desert steppe, and (f) coniferous forest.
Remotesensing 14 01856 g010
Figure 11. Spatial distribution and trend of the 8-day ET before and after different mutation points: (a,b) 2001 to 2006; (c,d) 2006 to 2007; (e,f) 2007 to 2015; (g,h) 2015 to 2016; (i,j) 2016 to 2020.
Remotesensing 14 01856 g011
Figure 12. Abrupt breakpoints in BFAST-detected shifts in the 8-day ET for 2001–2020 at the boundary of Mongolia and for the different vegetation types of Mongolia: (a) ET in the growing season; (b) NDVI in the growing season; (c) 20-year average Pre and Tem; (d) 20-year average NDVI and NDVI in the growing season.
Remotesensing 14 01856 g012
Table 1. List of data sources used in this study.
NameTime ScaleSpatial ScaleData Sources
MOD16A2 (ET)
MOD13A1 (NDVI)
2001–2020500 mAρρEEARS
https://lpdaacsvc.cr.usgs.gov/appeears/
European Space Agency (ESA)
(accessed on 3 September 2021)
DEM200930 mASTER-GDEM V1
https://www.gscloud.cn
(accessed on 3 September 2021)
CCI-LC climate products (CCI)2015300 m(ESA) Climate Change Initiative (CCI)
http://www.esa.int/
(accessed on 3 September 2021)
Skin temperature (Tem)
Surface net solar radiation (Nsr)
Total precipitation (Pre)
Volumetric soil water layer 1 (Swl)
2001–20200.1° × 0.1°ERA5-Land monthly averaged data
https://cds.climate.copernicus.eu/
(accessed on 3 September 2021)
Number of livestock
Human population (POP)
Gross domestic product (GDP)
2001–2020-Mongolian Statistical Information Service
http://www.1212.mn/
(accessed on 3 September 2021)
Publisher’s Note: MDPI stays neutral with regard to jurisdictional claims in published maps and institutional affiliations.

