Abstract
As satellite observation technology develops and the number of Earth observation (EO) satellites increases, satellite observations have become essential to developments in the understanding of the Earth and its environment. However, the current impacts to the remote sensing community of different EO satellite data and possible future trends of EO satellite data applications have not been systematically examined. In this paper, we review the impacts of and future trends in the use of EO satellite data based on an analysis of data from 15 EO satellites whose data are widely used. Articles that reference EO satellite missions included in the Web of Science core collection for 2020 were analyzed using scientometric analysis and meta-analysis. We found the following: (1) the number of publications and citations referencing EO satellites is increasing exponentially; however, the number of articles referencing AVHRR, SPOT, and TerraSAR is tending to decrease; (2) papers related to EO satellites are concentrated in a small number of journals: 43.79% of the articles that were reviewed were published in only 13 journals; and (3) remote sensing impact factor (RSIF), a new impact index, was constructed to measure the impacts of EO satellites and to predict future trends in applications of their data. Landsat, Sentinel, MODIS, Gaofen, and WorldView were found to be the most significant current EO satellite missions and MODIS data to have the widest range of applications. Over the next five years (2021–2025), it is expected that Sentinel will become the satellite mission with the greatest influence.
1. Introduction
Sustainable development and climate change are problems demanding prompt solutions, and solutions to both are essential to the present and future well-being of humanity [1,2,3]. Through the promotion of its Sustainable Development Agenda and the United Nations Framework Convention on Climate Change (UNFCCC), the United Nations aims to seek a sustainable development model for this generation and future generations and to achieve shared prosperity for people and the planet [2,3]. The 2030 Agenda for Sustainable Development includes 169 aspirational targets and 232 global indicators for annual follow-up and review. EO can provide direct measurements or indirect support for 71 (42%) of these targets and 30 (13%) of the indicators [4,5]. At present, a significant gap remains before the Sustainable Development Goals (SDGs) can be achieved completely [3,6]; Earth observation technology is a very effective and indispensable tool that can be used toward fulfilling the SDGs [4,7,8,9,10,11,12].
EO provides an effective way of exploring the physical, chemical, and biological information related to the Earth and of supporting the sustainable development of modern human civilization and the global environment by monitoring and assessing natural and artificial environmental conditions and changes [7,13,14]. EO satellites monitor the Earth’s land, ocean, atmosphere, cryosphere, and carbon cycle from space in real-time and constantly transmit that information to the ground. The emerge of EO was promoted by the invention of the photography, and the first recorded EO image was captured by Nadar from a balloon in 1858. After that, various vehicles were used for EO such as kites and pigeons. The idea of using orbiting spacecraft to make observations of the ground was first explored by Herman Potočnik in his 1928 book, The Problem of Space Travel. Vanguard 2, designed by the United States Naval Research Laboratory, is the first satellite designed specifically for Earth observation to measure cloud cover distribution. Since then, many important EO satellites and sensors including Landsat, Advanced Very High-Resolution Radiometer (AVHRR), Moderate-resolution Imaging Spectroradiometer (MODIS), and Sentinel have been launched [15]. According to the database of the Committee on Earth Observation Satellites (CEOS), in October 2020, 327 EO satellite missions and 845 instruments were either currently operating or were planned for launch in the next 15 years—this database, however, is incomplete (CEOS has around 30 national space agencies as members).
After more than 60 years of development, EO satellites have flourished. The significant advances in the spatial, spectral, and temporal resolution of remote sensing data brought about by improvements in remote sensing technology have dramatically changed how we observe the Earth [15]. Multi-spectral and hyper-spectral technologies, microwave radiometer, spaceborne radar, and synthetic aperture radar (SAR) as well as lasers on EO satellites now satisfy the needs of many types of research [16,17,18]. Additionally, as the costs of instruments and launching satellites have fallen, EO data have become more widely available. In addition to large multi-sensor platforms, the number of small satellites and unmanned aerial vehicles (UAVs) has exploded [18,19]. Thus, in many ways, EO is positively affecting our lives.
The information obtained by EO satellites is widely used in various research fields, especially in relation to the environment, where the measurements made by EO satellites are indispensable [19]. EO also currently plays an important role in the fields of education [20,21,22], forestry [10,23,24], ecosystem services [13,25,26,27,28], agriculture [29,30], geology [31,32], and disease and public health [33,34,35,36,37,38] as well as in the monitoring of land degradation [39], ocean [40], biomass and carbon [11,41], coastal areas [42], urban areas [43,44], natural disasters [45,46,47], land use and land cover [15,48,49], cold regions [50,51,52], the atmosphere [53], biodiversity [54], and water resources [55,56]. The development of EO satellites in the past 60 years has also led to advances in our understanding of Earth-system processes, and the information derived from satellite observations has become the best basis for responding to changes in human society and the natural environment [18].
However, more support and initiatives are needed to promote open access to remote sensing data, which is significant for the achievement of the SDGs [4]. There are still challenges related to the storage, processing, dissemination, and analysis of EO big data as well as in relation to the uncertainties in the data and the fusion of data from multiple sensors [57,58,59,60,61]. In this review, the progress of major EO satellite remote sensing applications are tracked and the main user countries, research areas, journals, and changes are tracked over the period of operation of individual satellites, which demonstrate the current impacts to the remote sensing community of different EO satellite data. Then, a new impact index, called remote sensing impact factor (RSIF), was constructed to measure the current impacts of EO satellites and to predict future trends in applications of their data. This comprehensive evaluation will help with the exploration of the full potential of EO data in monitoring, assessing, and modeling our world and contribute to the construction of a sustainable and prosperous human society and planet.
2. Materials and Methods
2.1. Data Collection and Processing
We selected articles relevant to widely used satellites and sensors as the basis of this research. Considering the prevalence, the amount of data accumulated and the diversity of sources, the satellites, and sensors included Advanced Land Observing Satellite (ALOS), the AVHRR, Cartosat, Constellation of Small Satellites for Mediterranean basin Observation (COSMO-SkyMed), Fengyun (FY), Gaofen (GF), Indian Remote Sensing Satellites (IRS), Landsat, MODIS, Radarsat, Sentinel, Systeme Probatoire d’Observation de la Terre (SPOT), TerraSAR, WorldView, and Ziyuan (ZY)/CBERS. We selected relevant articles and review articles from the Web of Science (WoS) [62] Core Collection including from the Science Citation Index Expanded (SCIE) and Social Sciences Citation Index (SSCI). The filter criterion used was “Topic = satellite/sensor name (e.g., Landsat, AVHRR, Sentinel), Document Types = Articles or Review Articles; Publication Years until 2020”. To ensure that the selection was as accurate and comprehensive as possible, we selected articles with the topic in the title, abstract, or keywords.
2.2. Scientometric Analysis
CiteSpace is a powerful scientometric analysis software that can analyze document co-citations, keyword co-occurrences, and cooperative maps [63]. In this study, we conducted a co-citation analysis, keyword co-occurrence analysis, and collaborative mapping analysis using CiteSpace [63] and used these to explore the knowledge base, subject structure, and research focus of articles related to research based on EO satellite data and to analyze the cooperative relationships between authors. The results of this analysis provided a basis for evaluating the current impacts of the application of EO satellite data as well as future trends. The results will also promote the exploration of the potential of EO data.
2.3. Remote Sensing Impact Factor (RSIF)
We constructed an impact index (1) to measure the contribution of each satellite data to the remote sensing community and to predict the possible future development of related trends. The indicators selected included the number of articles, user countries, and research areas. These three indicators provide a representation of the development and potential of satellites. The equation used to calculate the index was
where a, b and c are the number of articles, user countries, and research areas where EO data are applied, respectively.
3. Results
3.1. Statistical Characteristics
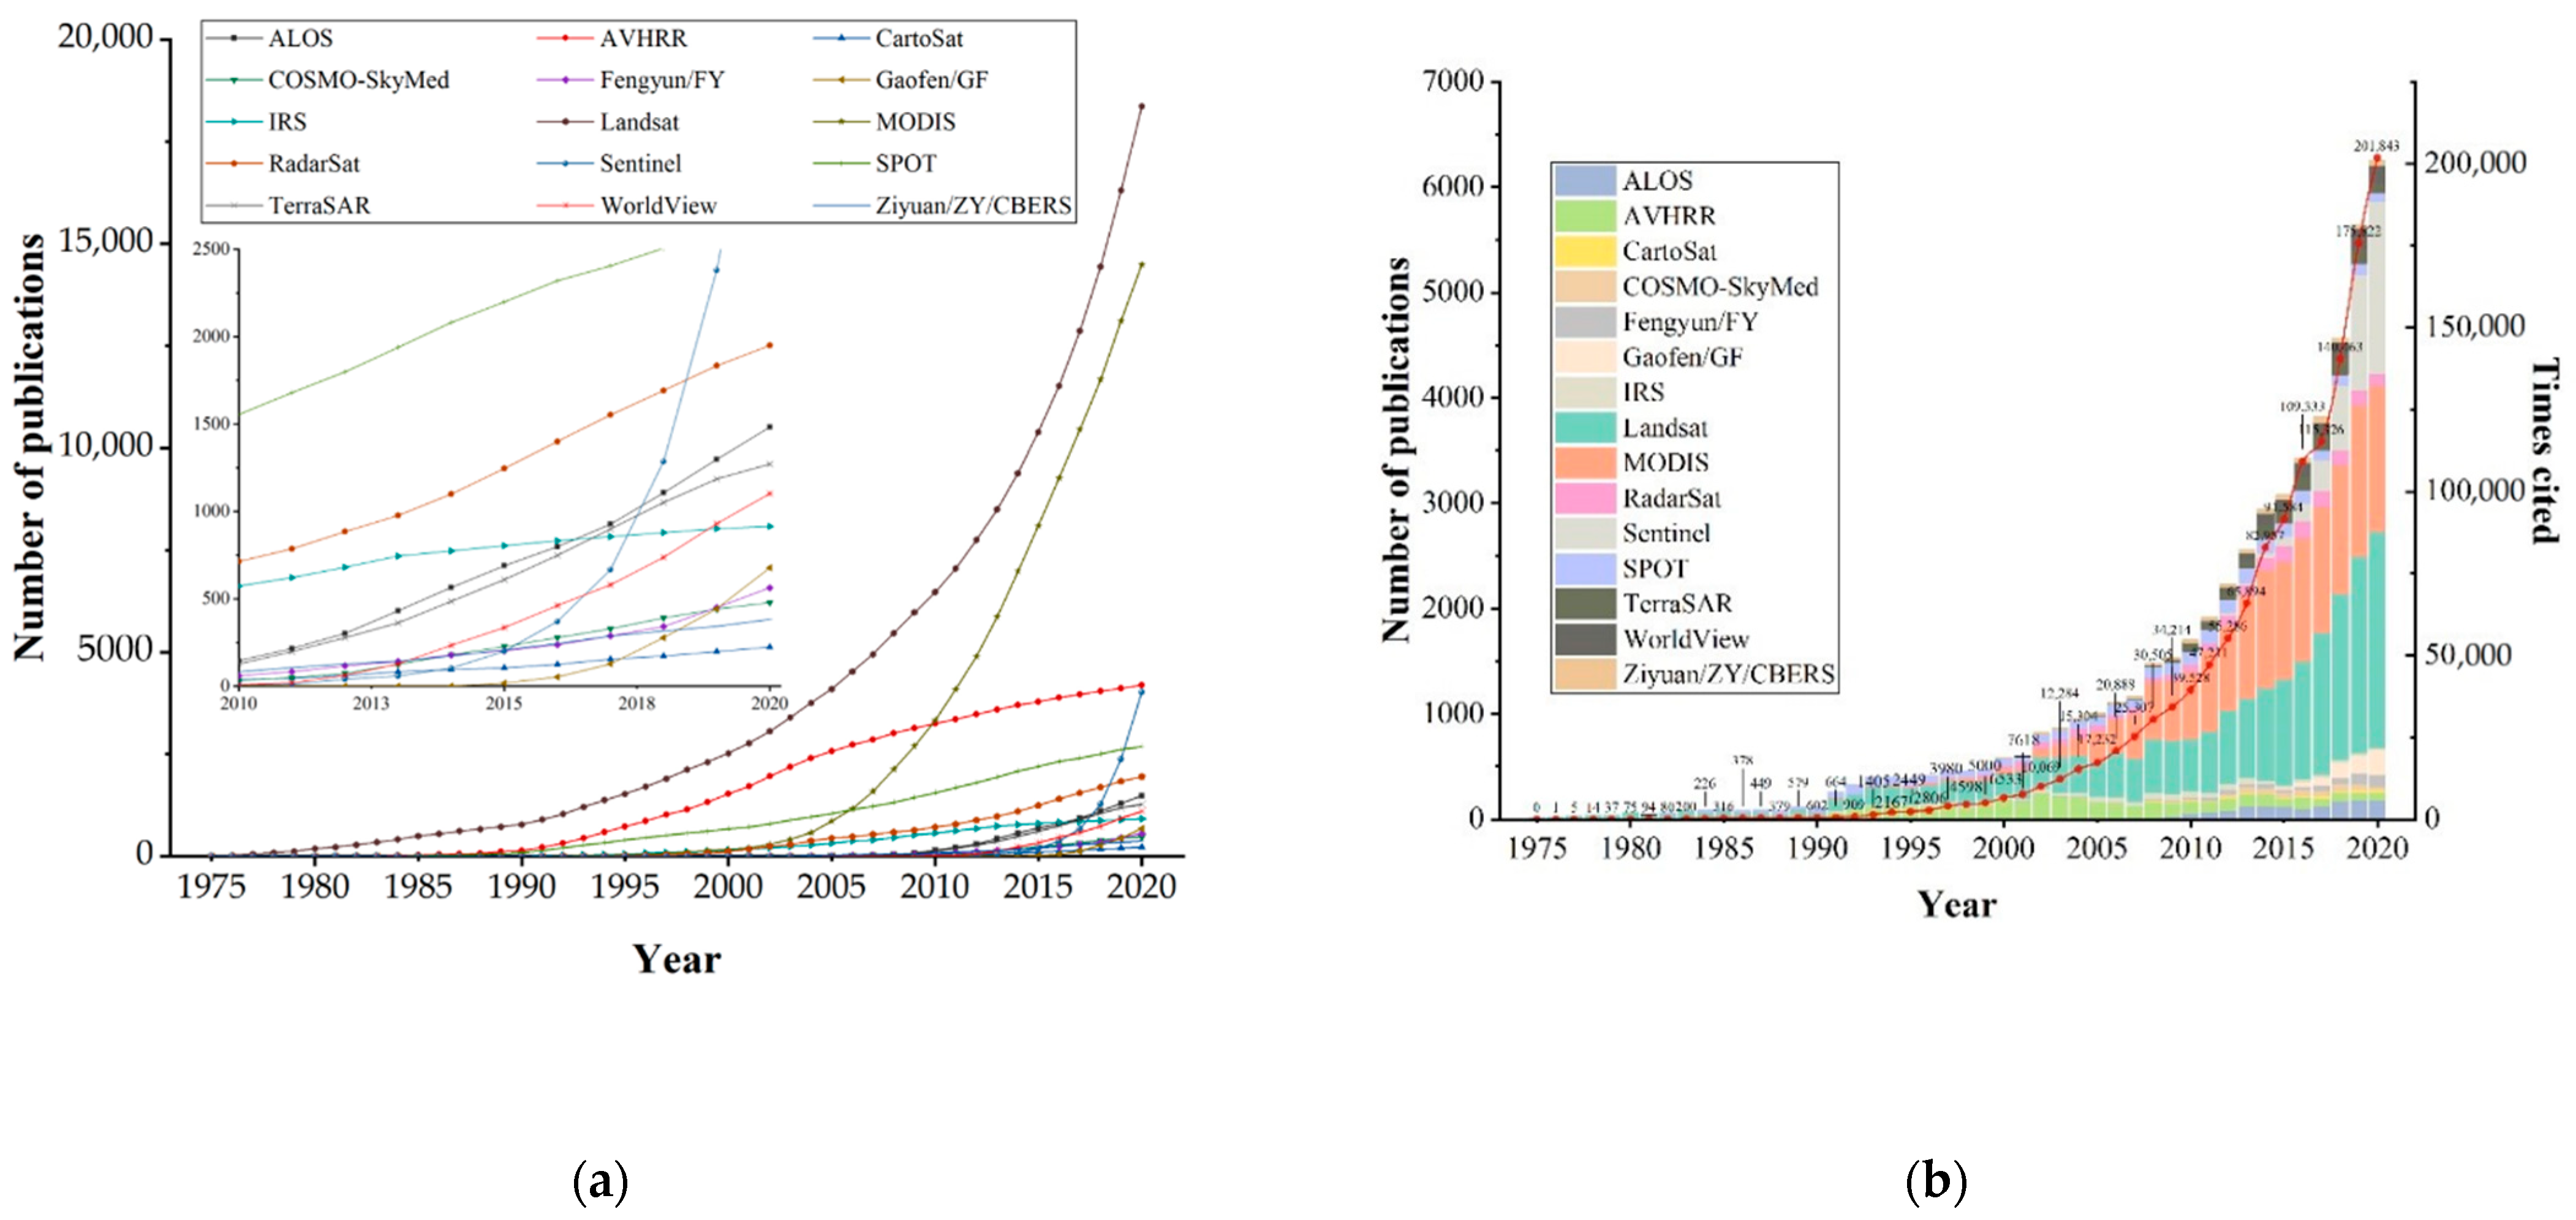
As shown in Figure 1, the number of publications and citations relevant to EO satellites have both been increasing exponentially, which demonstrates that the application of EO satellites is becoming more and more widespread. As EO technology develops rapidly, the data supplied have ever higher resolutions, and the quantity of data is also increasing exponentially [64,65,66]. The use of EO data has gradually been introduced into many different applications [12]. However, the number of papers related to some particular satellites and sensors has decreased in recent years. For example, the number of documents related to AVHRR, SPOT, and TerraSAR currently show a significant decreasing trend. The main reason for this is that the overall upgrading of satellites and sensors and advances in EO technology have led to other types of more advanced satellite data becoming available. It is noted that long time-series EO satellite data are still valuable for the remote sensing community. Consistent and effective long-term observations are needed to promote the value of EO satellite data, which is why satellite missions launch new satellites continually. For example, Landsat 9 was successfully launched on 27 September 2021, which is expected to observe Earth for five years and continue the Landsat missions until 2026.
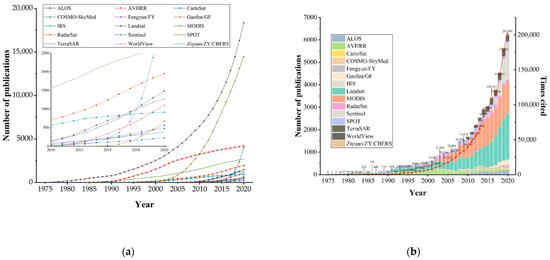
Figure 1.
Number of (a) publications and (b) publications (bar) and citations (line) related to Earth observation satellites (the graphic inside is a zoom of dense area).
It is also clear that the application of EO data is highly concentrated on data from a small number of satellites and sensors: there have been far more applications of Landsat and MODIS data than of data from other satellites or sensors. The number of publications (citations) of Landsat and MODIS accounts for 40.2% (45.7%) and 31.7% (39.7%) of the total and both of these have continued to increase rapidly. Landsat provides the longest global record of EO data with a medium spatial resolution [49]. Since open access to Landsat data became available in 2008, these data have supported many studies, especially in the field of land use–land cover change detection [67,68,69,70]. MODIS has seven bands that have greatly improved spectral, spatial, geometric, and radiometric attributes and are explicitly designed for land applications; these data thus provide significant new opportunities for research in the field of global land use–land cover mapping and to replace the use of AVHRR data [71]. Another important reason why Landsat and MODIS data are widely used is that a large amount of analysis ready data (ARD) or standard data products are prepared such as surface reflectance (SR), top of atmosphere (TOA), quality assessment (QA) bands of Landsat, gross primary productivity (GPP), net primary productivity (NPP), and vegetation index products (NDVI and EVI) of MODIS [72,73]. These global data are widely used to explore global change, and are being used by scientists from a variety of disciplines (e.g., oceanography, biology, and atmospheric science) [74,75,76].
The satellite that seems to show the most promise is Sentinel, for which the rate of increase in the number of related applications has been the fastest. Sentinel-1A was launched in 2014 and was the first in its series; a further seven satellites were launched over the next few years. However, as of 2020, the total number of Sentinel (4016) papers was still less than the total numbers of Landsat (18,366), MODIS (14,355), and AVHRR (4186) papers. For papers published in 2020, the number of Sentinel papers (1635) was still less than the number of Landsat papers (2059), but far more than the number of MODIS (1384) AVHRR papers (73). Sentinel is a series of next-generation EO missions developed by the European Space Agency (ESA) and aims to replace the older EO missions to ensure a continuity of data. The Sentinel missions are focused on a range of aspects of EO (i.e., the atmosphere, the oceans, and land monitoring). Each mission is based on a constellation of two satellites to shorten the revisit cycle and expand coverage. Sentinel missions have considerable advantages over older EO missions (such as the European Remote Sensing Satellite (ERS) and Envisat missions) due to the short revisit cycle and relatively high spatial resolution of the data [77]. Sentinel-2 is considered to be the most suitable current satellite mission for vegetation monitoring, and the fusion of Sentinel-1 and 2 data has great potential for the management of natural disasters [78].
3.2. Analysis of the Distribution of Articles among Journals and Research Areas
We found a total of 45,673 publications referencing EO satellite data that had been published in 1895 journals (Table S1). However, as shown in Table 1, more than half of all journals (1239) have published no more than five articles that reference the use of satellite data, and 678 journals have published only one paper. Only 13 journals were found to have published more than 500 articles referencing EO satellites; a total of 19,999 articles have been published in these journals and account for 43.79% of the total. Only 67 journals have published more than 100 papers. In terms of the number of published papers, the top 10 journals were found to be Remote Sensing (4627), the International Journal of Remote Sensing (4038), Remote Sensing of Environment (3443), IEEE Transactions on Geoscience and Remote Sensing (1491), the Journal of Geophysical Research: Atmospheres (953), IEEE Journal of Selected Topics in Applied Earth Observations and Remote Sensing (920), the International Journal of Applied Earth Observation and Geoinformation (853), Photogrammetric Engineering and Remote Sensing (808), the ISPRS Journal of Photogrammetry and Remote Sensing (636), and the Journal of Applied Remote Sensing (636). Most of these journals serve one or more parts of the remote sensing and EO community. Some publish documents, reports, codes, and informational articles on photogrammetry, spatial information systems, computer vision, imaging sciences, etc.

Table 1.
Classification of journals by the number of articles referencing EO satellites.
Among the journals involved in different EO satellites, similar journals have published a large number of articles (most of these journals have published a small number of articles referencing EO satellite data). Some journals have become the focus for articles referencing EO satellite data, these include Remote Sensing, the International Journal of Remote Sensing, and Remote Sensing of Environment. These journals have published high-quality papers that promote the application of EO satellite data, thus improving the understanding of the application of EO satellite data to Earth system science and sustainable development (Table S1).
As shown in Table S1, the United States is the most important host country for the top 13 journals referencing EO satellite data. This means that the United States provides a significant support for remote sensing applications and thus for promoting an understanding of the Earth and its environment. From the percentages of articles referencing EO satellite data, it can be seen that EO satellites have gradually become an essential foundation of the research carried out by the remote sensing and Earth science communities, and Remote Sensing, the International Journal of Remote Sensing, and Remote Sensing of Environment significantly contribute to the application of EO satellite data.
The main research disciplines to which the papers referencing EO satellites were related were obtained from the WoS website (Table S2). The WoS schema comprises 252 subjects such as science, social sciences, and arts and humanities. The most significant research areas included remote sensing (20,998), imaging science photographic technology (18,066), environmental sciences ecology (17,408), and geology (12,290) for each of which there were more than 10,000 publications.
3.3. RSIF for Different Satellites
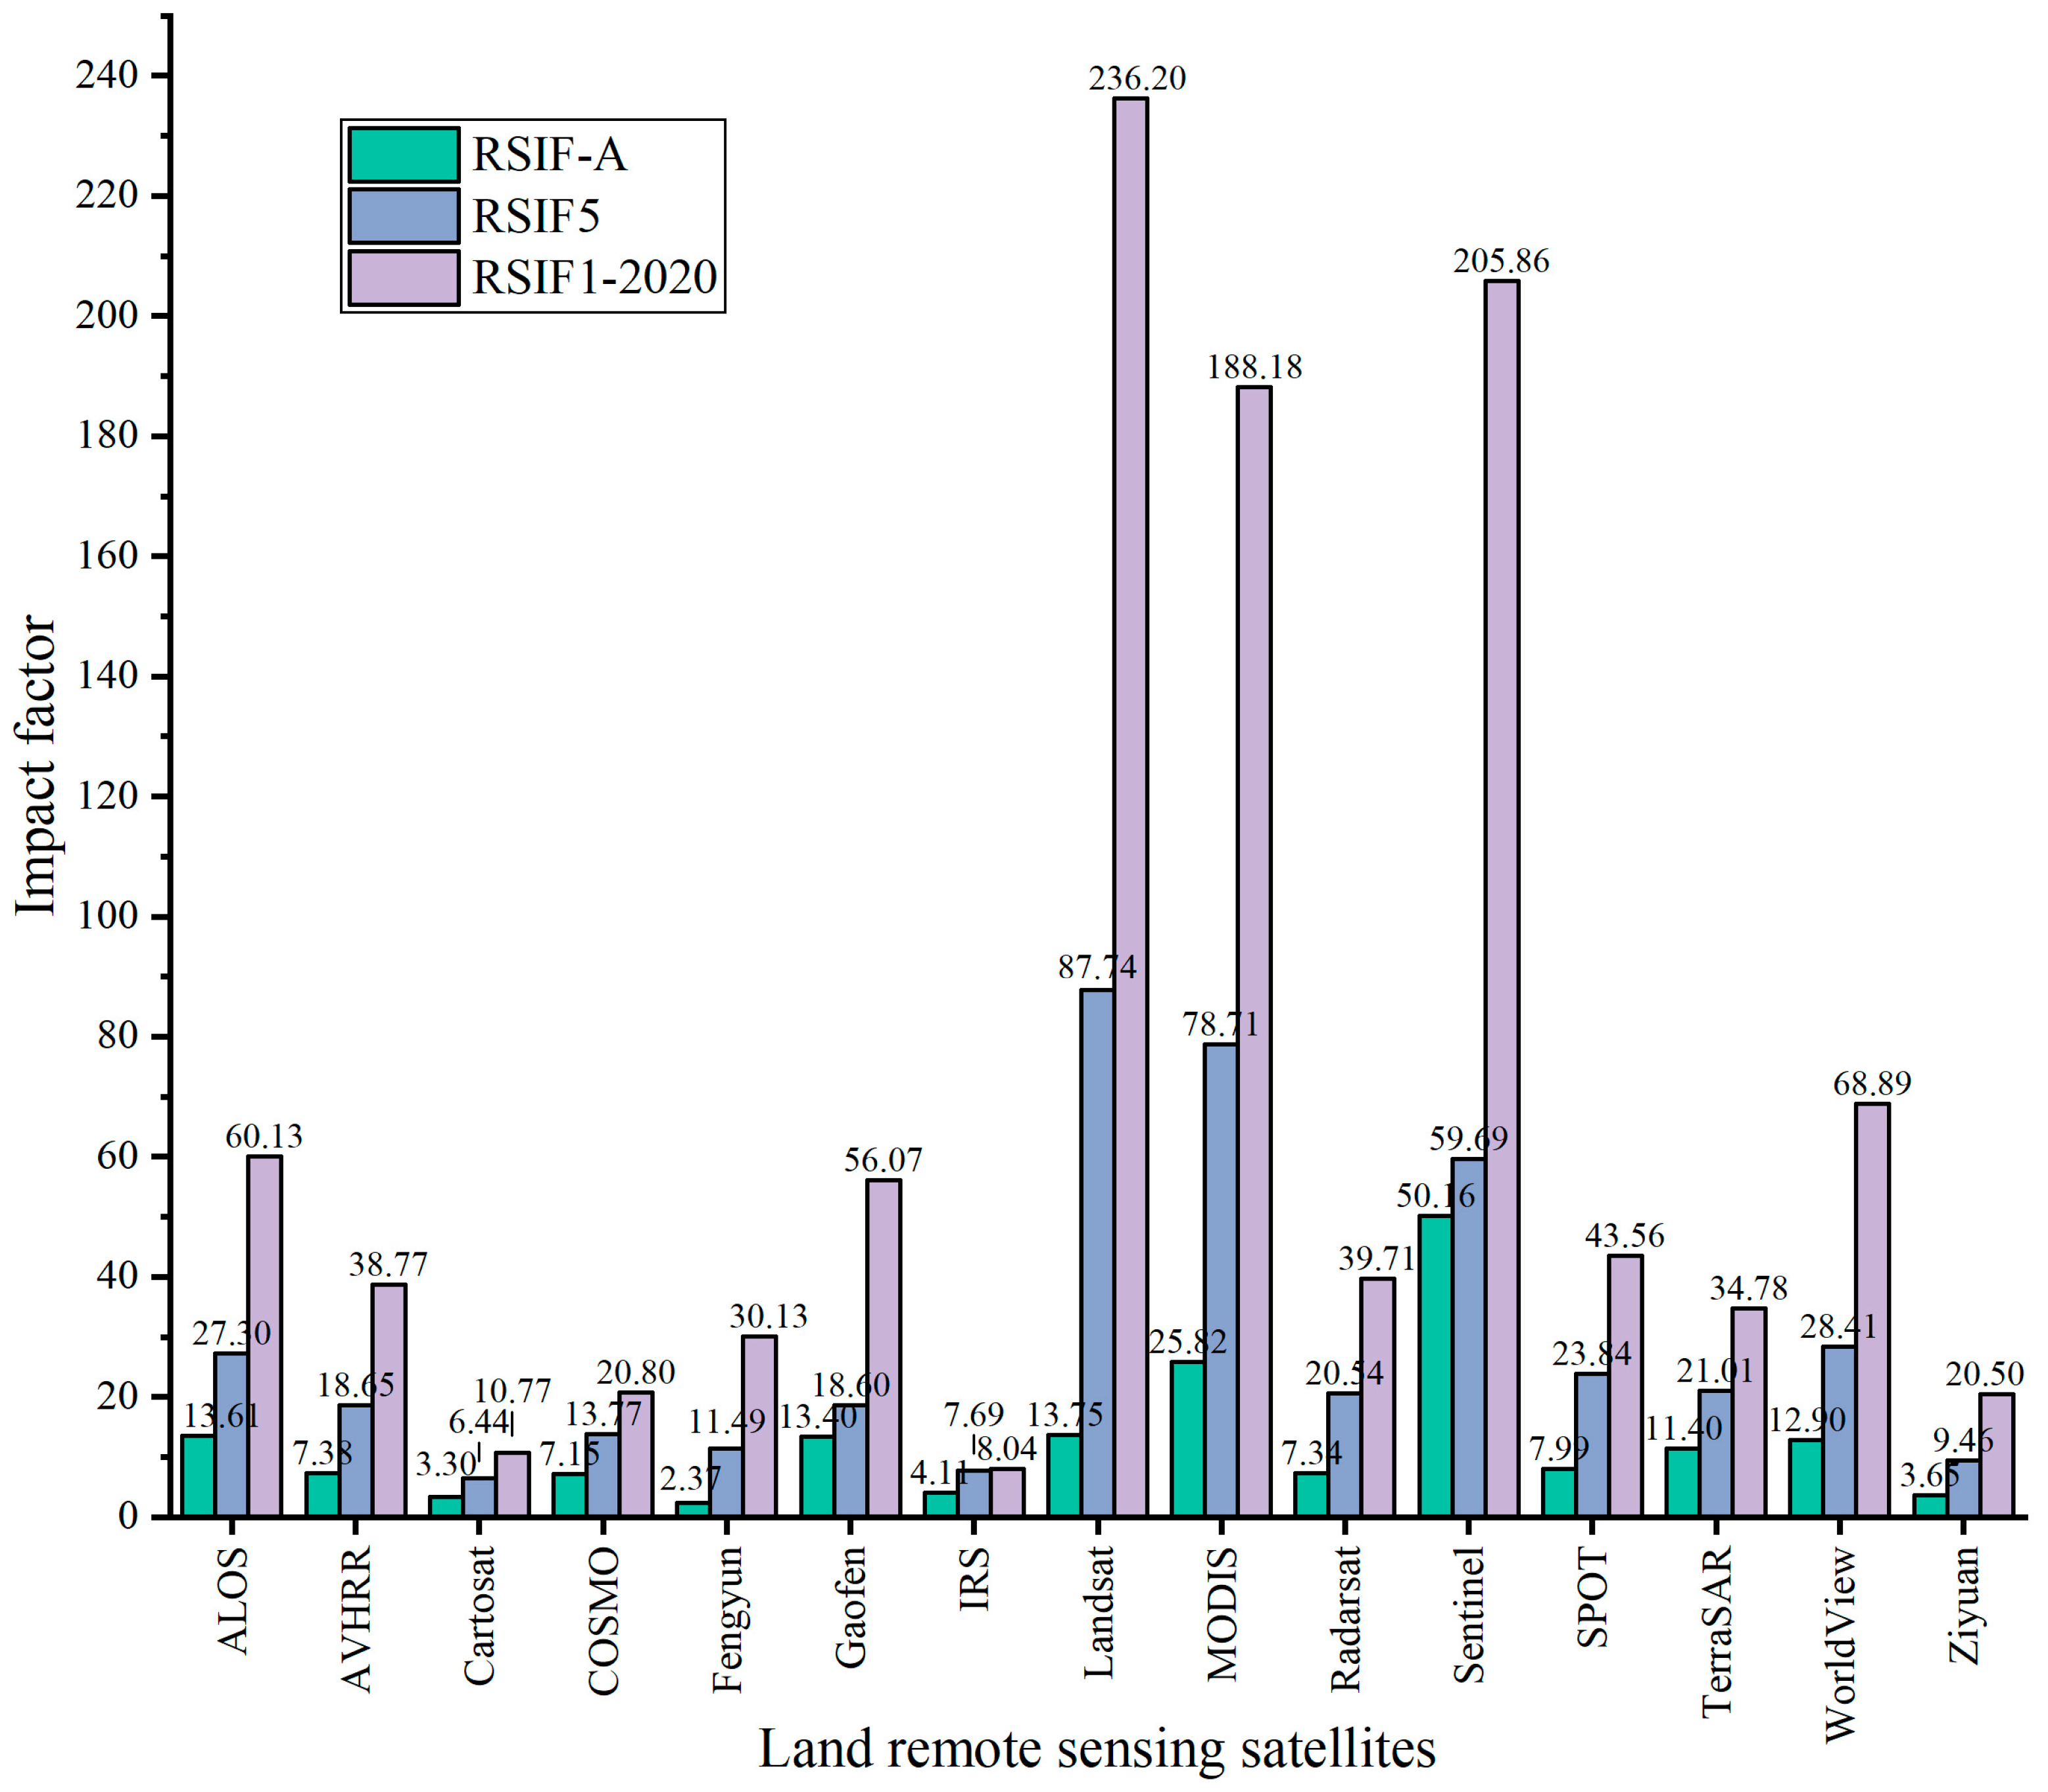
The index that we created to assess the impact of the application of satellite data on scientific research and daily life and to predict possible future developments in the use of satellite data was called the RSIF. A series of indexes were derived from the formula given in Section 2.3: RSIF-A represents the satellite’s average RSIF from the time of its launch until 2020, RSIF5 represents the average RSIF over the five-year period 2016–2020, and RSIF1-2020 represents the RSIF for 2020. These three indices provide overviews of the impact of satellite data applications in different periods.
As shown in Figure 2, Landsat, MODIS and Sentinel have the highest impact factors among all the satellites that were considered. In terms of RSIF-A, Sentinel (50.16) > MODIS (25.82) > Landsat (13.75). The exploration of Landsat and MODIS data is still continuing, and the number of applications and countries that reference these data is still increasing. Although Sentinel was launched later than both Landsat and MODIS, Sentinel has a higher RSIF-A than both of these satellites, which indicates that there is still greater potential for the use of Sentinel data. In terms of RSIF5, Landsat (87.74) > MODIS (78.71) > Sentinel (59.69). For nearly 50 years, Landsat data have been indispensable in EO and remain essential to historical analyses and future predictions. The advantages of MODIS data include their wide spectral range and that most areas of the Earth are observed four times a day. MODIS data are traditionally used in global land monitoring and conservation studies [78]. In terms of RSIF1-2020, Landsat (236.20) > Sentinel (205.86) > MODIS (188.18), which means that, according to this measure and in contrast to RSIF5, the impact of Sentinel is greater than the impact of MODIS. Sentinel is undoubtedly the remote sensing data source with the most potential. However, Sentinel is a new satellite and the EO data provided by Sentinel missions will take time to accumulate.
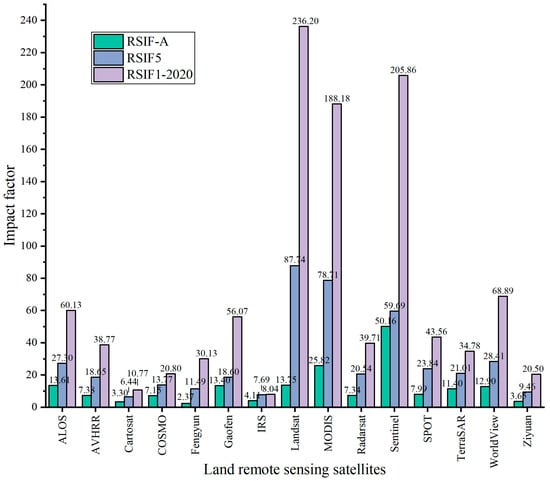
Figure 2.
Derived RSIFs for Earth observation satellites.
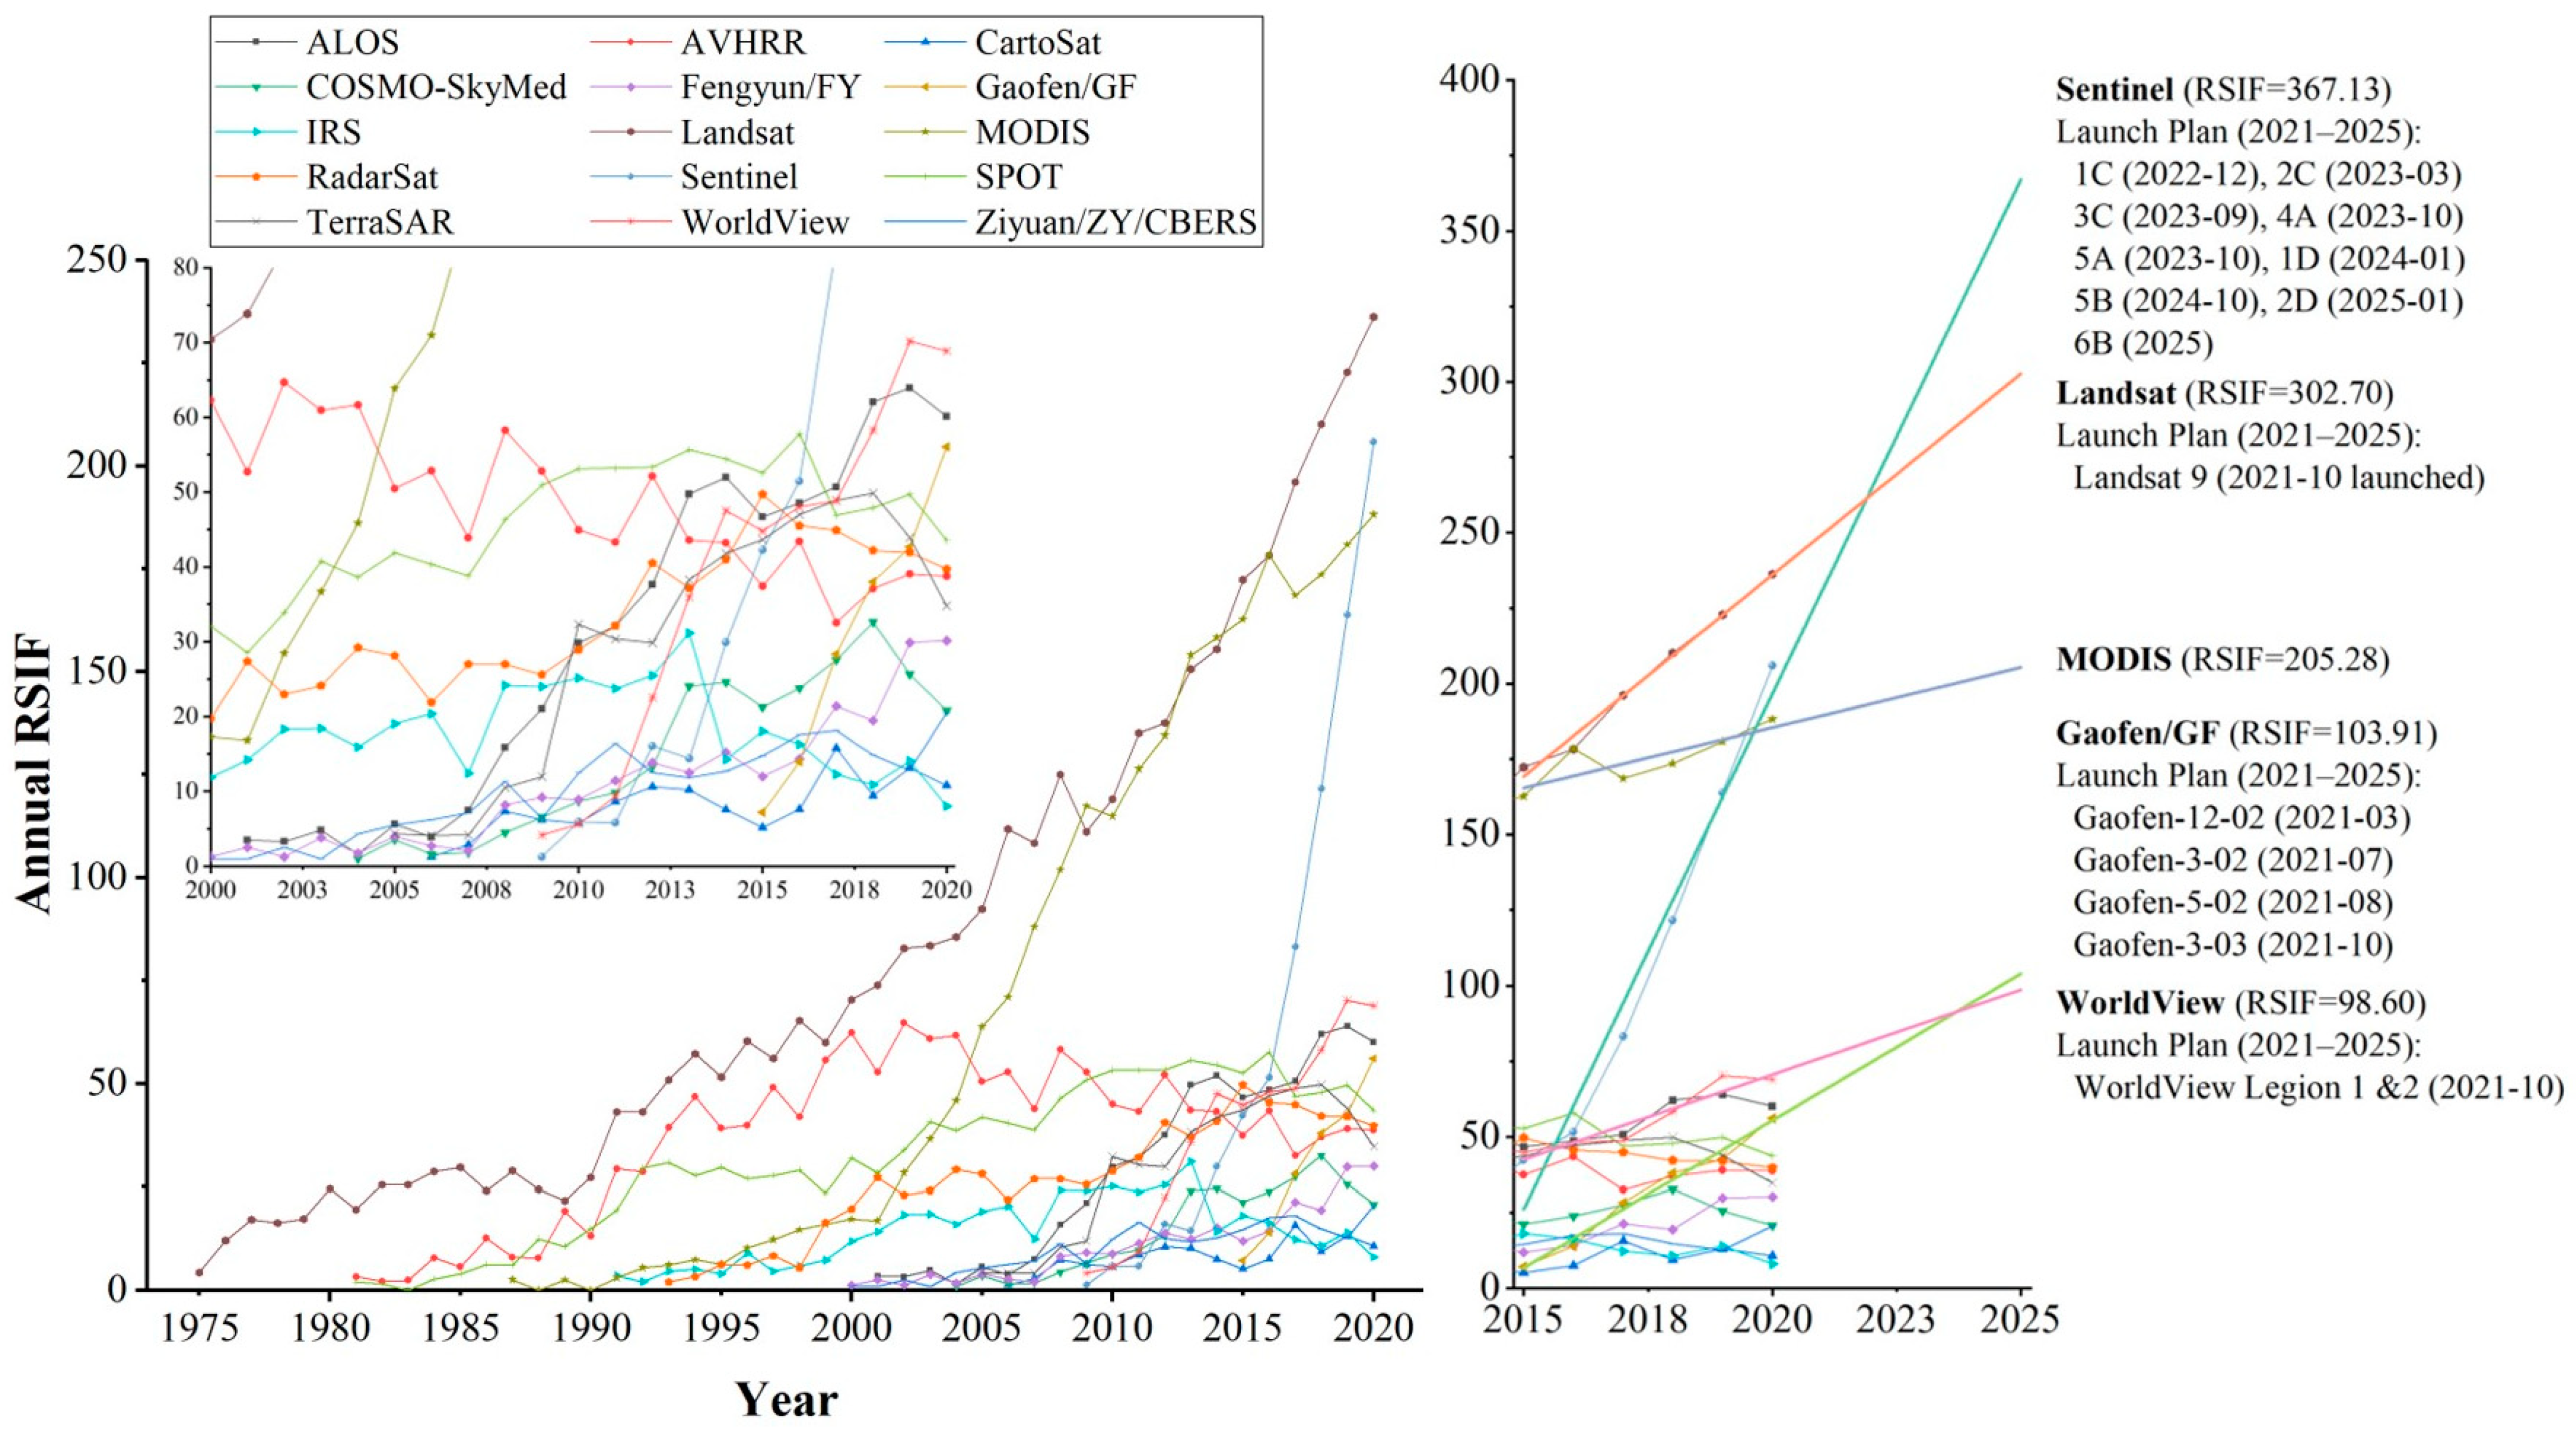
We also calculated the annual RSIF to explore the developments and future trends related to the use of data from different EO satellites. The annual RSIF can help with understanding the scope of the applications of different types of satellite data and their future potential uses from a more comprehensive perspective. As shown in Figure 3, Sentinel had a higher annual RSIF than MODIS in 2020. This indicates that Sentinel is preferred to MODIS in several research areas and in some user countries. In 2020, the number of Sentinel publications exceeded the number of publications related to MODIS. Sentinel is a series of missions that make comprehensive observations of the Earth including observations of the atmosphere, oceans, and land. Sentinel-1 is a radar imaging mission used for land and ocean services, Sentinel-2 is a multi-spectral high-resolution land-monitoring mission, and Sentinel-3 is a multi-instrument mission that supports ocean forecasting systems as well as environmental and climate monitoring. In addition, the increasing trend in annual RSIF for recently launched satellites such as Gaofen and WorldView is significant. These new satellites carry more advanced instruments and provide robust EO datasets that have a wide range of applications.
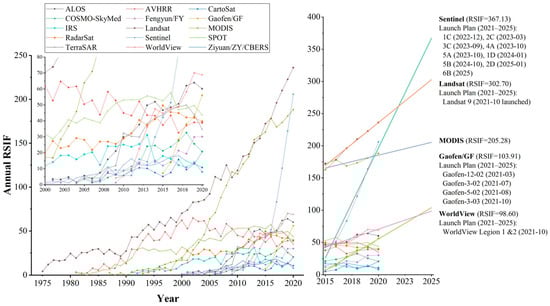
Figure 3.
Annual RSIF for Earth observation satellites (the graphic inside is a zoom of dense area, and the right figure is the result based on the linear extrapolation).
We made estimates of the trends in RSIF over the next five years (2021–2025) based on the most recent five-year period (2016–2020) to explore some possible future developments in the use of EO satellite data. We predict that the satellites with the five highest RSIF values in the next five years will be Sentinel, Landsat, MODIS, Gaofen, and WorldView. Although the Gaofen and WorldView data are not yet open access, their predicted RSIF is higher than most of the satellites discussed such as ALOS and AVHRR. With the exception of MODIS, these five satellite missions have launch plans that will ensure instrument iteration and the continuous provision of EO data over this period. The Sentinel and Gaofen satellite missions will have the most launches, and Sentinel data will become the most widely used EO satellite data. Data from the Chinese Gaofen missions are projected be widely applied. The RSIF value for Gaofen clearly stands out above the values for the other Chinese satellites, but there is a considerable gap compared to Sentinel, Landsat, and MODIS. Therefore, in the rest of this review, the similarities and differences between the application of Sentinel, Landsat, MODIS, Gaofen, and WorldView data, as described in the literature, will be discussed. The development of these excellent satellite missions will assist in the development of remote sensing applications and the findings of this article will promote the development of EO satellites.
3.4. Knowledge Base Analysis
We analyzed articles referencing all EO satellites (45,674) as well as the Sentinel (4016), Landsat (18,366), MODIS (14,494), Gaofen (678), and WorldView (1103) satellites using the CiteSpace bibliometric software [63]. Based on a co-citation analysis of the cited papers, we explored the knowledge base constituted by the published documents that referenced EO satellite data (Table S4).
Table 2 lists the top 10 application clusters found for the application of data from all EO satellites and for Sentinel, Landsat, MODIS, Gaofen, and WorldView. This list consists of clusters that indicate the knowledge base of the application of EO satellite data. The clusters for all EO satellites suggest that EO satellite data have been widely used in Earth science including in studies of the land (land-cover change and land surface temperature), the atmosphere (evapotranspiration, aerosols, and AOD (aerosol optical depth)), water (Great Lakes), phenology, and biomass (biomass burning). It can also be seen that, currently, Landsat can be considered the most important EO satellite and the random forest (RF) algorithm the most important image processing algorithm. In terms of clusters related to articles that reference Sentinel, the leaf area index, deforestation, flood mapping, soil moisture, and water quality are the main applications. There have also been many studies on the processing of Sentinel images using techniques such as deep learning, RF, and image fusion. In the Landsat clusters, the main applications are spectral mixture analysis, habitat, savanna, landscape ecology, climate change, PM 2.5, and land surface temperature. The emergence of Google Earth Engine (GEE) has provided a convenient way of downloading and processing EO data. Sentinel-2 can act as a replacement for Landsat to a certain extent and has a better spatial resolution. From the clusters formed by articles that reference MODIS, it can be seen that MODIS data have mainly been used in studies related to phenology, aerosols, land surface temperature, aerosol optical depth (AOD), evapotranspiration, the leaf area index, and biomass burning. The clusters for all EO satellites and MODIS are similar, which indicates that the applications of MODIS data are widespread. The MODIS instruments provide images with a high radiometric (12-bit) resolution in 36 spectral bands (0.4–14.4 μm); these offer unprecedented Earth-observation capabilities for a vast and diverse community of users worldwide. Currently, there are few articles related to the Gaofen mission, and only six clusters are listed in the table. These clusters are primarily associated with image processing methods. The clusters of references to WorldView are mainly associated with bathymetry, indigenous forests, and urban areas. The clusters of articles referencing WorldView data are more concerned with the processing of EO data than its application and include references to object-based image analysis (OBIA), pan-sharpening, deep learning, and linear discriminant analysis.
Table 2.
Top 10 clusters in the Earth observation satellite co-citation network.
Comparing the clusters for the five individual EO missions that were analyzed separately, MODIS is currently the EO mission that provides EO data for the widest range of EO applications. This is due to the width of and particular wavelengths covered by the MODIS spectrum. The CEOS has concluded that MODIS data have the potential to be applied in 16 different measurement categories including categories related to the land, oceans, atmosphere, and ice and snow. Landsat data are at a disadvantage compared to MODIS in relation to these categories. Although the remaining four satellite missions have more comprehensive launch plans for different EO applications, these have not yet been fully completed. For example, the Sentinel missions are designed for a wide range of EO applications, but various Sentinel missions are currently underway (Sentinel-4, -5, and -6): Sentinel-4 and -5 are dedicated to air quality monitoring and Sentinel-6 is dedicated to the sea-surface height measurement. The Gaofen and WorldView clusters are more relevant to image processing methods and algorithms, which indicates that the application of data acquired by these two satellites is still in its infancy. Both WorldView and Gaofen are (ultra) high-resolution commercial imaging satellites and carry advanced remote sensing instruments. WorldView was launched earlier than Gaofen and is more widely used. WorldView is considered the highest-resolution and most stable commercial imaging satellite; it also has a short revisit period (about one day). Gaofen is a high-resolution EO system that was developed by China as a priority; frequent launches of satellites in this series have taken place in recent years (Table S3). However, Gaofen EO data are not open-access. The users of Gaofen data are mainly from China, and this is an obstacle to this mission having a greater impact on the remote sensing community.
3.5. Subject Analysis
To help with understanding the subject areas to which research based on EO satellite data have been applied, we made an analysis of the important keywords in the articles that referenced the data [63]. This analysis was carried out using CiteSpace and the top 10 keywords (Table S5) were found to be remote sensing (5904), MODIS (5861), classification (4108), model (4079), vegetation (3502), algorithm (3116), Landsat (3020), validation (2408), area (2313), and satellite (2302). MODIS and Landsat have undeniably been the most important EO satellites of the past few decades, and the use of their data has helped to promote remote sensing applications. Image classification is the method that is most important to the processing of EO satellite data. EO satellite data are an essential input to the modeling of the Earth’s fundamental systems and environment and to the validation of these models. Observation data and model simulations are necessary to our understanding of the Earth’s systems, and EO satellite data are becoming more and more important in the modeling of the Earth’s environment [79]. Validation is needed to confirm the accuracy of environmental products, and obtaining more accurate environmental information requires the continuous optimization of processing algorithms. Vegetation monitoring is an important focus of EO, and the growth of vegetation reflects the condition of the land and ecosystems [80,81]. Currently, popular satellite missions (e.g., Landsat, MODIS, and Sentinel) have wavebands specifically designed for observing vegetation cover or vegetation types. The accurate estimation of area in land use–land cover studies is essential to studies of global environmental change.
As shown in Table S5, some representative keywords appear repeatedly. These keywords indicate the aspects to which EO data are applied and include classification, model, vegetation, algorithm, validation, area, climate change, etc. There is a slight difference between satellites from the perspective of which keywords appear most frequently. Vegetation, climate, and land cover are the most common focuses of research that reference satellite data. The ability to provide time-series of data is one of the essential characteristics of EO satellite data. Changes in the Earth’s system and future environmental changes can be analyzed effectively using long time-series of satellite data. RF is a popular machine learning classifier and is widely used for processing images. The use of satellite scenes of the same target from multiple sources helps to produce high-quality information.
3.6. Cooperation Network Analysis
At the institutional level, scientific institutions from China and the United States have dominated research referencing EO satellites (Table S6). In terms of references to the EO satellites discussed in this paper, the top ten scientific institutions in terms of published papers are the Chinese Academy of Sciences (4416), the National Aeronautics and Space Administration (NASA) (2151), the University of Chinese Academy of Sciences (1385), the University of Maryland (1201), Beijing Normal University (985), Wuhan University (851), National Oceanic and Atmospheric Administration (NOAA) (688), the California Institute of Technology (615), the United States Geological Survey (USGS) (595), and the University of Wisconsin System (507). More papers referencing EO satellites have been written by authors at Chinese scientific institutions than by those at institutions in other countries. However, the average time for scientific institutions in China to conduct research is generally posterior to that of U.S. institutions. In relation to the top five EO satellites, scientific institutions in China and the United States still dominate the published papers. The largest number of papers originated at the Chinese Academy of Sciences. Wuhan University, the University of Chinese Academy of Sciences, NASA, the University of Maryland and NOAA are also significant institutions in terms of published research referencing EO satellites. These institutions have thus promoted the application of EO satellite data.
At the national level, the United States and China constitute the center of research using EO satellite data (Table S7 and Figure 4). The top ten countries are the United States (14,003), China (11,165), Germany (2960), Canada (2760), India (2743), the United Kingdom (2660), France (2503), Italy (2489), Australia (1622), and Japan (1585) (including duplicates). The number of published papers that reference EO satellites data is highly concentrated in the United States and China, with these two countries accounting for 25,168 papers (including duplicates), which is 39.17% of the total. In terms of references to the top five EO satellites, the United States and China also dominate the research and authors from these countries have had more related articles published than those from other countries (Table S7).
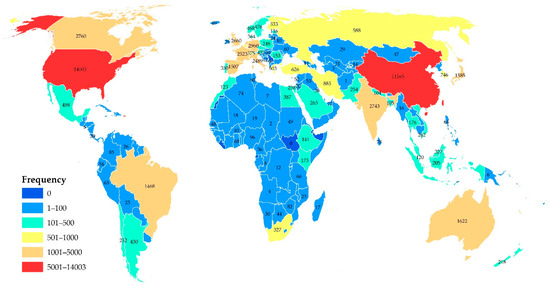
Figure 4.
Worldwide distribution of publications referencing EO satellite data.
The Nature Index tracks the countries and institutions that dominate high-quality research in the natural sciences. The index is based on the number of publications in 82 prestigious scientific journals selected by leading researchers [82]. The Nature Index can be used to determine which countries and institutions make a significant contribution to natural sciences research. According to the Nature Index, the United States and China again have the largest number of scientific institutions (2637 and 1485, respectively) featuring in these selected journals as well as the most published papers (29,207 and 19,084, respectively, in 2020). The amount of research conducted by Chinese scientists has increased rapidly in the past few years, but this increase is gradually slowing down. This explains why the average time required by Chinese scientists to carry out research based on EO satellite data is posterior to that of scientists in the United States. Among individual institutions, the Chinese Academy of Sciences has maintained its seemingly unassailable lead (with 5776 papers in 2020).
It is also clear that the countries that produce EO satellite data and their partner countries receive priority in gaining access to the data, whereas scientists in other countries will have more difficulty. For example, in terms of publications referencing Gaofen satellites, the top ten institutions are all from China. In this respect, China holds an unassailable lead at the national level, with 415 papers (78.90% of the total) referencing Gaofen satellites. Open access to EO satellite data is important to the development of remote sensing applications and the promotion of satellite missions.
4. Discussion
4.1. Significant Publications Referencing EO Satellite Data
Table 3 shows the top ten significant publications referencing EO satellite data that were obtained using CiteSpace software. The strength of the burst represents the impact of this article to the remote sensing community, and the beginning and end years indicate the time range of its influence [63].
As shown in Table 3, as above-mentioned, MODIS and Landsat are far more concerned by scientists than other EO satellite missions. The data from these two EO satellite missions have provided the remote sensing community with more measures and inspiration to observe the Earth. The high precision of the data will significantly promote the widespread use of the dataset [83]. Remer, et al. [84] confirmed that MODIS had high accuracy in retrieving aerosol, which promoted the research of aerosol radiative forcing of global climate. Then, the aerosol products of MODIS were stated to be significant in developing a long-term aerosol climate data record [85,86]. Land cover is essential to global change science and sustainable development, and some widely use global land cover datasets are derived from the imageries obtained by Landsat and MODIS [87,88]. In addition, mapping of global forest and surface water cover using EO satellite data provide a significant support for the study of global climate and biodiversity, which affects human well-being [89,90]. Efficient tools will greatly facilitate the application of EO satellite data with large volume. RF is an outstanding ensemble classifier for remote sensing applications, and promotes significant advance of EO satellite data analysis [91].
Table 3.
EO papers with the strongest citation bursts.
Table 3.
EO papers with the strongest citation bursts.
| Article | Author | Year | Strength | Begin | End |
|---|---|---|---|---|---|
| The MODIS aerosol algorithm, products, and validation [84] | Remer LA | 2005 | 162.12 | 2005 | 2010 |
| Summary of current radiometric calibration coefficients for Landsat MSS, TM, ETM+, and EO-1 ALI sensors [83] | Chander G | 2009 | 158.18 | 2010 | 2014 |
| High-Resolution Global Maps of 21st-Century Forest Cover Change [89] | Hansen MC | 2013 | 154.8 | 2015 | 2018 |
| Object-based cloud and cloud shadow detection in Landsat imagery | Zhu Z | 2012 | 128.93 | 2014 | 2017 |
| Landsat-8: Science and product vision for terrestrial global change research [87] | Roy DP | 2014 | 125.74 | 2015 | 2020 |
| High-resolution mapping of global surface water and its long-term changes [90] | Pekel JF | 2016 | 116.51 | 2018 | 2020 |
| Random forest in remote sensing: A review of applications and future directions [91] | Belgiu M | 2016 | 110.12 | 2018 | 2020 |
| Global aerosol optical properties and application to Moderate Resolution Imaging Spectroradiometer aerosol retrieval over land [85] | Levy RC | 2007 | 109.76 | 2007 | 2012 |
| MODIS Collection 5 global land cover: Algorithm refinements and characterization of new datasets [88] | Friedl MA | 2010 | 109.08 | 2011 | 2015 |
| The Collection 6 MODIS aerosol products over land and ocean [86] | Levy RC | 2013 | 95.89 | 2015 | 2018 |
4.2. Other Significant Satellite Missions
Many satellite missions were not analyzed in this study. The following Geostationary Operational Environmental Satellite (GOES) of NOAA/NASA and Planet Doves satellite missions will be introduced as examples.
GOES is a joint weather satellite series of NOAA/NASA, and the first satellite of GOES was launched in October 1975. Four generations of satellites have been designed, and a total of 17 satellites have been successfully launched. These satellites provide imagery of the Earth’s surface, atmospheric moisture, and cloud cover, support weather forecasting, severe storm tracking, and meteorology research [92]. The latest generation of GOES is called the GOES-R series, and there are already two satellites in orbit (GOES-R (-16) and GOES-S (-17), launched in 2016 and 2018, respectively), located at GOES-East and GOES-West, respectively. The Advanced Baseline Imager (ABI) carried by the GOES-R series is a significant advancement due to its improvement in the number of observation bands, spatial resolution, and observation frequency [93]. The wavelengths of ABI are similar to those of MODIS. Jethva, et al. [94] introduced the feasibility of applying the existing aerosol algorithms of MODIS to ABI observation and the accuracy of AOT products derived from ABI data, which will promote the application of ABI observations in both climate and air quality monitoring. The GOES-R series promotes the monitoring of weather systems and helps achieve more accurate meteorology and atmospheric research.
Planet Labs is a private Earth-imaging company founded in 2010. In ten years, Planet has successfully launched 452 satellites, and has over 150 satellites in orbit. Doves are miniature satellites designed and manufactured by Planet Labs. The satellite of Doves is the size of 10 × 10 × 30 cm and weighs about five kilograms, which is much smaller than traditional satellites. Currently, there are more than 130 satellites of Doves in orbit. The Dove constellation with a large number of satellites is able to observe all land every day, which is not possible with other constellations of satellites. The camera on Doves is currently in four bands (blue 455–515 nm, green 500–590 nm, red 590–670 nm, and near-infrared 780–860 nm), and the number of bands is increasing. Dove images have a spatial resolution of 3.7 m. The high spatial resolution and temporal frequency images provided by Doves help the assembly of low cloud cover images for high-resolution research [95,96]. Doves are of great significance for Land observation. Csillik, et al. [97] presented robust mechanisms for estimating top-of-canopy height (TCH) from Dove images and provided a root mean square error (RMSE) of 4.36 m in Peru, which provided a significant advance in monitoring tropical forests. The technology of miniature satellites will be also an important trend in the future development of EO.
4.3. Big Earth Data Cloud Processing Platforms
Big Earth Data, which includes datasets acquired by EO satellites, involves substantial and ever-increasing data volumes, is a necessary support for mankind to promote the monitoring and understanding of the Earth and its environment [98]. However, it is a challenge to process, analyze, and manage big geospatial data effectively [66,98]. Cloud computing has emerged as a significant tool to process Big Earth Data in recent years [64,99]. The advantages of cloud computing, easy operation, convenient access and processing of geospatial big data, and substantial computational capabilities, promote the analysis and application of Big Earth Data. The currently popular Big Earth Data cloud processing platforms include GEE, Amazon Web Services (AWS), Microsoft Azure, NASA Earth Exchange (NEX), Sentinel Hub (SH), Open Data Cube (ODC), etc. These platforms have transformed the user community and application of geospatial big data. GEE is a free access platform with substantial computational capabilities and a large amount of geospatial data as well as supports JavaScript, Python, and REST Application Programming Interfaces (APIs). AWS and Microsoft Azure, as pay-as-you-go platforms, support more APIs and provide advanced machine learning services, but do not have a significant advantage in the volume of geospatial big data and the applicability of algorithms. Gomes, et al. [14] believe that ODC is currently the most ideal solution for geospatial big data. ODC has great potential to manage and analyze multi-dimension data, and has advantages over GEE in open governance, infrastructure replicability, data access interoperability, and extendibility [14]. However, GEE is currently the most significant Big Earth Data cloud processing platform for the remote sensing community due to its ease of use and maturity [100].
5. Conclusions
We carried out a review of the impact of EO satellite data and analyzed possible future trends. The peer-reviewed articles referencing EO satellites that were included in this review were selected from the WoS core collection and analyzed using both scientometric analysis (i.e., CiteSpace) and meta-analysis. A total of 45,673 papers related to 15 well-known EO satellite missions were analyzed. These analyses can provide an in-depth understanding of the contributions to Earth observation made by EO satellite missions and the similarities and differences between the applications of Sentinel, Landsat, MODIS, Gaofen, and WorldView data. Our most significant findings are as follows.
- (1)
- In recent years, the number of publications and citations referencing EO satellites—particularly Landsat, MODIS and Sentinel—has increased rapidly. However, the number of articles referencing AVHRR, SPOT, and TerraSAR is tending to decrease. The Sentinel mission shows the most promise for future applications.
- (2)
- The published EO satellite papers were concentrated in a small number of journals, with 43.79% of articles being published in only 13 journals. The United States is the most important host country for the relevant journals and the most important source of articles in the relevant journals, thus making a significant contribution to the development of remote sensing.
- (3)
- A new impact index, the RSIF, was constructed to measure the impact of the use of EO satellite data and future possible trends in their application. Based on the values of the RSIF that we calculated, we believe that currently, the EO satellite missions that are of the most significance are Landsat, Sentinel, and MODIS. We also believe that, within the next five years (2021–2025), Sentinel data will become the most widely used EO satellite data. Sentinel, Landsat, and MODIS will still be the most influential satellite missions; there will also be more opportunities for the Gaofen and WorldView missions to promote significant advances in remote sensing applications and be used widely if their data are open access.
- (4)
- EO satellite data have been widely used in studies of the land, the atmosphere, water, phenology, and biomass. Vegetation, climate, and land cover are the main research focuses in which EO data are used. Landsat is currently the most important EO satellite. The EO satellite mission for the widest range of EO applications, however, is MODIS.
- (5)
- RF is a popular machine-learning classifier and is widely used for processing images. The use of multi-source satellite data helps to produce high-quality information.
- (6)
- In terms of the number of relevant references, the United States and China dominate research in which EO satellite data are applied: together, they account for 25,168 or 39.17% of the papers that we analyzed. Related research in China has developed rapidly in recent years.
EO satellite data are a very effective and indispensable tool to provide measurements and support for the environmental, social, political, and economic studies. In general, applications of EO satellite data have been developed with the increasing demand in these fields. For example, the refinement requirements of land use policies have led to the development of land cover mapping products toward higher resolution and stronger real-time performance. In this point, high-resolution EO satellite missions are becoming popular these days to monitor nature, the environment, and disasters [16]. Among the top five satellites as measured by the RSIF, Sentinel, Gaofen, and WorldView all carry high-resolution instruments, which is one of the reasons that these data have quickly become widely used. The fusion of remote sensing data from multiple sources will also become an important focus of research into the use of geospatial data [101]; however, significant advances in fusion algorithms are still needed. Big Earth Data consists of complex and unstructured data, and more advanced tools are needed to explore multi-temporal, multi-scale geo-information [102]. With technological advances to cloud computing, 3D and virtual Earth, the ideal Big Earth Data processing platform is gradually emerging [100].
Although the amount of research based on EO satellite data has increased rapidly in recent years, there are still difficulties in accessing some types of satellite data. For example, it is clear that institutions in China reference Gaofen data far more often than institutions in other countries. This is not conducive to the development and expansion of the Gaofen satellite mission. From the analysis described in this study, it is clear that there is potential for widespread global use of Gaofen data. However, it is necessary to simplify access to these data and broaden distribution channels in other countries so that scientists from various countries can efficiently conduct research referencing Gaofen satellite data. To varying degrees, similar problems exist in relation to other types of EO satellite data including Cartosat, COSMO-SkyMed, Fengyun, IRS, and Ziyuan data. Open and simplified access to geospatial data is vital to the development of remote sensing applications, spurring the creation of standard products and new approaches to data application [103].
Supplementary Materials
The following are available online at https://www.mdpi.com/article/10.3390/rs14081863/s1: Table S1: List of journals published articles referencing EO satellites, Table S2: List of research disciplines of articles referencing EO satellites, Table S3: List of EO satellites discussed, Table S4: List of clusters found for the application of EO satellite data, Table S5: List of keywords in all analyzed papers, Table S6: List of institutions applied EO satellite data, Table S7: List of countries or regions applied EO satellite data.
Author Contributions
Conceptualization, L.Y.; Methodology, Q.Z. and L.Y.; Software, Q.Z.; Formal analysis, Q.Z., L.Y., Z.D., D.P., P.H., Y.Z. and P.G.; Resources, L.Y. and Y.Z.; Writing—original draft preparation, Q.Z. and L.Y.; Writing—review and editing, Q.Z., L.Y., Z.D., D.P., P.H., Y.Z. and P.G.; Supervision, L.Y. and Y.Z.; Project administration, L.Y.; Funding acquisition, L.Y. and D.P. All authors have read and agreed to the published version of the manuscript.
Funding
This research was funded by the National Key R & D Program of China (grant number: 2019YFA0606601; 2019YFE0115200), Tsinghua University Initiative Scientific Research Program, (grant number: 2021Z11GHX002), and the National Key Scientific and Technological Infrastructure project “Earth System Science Numerical Simulator Facility” (EarthLab).
Data Availability Statement
This study does not contain reports on any data.
Conflicts of Interest
The authors declare no conflict of interest.
References
- Zhang, X.; Chen, N.C.; Sheng, H.; Ip, C.; Yang, L.; Chen, Y.; Sang, Z.; Tadesse, T.; Lim, T.P.Y.; Rajabifard, A.; et al. Urban drought challenge to 2030 sustainable development goals. Sci. Total Environ. 2019, 693, 11. [Google Scholar] [CrossRef] [PubMed]
- United Nations. Transforming Our World: The 2030 Agenda for Sustainable Development. 2015. Available online: https://undocs.org/en/A/RES/70/71 (accessed on 22 February 2022).
- United Nations. Paris Agreement. 2015. Available online: https://unfccc.int/process-and-meetings/the-paris-agreement/the-paris-agreement (accessed on 22 February 2022).
- Estoque, R.C. A review of the sustainability concept and the state of SDG monitoring using remote sensing. Remote Sens. 2020, 12, 1770. [Google Scholar] [CrossRef]
- GEO Group on Earth Observations. Earth Observations in Support of the 2030 Agenda for Sustainable Development. 2017. Available online: https://www.earthobservations.org/documents/publications/201703_geo_eo_for_202030_agenda.pdf (accessed on 22 February 2022).
- United Nations. Political Declaration of the High-Level Political Forum on Sustainable Development Convened under the Auspices of the General Assembly. 2019. Available online: https://undocs.org/en/A/RES/74/74 (accessed on 22 February 2022).
- Song, Y.; Wu, P. Earth observation for sustainable infrastructure: A review. Remote Sens. 2021, 13, 1528. [Google Scholar] [CrossRef]
- Prakash, M.; Ramage, S.; Kavvada, A.; Goodman, S. Open Earth observations for sustainable urban development. Remote Sens. 2020, 12, 1646. [Google Scholar] [CrossRef]
- Ferreira, B.; Iten, M.; Silva, R.G. Monitoring sustainable development by means of Earth observation data and machine learning: A review. Environ. Sci Eur. 2020, 32, 120. [Google Scholar] [CrossRef]
- Achard, F.; Stibig, H.-J.; Eva, H.D.; Lindquist, E.J.; Bouvet, A.; Arino, O.; Mayaux, P. Estimating tropical deforestation from Earth observation data. Carbon Manag. 2014, 1, 271–287. [Google Scholar] [CrossRef] [Green Version]
- Scholze, M.; Buchwitz, M.; Dorigo, W.; Guanter, L.; Quegan, S. Reviews and syntheses: Systematic Earth observations for use in terrestrial carbon cycle data assimilation systems. Biogeosciences 2017, 14, 3401–3429. [Google Scholar] [CrossRef] [Green Version]
- Anderson, K.; Ryan, B.; Sonntag, W.; Kavvada, A.; Friedl, L. Earth observation in service of the 2030 Agenda for Sustainable Development. Geo-Spat. Inf. Sci. 2017, 20, 77–96. [Google Scholar] [CrossRef]
- Cord, A.F.; Brauman, K.A.; Chaplin-Kramer, R.; Huth, A.; Ziv, G.; Seppelt, R. Priorities to advance monitoring of ecosystem services using Earth observation. Trends Ecol. Evol. 2017, 32, 416–428. [Google Scholar] [CrossRef]
- Gomes, V.C.F.; Queiroz, G.R.; Ferreira, K.R. An overview of platforms for big Earth observation data management and analysis. Remote Sens. 2020, 12, 1253. [Google Scholar] [CrossRef] [Green Version]
- Vali, A.; Comai, S.; Matteucci, M. Deep learning for land use and land cover classification based on hyperspectral and multispectral Earth observation data: A review. Remote Sens. 2020, 12, 2495. [Google Scholar] [CrossRef]
- Li, D.R.; Tong, Q.X.; Li, R.X.; Gong, J.Y.; Zhang, L.P. Current issues in high-resolution Earth observation technology. Sci. China-Earth Sci. 2012, 55, 1043–1051. [Google Scholar] [CrossRef]
- Lodhi, V.; Chakravarty, D.; Mitra, P. Hyperspectral imaging for Earth observation: Platforms and instruments. J. Indian Inst. Sci. 2018, 98, 429–443. [Google Scholar] [CrossRef]
- Tatem, A.J.; Goetz, S.J.; Hay, S.I. Fifty years of Earth-observation satellites—Views from space have led to countless advances on the ground in both scientific knowledge and daily life. Am. Sci. 2008, 96, 390–398. [Google Scholar] [CrossRef] [PubMed] [Green Version]
- Sandau, R. Status and trends of small satellite missions for Earth observation. Acta Astronaut. 2010, 66, 1–12. [Google Scholar] [CrossRef]
- Filchev, L.; Manakos, I.; Reuter, R.; Mardirossian, G.; Srebrova, T.; Kraleva, L.; Dimitrov, D.; Marini, K.; Rienow, A. A review of Earth observation resources for secondary school education—Part 1. Aerosp. Res. Bulg. 2020, 32, 224–240. [Google Scholar] [CrossRef]
- Filchev, L.; Manakos, I.; Reuter, R.; Mardirossian, G.; Srebrova, T.; Kraleva, L.; Dimitrov, D.; Marini, K.; Rienow, A. A review of Earth observation resources for secondary school education—Part 2. Aerosp. Res. Bulg. 2021, 33, 251–259. [Google Scholar] [CrossRef]
- Asimakopoulou, P.; Nastos, P.; Vassilakis, E.; Hatzaki, M.; Antonarakou, A. Earth observation as a facilitator of climate change education in schools: The teachers’ perspectives. Remote Sens. 2021, 13, 1587. [Google Scholar] [CrossRef]
- Da Ponte, E.; Fleckenstein, M.; Leinenkugel, P.; Parker, A.; Oppelt, N.; Kuenzer, C. Tropical forest cover dynamics for Latin America using Earth observation data: A review covering the continental, regional, and local scale. Int. J. Remote Sens. 2015, 36, 3196–3242. [Google Scholar] [CrossRef]
- Holzwarth, S.; Thonfeld, F.; Abdullahi, S.; Asam, S.; Da Ponte Canova, E.; Gessner, U.; Huth, J.; Kraus, T.; Leutner, B.; Kuenzer, C. Earth observation based monitoring of forests in germany: A review. Remote Sens. 2020, 12, 3570. [Google Scholar] [CrossRef]
- Pasher, J.; Smith, P.A.; Forbes, M.R.; Duffe, J. Terrestrial ecosystem monitoring in Canada and the greater role for integrated Earth observation. Environ. Rev. 2014, 22, 179–187. [Google Scholar] [CrossRef]
- Pfeifer, M.; Disney, M.; Quaife, T.; Marchant, R. Terrestrial ecosystems from space: A review of Earth observation products for macroecology applications. Glob. Ecol. Biogeogr. 2012, 21, 603–624. [Google Scholar] [CrossRef] [Green Version]
- Ramirez-Reyes, C.; Brauman, K.A.; Chaplin-Kramer, R.; Galford, G.L.; Adamo, S.B.; Anderson, C.B.; Anderson, C.; Allington, G.R.H.; Bagstad, K.J.; Coe, M.T.; et al. Reimagining the potential of Earth observations for ecosystem service assessments. Sci. Total Environ. 2019, 665, 1053–1063. [Google Scholar] [CrossRef] [PubMed]
- Ustin, S.L.; Middleton, E.M. Current and near-term advances in Earth observation for ecological applications. Ecol. Process. 2021, 10, 1. [Google Scholar] [CrossRef]
- Crocetti, L.; Forkel, M.; Fischer, M.; Jurečka, F.; Grlj, A.; Salentinig, A.; Trnka, M.; Anderson, M.; Ng, W.-T.; Kokalj, Ž.; et al. Earth observation for agricultural drought monitoring in the Pannonian Basin (Southeastern Europe): Current state and future directions. Reg. Environ. Chang. 2020, 20, 123. [Google Scholar] [CrossRef]
- Petropoulos, G.; Srivastava, P.; Piles, M.; Pearson, S. Earth observation-based operational estimation of soil moisture and evapotranspiration for agricultural crops in support of sustainable water management. Sustainability 2018, 10, 181. [Google Scholar] [CrossRef] [Green Version]
- Ngcofe, L.; Van Niekerk, A. Advances in optical Earth observation for geological mapping: A review. S. Afr. J. Geomat. 2016, 5, 1–16. [Google Scholar] [CrossRef] [Green Version]
- van der Meer, F.D.; van der Werff, H.M.A.; van Ruitenbeek, F.J.A.; Hecker, C.A.; Bakker, W.H.; Noomen, M.F.; van der Meijde, M.; Carranza, E.J.M.; Smeth, J.B.d.; Woldai, T. Multi- and hyperspectral geologic remote sensing: A review. Int. J. Appl. Earth Obs. Geoinf. 2012, 14, 112–128. [Google Scholar] [CrossRef]
- Marti, R.; Li, Z.; Catry, T.; Roux, E.; Mangeas, M.; Handschumacher, P.; Gaudart, J.; Tran, A.; Demagistri, L.; Faure, J.-F.; et al. A mapping review on urban landscape factors of dengue retrieved from Earth observation data, gis techniques, and survey questionnaires. Remote Sens. 2020, 12, 932. [Google Scholar] [CrossRef] [Green Version]
- Parselia, E.; Kontoes, C.; Tsouni, A.; Hadjichristodoulou, C.; Kioutsioukis, I.; Magiorkinis, G.; Stilianakis, N.I. Satellite Earth observation data in epidemiological modeling of malaria, dengue and west nile virus: A scoping review. Remote Sens. 2019, 11, 1862. [Google Scholar] [CrossRef] [Green Version]
- Sogno, P.; Traidl-Hoffmann, C.; Kuenzer, C. Earth observation data supporting non-communicable disease research: A review. Remote Sens. 2020, 12, 2541. [Google Scholar] [CrossRef]
- Tran, A.; Goutard, F.; Chamaillé, L.; Baghdadi, N.; Lo Seen, D. Remote sensing and avian influenza: A review of image processing methods for extracting key variables affecting avian influenza virus survival in water from Earth observation satellites. Int. J. Appl. Earth Obs. Geoinf. 2010, 12, 1–8. [Google Scholar] [CrossRef]
- Weng, Q.; Xu, B.; Hu, X.; Liu, H. Use of Earth observation data for applications in public health. Geocarto Int. 2013, 29, 3–16. [Google Scholar] [CrossRef]
- Jia, P.; Stein, A.; James, P.; Brownson, R.C.; Wu, T.; Xiao, Q.; Wang, L.; Sabel, C.E.; Wang, Y. Earth observation: Investigating noncommunicable diseases from space. Annu. Rev. Public Health 2019, 40, 85–104. [Google Scholar] [CrossRef] [Green Version]
- de Jong, R.; de Bruin, S.; Schaepman, M.; Dent, D. Quantitative mapping of global land degradation using Earth observations. Int. J. Remote Sens. 2011, 32, 6823–6853. [Google Scholar] [CrossRef] [Green Version]
- Chen, G.; Wang, Q.; Chu, X. Accelerated spread of Fukushima’s waste water by ocean circulation. Innovation 2021, 2, 100119. [Google Scholar] [CrossRef]
- Duncan, B.N. Interannual and seasonal variability of biomass burning emissions constrained by satellite observations. J. Geophys. Res. 2003, 108, ACH 1-1–ACH 1-22. [Google Scholar] [CrossRef] [Green Version]
- Politi, E.; Paterson, S.K.; Scarrott, R.; Tuohy, E.; O’Mahony, C.; Cámaro-García, W.C.A. Earth observation applications for coastal sustainability: Potential and challenges for implementation. Anthr. Coasts 2019, 2, 306–329. [Google Scholar] [CrossRef] [Green Version]
- Grainger, A. Citizen observatories and the new Earth observation science. Remote Sens. 2017, 9, 153. [Google Scholar] [CrossRef] [Green Version]
- Kuffer, M.; Thomson, D.R.; Boo, G.; Mahabir, R.; Grippa, T.; Vanhuysse, S.; Engstrom, R.; Ndugwa, R.; Makau, J.; Darin, E.; et al. The role of Earth observation in an integrated deprived area mapping “system” for low-to-middle income countries. Remote Sens. 2020, 12, 982. [Google Scholar] [CrossRef] [Green Version]
- Guo, H. Understanding global natural disasters and the role of Earth observation. Int. J. Digit. Earth 2010, 3, 221–230. [Google Scholar] [CrossRef] [Green Version]
- Kaku, K.; Aso, N.; Takiguchi, F. Space-based response to the 2011 Great East Japan Earthquake: Lessons learnt from JAXA’s support using Earth observation satellites. Int. J. Disaster Risk Reduct. 2015, 12, 134–153. [Google Scholar] [CrossRef] [Green Version]
- Theron, A.; Engelbrecht, J. The role of Earth observation, with a focus on SAR interferometry, for sinkhole hazard assessment. Remote Sens. 2018, 10, 1506. [Google Scholar] [CrossRef] [Green Version]
- Pandey, P.C.; Koutsias, N.; Petropoulos, G.P.; Srivastava, P.K.; Ben Dor, E. Land use/land cover in view of Earth observation: Data sources, input dimensions, and classifiers—A review of the state of the art. Geocarto Int. 2019, 36, 957–988. [Google Scholar] [CrossRef]
- Hansen, M.C.; Loveland, T.R. A review of large area monitoring of land cover change using Landsat data. Remote Sens. Environ. 2012, 122, 66–74. [Google Scholar] [CrossRef]
- Hu, Z.; Kuenzer, C.; Dietz, A.J.; Dech, S. The potential of Earth observation for the analysis of cold region land surface dynamics in europe—A review. Remote Sens. 2017, 9, 1067. [Google Scholar] [CrossRef] [Green Version]
- Philipp, M.; Dietz, A.; Buchelt, S.; Kuenzer, C. Trends in satellite Earth observation for permafrost related analyses—A review. Remote Sens. 2021, 13, 1217. [Google Scholar] [CrossRef]
- Li, T.; Chen, Y.-Z.; Han, L.-J.; Cheng, L.-H.; Lv, Y.-H.; Fu, B.-J.; Feng, X.-M.; Wu, X. Shortened duration and reduced area of frozen soil in the Northern Hemisphere. Innovation 2021, 2, 100146. [Google Scholar] [CrossRef]
- Kaufman, Y.J.; Tanre, D.; Boucher, O. A satellite view of aerosols in the climate system. Nature 2002, 419, 215–223. [Google Scholar] [CrossRef]
- Kuenzer, C.; Ottinger, M.; Wegmann, M.; Guo, H.; Wang, C.; Zhang, J.; Dech, S.; Wikelski, M. Earth observation satellite sensors for biodiversity monitoring: Potentials and bottlenecks. Int. J. Remote Sens. 2014, 35, 6599–6647. [Google Scholar] [CrossRef] [Green Version]
- Lawford, R.; Strauch, A.; Toll, D.; Fekete, B.; Cripe, D. Earth observations for global water security. Curr. Opin. Environ. Sustain. 2013, 5, 633–643. [Google Scholar] [CrossRef] [Green Version]
- Uereyen, S.; Kuenzer, C. A review of Earth observation-based analyses for major river basins. Remote Sens. 2019, 11, 2951. [Google Scholar] [CrossRef] [Green Version]
- Elmes, A.; Alemohammad, H.; Avery, R.; Caylor, K.; Eastman, J.; Fishgold, L.; Friedl, M.; Jain, M.; Kohli, D.; Laso Bayas, J.; et al. Accounting for training data error in machine learning applied to Earth observations. Remote Sens. 2020, 12, 1034. [Google Scholar] [CrossRef] [Green Version]
- Loew, A.; Bell, W.; Brocca, L.; Bulgin, C.E.; Burdanowitz, J.; Calbet, X.; Donner, R.V.; Ghent, D.; Gruber, A.; Kaminski, T.; et al. Validation practices for satellite-based Earth observation data across communities. Rev. Geophys. 2017, 55, 779–817. [Google Scholar] [CrossRef] [Green Version]
- Mayr, S.; Kuenzer, C.; Gessner, U.; Klein, I.; Rutzinger, M. Validation of Earth observation time-series: A review for large-area and temporally dense land surface products. Remote Sens. 2019, 11, 2616. [Google Scholar] [CrossRef] [Green Version]
- Merchant, C.J.; Paul, F.; Popp, T.; Ablain, M.; Bontemps, S.; Defourny, P.; Hollmann, R.; Lavergne, T.; Laeng, A.; de Leeuw, G.; et al. Uncertainty information in climate data records from Earth observation. Earth Syst. Sci. Data 2017, 9, 511–527. [Google Scholar] [CrossRef] [Green Version]
- Pohl, C.; Van Genderen, J.L. Review article multisensor image fusion in remote sensing: Concepts, methods and applications. Int. J. Remote Sens. 2010, 19, 823–854. [Google Scholar] [CrossRef] [Green Version]
- Web of Science. Available online: https://www.webofscience.com/ (accessed on 22 February 2022).
- Chen, C.; Ibekwe-SanJuan, F.; Hou, J. The structure and dynamics of cocitation clusters: A multiple-perspective cocitation analysis. J. Am. Soc. Inf. Sci. Technol. 2010, 61, 1386–1409. [Google Scholar] [CrossRef] [Green Version]
- Yao, X.C.; Li, G.Q.; Xia, J.S.; Ben, J.; Cao, Q.Q.; Zhao, L.; Ma, Y.; Zhang, L.C.; Zhu, D.H. Enabling the big Earth observation data via cloud computing and DGGS: Opportunities and challenges. Remote Sens. 2020, 12, 62. [Google Scholar] [CrossRef] [Green Version]
- Xia, J.Z.; Yang, C.W.; Li, Q.Q. Building a spatiotemporal index for Earth observation big data. Int. J. Appl. Earth Obs. Geoinf. 2018, 73, 245–252. [Google Scholar] [CrossRef]
- Guo, H.D.; Liu, Z.; Jiang, H.; Wang, C.L.; Liu, J.; Liang, D. Big Earth Data: A new challenge and opportunity for Digital Earth’s development. Int. J. Digit. Earth 2017, 10, 1–12. [Google Scholar] [CrossRef] [Green Version]
- Zhu, Z. Change detection using Landsat time series: A review of frequencies, preprocessing, algorithms, and applications. ISPRS-J. Photogramm. Remote Sens. 2017, 130, 370–384. [Google Scholar] [CrossRef]
- Kennedy, R.E.; Andrefouet, S.; Cohen, W.B.; Gomez, C.; Griffiths, P.; Hais, M.; Healey, S.P.; Helmer, E.H.; Hostert, P.; Lyons, M.B.; et al. Bringing an ecological view of change to Landsat-based remote sensing. Front. Ecol. Environ. 2014, 12, 339–346. [Google Scholar] [CrossRef]
- Woodcock, C.E.; Allen, R.; Anderson, M.; Belward, A.; Bindschadler, R.; Cohen, W.; Gao, F.; Goward, S.N.; Helder, D.; Helmer, E.; et al. Free access to Landsat imagery. Science 2008, 320, 1011. [Google Scholar] [CrossRef] [PubMed]
- Banskota, A.; Kayastha, N.; Falkowski, M.J.; Wulder, M.A.; Froese, R.E.; White, J.C. Forest monitoring using Landsat time series data: A review. Can. J. Remote Sens. 2014, 40, 362–384. [Google Scholar] [CrossRef]
- Friedl, M.A.; McIver, D.K.; Hodges, J.C.F.; Zhang, X.Y.; Muchoney, D.; Strahler, A.H.; Woodcock, C.E.; Gopal, S.; Schneider, A.; Cooper, A.; et al. Global land cover mapping from MODIS: Algorithms and early results. Remote Sens. Environ. 2002, 83, 287–302. [Google Scholar] [CrossRef]
- Dwyer, J.L.; Roy, D.P.; Sauer, B.; Jenkerson, C.B.; Zhang, H.K.; Lymburner, L. Analysis ready data: Enabling analysis of the Landsat archive. Remote Sens. 2018, 10, 1363. [Google Scholar]
- Fishtahler, L.E. Standard data products from the MODIS science team. In Proceedings of the IEEE International Geoscience and Remote Sensing Symposium (IGARSS 1997), Singapore, 3 August 1997; pp. 1249–1251. [Google Scholar]
- Brown, J.F.; Howard, D.; Wylie, B.; Frieze, A.; Ji, L.; Gacke, C. Application-ready expedited MODIS data for operational land surface monitoring of vegetation condition. Remote Sens. 2015, 7, 16226–16240. [Google Scholar] [CrossRef] [Green Version]
- Justice, C.O.; Vermote, E.; Townshend, J.R.G.; Defries, R.; Roy, D.P.; Hall, D.K.; Salomonson, V.V.; Privette, J.L.; Riggs, G.; Strahler, A.; et al. The Moderate Resolution Imaging Spectroradiometer (MODIS): Land remote sensing for global change research. IEEE Trans. Geosci. Remote Sens. 1998, 36, 1228–1249. [Google Scholar] [CrossRef] [Green Version]
- Zhu, Z. Science of Landsat analysis ready data. Remote Sens. 2019, 11, 2166. [Google Scholar] [CrossRef] [Green Version]
- Plank, S. Rapid damage assessment by means of multi-temporal SAR—A comprehensive review and outlook to Sentinel-1. Remote Sens. 2014, 6, 4870–4906. [Google Scholar] [CrossRef] [Green Version]
- Radocaj, D.; Obhodas, J.; Jurisic, M.; Gasparovic, M. Global open data remote sensing satellite missions for land monitoring and conservation: A review. Land 2020, 9, 402. [Google Scholar] [CrossRef]
- Yang, J.; Gong, P.; Fu, R.; Zhang, M.H.; Chen, J.M.; Liang, S.L.; Xu, B.; Shi, J.C.; Dickinson, R. The role of satellite remote sensing in climate change studies. Nat. Clim. Chang. 2013, 3, 875–883. [Google Scholar] [CrossRef]
- Bartholome, E.; Belward, A.S. GLC2000: A new approach to global land cover mapping from Earth observation data. Int. J. Remote Sens. 2005, 26, 1959–1977. [Google Scholar] [CrossRef]
- Hese, S.; Lucht, W.; Schmullius, C.; Barnsley, M.; Dubayah, R.; Knorr, D.; Neumann, K.; Riedel, T.; Schroter, K. Global biomass mapping for an improved understanding of the CO2 balance—The Earth observation mission Carbon-3D. Remote Sens. Environ. 2005, 94, 94–104. [Google Scholar] [CrossRef]
- Nature Index. Available online: https://www.natureindex.com/ (accessed on 22 February 2022).
- Chander, G.; Markham, B.L.; Helder, D.L. Summary of current radiometric calibration coefficients for Landsat MSS, TM, ETM+, and EO-1 ALI sensors. Remote Sens. Environ. 2009, 113, 893–903. [Google Scholar] [CrossRef]
- Remer, L.A.; Kaufman, Y.J.; Tanre, D.; Mattoo, S.; Chu, D.A.; Martins, J.V.; Li, R.R.; Ichoku, C.; Levy, R.C.; Kleidman, R.G.; et al. The MODIS aerosol algorithm, products, and validation. J. Atmos. Sci. 2005, 62, 947–973. [Google Scholar] [CrossRef] [Green Version]
- Levy, R.C.; Remer, L.A.; Dubovik, O. Global aerosol optical properties and application to Moderate Resolution Imaging Spectroradiometer aerosol retrieval over land. J. Geophys. Res.-Atmos. 2007, 112, D13210. [Google Scholar] [CrossRef] [Green Version]
- Levy, R.C.; Mattoo, S.; Munchak, L.A.; Remer, L.A.; Sayer, A.M.; Patadia, F.; Hsu, N.C. The Collection 6 MODIS aerosol products over land and ocean. Atmos. Meas. Tech. 2013, 6, 2989–3034. [Google Scholar] [CrossRef] [Green Version]
- Roy, D.P.; Wulder, M.A.; Loveland, T.R.; Woodcock, C.E.; Allen, R.G.; Anderson, M.C.; Helder, D.; Irons, J.R.; Johnson, D.M.; Kennedy, R.; et al. Landsat-8: Science and product vision for terrestrial global change research. Remote Sens. Environ. 2014, 145, 154–172. [Google Scholar] [CrossRef] [Green Version]
- Friedl, M.A.; Sulla-Menashe, D.; Tan, B.; Schneider, A.; Ramankutty, N.; Sibley, A.; Huang, X. MODIS Collection 5 global land cover: Algorithm refinements and characterization of new datasets. Remote Sens. Environ. 2010, 114, 168–182. [Google Scholar] [CrossRef]
- Hansen, M.C.; Potapov, P.V.; Moore, R.; Hancher, M.; Turubanova, S.A.; Tyukavina, A.; Thau, D.; Stehman, S.V.; Goetz, S.J.; Loveland, T.R.; et al. High-resolution global maps of 21st-century forest cover change. Science 2013, 342, 850–853. [Google Scholar] [CrossRef] [PubMed] [Green Version]
- Pekel, J.-F.; Cottam, A.; Gorelick, N.; Belward, A.S. High-resolution mapping of global surface water and its long-term changes. Nature 2016, 540, 418–422. [Google Scholar] [CrossRef] [PubMed]
- Belgiu, M.; Dragut, L. Random forest in remote sensing: A review of applications and future directions. ISPRS-J. Photogramm. Remote Sens. 2016, 114, 24–31. [Google Scholar] [CrossRef]
- Menzel, W.P.; Purdom, J.F.W. Introducing GOES-I—The 1st of a new-generation of geostationary operational environmental satellites. Bull. Am. Meteorol. Soc. 1994, 75, 757–781. [Google Scholar] [CrossRef] [Green Version]
- Higuchi, A. Toward more integrated utilizations of geostationary satellite data for disaster management and risk mitigation. Remote Sens. 2021, 13, 1553. [Google Scholar] [CrossRef]
- Jethva, H.; Torres, O.; Yoshida, Y. Accuracy assessment of MODIS land aerosol optical thickness algorithms using AERONET measurements over North America. Atmos. Meas. Tech. 2019, 12, 4291–4307. [Google Scholar] [CrossRef] [Green Version]
- Li, J.; Knapp, D.E.; Schill, S.R.; Roelfsema, C.; Phinn, S.; Silman, M.; Mascaro, J.; Asner, G.P. Adaptive bathymetry estimation for shallow coastal waters using Planet Dove satellites. Remote Sens. Environ. 2019, 232, 111302. [Google Scholar] [CrossRef]
- Asner, G.P.; Martin, R.E.; Mascaro, J. Coral reef atoll assessment in the South China Sea using Planet Dove satellites. Remote Sens. Ecol. Conserv. 2017, 3, 57–65. [Google Scholar] [CrossRef]
- Csillik, O.; Kumar, P.; Asner, G.P. Challenges in estimating tropical forest canopy height from Planet DOVE imagery. Remote Sens. 2020, 12, 1160. [Google Scholar] [CrossRef] [Green Version]
- Guo, H.D. Big Earth data: A new frontier in Earth and information sciences. Big Earth Data 2017, 1, 4–20. [Google Scholar] [CrossRef] [Green Version]
- Wang, L.Z.; von Laszewski, G.; Younge, A.; He, X.; Kunze, M.; Tao, J.; Fu, C. Cloud computing: A perspective study. New Gener. Comput. 2010, 28, 137–146. [Google Scholar] [CrossRef] [Green Version]
- Zhao, Q.; Yu, L.; Li, X.; Peng, D.; Zhang, Y.; Gong, P. Progress and trends in the application of Google Earth and Google Earth Engine. Remote Sens. 2021, 13, 3778. [Google Scholar] [CrossRef]
- Dong, J.; Zhuang, D.F.; Huang, Y.H.; Fu, J.Y. Advances in multi-sensor data fusion: Algorithms and applications. Sensors 2009, 9, 7771–7784. [Google Scholar] [CrossRef] [PubMed] [Green Version]
- Yu, L.; Gong, P. Google Earth as a virtual globe tool for Earth science applications at the global scale: Progress and perspectives. Int. J. Remote Sens. 2012, 33, 3966–3986. [Google Scholar] [CrossRef]
- Wulder, M.A.; Masek, J.G.; Cohen, W.B.; Loveland, T.R.; Woodcock, C.E. Opening the archive: How free data has enabled the science and monitoring promise of Landsat. Remote Sens. Environ. 2012, 122, 2–10. [Google Scholar] [CrossRef]

Publisher’s Note: MDPI stays neutral with regard to jurisdictional claims in published maps and institutional affiliations. |
© 2022 by the authors. Licensee MDPI, Basel, Switzerland. This article is an open access article distributed under the terms and conditions of the Creative Commons Attribution (CC BY) license (https://creativecommons.org/licenses/by/4.0/).