Article

Interferometric SAR Observation of Permafrost Status in the Northern Qinghai-Tibet Plateau by ALOS, ALOS-2 and Sentinel-1 between 2007 and 2021

1
Key Laboratory of Digital Earth Science, Aerospace Information Research Institute, Chinese Academy of Sciences, Beijing 100094, China
2
International Research Center of Big Data for Sustainable Development Goals, Beijing 100094, China
3
College of Resources and Environment, University of Chinese Academy of Sciences, Beijing 100049, China
*
Author to whom correspondence should be addressed.
Remote Sens. 2022, 14(8), 1870; https://doi.org/10.3390/rs14081870
Submission received: 28 February 2022 / Revised: 5 April 2022 / Accepted: 9 April 2022 / Published: 13 April 2022
(This article belongs to the Special Issue ALOS-2/PALSAR-2 Calibration, Validation, Science and Applications)

Abstract

:
With global warming, permafrost is undergoing degradation, which may cause thawing subsidence, collapse, and emission of greenhouse gases preserved in previously frozen permafrost, change the local hydrology and ecology system, and threaten infrastructure and indigenous communities. The Qinghai-Tibet Plateau (QTP) is the world’s largest permafrost region in the middle and low latitudes. Permafrost status monitoring in the QTP is of great significance to global change and local economic development. In this study, we used 66 scenes of ALOS data (2007–2009), 73 scenes of ALOS-2 data (2015–2020) and 284 scenes of Sentinel-1 data (2017–2021) to evaluate the spatial and temporal permafrost deformation over the 83,000 km2 in the northern QTP, passing through the Tuotuohe, Beiluhe, Wudaoliang and Xidatan regions. We use the SBAS-InSAR method and present a coherence weighted least squares estimator without any hypothetical model to calculate long-term deformation velocity (LTDV) and maximum seasonal deformation (MSD) without any prior knowledge. Analysis of the ALOS results shows that the LTDV ranged from −20 to +20 mm/year during 2007–2009. For the ALOS-2 and Sentinel-1 results, the LTDV ranged from −30 to 30 mm/year during 2015–2021. Further study shows that the expansion areas of permafrost subsidence are concentrated on braided stream plains and thermokarst lakes. In these areas, due to glacial erosion, surface runoff and river alluvium, the contents of water and ground ice are sufficient, which could accelerate permafrost subsidence. In addition, by analyzing LTDV and MSD for the different periods, we found that the L-band ALOS-2 is more sensitive to the thermal collapse of permafrost than the C-band sensor and the detected collapse areas (LTDV < −10 mm/year) are consistent with the GF-1/2 thermal collapse dataset. This research indicates that the InSAR technique could be crucial for monitoring the evolution of permafrost and freeze-thaw disasters.

Graphical Abstract

1. Introduction

The Qinghai-Tibet Plateau (QTP) is known as the Asian water tower, with an average altitude of more than 4000 m [1]. It is bounded by the Pamir Plateau in the west, Hengduan Mountain in the east, the southern end of the Himalayas in the south and Kunlun Altun Mountain, Qilian Mountain in the north [2]. The QTP is a high terrain and thus receives more solar radiation energy than lower elevation areas [3]. The Chinese mainland climate is affected by the South Asian and East Asian monsoons, resulting in a diversity of climates in different regions, such as the rainy climate in China’s southern part of the Yangtze River and drought in Northwest China [4]. In addition, the QTP has many glaciers, lakes, groundwater and surface rivers, making the QTP a super water tower in the plateau area, which affects the water system layout of all of Asia [5]. The QTP is a region with a large amount of permafrost at high latitudes [6]. As a key component of the Earth’s cryosphere, permafrost plays an important role in the surface energy balance, carbon and water cycles, terrestrial ecosystem, and hydrological system [7]. In recent years, with global warming, permafrost degradation has accelerated [8], and degradation has had an impact on the environment and the energy and material balance. Therefore, it is very important to monitor the permafrost status on a large scale for a long time series [7].
Traditional measurement methods of permafrost deformation include GPS [9], leveling surveys [10], and drilling [11]. However, due to the harsh environment of the QTP, these methods cannot monitor permafrost on a large scale [8]. The multitemporal interferometric synthetic aperture radar (MT-InSAR) technique is a useful tool to map ground deformation [12]. MT-InSAR has been used to monitor the freeze-thaw cycle of permafrost [13,14,15,16,17,18,19,20,21,22,23,24,25,26,27,28,29,30], and to retrieve the thickness of the active layer [31,32,33,34,35,36] and permafrost degradation [37,38,39,40]. In these studies, some researchers have been committed to monitoring permafrost for a long time. Zhang [8] used Sentinel-1, ENVISAT and ERS-1 data to evaluate the ground deformation of permafrost and the risk along the Qinghai-Tibet Railway (QTR) from 1997 to 2018. The results show that the estimated deformation rate ranged from −20 to +10 mm/year and most of the QTR appeared to be stable. Daout [41] used ENVISAT and Sentinel-1 data to construct the spatial and temporal dynamics of permafrost deformation in the northeastern QTP from 2003 to 2019. The results show the pervasive subsidence of the permafrost of up to ~2 cm/year, increasing by a factor of 2 to 5 from 2003 to 2019. However, because the C-Band SAR data are easily affected by the region’s vegetation and the atmosphere, the results may be affected by spatial and temporal decorrelation. The ALOS Phased Array type L-band Synthetic Aperture Rada (PALSAR) is preferred for ground subsidence monitoring in areas covered by vegetation and where there is a high rate of ground deformation [42]. Therefore, in order to improve the coherence of targets, we used L-band datasets to monitor the ground deformation of permafrost from 2007 to 2021.
The ground deformation process of permafrost is complex. With tectonic activity, erosion, and sedimentation all interacting in the QTP [43], it is difficult to accurately describe the freezing and thawing cycle of permafrost. Therefore, research has attempted to understand the deformation characteristics of permafrost. The sinusoidal model [44,45] and degree-day model [8,46] were used to describe the seasonal variation in the ground surface due to up-down deformation cycles of permafrost. However, it remains controversial which type of model is better at describing seasonal deformation [47]. To extract the temporal characteristics of permafrost directly from the SAR data, Wang [47] directly converted the network of interferograms into a deformation time series without a preset deformation model. Then, the long-term deformation velocity and seasonal deformation were extracted. However, for seasonal deformation, Wang assumed that the highest terrain elevation occurred from January to February, and the lowest elevation occurred from August to October. Wang also averaged the intra-annual deformation value. The average intra-annual deformation may smooth the features of the permafrost deformation. In addition, using prior knowledge may not be suitable for application to the QTP with spatial heterogeneity. In this study, we proposed a long-term deformation velocity and maximum seasonal deformation model without any prior knowledge to directly extract the deformation features of permafrost.
To reveal the status of the permafrost, we extracted time series deformation directly. First, we used 66 scenes of ALOS data (2007–2009), 73 scenes of ALOS-2 data (2015–2020) and 284 scenes of Sentinel-1 data (2017–2021) to reveal the spatial and temporal permafrost deformation in the northern QTP. Second, thermal collapse of permafrost was detected. Finally, we revealed the relationship between the maximum seasonal deformation and the long-term deformation velocity.

2. Study Area and Dataset

2.1. Study Area

The study area is located in the Hoh Xil region of the QTP. Hoh Xil is located in Qinghai Province, China, between Kunlun Mountain and Hoh Xil Mountain [48]. The Hoh Xil area, located at a high altitude, covers an area of approximately 2.35 × 10 5 square kilometers, with an average altitude of 5000 m [49]. The cold climate conditions make Hoh Xil a natural permafrost field. More than 90% of the land is covered by permafrost, with a thickness of 80~120 m [50]. There are a large number of glaciers and lakes. Glaciers have created a large-scale glacial erosion of mountains and produced a large number of deposits [51]. These deposits freeze and thaw repeatedly in the extremely cold environment, and are decomposed into sand of different particle sizes, to form different landscapes [52]. In addition, the ice and snow on the high mountains continue to flow into the Hoh Xil basin and finally converge in the lake [53]. Eventually, the Hoh Xil region evolved many types of landforms. The study area (Figure 1) is located in the northern part of the QTP, passing through the Tuouohe, Beiluhe, Wudaoliang and Xidatan (90.713~95.828°E, 33.981~36.197°N). The mean annual ground temperature of the study area is close to 0 °C, with elevations from 2600 to 7000 m. The annual precipitation is between 50 mm and 400 mm [54]. The typical geomorphic types include glaciers, lakes, hot melt lakes, alpine meadows, and alpine grasslands. There is a large amount permafrost and seasonally frozen soil which provides abundant opportunities for us to study the permafrost deformation.

2.2. ALOS and ALOS-2 Data

The first SAR dataset was acquired by the Japanese Advanced Land Observing Satellite (L-band Synthetic Aperture Radar ALOS PALSAR). The wavelength of ALOS PALSAR is 23.62 cm with a pixel resolution of 12.5 m and a swath of 70 km. The incidence angles range between 36° and 38°. The images correspond to the ascending orbit that is northeast-looking [55]. In this study, a total of 66 scenes of ascending stripmap mode ALOS PALSAR data along four adjacent tracks covering seven frames from 2007 to 2009, were collected in the northern QTP. The acquired ALOS data are shown in Table 1. The second SAR dataset was acquired by the Advanced Land Observing Satellite-2 (L-band ALOS-2 PALSAR-2) launched in May 2014 by the Japan Aerospace Exploration Agency (JAXA). The revisit cycle of the ALOS-2 PALSAR-2 is 14 days [56]. In this study, a total of 73 scenes of ascending ALOS-2 PALSAR-2 data along three tracks covering four frames from 2015 to 2020 were collected in the northern QTP. The acquired ALOS-2 data are shown in Table 2.

2.3. Sentinel-1 Data

Sentinel-1 is a two satellites constellation that carries C-band SAR sensors (~5.6 cm wavelength) under the Copernicus Programme coordinated and managed by the European Space Agency (ESA). Sentinel-1 data are provided to users free of charge. The revisit cycle of Sentinel-1 single satellite A or B is 12 days in all weather conditions, day and night [57]. In this study, a total of 284 scenes of descending Sentinel-1 TOPS data along two tracks covering two frames from 2017 to 2021, were collected in the northern QTP. The Sentinel-1 datasets were acquired in interferometric wide swath (IW) mode. The acquired Sentinel-1 data are shown in Table 3.

3. Methodology

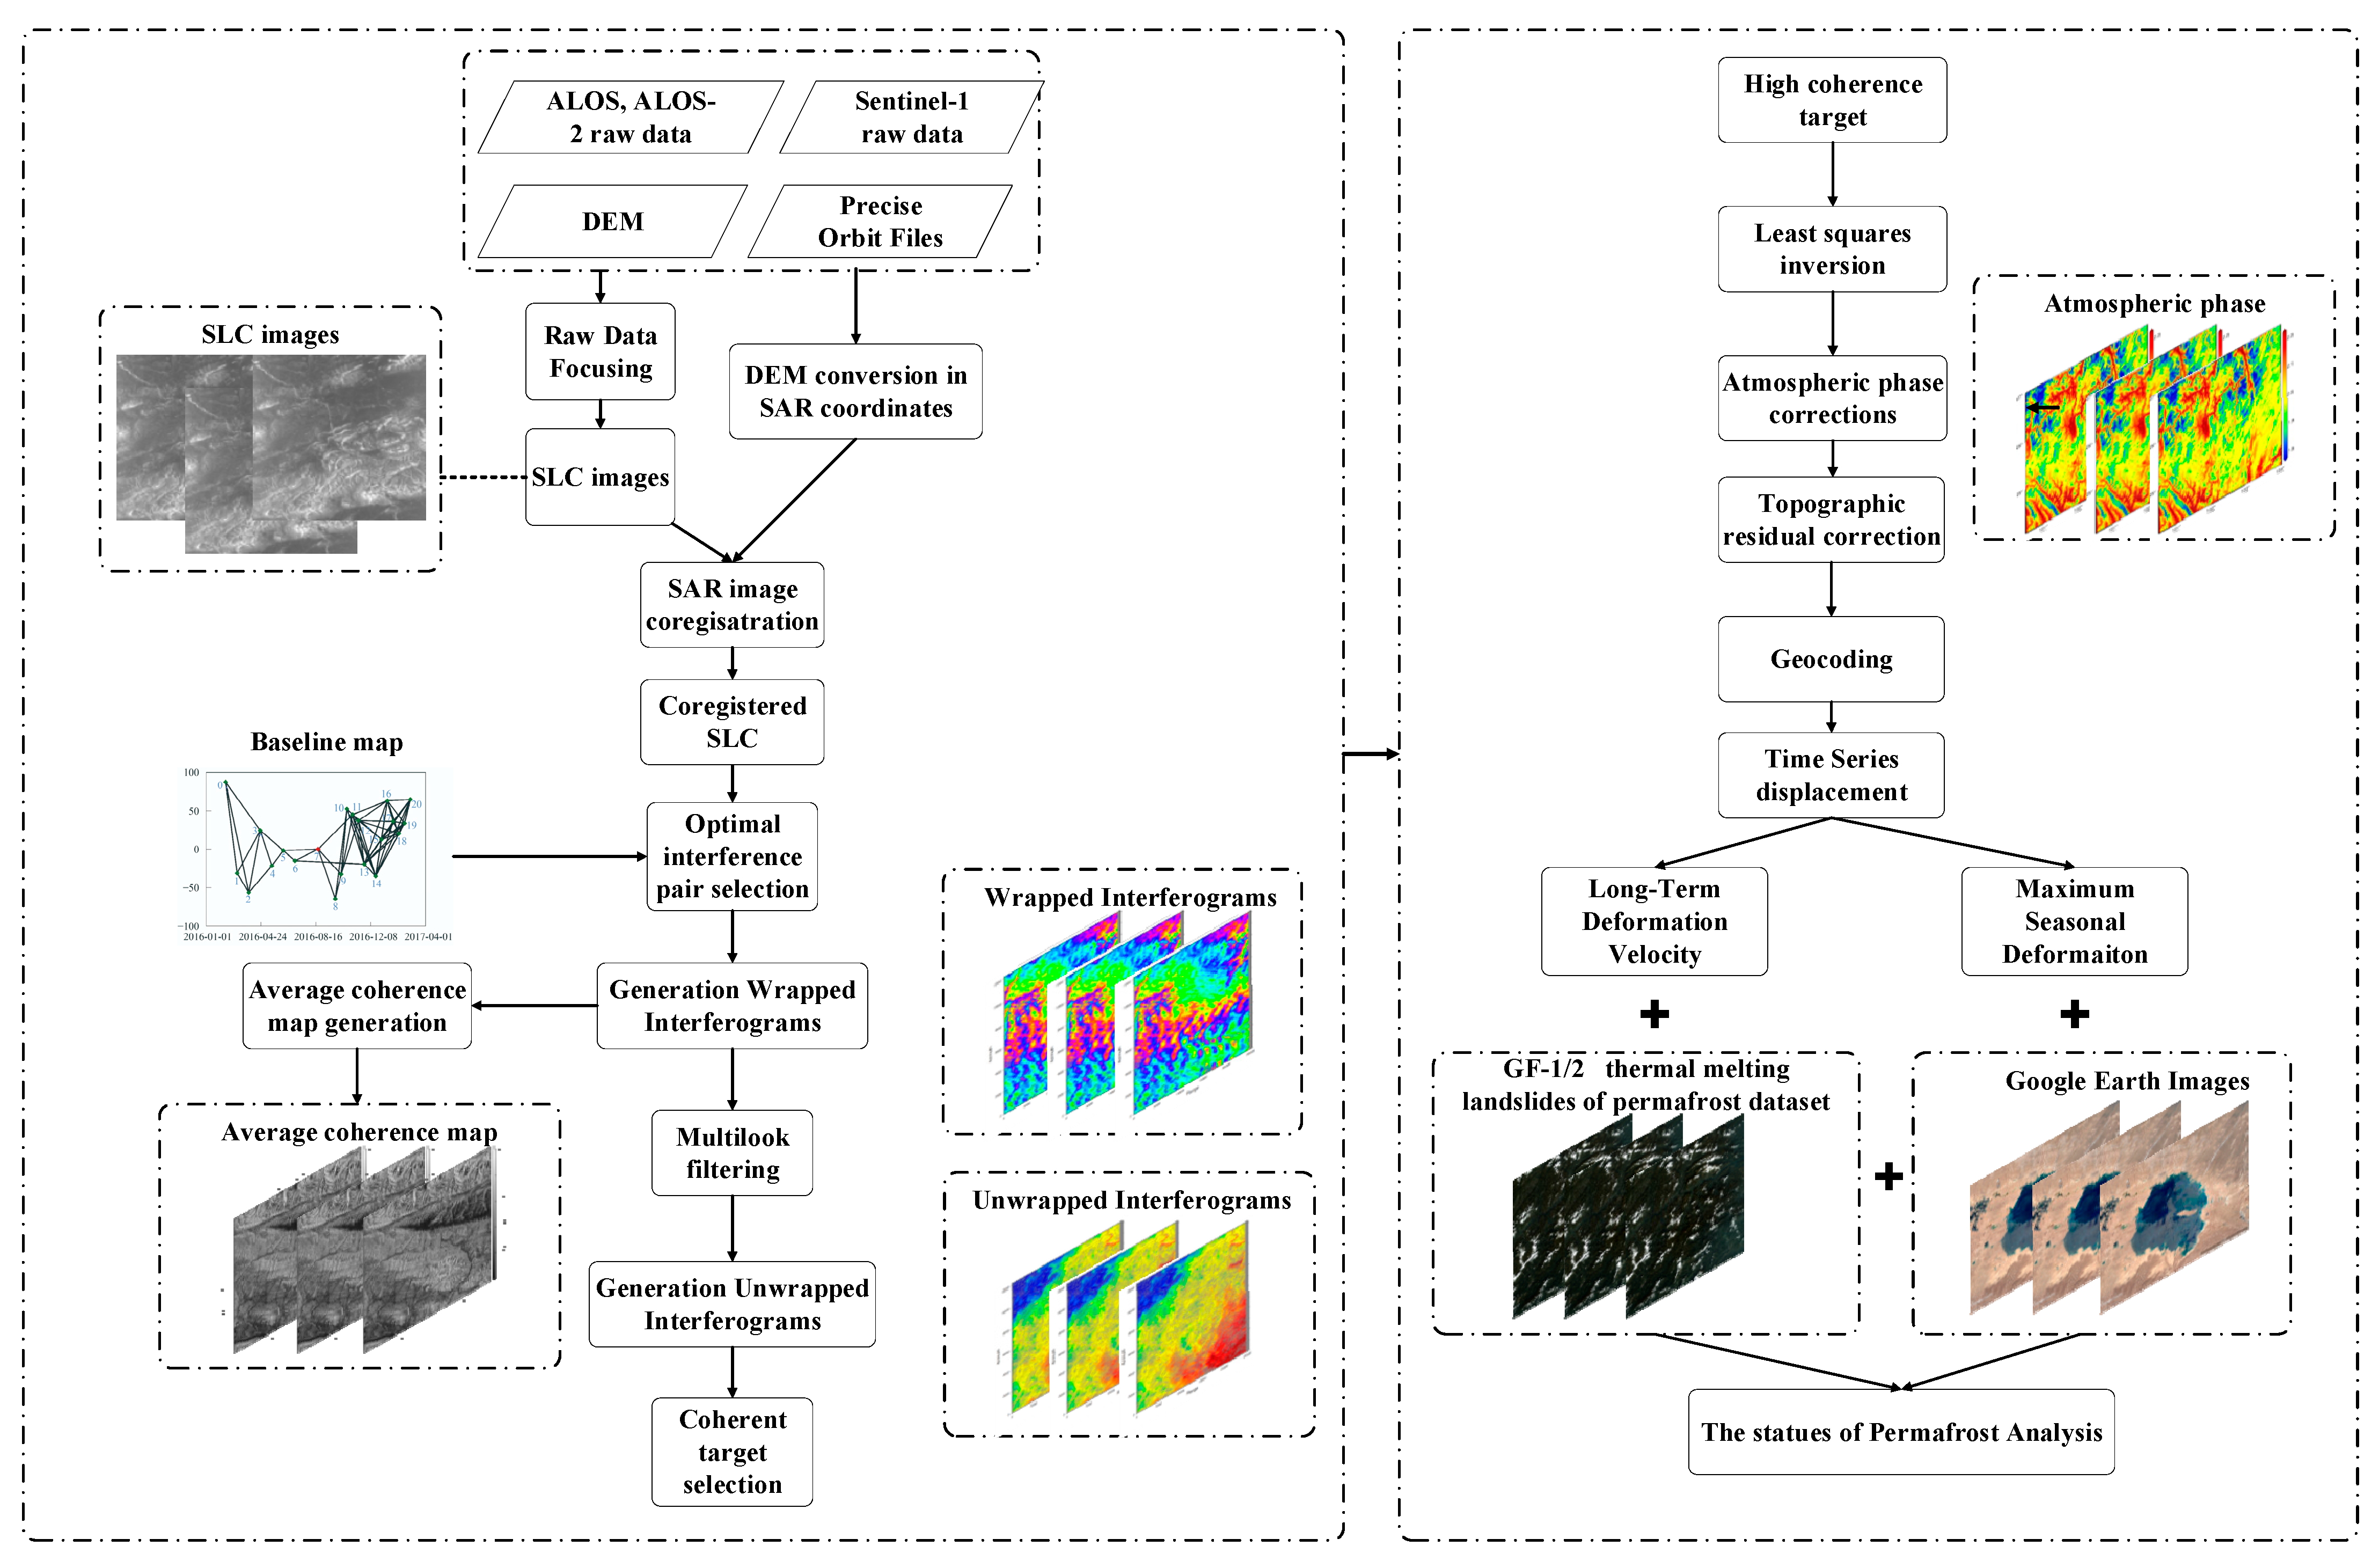
A coherence weighted least square estimator without any hypothetical model was used to calculate the long-term deformation velocity (LTDV) and maximum seasonal deformation (MSD) without any prior knowledge. The main steps are shown in Figure 2. The main steps are: (1) importing ALOS, ALOS-2 and Sentinel-1 images and images coregistration; (2) Optimal interference pair selection and interferogram generation; (3) Multilook filtering, phase unwrapping and coherent target selection; (4) Least squares inversion; (5) Atmospheric phase correction and topographic residual correction; (6) Geocoding the average deformation map and extracting the time series deformation; (7) Extracting the long-term deformation velocity and maximum seasonal deformation; and (8) Analyzing the deformation of permafrost with auxiliary data.

3.1. Interferogram and Phase Unwrapping

First, we converted raw SAR data (ALOS, ALOS-2, Sentinel-1) to SLC format and used DEM data to register the slave image with the master image. Then we selected the optimal interferometric pair by calculating the temporal and spatial baselines of the primary and secondary images. After optimal interference pair selection, the next step is to generate interferograms. In the interferogram, each point has a phase value, which contains much important information. Let us assume point P in the master and slave image. Each SAR image contains phase and amplitude information. For point P, the phase can be modeled as:
ϕ P = φ   + 4 π λ r + α + n
where φ is the original phase controlled by target scatter attributes, such as roughness and moisture, λ is the wavelength of the SAR sensor, r is the distance between the sensor and the target, α is the atmospheric phase, and n represents the noise phase. In the interferogram, for point P, the phase can be modeled as:
Δ ϕ P = Δ φ   + 4 π λ Δ r + Δ α + Δ ν
where Δ φ is the phase difference generated by the change in the target’s properties, 4 π λ Δ r is the distance difference between the two observations to point P, Δ α is the different atmospheric phase, and ν is the noise phase.
Through Equation (2), the interferogram can be generated from two registered SAR images. The range of the interferogram is −π to π. After generating the interferogram, the next step is phase unwrapping. Phase unwrapping is the process of estimating the whole phase difference between a reference pixel and other pixels. The phase unwrapping algorithm calculates the phase difference between adjacent pixels and then integrates these phase differences, which is equivalent to calculating the number of color fringes starting from the reference pixel. For most unwrapping algorithms, minimizing the residual weighting function between the estimated unwrapping phase difference and the original phase difference is used. In this study, we used a minimum cost flow (MCF) unwrapping algorithm. The phase unwrapping algorithm target is to minimize Equation (3):
i , j w i , j x Δ ϕ i , j x Δ ψ i , j x + i , j w i , j y Δ ϕ i , j y Δ ψ i , j y
Δ ψ y   is the unwrapping phase difference in the y direction and Δ ψ x is the wrapping phase difference in the x direction.
We used ISCE software (https://github.com/isce-framework/isce2, accessed on 20 March 2022) for this p;rocessing. To increase the signal-to-noise ratio, during processing, we set 14:4, 16:8 and 3:9 multilook in the azimuth and range direction for ALOS, ALOS-2 and Sentinel-1 interferograms, respectively. After the multilook processing, the spatial resolution (azimuth pixel resolution × range pixel resolution) of ALOS, ALOS-2 and Sentinel-1 was 50 m × 10 m, 5 m × 35 m and 23 m × 3 m, respectively. To accelerate the processing rate, we set 15 threads based on an Intel(R) Xeon(R) Gold 6129 CPU with 16 CPU cores for parallel processing.

3.2. Time Series Deformation Processing

After the phase unwrapping, we selected highly coherent targets (coherence > 0.7) to extract the time series deformation. Let us assume that there are N + 1 scene SAR images coregistered to the master image, and the time order is t 0 t N which can generate M interferograms. The original phase of each SAR image is   ϕ = 0 , ϕ 1 ϕ N , where we assume ϕ 0 = 0 . ϕ contains the ground deformation phase, atmospheric phase, topographic phase and noise phase. For each pixel, the model is described as:
Δ ϕ = A ϕ
where Δ ϕ represents the interferometric phase and A is the M × N − 1 coefficient matrix. In matrix A, 1 represents the master image, and −1 represents the slave image. Then, the coherence weighted least square method is used to obtain raw phase ϕ [58,59]:
ϕ ^ = a r g m i n   W 1 2 Δ ϕ A ϕ 2 = A T W A 1 A T W Δ ϕ  
The estimated original phase ϕ ^ includes the following items:
ϕ ^ = ϕ ^ d i s + ϕ ^ t r o p o + ϕ ^ g e o m + ϕ ^ r e s i d
where ϕ ^ d i s represents the ground deformation phase, ϕ ^ t r o p o represents the atmospheric phase, ϕ ^ g e o m represents the topographic phase, and ϕ ^ r e s i d represents the residual phase. W is a M × M diagonal weight matrix:
W = diag 2 L γ 1 2 1 γ 1 2 , , 2 L γ M 2 1 γ M 2
γ j 2 = 1 σ Δ ϕ j 2
where σ Δ ϕ j 2 is the phase variance of the jth interferogram calculated through the integration of the phase probability distribution function and L is the number of looks. After the raw phase is calculated by the least squares method, the displacement time series can be obtained:
ϕ ^ d i s = ϕ ^ ϕ ^ t r o p o ϕ ^ g e o m ϕ ^ r e s i d
For atmospheric phase removal, global atmospheric models (GAMs), particularly ERA5, have great potential in atmospheric phase screen (APS) correction for InSAR applications on the Tibetan plateau [60]. The ERA5 model has been successfully applied in the APS correction in the QTP [41,47,54]. Therefore, in this study, we used ERA-5 reanalysis data to estimate the tropospheric delay [61]. For the topographic residual correction, the topographic phase residual caused by a DEM error was estimated based on the proportionality with the perpendicular baseline time series [62]:
ϕ ^ i ϕ ^ t r o p o i = 4 π λ B i r s i n θ z ε + k = 0 2 c k t i t 1 k k ! + l ϵ I s s l H t i t 1 + ϕ r e s i d i
where B i is the perpendicular baseline, θ is the incidence angle, H t i t 1 is a Heaviside step function and z ε , c k and s l are the unknown parameters, which can be estimated by minimizing the L 2 -norm of the residual phase. The time series deformation processing was implemented by MintPy (https://github.com/insarlab/MintPy, accessed on 20 March 2022) [63].

3.3. Long-Term Deformation Velocity and Maximum Seasonal Deformation

We can extract two import indices from the time series deformation: long-term deformation trend and maximum seasonal deformation. The long-term deformation may be used to describe the water storage in the active layer. The maximum seasonal deformation describes the active layer thickness. These two indices were obtained by direct calculation without any assumed model. Wang [47] used the intra-annual highest-lowest terrain elevation difference to represent the intra-annual seasonal deformation after extracting and separating the linear trend from the deformation time series. Wang used prior knowledge and assumed that the highest terrain elevation occurred from January–February, and the lowest elevation occurred from August to October. In addition, the averaged value was used for the final intra-annual deformation value. The average intra-annual deformation may smooth the features of the permafrost deformation. In addition, using prior knowledge may not be suitable for application to the QTP with spatial heterogeneity. The long-term linear trend velocity can be modeled as:
D t = D t v · t
where D t is the time series deformation,   t is the temporal span of image acquisition dates away from the first acquisition date, v   is the long-term linear trend velocity, and D t is the deformation time series minus the long-term linear trend. The maximum seasonal deformation can be modeled as:
m s d = m a x i ϵ T D m a x D m i n
where D m a x is the highest terrain elevation in year i and D m i n is the lowest terrain elevation in year i. T is the number of years spanned by the observation period.

4. Results and Analysis

4.1. Long-Term Deformation and Time Series Deformation in the Northern QTP

The coherence weighted least squares method with 66 scenes of ALOS data (2007–2009), 73 scenes of ALOS-2 data (2015–2020) and 284 scenes of Sentinel-1 data (2017–2021) was used to retrieve the permafrost deformation in the northern QTP. The results illuminate on a large scale the permafrost deformation in the northern QTP from 2007 to 2021. The ground deformation results are shown in Figure 3
In Figure 3, the red color indicates the subsidence in the LOS direction, and the blue color is the uplift toward the satellite. There are a large number of lakes (deep blue color) in the western part of the study area. From the three different deformation maps obtained by using three different SAR sensors, we find that the long-term deformation velocity in the northern QTP ranges from −20 to +20 mm/year (ALOS, 2007–2009), −30 to 15 mm/year (ALOS-2, 2015–2020), and −25 to 30 mm/year (Sentinel-1, 2017–2021). Further study shows that the expansion areas of permafrost subsidence are concentrated on braided stream plains and thermokarst lakes. In these areas, due to glacial erosion, surface runoff and river alluvium, the contents of water and ground ice are sufficient, which could accelerate permafrost subsidence.
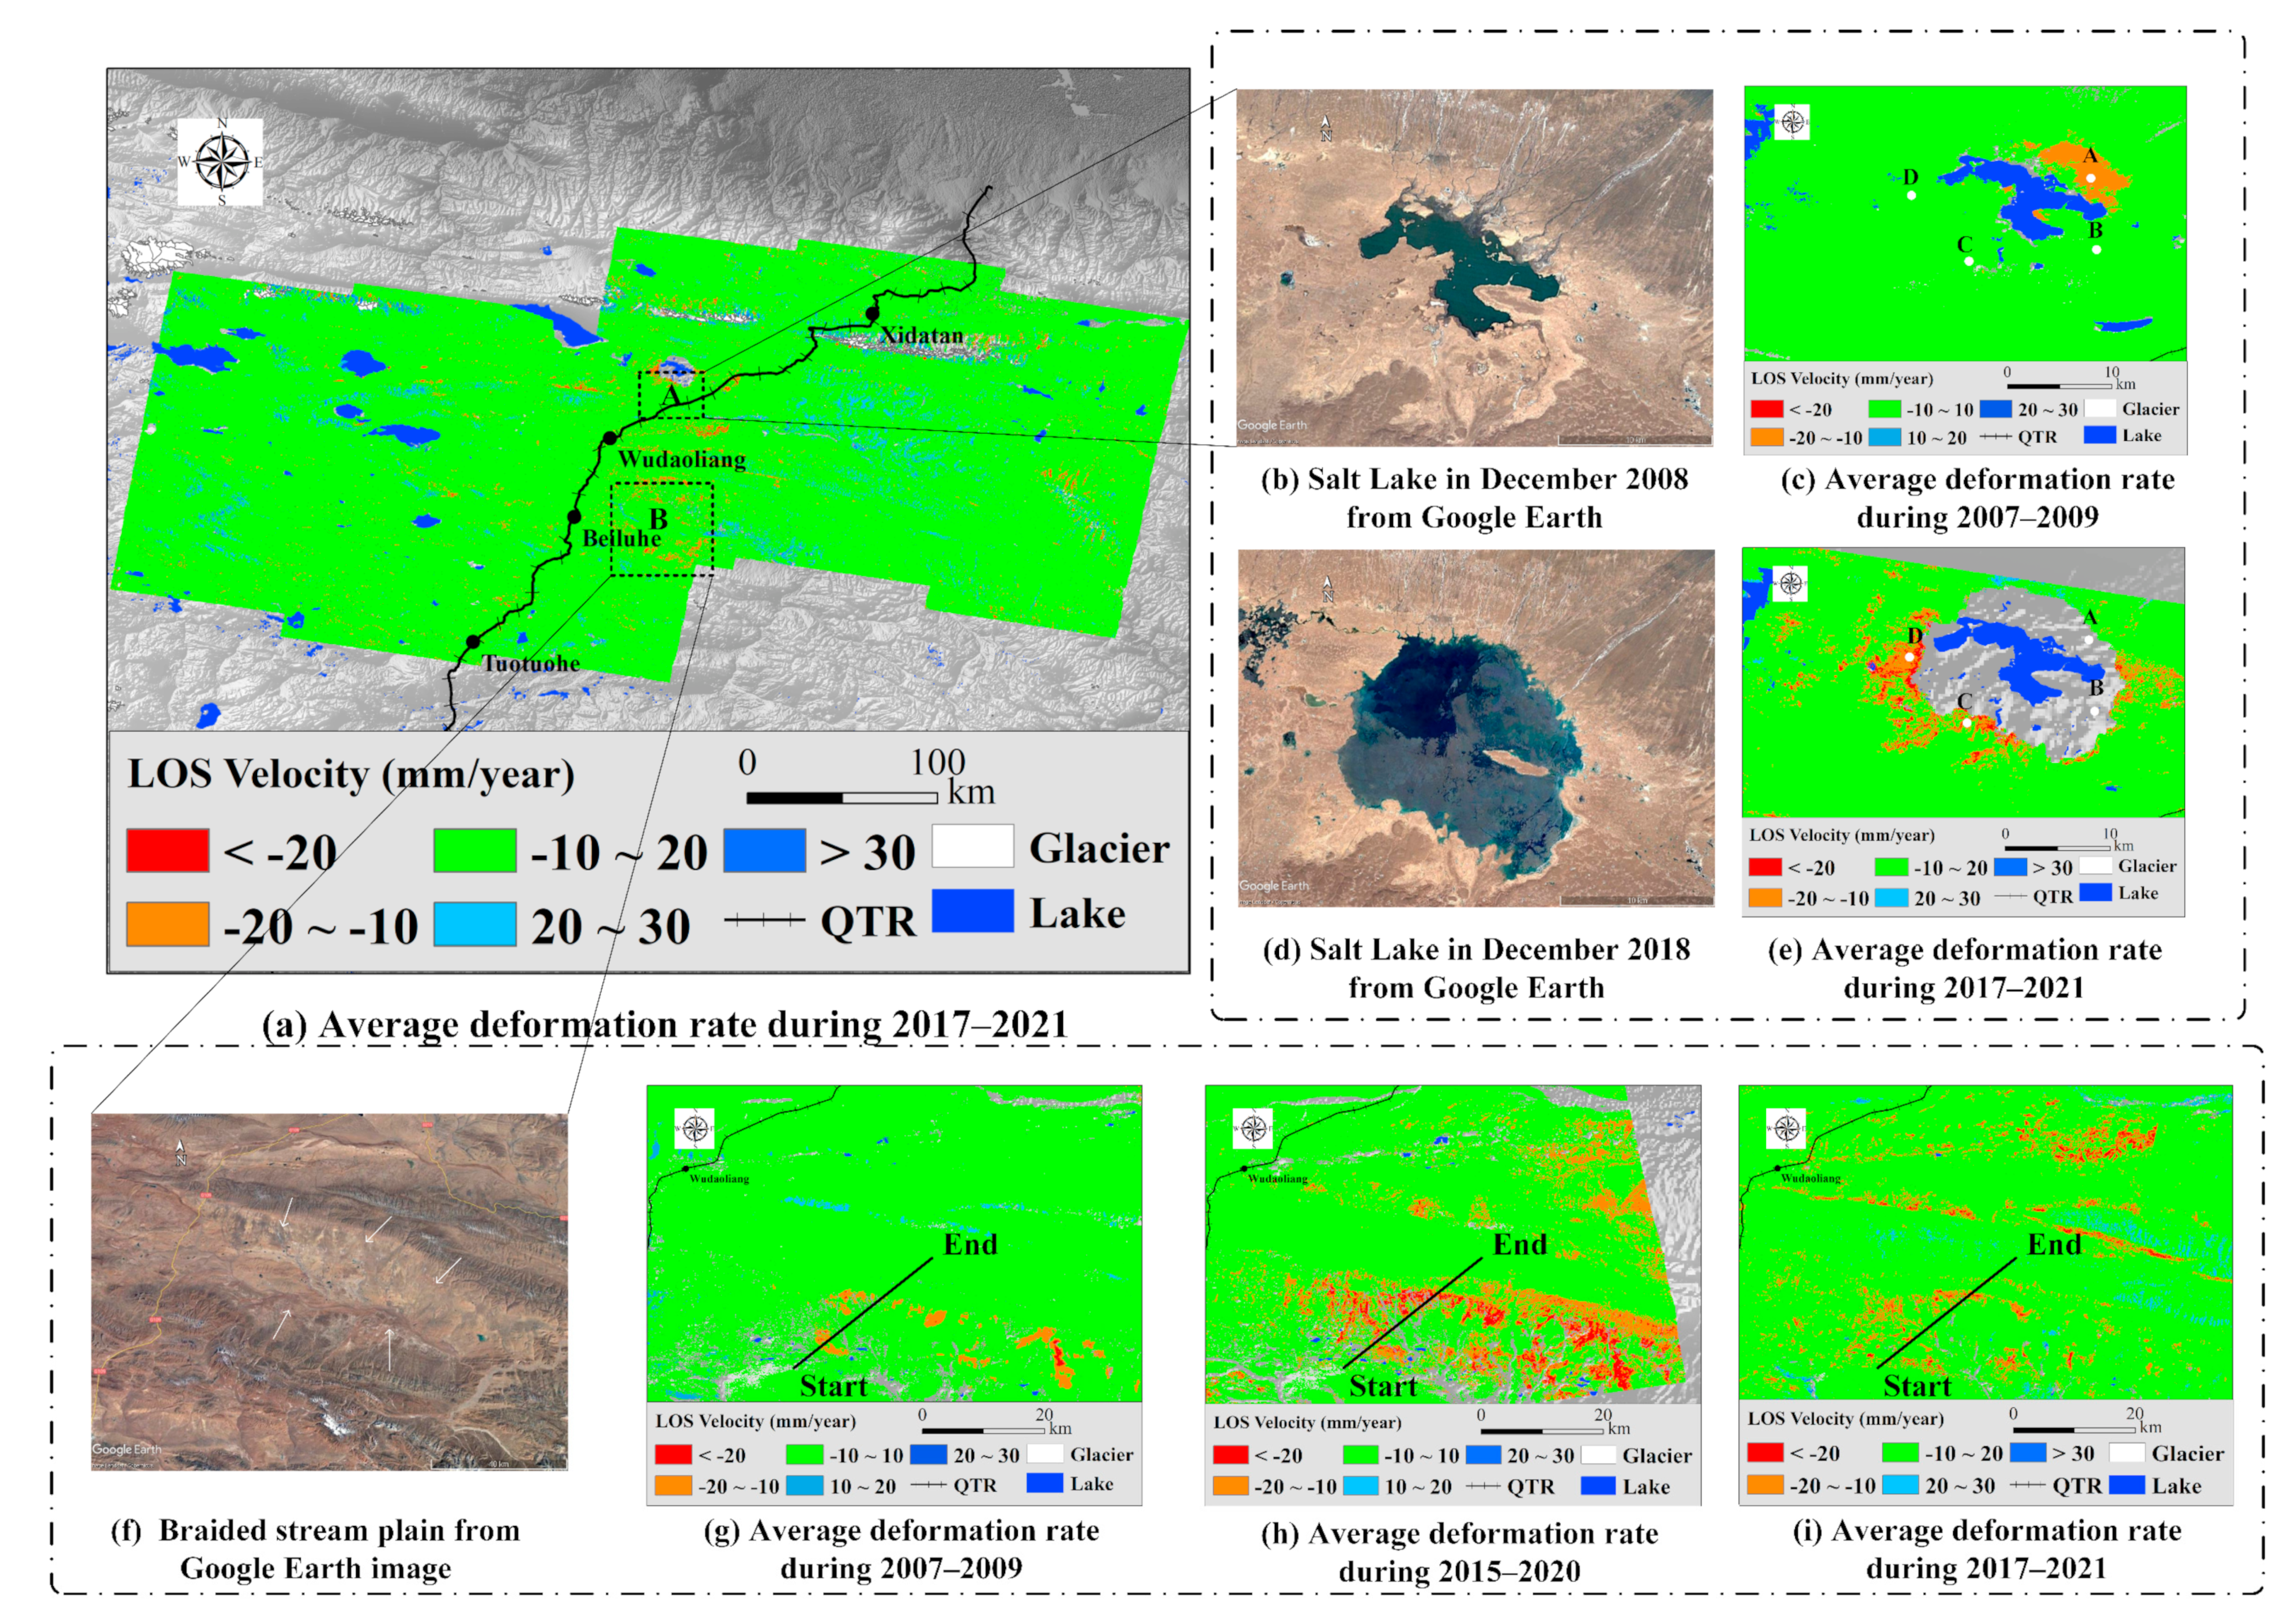
In Figure 4a, we selected two typical areas, Salt Lake and a braided stream plain. Salt Lake (35.532°N, 93.409°E) is located in the northeastern section of Hoh Xil (Kekexili) in the QTP. The water of Salt Lake mainly comes from seasonal rivers. On 14 September 2011, Zonag Lake burst its banks, which caused the area of Salt Lake to expand significantly. The outburst of Zonag Lake could affect the freeze-thaw behavior of the surrounding permafrost. We used Google Earth images to show the historical expansion of Salt Lake (Figure 4b,d). From the different period images, we find that the Salt Lake experienced significant expansion and that the distance from Salt Lake to the QTR is decreasing. Figure 4c shows the result processed from stacks of ascending ALOS datasets from 2007 to 2009. The red color indicates ground deformation away from the satellite. We find that the degradation of the permafrost mainly occurred in the northeast direction. This may be due to the existence of glaciers and braided stream plains in northeast of Salt Lake. Glaciers have created a large-scale glacial erosion of mountains, resulting in a large number of deposits. In addition, with sufficient moisture, the effect of thawing processes is stronger than that of freezing processes. This could increase the thickness of the active layer. Figure 4d shows the result processed from stacks of descending Sentinel-1 datasets from 2017 to 2021. Similarly, the red color represents the subsidence along the LOS direction. Compared with the 2007–2009 result and 2017–2021 result, the area of permafrost degradation is expanding. We used ArcMap software to analyze the temporal and spatial changes in the permafrost within a 30-km rectangle around Salt Lake. The calculation result shows an increase of 51.7 km2 areas (deformation rate > 10 mm/year) within the analysis rectangle after the outburst of Zonag Lake in 2011. The second landscape example is a braided stream plain (34.8791°N, 93.1845°E). We used Google Earth image to show the spatial properties of the braided stream plain (Figure 4f). This braided stream plain is surrounded by glaciers in the north, south and east. The terrain in the west is relatively low. There are many lake tributaries in this area. The surrounding glaciers provide many water resources for the braided stream plain. With sufficient moisture, the permafrost may undergo degradation. To illuminate the freeze-thaw cycle of permafrost, we used the ALOS, ALOS-2 and Sentinel-1 datasets to map the ground deformation of permafrost around the braided stream plain from 2007 to 2021. The results are shown in Figure 4g–i.
To further study the time series deformation of permafrost around Salt Lake, we selected four points (Figure 4c). The details for these points are provided in Table 4. A 25 km profile (Figure 4g) was selected to reveal the relationship between the permafrost deformation and the elevation.
Figure 5a,b shows the long-term deformation trend deformation of selected points around Salt Lake. From March 2007 to April 2008, the four points could balance the freeze-thaw process. However, from July 2009 to March 2010, point A breaks the cycle, and the ability to thaw is stronger than the ability to freeze, which may increase the thickness of the active layer. From Figure 5b and Table 3, at point C, the average uplift deformation from 2007 to 2008 changed into the average subsidence deformation from 2017 to 2021. At point D, the results reveal that the subsidence of the ground increased 10 times from 2007 to 2021. From Figure 5c, we find that there is a negative correlation between the subsidence and the elevation. This may be due to the melting of glaciers around the braided stream plain, resulting in a large amount of water, accumulating on the slope. Finally, the thickness of the permafrost active layer is increased, which causes permafrost degradation.
In the freezing and thawing process of permafrost, the moisture in permafrost can move and change, which may cause rock damage, ground deformation and thawing disasters. The sudden thawing of permafrost may lead to environmental disasters, such as ground collapse and rapid erosion. The thawing mud flow of the permafrost occurs on the slope of the permafrost. In summer, the thawing of the active layer could not flow downslope due to the existence of permafrost, resulting in abundant water in the active layer. Under the condition of excessive moisture, the permafrost creeps downward along the slope, resulting in the thermal melting collapse. We combined optical data (GF-1, GF-2) [64] to reveal the thermal melting collapse of permafrost.
In Figure 6a, the red color indicates the positions of thermal melting collapse, which were generated from 2019–2020 GF-1/2 data. In Figure 6bc, the red color indicates the subsidence in the LOS direction. In Figure 6b, we used the ALOS-2 dataset to reveal the thermal melting collapses of permafrost from 2015 to 2020. The result shows that L-band ALOS-2 can effectively detect the location of thermal melting collapses. The result shows spatial consistency with the GF-1/2 datasets. Compared with the ALOS-2 results, C-band Sentinel-1 rarely detected the location of thermal melting collapses. The results show that the ALOS-2 data can detect displacement that cannot be detected by C-band sensors. To reveal the relationship between the time series deformation and the thermal melting collapses. We selected four points and plotted the time series deformation. The details of the four points are provided in Table 5.
From Table 5, from 2015 to 2020, the L-band ALOS-2 result is different from the C-band Sentinel-1 result. For the ALOS-2 result, the permafrost under points A, B and C is undergoing subsidence. The Sentinel-1 result shows that the permafrost is still stable. Due to the different observation periods of the two sensors, ALOS-2 has a longer observation period. In addition, results are also affected by the internal characteristics of the sensor, such as wavelength and incident angle.

4.2. Long-Term Deformation Velocity and Maximum Seasonal Deformation in the Northern QTP

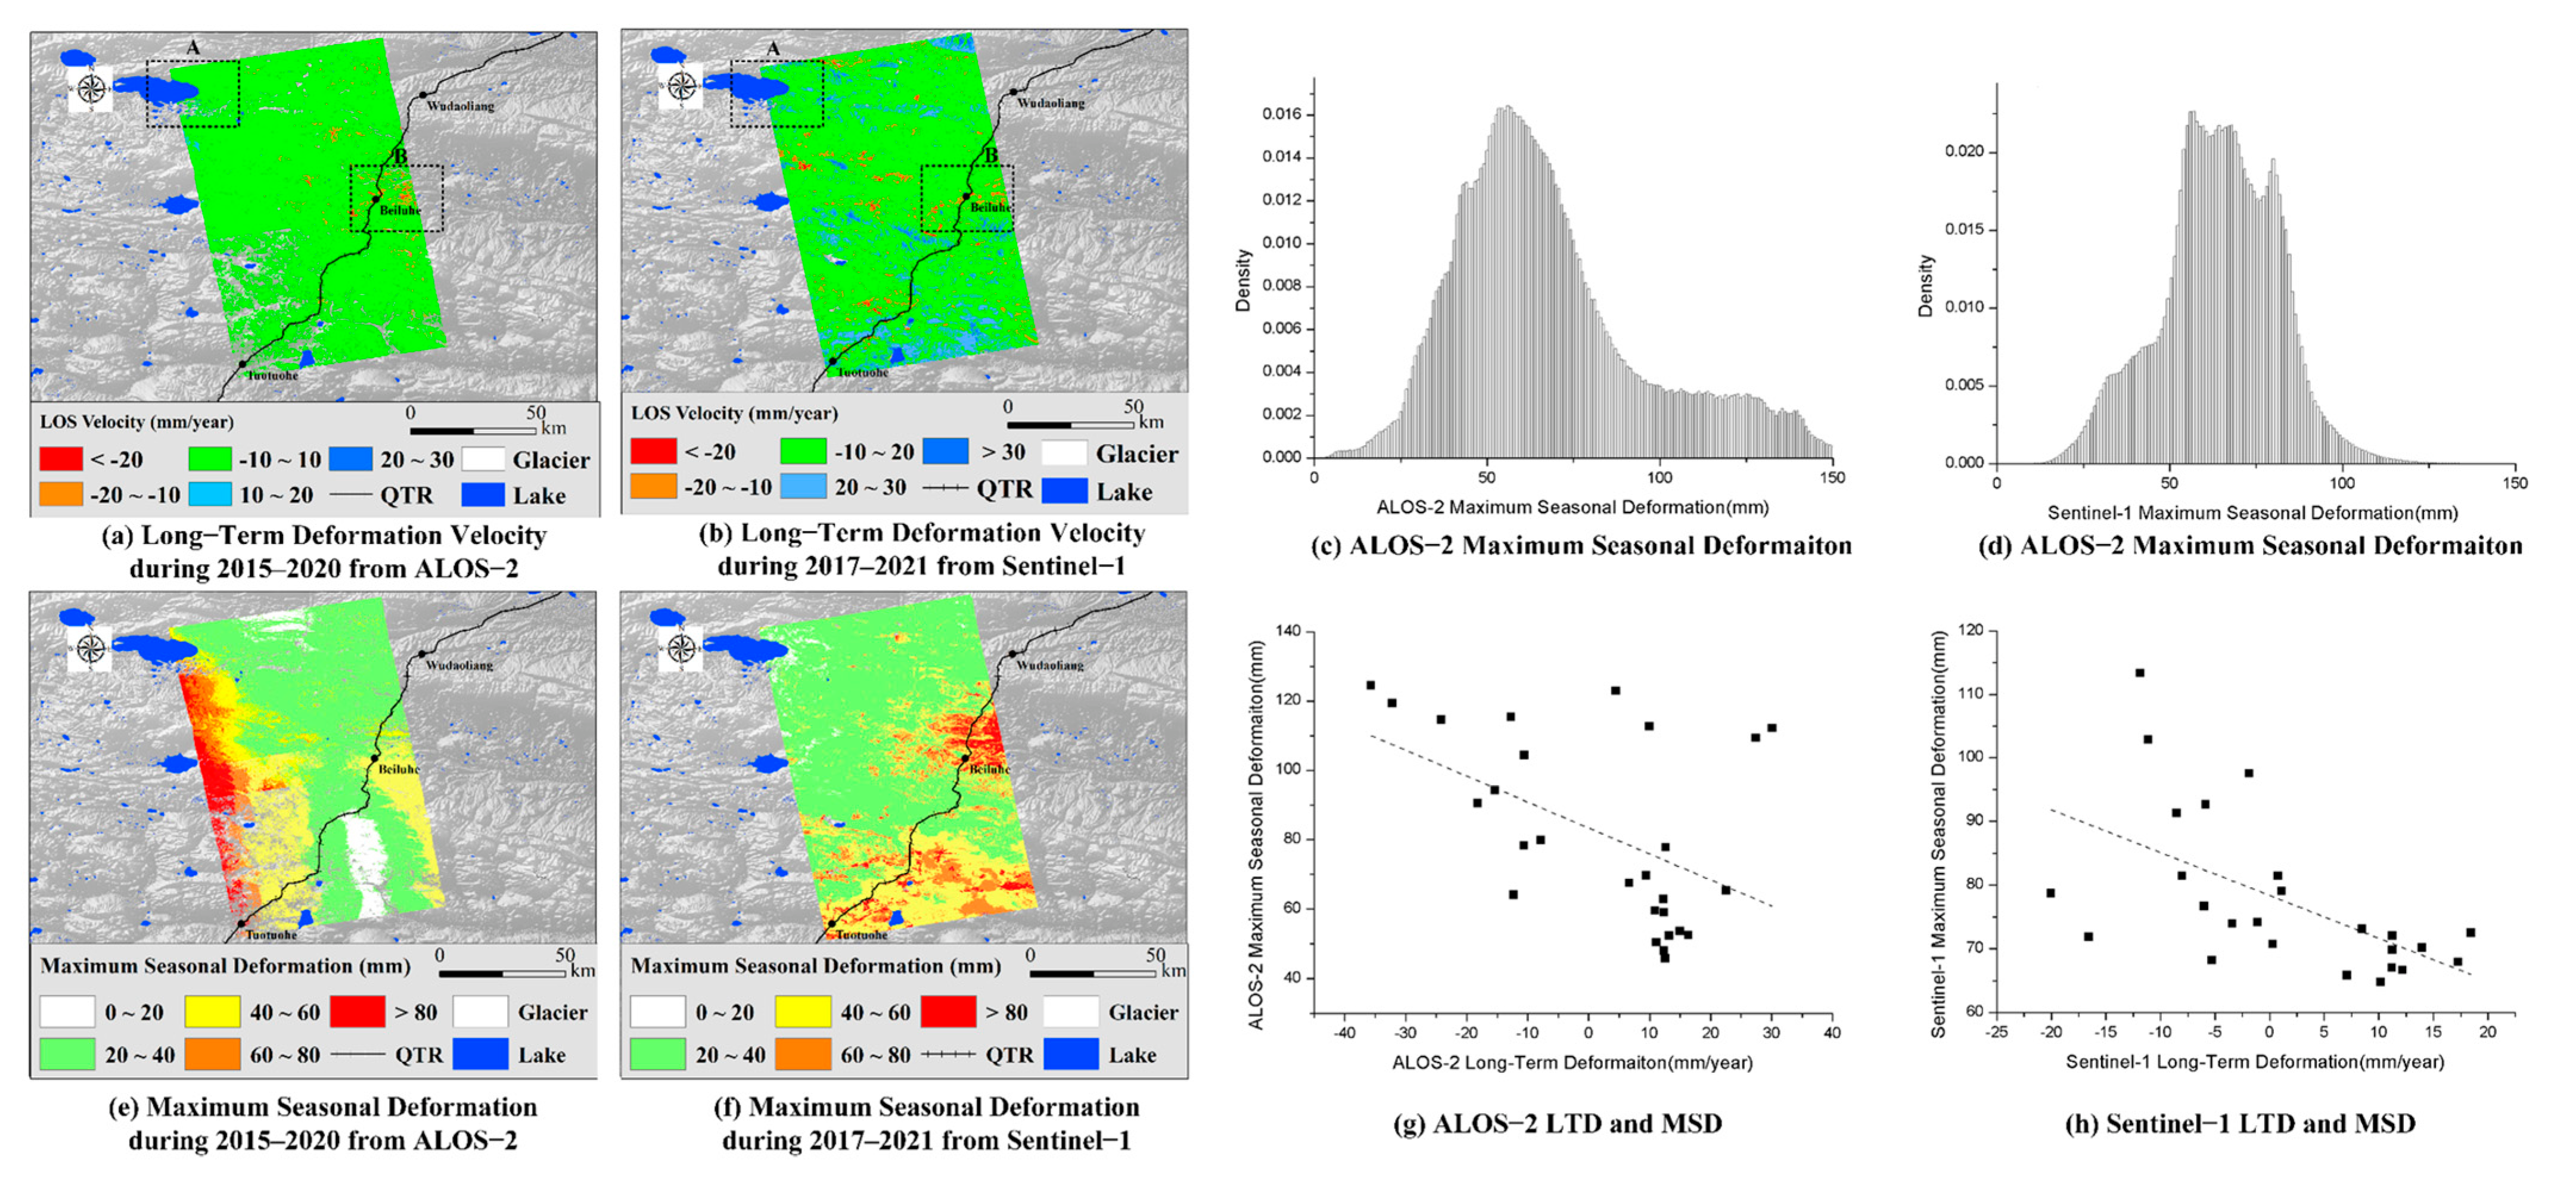
After determining the time series deformation derived from the raw phase, the long-term deformation trend and maximum seasonal deformation magnitude can be calculated. The spatial distributions of the maximum seasonal deformation magnitude are shown in Figure 7.
Due to the limitation of the revisit period of ALOS data, we calculated the long-term deformation velocity (Figure 7a,b) and the maximum seasonal deformation (Figure 7e,f) of ALOS-2 and Sentinel-1 data. The experimental results show that the average maximum seasonal deformation of the two sensors is 66 mm. As shown in Figure 7a,b,e,f, the area with large maximum seasonal deformation may tend to undergo strong subsidence and uplift. From the ALOS-2 result, the average maximum seasonal deformation during 2015–2020 is 68.74 mm. According to the Sentinel-1 result, the average MSD during 2017–2021 is 64.85 mm. The areas with high MSD are mainly concentrated in glacier outwash plains and braided stream plains. We selected two typical areas, A and B. The upper left of study area A is located in Duoergai Co Lake, surrounded by glaciers to the north. The MSD is large, which may be due to glacial erosion. A large amount of ice deposits is brought to low-lying areas, affecting the water storage capacity and ice melting capacity of permafrost. In addition, a large MSD occurred in thermal karst landforms, such as area B, which is characterized by the formation of hot melt lakes and proglacial lakes. Due to the thermal influence of underground ice in the permafrost, the land shrinks and settles, and finally melted water flows along the groove of the slope. In addition, we reveal the relationship between the maximum seasonal deformation and the long-term deformation velocity. From Figure 7g,h, there is a weak correlation between MSD and LTD, with coefficients of determination ( R 2 ) [65] of 0.208 for ALOS-2 and 0.301 for Sentinel-1. This shows that the relation between MSD and LTD is not simply linear and is related to geomorphic types, moisture, ice and other factors.

5. Discussion

To evaluate the permafrost deformation in the northern QTP, we compared other studies that are shown in Table 6.
Xie et al. [66] used the PSI technique with Envisat datasets to reveal the ground deformation in Beiluhe. The result shows that the average deformation from 2003 to 2007 was −20~3 mm/year. Chen [67] used multisource datasets (ALOS and Envisat) based on the IPTA and SABS techniques to illuminate the displacement of permafrost in Beiluhe. The result shows that the average displacement is −20~20 mm/year. Chen et al. [28] found that the average deformation of permafrost in Beiluhe is −25~10 mm/year by using the SBAS method with ALOS data. From 2014 to 2020, Li et al. and Wang et al. [68] used the MT-InSAR method to research the deformation of permafrost in the QTP. Li et al. [69] found that the average deformation in Yangbaijin ranged from −30 to 10 mm/year from 2014 to 2015. Wang et al. [54] used Sentinel-1 data based on NSBAS to reveal the deformation of the whole QTP. The result shows that the average deformation rate is −20~20 mm/year. Zhang et al. [8] used three different sensor datasets (ERS-1, Envisat and Sentinel-1) to reveal the freeze-thaw cycle of permafrost in Wudaoliang and Tuouohe from 1997 to 2008. The result shows that the average deformation rate ranges from −20 to 10 mm/year. From the above related research, our results are consistent with the previous results.
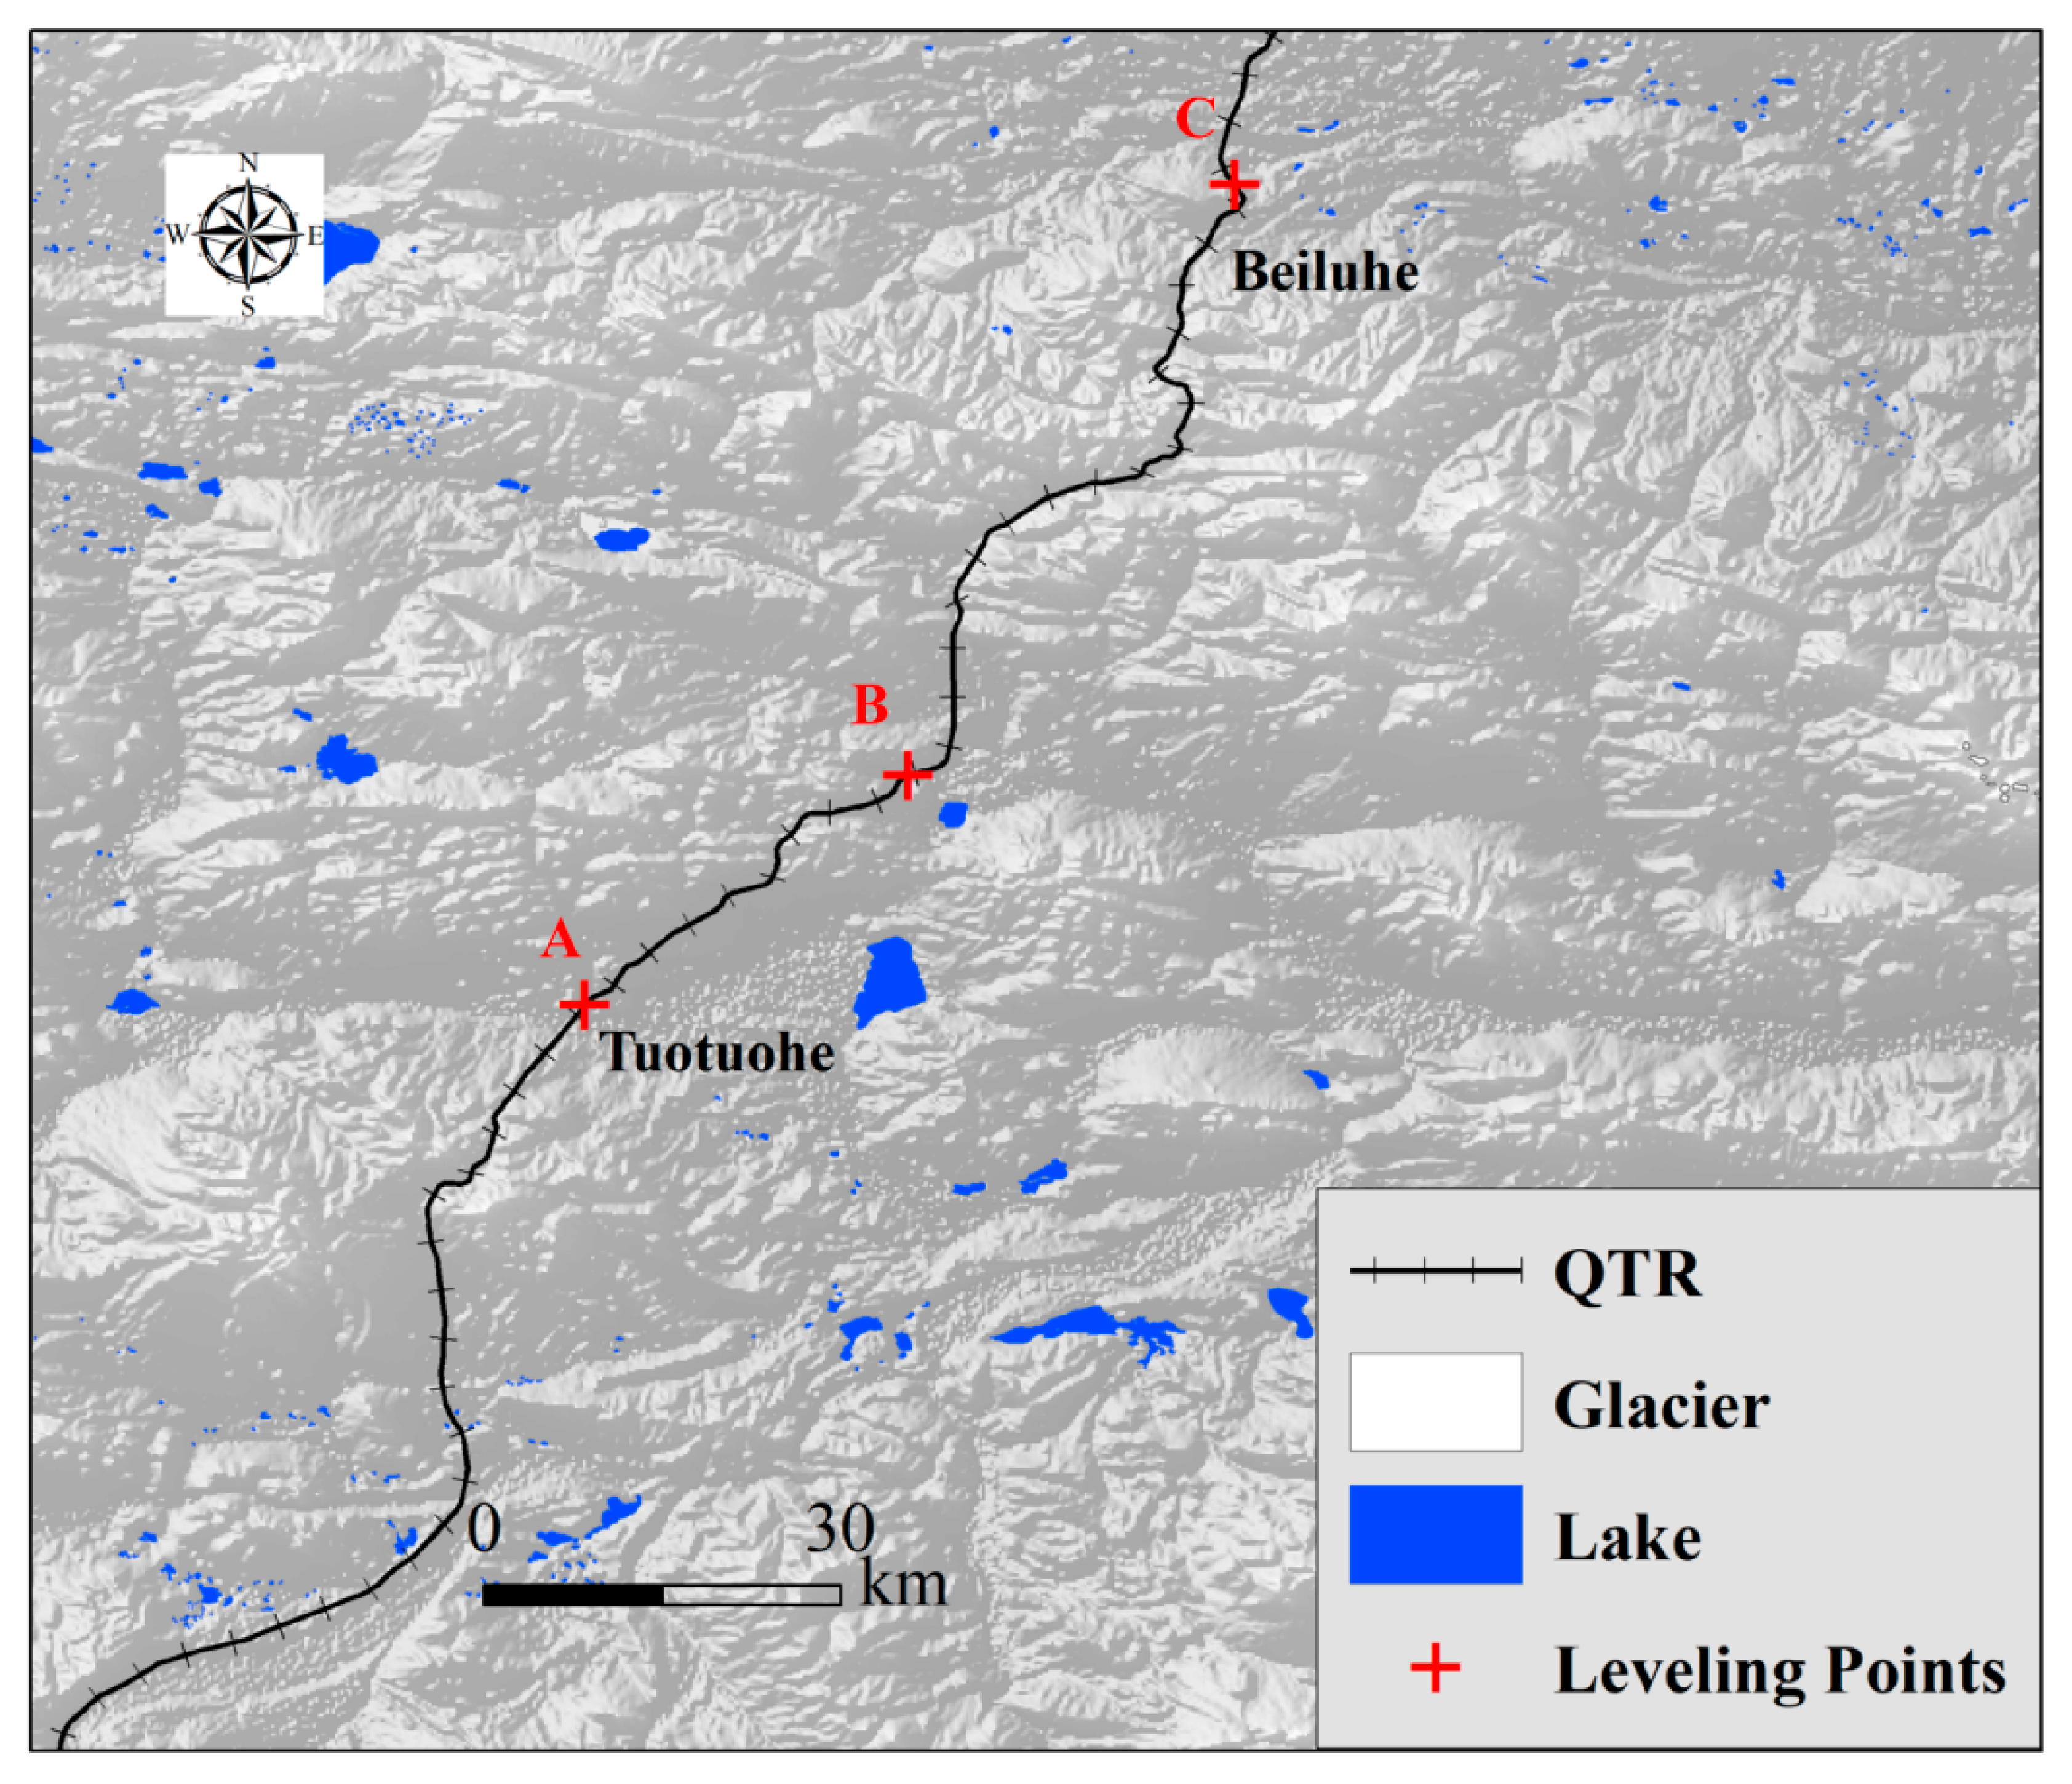
In addition, to evaluate the accuracy of the SBAS-InSAR results in this paper, we used leveling data from other researchers in the QTR [70]. The locations of the three leveling points are shown in Figure 8. The elevations of the three leveling points were collected on 9 January 2018, and 11 February 2018. The deformation results of 3 January 2018 and 8 February 2018, were extracted from 150-475 (Path-Frame) Sentinel-1 InSAR results. In order to ensure the accuracy, we convert the leveling results to the displacement of the LOS direction based on the radar incident angle. The comparison between the InSAR experiment results and the leveling results of A, B and C is shown in Table 7. Table 7 shows that the absolute errors of the leveling data and InSAR measurements at points A, B and C were 3.1, 5.7 and 6.8 mm, respectively, which were relatively small.
Through a comparison with previous studies and leveling data, this paper provides a theoretical basis and data support for the study of permafrost evolution. However, there are some limitations in our study. First, there are some errors in the InSAR processing, such as orbit errors, unwrapping phase errors, residual topographic errors, and ERA5 APS correction errors. These errors may lead to incorrect permafrost deformation. Second, from 2010 to 2015, due to the lack of data, we have no ability to monitor the deformation of permafrost in the QTP during this period. In the future, we will combine more SAR data and auxiliary data to help us better understand the freeze-thaw cycle and degradation of permafrost in the QTP.

6. Conclusions

In this study, we used 66 scenes of ALOS data (2007–2009), 73 scenes of ALOS-2 data (2015–2020) and 284 scenes of Sentinel-1 data (2017–2021) based on SBAS-InSAR to reveal the spatial and temporal deformation of permafrost in the northern QTP, passing through the Tuotuohe, Beiluhe, Wudaoliang and Xidatan regions between 2007 and 2021. In addition, a coherence weighted least squares estimator without any hypothetical model was used to calculate the long-term deformation velocity (LTDV) and maximum seasonal deformation (MSD) without any prior knowledge. The conclusions are summarized as follows:
  • Analysis of the ALOS results shows that the LTDV ranged from −20 to +20 mm/year during 2007–2009. For the ALOS-2 and Sentinel-1 results, the LTDV ranged from −30 to 30 mm/year during 2015–2021. Over a 15-year observation period, permafrost degradation is accelerating. The expansion areas of permafrost degradation are concentrated on braided stream plains, thermokarst lakes and glacier outwash plains. In addition, the high MSDs are mainly concentrated in glacier outwash plains and braided stream plains, which may be due to glacial erosion and a large amount of ice deposits brought to low-lying areas, affecting the water storage capacity and ice melting capacity of permafrost.
  • For the geological disaster of thermal melting collapses, we compared the permafrost monitored by the L-band and the C-band sensors. The results show that the L-band ALOS-2 is more sensitive to the thermal collapses of permafrost than C-band sensor, and the detected collapse areas (LTDV < −10 mm/year) are consistent with the GF-1/2 thermal collapses dataset.
  • We extracted the time series deformation directly from the interferograms without a preset deformation model. The long-term deformation velocity (LTDV) and maximum seasonal deformation (MSD) were calculated from time series deformation without any prior knowledge, demonstrating that our methods can be effectively used to extract the deformation features of permafrost.
In the future, more SAR datasets and auxiliary datasets will be used to illuminate the freeze-thaw cycle and retrieve the active layer thickness on the QTP on a large scale.

Author Contributions

Conceptualization, L.Z., C.W. and Y.T.; formal analysis, L.Z.; methodology, L.Z. and C.W.; software, L.Z., H.Z., B.Z. and L.D.; validation, L.Z., C.W. and Y.T.; writing—original draft, L.Z.; writing—review and editing, C.W.; Y.T. and H.Z.; visualization, L.Z.; supervision, C.W.; project administration, H.Z.; funding acquisition, C.W. All authors have read and agreed to the published version of the manuscript.

Funding

This paper was funded by the National Natural Science Foundation of China, Grant No. 41930110.

Data Availability Statement

ALOS is provide by JAXA and available from the Alaska Satellite Facility (ASF) (https://vertex.daac.asf.alaska.edu, accessed on 14 February 2022). ALOS-2 data is provided and available from JAXA EORA2 program. Sentinel-1 data is provided by the European Space Agency (ESA) and available from the Alaska Satellite Facility (ASF) (https://vertex.daac.asf.alaska.edu, accessed on 14 February 2022). GF-1/2 is provided by the National Tibetan Plateau Data Center and available from National Tibetan Plateau Data Center (http://data.tpdc.ac.cn, accessed on 14 February 2022). SRTM DEM data is available at https://srtm.csi.cgiar.org/srtmdata/, accessed on 14 February 2022.

Acknowledgments

The authors would like to thank JAXA EORA2 program (project id: ER2A2N030) and its ALOS, ALOS-2 data, NASA, CGIAR-CSI for SRTM DEM data, ESA for Sentinel-1 data and National Tibetan Plateau Data Center for GF-1/2 data. Profs. Qingbai Wu, Ji Chen, Jing Luo and Beiluhe Permafrost Station of the Northwest Institute of Eco-Environment and Resources of CAS, and Drs. Fan Wu and Lu Xu of our team are acknowledged for helpful discussion and field support.

Conflicts of Interest

The authors declare no conflict of interest.

References

  1. Ma, Y.; Wang, Y.; Wu, R.; Hu, Z.; Yang, K.; Li, M.; Ma, W.; Zhong, L.; Sun, F.; Chen, X. Recent Advances on the Study of Atmosphere-Land Interaction Observations on the Tibetan Plateau. Hydrol. Earth Syst. Sci. 2009, 13, 1103–1111. [Google Scholar] [CrossRef] [Green Version]
  2. Liu, X.; Sun, H.; Miao, Y.; Dong, B.; Yin, Z.-Y. Impacts of Uplift of Northern Tibetan Plateau and Formation of Asian Inland Deserts on Regional Climate and Environment. Quat. Sci. Rev. 2015, 116, 1–14. [Google Scholar] [CrossRef]
  3. Hu, G.-R.; Li, X.-Y.; Yang, X.-F. The Impact of Micro-Topography on the Interplay of Critical Zone Architecture and Hydrological Processes at the Hillslope Scale: Integrated Geophysical and Hydrological Experiments on the Qinghai-Tibet Plateau. J. Hydrol. 2020, 583, 124618. [Google Scholar] [CrossRef]
  4. Zhai, P.; Yu, R.; Guo, Y.; Li, Q.; Ren, X.; Wang, Y.; Xu, W.; Liu, Y.; Ding, Y. The Strong El Niño of 2015/16 and Its Dominant Impacts on Global and China’s Climate. J. Meteorol. Res. 2016, 30, 283–297. [Google Scholar] [CrossRef]
  5. Șerban, R.-D.; Jin, H.; Șerban, M.; Luo, D.; Wang, Q.; Jin, X.; Ma, Q. Mapping Thermokarst Lakes and Ponds across Permafrost Landscapes in the Headwater Area of Yellow River on Northeastern Qinghai-Tibet Plateau. Int. J. Remote Sens. 2020, 41, 7042–7067. [Google Scholar] [CrossRef]
  6. Chen, B.; Luo, S.; Lü, S.; Zhang, Y.; Ma, D. Effects of the Soil Freeze-Thaw Process on the Regional Climate of the Qinghai-Tibet Plateau. Clim. Res. 2014, 59, 243–257. [Google Scholar]
  7. Vonk, J.E.; Tank, S.E.; Bowden, W.B.; Laurion, I.; Vincent, W.F.; Alekseychik, P.; Amyot, M.; Billet, M.F.; Canário, J.; Cory, R.M. Reviews and Syntheses: Effects of Permafrost Thaw on Arctic Aquatic Ecosystems. Biogeosciences 2015, 12, 7129–7167. [Google Scholar] [CrossRef] [Green Version]
  8. Zhang, Z.; Wang, M.; Wu, Z.; Liu, X. Permafrost Deformation Monitoring Along the Qinghai-Tibet Plateau Engineering Corridor Using InSAR Observations with Multi-Sensor SAR Datasets from 1997–2018. Sensors 2019, 19, 5306. [Google Scholar] [CrossRef] [Green Version]
  9. Chen, D.; Fu, Y.-S.; Cai, B.; Yuan, Y.-X. Modeling and Algorithms of GPS Data Reduction for the Qinghai–Tibet Railway. IEEE Trans. Intell. Transp. Syst. 2010, 11, 753–758. [Google Scholar] [CrossRef]
  10. Qin, Y.; Zhang, J.; Li, G.; Qu, G. Settlement Characteristics of Unprotected Embankment along the Qinghai–Tibet Railway. Cold Reg. Sci. Technol. 2010, 60, 84–91. [Google Scholar] [CrossRef]
  11. Niu, F.; Luo, J.; Lin, Z.; Liu, M.; Yin, G. Thaw-induced slope failures and susceptibility mapping in permafrost regions of the Qinghai–Tibet Engineering Corridor, China. Nat. Hazards 2014, 74, 1667–1682. [Google Scholar] [CrossRef]
  12. Antonova, S.; Sudhaus, H.; Strozzi, T.; Zwieback, S.; Kääb, A.; Heim, B.; Langer, M.; Bornemann, N.; Boike, J. Thaw Subsidence of a Yedoma Landscape in Northern Siberia, Measured in Situ and Estimated from TerraSAR-X Interferometry. Remote Sens. 2018, 10, 494. [Google Scholar] [CrossRef] [Green Version]
  13. Short, N.; Brisco, B.; Couture, N.; Pollard, W.; Murnaghan, K.; Budkewitsch, P. A Comparison of TerraSAR-X, RADARSAT-2 and ALOS-PALSAR Interferometry for Monitoring Permafrost Environments, Case Study from Herschel Island, Canada. Remote Sens. Environ. 2011, 115, 3491–3506. [Google Scholar] [CrossRef]
  14. Chen, J.; Wu, Y.; O’Connor, M.; Cardenas, M.B.; Schaefer, K.; Michaelides, R.; Kling, G. Active Layer Freeze-Thaw and Water Storage Dynamics in Permafrost Environments Inferred from InSAR. Remote Sens. Environ. 2020, 248, 112007. [Google Scholar] [CrossRef]
  15. Meng, Y.; Lan, H.; Li, L.; Wu, Y.; Li, Q. Characteristics of Surface Deformation Detected by X-Band SAR Interferometry over Sichuan-Tibet Grid Connection Project Area, China. Remote Sens. 2015, 7, 12265–12281. [Google Scholar] [CrossRef] [Green Version]
  16. Wang, L.; Marzahn, P.; Bernier, M.; Jacome, A.; Poulin, J.; Ludwig, R. Comparison of TerraSAR-X and ALOS PALSAR Differential Interferometry With Multisource DEMs for Monitoring Ground Displacement in a Discontinuous Permafrost Region. IEEE J. Sel. Top. Appl. Earth Obs. Remote Sens. 2017, 10, 4074–4093. [Google Scholar] [CrossRef]
  17. Zhang, Z.; Wang, M.; Liu, X.; Chen, Q.; Wang, C.; Zhang, H. Deformation Monitoring of Qinghai-Tibet Railway from 1997–2018 Using SAR Interferometry with Multi-Sensors SAR Datasets. In Proceedings of the 2019 SAR in Big Data Era (BIGSARDATA), Beijing, China, 5–6 August 2019; IEEE: New York, NY, USA, 2019; pp. 1–4. [Google Scholar]
  18. Hu, J.; Wang, Q.; Li, Z.; Zhao, R.; Sun, Q. Investigating the Ground Deformation and Source Model of the Yangbajing Geothermal Field in Tibet, China with the WLS InSAR Technique. Remote Sens. 2016, 8, 191. [Google Scholar] [CrossRef] [Green Version]
  19. Chen, J.; Wu, T.; Zou, D.; Liu, L.; Wu, X.; Gong, W.; Zhu, X.; Li, R.; Hao, J.; Hu, G.; et al. Magnitudes and Patterns of Large-Scale Permafrost Ground Deformation Revealed by Sentinel-1 InSAR on the Central Qinghai-Tibet Plateau. Remote Sens. Environ. 2022, 268, 112778. [Google Scholar] [CrossRef]
  20. Zhao, R.; Li, Z.; Feng, G.; Wang, Q.; Hu, J. Monitoring Surface Deformation over Permafrost with an Improved SBAS-InSAR Algorithm: With Emphasis on Climatic Factors Modeling. Remote Sens. Environ. 2016, 184, 276–287. [Google Scholar] [CrossRef]
  21. Zhang, X.; Tang, Y.; Zhang, H.; Wang, C.; Zhang, B.; Wu, F. Permafrost Subsidence Monitoring of Qinghai-Tibet Plateau Using Sentinel-1 Data. In Proceedings of the 2019 SAR in Big Data Era (BIGSARDATA), Beijing, China, 5–6 August 2019; IEEE: New York, NY, USA, 2019; pp. 1–4. [Google Scholar]
  22. Short, N.; LeBlanc, A.-M.; Sladen, W.; Oldenborger, G.; Mathon-Dufour, V.; Brisco, B. RADARSAT-2 D-InSAR for Ground Displacement in Permafrost Terrain, Validation from Iqaluit Airport, Baffin Island, Canada. Remote Sens. Environ. 2014, 141, 40–51. [Google Scholar] [CrossRef]
  23. Rouyet, L.; Lauknes, T.R.; Christiansen, H.H.; Strand, S.M.; Larsen, Y. Seasonal Dynamics of a Permafrost Landscape, Adventdalen, Svalbard, Investigated by InSAR. Remote Sens. Environ. 2019, 231, 111236. [Google Scholar] [CrossRef]
  24. Rouyet, L.; Liu, L.; Strand, S.M.; Christiansen, H.H.; Lauknes, T.R.; Larsen, Y. Seasonal InSAR Displacements Documenting the Active Layer Freeze and Thaw Progression in Central-Western Spitsbergen, Svalbard. Remote Sens. 2021, 13, 2977. [Google Scholar] [CrossRef]
  25. Bartsch, A.; Leibman, M.; Strozzi, T.; Khomutov, A.; Widhalm, B.; Babkina, E.; Mullanurov, D.; Ermokhina, K.; Kroisleitner, C.; Bergstedt, H. Seasonal Progression of Ground Displacement Identified with Satellite Radar Interferometry and the Impact of Unusually Warm Conditions on Permafrost at the Yamal Peninsula in 2016. Remote Sens. 2019, 11, 1865. [Google Scholar] [CrossRef] [Green Version]
  26. Robson, G.; Treitz, P.; Lamoureux, S.F.; Murnaghan, K.; Brisco, B. Seasonal Surface Subsidence and Frost Heave Detected by C-Band DInSAR in a High Arctic Environment, Cape Bounty, Melville Island, Nunavut, Canada. Remote Sens. 2021, 13, 2505. [Google Scholar] [CrossRef]
  27. Wang, L.; Marzahn, P.; Bernier, M.; Ludwig, R. Sentinel-1 InSAR Measurements of Deformation over Discontinuous Permafrost Terrain, Northern Quebec, Canada. Remote Sens. Environ. 2020, 248, 111965. [Google Scholar] [CrossRef]
  28. Chen, F.; Lin, H. Tibetan Plateau Permafrost Evolution Monitoring Using C- and L-Band Spaceborne SAR Interferometry. In Proceedings of the 2012 IEEE International Geoscience and Remote Sensing Symposium, Munich, Germany, 22–27 July 2012; IEEE: New York, NY, USA, 2012; pp. 1884–1887. [Google Scholar]
  29. Zhang, X.; Zhang, H.; Wang, C.; Tang, Y.; Zhang, B.; Wu, F.; Wang, J.; Zhang, Z. Time-Series InSAR Monitoring of Permafrost Freeze-Thaw Seasonal Displacement over Qinghai–Tibetan Plateau Using Sentinel-1 Data. Remote Sens. 2019, 11, 1000. [Google Scholar] [CrossRef] [Green Version]
  30. Wang, C.; Zhang, H.; Zhang, B.; Tang, Y.; Zhang, Z.; Liu, M.; Zhao, L. New Mode TerraSAR-X Interferometry for Railway Monitoring in the Permafrost Region of the Tibet Plateau. In Proceedings of the 2015 IEEE International Geoscience and Remote Sensing Symposium (IGARSS), Milan, Italy, 26–31 July 2015; IEEE: New York, NY, USA, 2015; pp. 1634–1637. [Google Scholar]
  31. Wang, C.; Zhang, Z.; Zhang, H.; Zhang, B.; Tang, Y.; Wu, Q. Active Layer Thickness Retrieval of Qinghai–Tibet Permafrost Using the TerraSAR-X InSAR Technique. IEEE J. Sel. Top. Appl. Earth Obs. Remote Sens. 2018, 11, 4403–4413. [Google Scholar] [CrossRef]
  32. Zhang, Z.; Wang, C.; Zhang, H.; Tang, Y.; Liu, X. Analysis of Permafrost Region Coherence Variation in the Qinghai–Tibet Plateau with a High-Resolution TerraSAR-X Image. Remote Sens. 2018, 10, 298. [Google Scholar] [CrossRef] [Green Version]
  33. Chen, R.H.; Michaelides, R.J.; Sullivan, T.D.; Parsekian, A.D.; Zebker, H.A.; Moghaddam, M.; Schaefer, K.M. Joint Retrieval of Soil Moisture and Permafrost Active Layer Thickness Using L-Band Insar and P-Band Polsar. In Proceedings of the IGARSS 2020-2020 IEEE International Geoscience and Remote Sensing Symposium, Waikoloa, HI, USA, 26 September–2 October 2020; IEEE: New York, NY, USA, 2020; pp. 4606–4609. [Google Scholar]
  34. Schaefer, K.; Liu, L.; Parsekian, A.; Jafarov, E.; Chen, A.; Zhang, T.; Gusmeroli, A.; Panda, S.; Zebker, H.; Schaefer, T. Remotely Sensed Active Layer Thickness (ReSALT) at Barrow, Alaska Using Interferometric Synthetic Aperture Radar. Remote Sens. 2015, 7, 3735–3759. [Google Scholar] [CrossRef] [Green Version]
  35. Chen, F.; Lin, H.; Zhou, W.; Hong, T.; Wang, G. Surface Deformation Detected by ALOS PALSAR Small Baseline SAR Interferometry over Permafrost Environment of Beiluhe Section, Tibet Plateau, China. Remote Sens. Environ. 2013, 138, 10–18. [Google Scholar] [CrossRef]
  36. Parsekian, A.D.; Chen, R.H.; Michaelides, R.J.; Sullivan, T.D.; Clayton, L.K.; Huang, L.; Zhao, Y.; Wig, E.; Moghaddam, M.; Zebker, H.; et al. Validation of Permafrost Active Layer Estimates from Airborne SAR Observations. Remote Sens. 2021, 13, 2876. [Google Scholar] [CrossRef]
  37. Rudy, A.C.A.; Lamoureux, S.F.; Treitz, P.; Short, N.; Brisco, B. Seasonal and Multi-Year Surface Displacements Measured by DInSAR in a High Arctic Permafrost Environment. Int. J. Appl. Earth Obs. Geoinf. 2018, 64, 51–61. [Google Scholar] [CrossRef]
  38. Lu, P.; Han, J.; Li, Z.; Xu, R.; Li, R.; Hao, T.; Qiao, G. Lake Outburst Accelerated Permafrost Degradation on Qinghai-Tibet Plateau. Remote Sens. Environ. 2020, 249, 112011. [Google Scholar] [CrossRef]
  39. Eshqi Molan, Y.; Kim, J.-W.; Lu, Z.; Wylie, B.; Zhu, Z. Modeling Wildfire-Induced Permafrost Deformation in an Alaskan Boreal Forest Using InSAR Observations. Remote Sens. 2018, 10, 405. [Google Scholar] [CrossRef] [Green Version]
  40. Li, R.; Li, Z.; Han, J.; Lu, P.; Qiao, G.; Meng, X.; Hao, T.; Zhou, F. Monitoring Surface Deformation of Permafrost in Wudaoliang Region, Qinghai–Tibet Plateau with ENVISAT ASAR Data. Int. J. Appl. Earth Obs. Geoinf. 2021, 104, 102527. [Google Scholar] [CrossRef]
  41. Daout, S.; Dini, B.; Haeberli, W.; Doin, M.-P.; Parsons, B. Ice Loss in the Northeastern Tibetan Plateau Permafrost as Seen by 16 Yr of ESA SAR Missions. Earth Planet. Sci. Lett. 2020, 545, 116404. [Google Scholar] [CrossRef]
  42. Ng, A.H.-M.; Chang, H.-C.; Ge, L.; Rizos, C.; Omura, M. Assessment of Radar Interferometry Performance for Ground Subsidence Monitoring Due to Underground Mining. Earth Planets Space 2009, 61, 733–745. [Google Scholar] [CrossRef] [Green Version]
  43. Fort, F.; van Vliet-Lanoe, B. Permafrost and Periglacial Environment of Western Tibet. Landf. Anal. 2007, 5, 25–29. [Google Scholar]
  44. Li, Z.; Zhao, R.; Hu, J.; Wen, L.; Feng, G.; Zhang, Z.; Wang, Q. InSAR Analysis of Surface Deformation over Permafrost to Estimate Active Layer Thickness Based on One-Dimensional Heat Transfer Model of Soils. Sci. Rep. 2015, 5, 15542. [Google Scholar] [CrossRef]
  45. Jia, Y.; Kim, J.-W.; Shum, C.; Lu, Z.; Ding, X.; Zhang, L.; Erkan, K.; Kuo, C.-Y.; Shang, K.; Tseng, K.-H.; et al. Characterization of Active Layer Thickening Rate over the Northern Qinghai-Tibetan Plateau Permafrost Region Using ALOS Interferometric Synthetic Aperture Radar Data, 2007–2009. Remote Sens. 2017, 9, 84. [Google Scholar] [CrossRef] [Green Version]
  46. Liu, L.; Zhang, T.; Wahr, J. InSAR Measurements of Surface Deformation over Permafrost on the North Slope of Alaska. J. Geophys. Res. Earth Surf. 2010, 115. [Google Scholar] [CrossRef]
  47. Wang, L.; Zhao, L.; Zhou, H.; Liu, S.; Du, E.; Zou, D.; Liu, G.; Wang, C.; Li, Y. Permafrost Ground Ice Melting and Deformation Time Series Revealed by Sentinel-1 InSAR in the Tanggula Mountain Region on the Tibetan Plateau. Remote Sens. 2022, 14, 811. [Google Scholar] [CrossRef]
  48. Xia, L.; Yang, Q.; Li, Z.; Wu, Y.; Feng, Z. The Effect of the Qinghai-Tibet Railway on the Migration of Tibetan Antelope Pantholops Hodgsonii in Hoh-Xil National Nature Reserve, China. Oryx 2007, 41, 352–357. [Google Scholar] [CrossRef] [Green Version]
  49. Zhou, H.; Li, D.; Zhang, Y.; Yang, T.; Liu, Y. ‘Genetic Diversity of Microsatellite DNA Loci of Tibetan Antelope (Chiru, Pantholops Hodgsonii) in Hoh Xil National Nature Reserve, Qinghai, China. J. Genet. Genom. 2007, 34, 600–607. [Google Scholar] [CrossRef]
  50. Niu, F.; Lin, Z.; Liu, H.; Lu, J. Characteristics of Thermokarst Lakes and Their Influence on Permafrost in Qinghai–Tibet Plateau. Geomorphology 2011, 132, 222–233. [Google Scholar] [CrossRef]
  51. Zhou, S.; Li, J. The Sequence of Quaternary Glaciation in the Bayan Har Mountains. Quat. Int. 1998, 45, 135–142. [Google Scholar] [CrossRef]
  52. Ma, Q.; Zhang, K.; Jabro, J.D.; Ren, L.; Liu, H. Freeze–Thaw Cycles Effects on Soil Physical Properties under Different Degraded Conditions in Northeast China. Environ. Earth Sci. 2019, 78, 321. [Google Scholar] [CrossRef]
  53. Yu, J.; Gao, C.; Cheng, A.; Liu, Y.; Zhang, L.; He, X. Geomorphic, Hydroclimatic and Hydrothermal Controls on the Formation of Lithium Brine Deposits in the Qaidam Basin, Northern Tibetan Plateau, China. Ore Geol. Rev. 2013, 50, 171–183. [Google Scholar] [CrossRef]
  54. Wang, J.; Wang, C.; Zhang, H.; Tang, Y.; Duan, W.; Dong, L. Freeze-Thaw Deformation Cycles and Temporal-Spatial Distribution of Permafrost along the Qinghai-Tibet Railway Using Multitrack InSAR Processing. Remote Sens. 2021, 13, 4744. [Google Scholar] [CrossRef]
  55. LaRocque, A.; Phiri, C.; Leblon, B.; Pirotti, F.; Connor, K.; Hanson, A. Wetland Mapping with Landsat 8 OLI, Sentinel-1, ALOS-1 PALSAR, and LiDAR Data in Southern New Brunswick, Canada. Remote Sens. 2020, 12, 2095. [Google Scholar] [CrossRef]
  56. Adriano, B.; Yokoya, N.; Miura, H.; Matsuoka, M.; Koshimura, S. A Semiautomatic Pixel-Object Method for Detecting Landslides Using Multitemporal ALOS-2 Intensity Images. Remote Sens. 2020, 12, 561. [Google Scholar] [CrossRef] [Green Version]
  57. Imamoglu, M.; Kahraman, F.; Cakir, Z.; Sanli, F.B. Ground Deformation Analysis of Bolvadin (W. Turkey) by Means of Multi-Temporal InSAR Techniques and Sentinel-1 Data. Remote Sens. 2019, 11, 1069. [Google Scholar] [CrossRef] [Green Version]
  58. Berardino, P.; Fornaro, G.; Lanari, R.; Sansosti, E. A New Algorithm for Surface Deformation Monitoring Based on Small Baseline Differential SAR Interferograms. IEEE Trans. Geosci. Remote Sens. 2002, 40, 2375–2383. [Google Scholar] [CrossRef] [Green Version]
  59. Shen, Z.; Liu, Z. Integration of GPS and InSAR Data for Resolving 3-Dimensional Crustal Deformation. Earth Space Sci. 2020, 7, e2019EA001036. [Google Scholar] [CrossRef] [Green Version]
  60. Wang, Y.; Chang, L.; Feng, W.; Samsonov, S.; Zheng, W. Topography-Correlated Atmospheric Signal Mitigation for InSAR Applications in the Tibetan Plateau Based on Global Atmospheric Models. Int. J. Remote Sens. 2021, 42, 4361–4379. [Google Scholar] [CrossRef]
  61. Jolivet, R.; Agram, P.S.; Lin, N.Y.; Simons, M.; Doin, M.-P.; Peltzer, G.; Li, Z. Improving InSAR Geodesy Using Global Atmospheric Models. J. Geophys. Res. Solid Earth 2014, 119, 2324–2341. [Google Scholar] [CrossRef]
  62. Fattahi, H.; Amelung, F. DEM Error Correction in InSAR Time Series. IEEE Trans. Geosci. Remote Sens. 2013, 51, 4249–4259. [Google Scholar] [CrossRef]
  63. Yunjun, Z.; Fattahi, H.; Amelung, F. Small Baseline InSAR Time Series Analysis: Unwrapping Error Correction and Noise Reduction. Comput. Geosci. 2019, 133, 104331. [Google Scholar] [CrossRef] [Green Version]
  64. Niu, F.; Luo, J. Distribution Data of Freezing and Thawing Disasters in Qinghai Tibet Project Corridor (2019–2020). National Tibetan Plateau Data Center. 2021. Available online: https://doi.org/10.11888/RemoteSen.tpdc.271883 (accessed on 22 February 2022).
  65. Li, H.; Kato, T.; Hayashi, M.; Wu, L. Estimation of Forest Aboveground Biomass of Two Major Conifers in Ibaraki Prefecture, Japan, from PALSAR-2 and Sentinel-2 Data. Remote Sens. 2022, 14, 468. [Google Scholar] [CrossRef]
  66. Xie, C.; Li, Z.; Xu, J.; Li, X. Analysis of Deformation over Permafrost Regions of Qinghai-Tibet Plateau Based on Permanent Scatterers. Int. J. Remote Sens. 2010, 31, 1995–2008. [Google Scholar] [CrossRef]
  67. Chen, F.; Lin, H.; Li, Z.; Chen, Q.; Zhou, J. Interaction between Permafrost and Infrastructure along the Qinghai–Tibet Railway Detected via Jointly Analysis of C-and L-Band Small Baseline SAR Interferometry. Remote Sens. Environ. 2012, 123, 532–540. [Google Scholar] [CrossRef]
  68. Wang, C.; Zhang, Z.; Zhang, H.; Wu, Q.; Zhang, B.; Tang, Y. Seasonal Deformation Features on Qinghai-Tibet Railway Observed Using Time-Series InSAR Technique with High-Resolution TerraSAR-X Images. Remote Sens. Lett. 2017, 8, 1–10. [Google Scholar] [CrossRef]
  69. Li, Y.; Zhang, J.; Li, Z.; Luo, Y.; Jiang, W.; Tian, Y. Measurement of Subsidence in the Yangbajing Geothermal Fields, Tibet, from TerraSAR-X InSAR Time Series Analysis. Int. J. Digit. Earth 2016, 9, 697–709. [Google Scholar] [CrossRef]
  70. Hong, Z.; Jin, S. Permafrost deformation in Qinghai-Tibet Plateau time-series PS-InSAR. Bull. Surv. Mapp. 2021, 1, 35–40. (In Chinese) [Google Scholar]
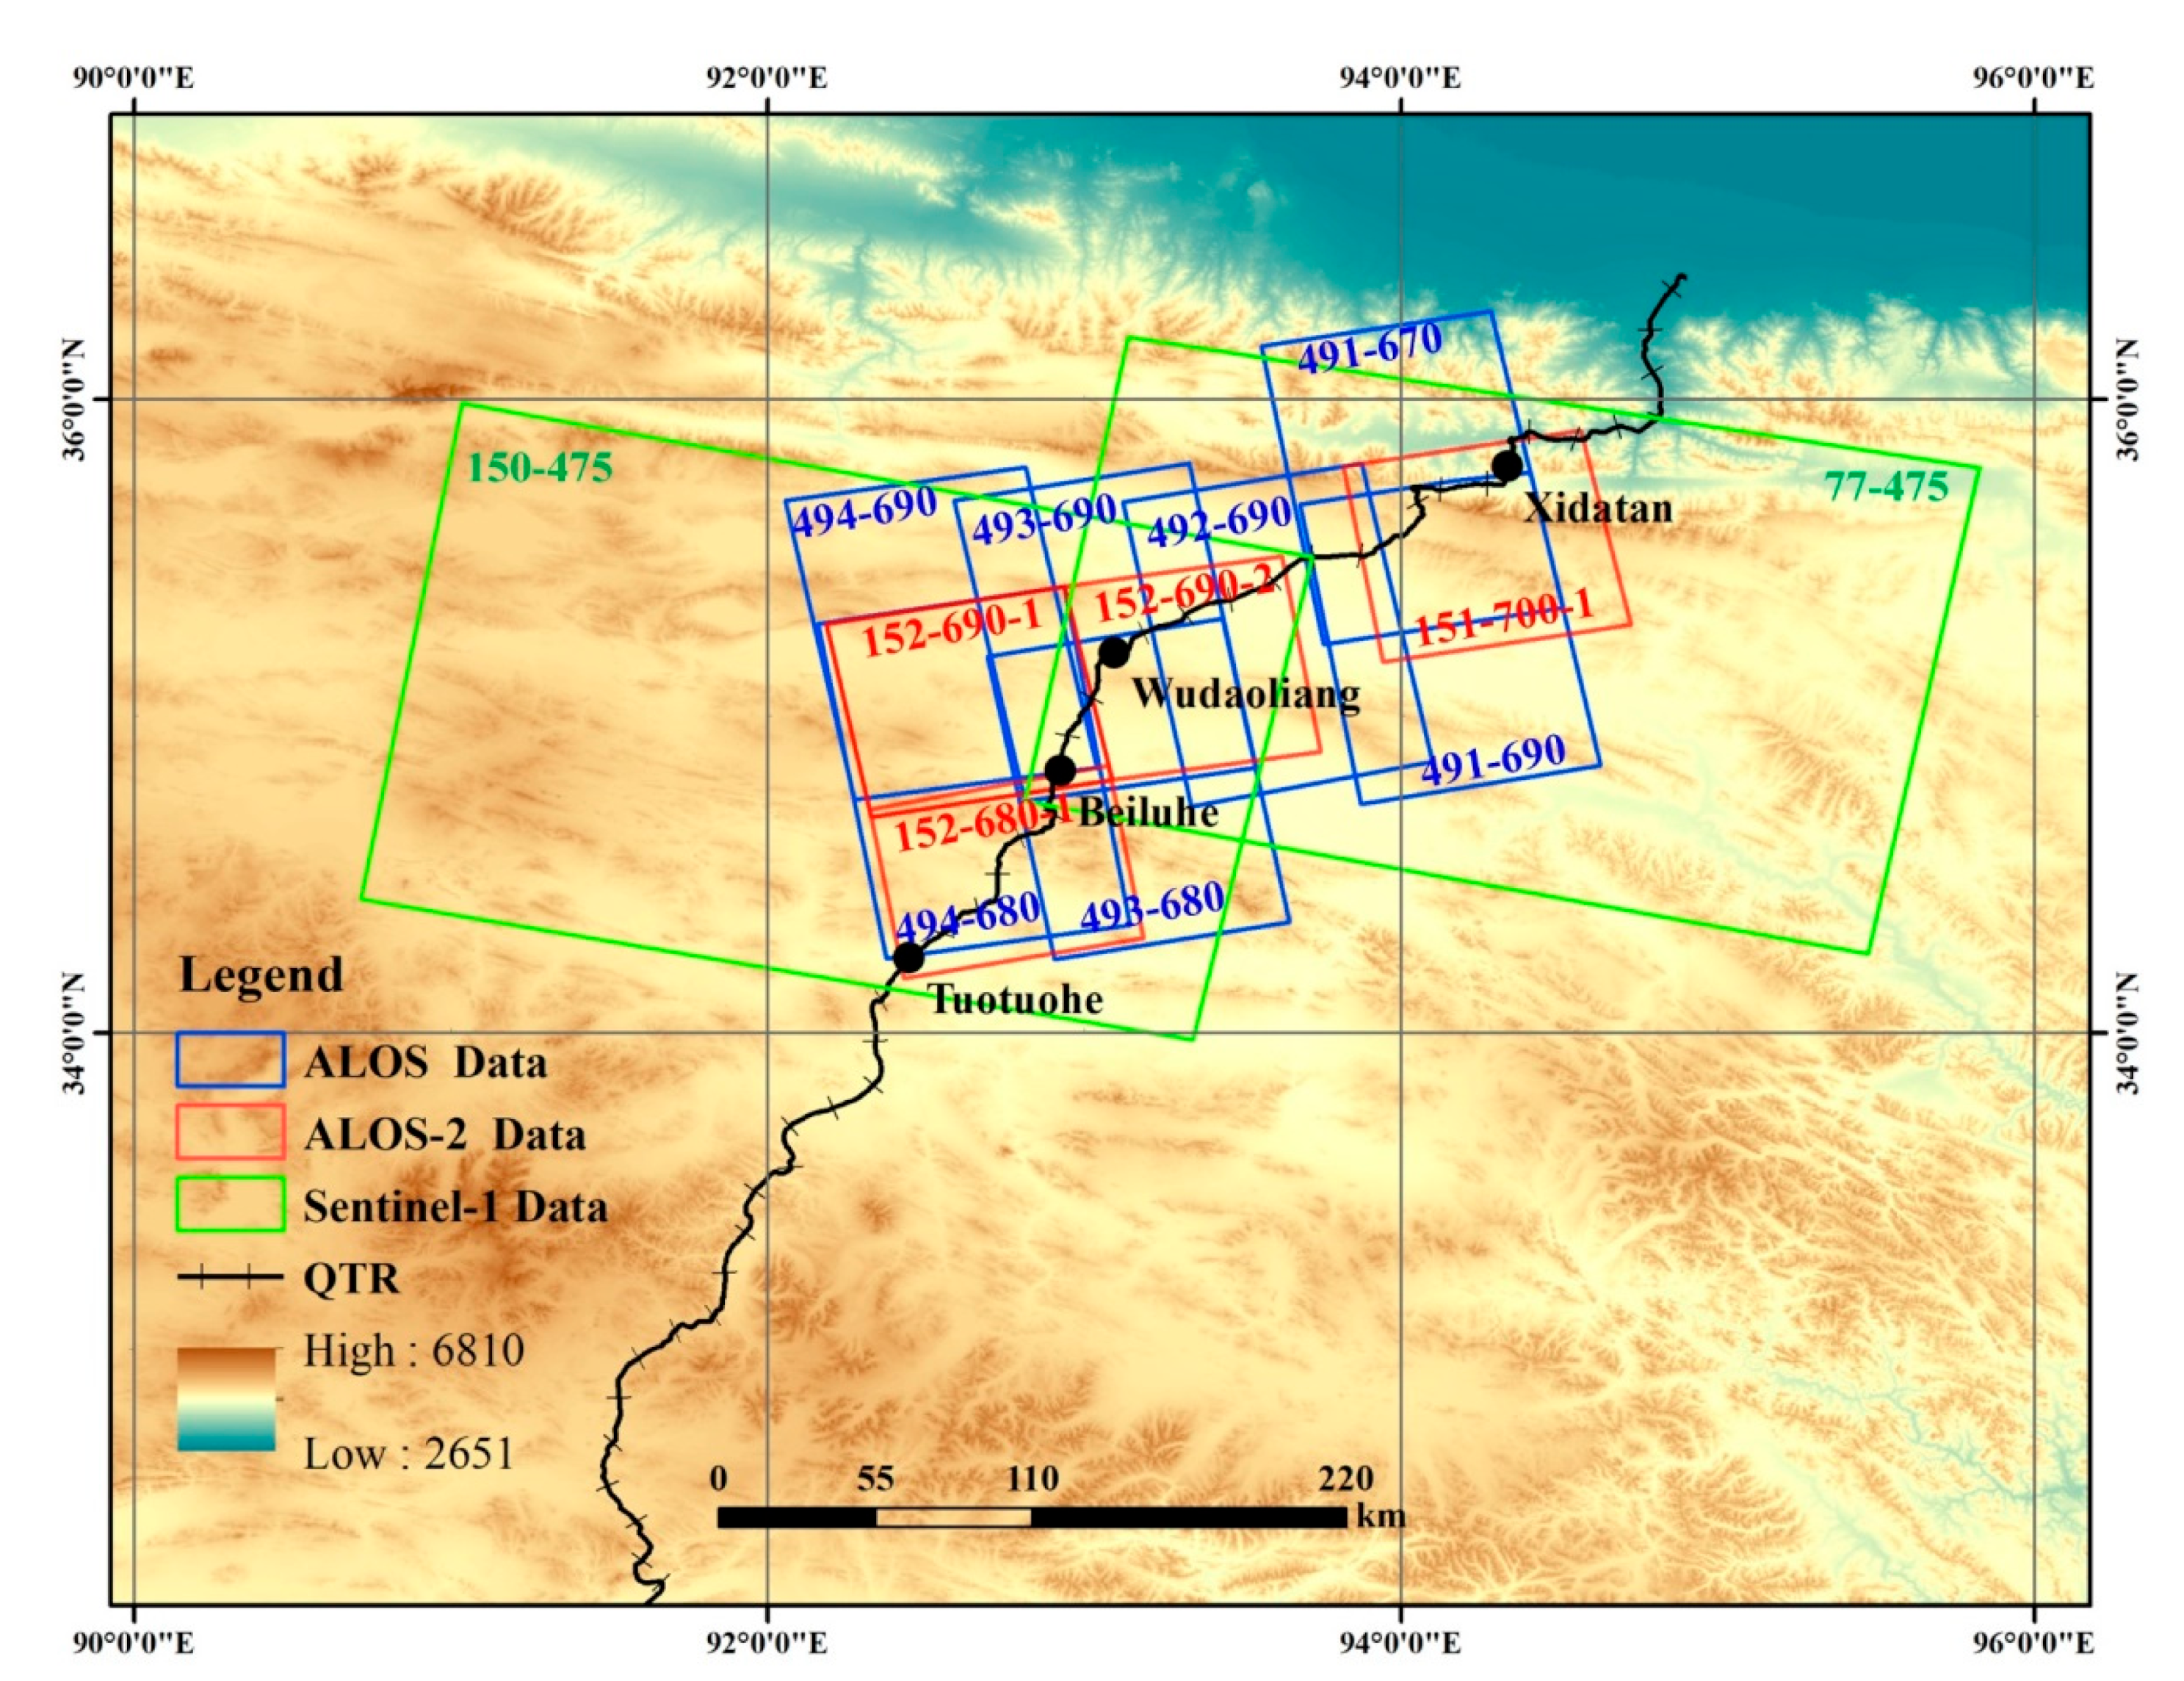
Figure 1. The study area with topography and surface traces of four overlapping ALOS ascending tracks, three ALOS-2 ascending tracks and two Sentinel-1 descending tracks in the northern QTP.
Remotesensing 14 01870 g001
Figure 2. Flowchart of the processing approach.
Remotesensing 14 01870 g002
Figure 3. Long-term deformation results of the study area. Background is the DEM. (a) ALOS result (2007–2009). (b) ALOS-2 result (2015–2020). (c) Sentinel-1 result (2017–2021).
Remotesensing 14 01870 g003
Figure 4. Permafrost evolution in two typical areas, Salt Lake and braided stream plain. (a) Average deformation rate during 2017–2021. (b) Salt Lake in December 2008 from Google Earth. (c) Average deformation rate during 2007–2009. (d) Salt Lake in December 2018 from Google Earth. (e) Average deformation rate during 2017–2021. (f) Braided stream plain from Google Earth image. (g) Average deformation rate during 2007–2009. (h) Average deformation rate during 2015–2020. (i) Average deformation rate during 2017–2021.
Remotesensing 14 01870 g004
Figure 5. The time series deformation of the study points and the deformation of the selected profile. (a) Time series deformation of study points during 2007–2009. (b) Time series deformation of study points during 2017 to 2021. (c) The deformation of selected profile.
Remotesensing 14 01870 g005
Figure 6. The thermal melting collapse, average deformation and time series deformation of the study points. (a) Thermal melting collapse from GF-1/2 during 2019–2020. (b) Average deformation rate during 2015–2020. (c) Average deformation rate during 2017–2021. (d) Time series deformation of points during 2015–2020. (e) Time series deformation of points during 2017–2021.
Remotesensing 14 01870 g006
Figure 7. The long-term deformation velocity and maximum seasonal deformation. (a) Long-term deformation velocity during 2015–2020 from ALOS-2. (b) Long-term deformation velocity during 2017–2021 from Sentinel-1. (c) ALOS-2 maximum seasonal deformation. (d) Sentinel-1 maximum seasonal deformation. (e) Maximum seasonal deformation during 2015–2020 from ALOS-2. (f) Maximum seasonal deformation during 2017–2021 from Sentinel-1. (g) ALOS-2 LTD and MSD. (h) Sentinel-1 LTD and MSD.
Remotesensing 14 01870 g007
Figure 8. Geographic location map of leveling points along the QTR.
Remotesensing 14 01870 g008
Table 1. ALOS/PALSAR Data.
ALOS/PALSAR
Path-Frame
Number of SAR ImagesAcquisition TimeResolution (Azimuth)Ground Coverage
491-6901016 June 2007~12 December 200910 m70 km × 100 km
491-7001016 June 2007~12 December 200910 m70 km × 100 km
492-6901715 February 2007~23 February 201010 m70 km × 100 km
493-6801217 January 2007~09 March 200910 m70 km × 100 km
493-6901217 January 2007~09 March 200910 m70 km × 100 km
494-6801121 June 2007~08 February 200910 m70 km × 100 km
494-6901121 June 2007~08 February 200910 m70 km × 100 km
Table 2. ALOS-2/PALSAR-2 Data.
ALOS-2/PALSAR-2 Path-Row-IdNumber of SAR ImagesAcquisition TimeResolution (Azimuth)Ground Coverage
152-680-12024 February 2015~09 November 202110 m70 km × 70 km
152-690-11515 December 2015~03 September 201910 m70 km × 70 km
152-690-21730 June 2015~21 December 202110 m70 km × 70 km
151-700-12023 July 2015~16 January 202010 m70 km × 70 km
Table 3. Sentinel-1 Data.
Sentinel-1 Path-FrameNumber of SAR ImagesAcquisition TimeResolution (Azimuth)Ground Coverage
77-47516116 March 2017~12 December 202120 m250 km × 167 km
150-47512311 October 2017~01 December 202120 m250 km × 167 km
Table 4. The details of the four selection points around Salt Lake.
PointPositionLong-Term Deformation Velocity during 2007–2009Long-Term Deformation Velocity during 2017–2021
Point A93.467 ° E, 35.547 ° N−12.5 mm/year-
Point B93.473 ° E, 35.485 ° N−4.3 mm/year-
Point C93.363 ° E, 35.476 ° N8.7 mm/year−15.6 mm/year
Point D93.312 ° E, 35.532 ° N−2.3 mm/year−20.3 mm/year
Table 5. The details of the four selection points.
PointPositionLong-Term Deformation Velocity during 2015–2020Long-Term Deformation Velocity during 2017–2021
Point A92.771 ° E, 35.059 ° N−24.9 mm/year3.4mm/year
Point B92.790 ° E, 35.051 ° N−8.1 mm/year9.1 mm/year
Point C92.803 ° E, 35.044 ° N7.1 mm/year13.0 mm/year
Point D92.823 ° E, 35.032 ° N−11.1 mm/year14.1 mm/year
Table 6. Previous studies on permafrost deformation in the QTP.
Study AreaInSAR MethodSAR DatasetObservation TimeAverage Ground
Deformation Rate
Authors
BeiluhePSIEnvisat2003–2007−20~3 mm/yearXie et al. (2010)
BeiluheIPTA and SBASALOS and Envisat2004–2010−20~20 mm/yearChen et al. (2012)
BeiluheSBASALOS2007–2010−25~10 mm/yearChen et al. (2013)
Naqu-LhasaSBASEnvisat and TerraSAR-X2003–2012−20~20 mm/yearZhang et al. (2018)
YangbaijinMTInSARTerraSAR-X2014–2015−30–10 mm/yearLi et al. (2017)
Wudaoliang-TuotuoheMT-InSARSentinel-1, Envisat and ERS-11997~2018−20~10 mm/yearZhang et al. (2019)
WudaoliangStaMPS-InSARSentinel-1 and TerraSAR-X2017–2018−12~7 mm/yearHan et al. (2020)
Golmud-LhasaNSBASSentinel-12017~2020−20~20 mm/yearWang et al. (2021)
Table 7. The absolute error between the measured values of leveling points A, B, and C and the InSAR observed values.
BenchmarkABC
Leveling (unit: mm)−2.28.816.6
InSAR results (unit: mm)−5.314.59.8
Absolute error (unit: mm)3.15.76.8
Publisher’s Note: MDPI stays neutral with regard to jurisdictional claims in published maps and institutional affiliations.