
Automated Inventory of Broadleaf Tree Plantations with UAS Imagery


Abstract
:1. Introduction
- (1)
- To test the accuracy of ITD with UAS-derived CHM.
- (2)
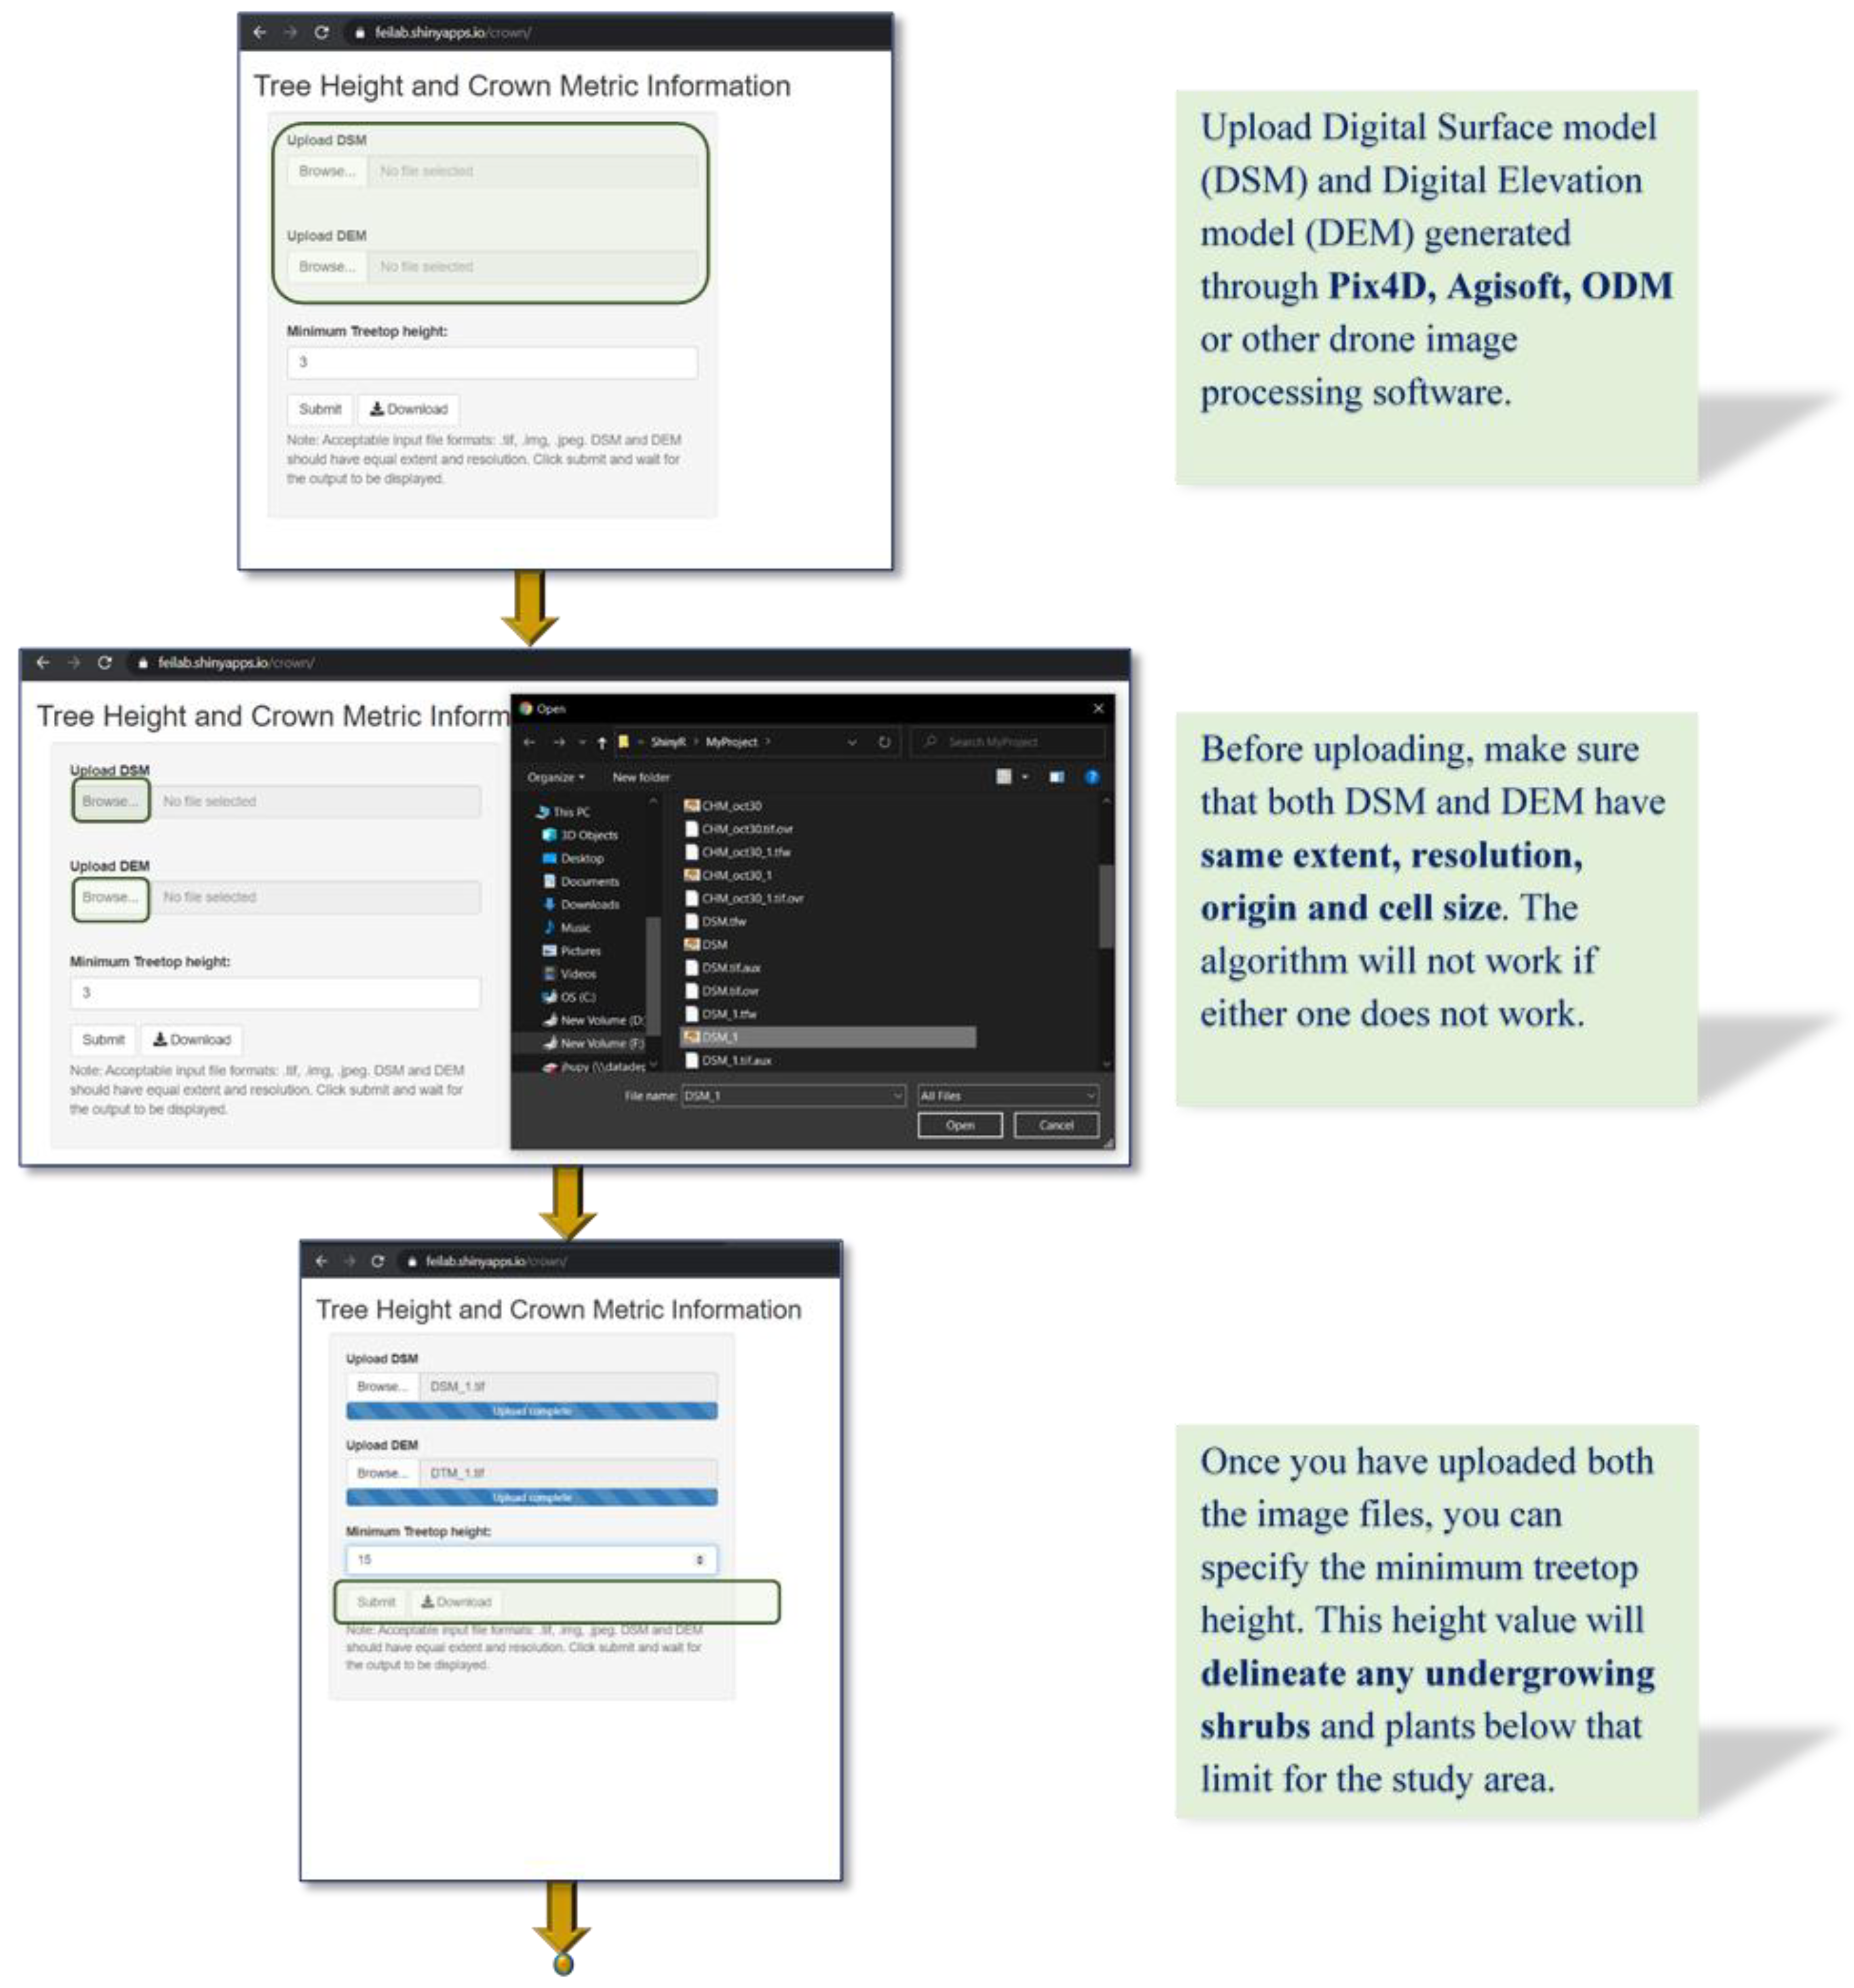
- To test the accuracy of biometrics measurements (tree height and crown area) in two broadleaf tree plantations of different species and ages using datasets from two different UAS platforms. In addition, to facilitate the application of automated tree-level measurements using UAS imagery, we developed a web-based application for deriving tree height and crown area for broadleaf tree plantations (https://feilab.shinyapps.io/Crown/ accessed on 12 December 2021).
2. Materials and Methods
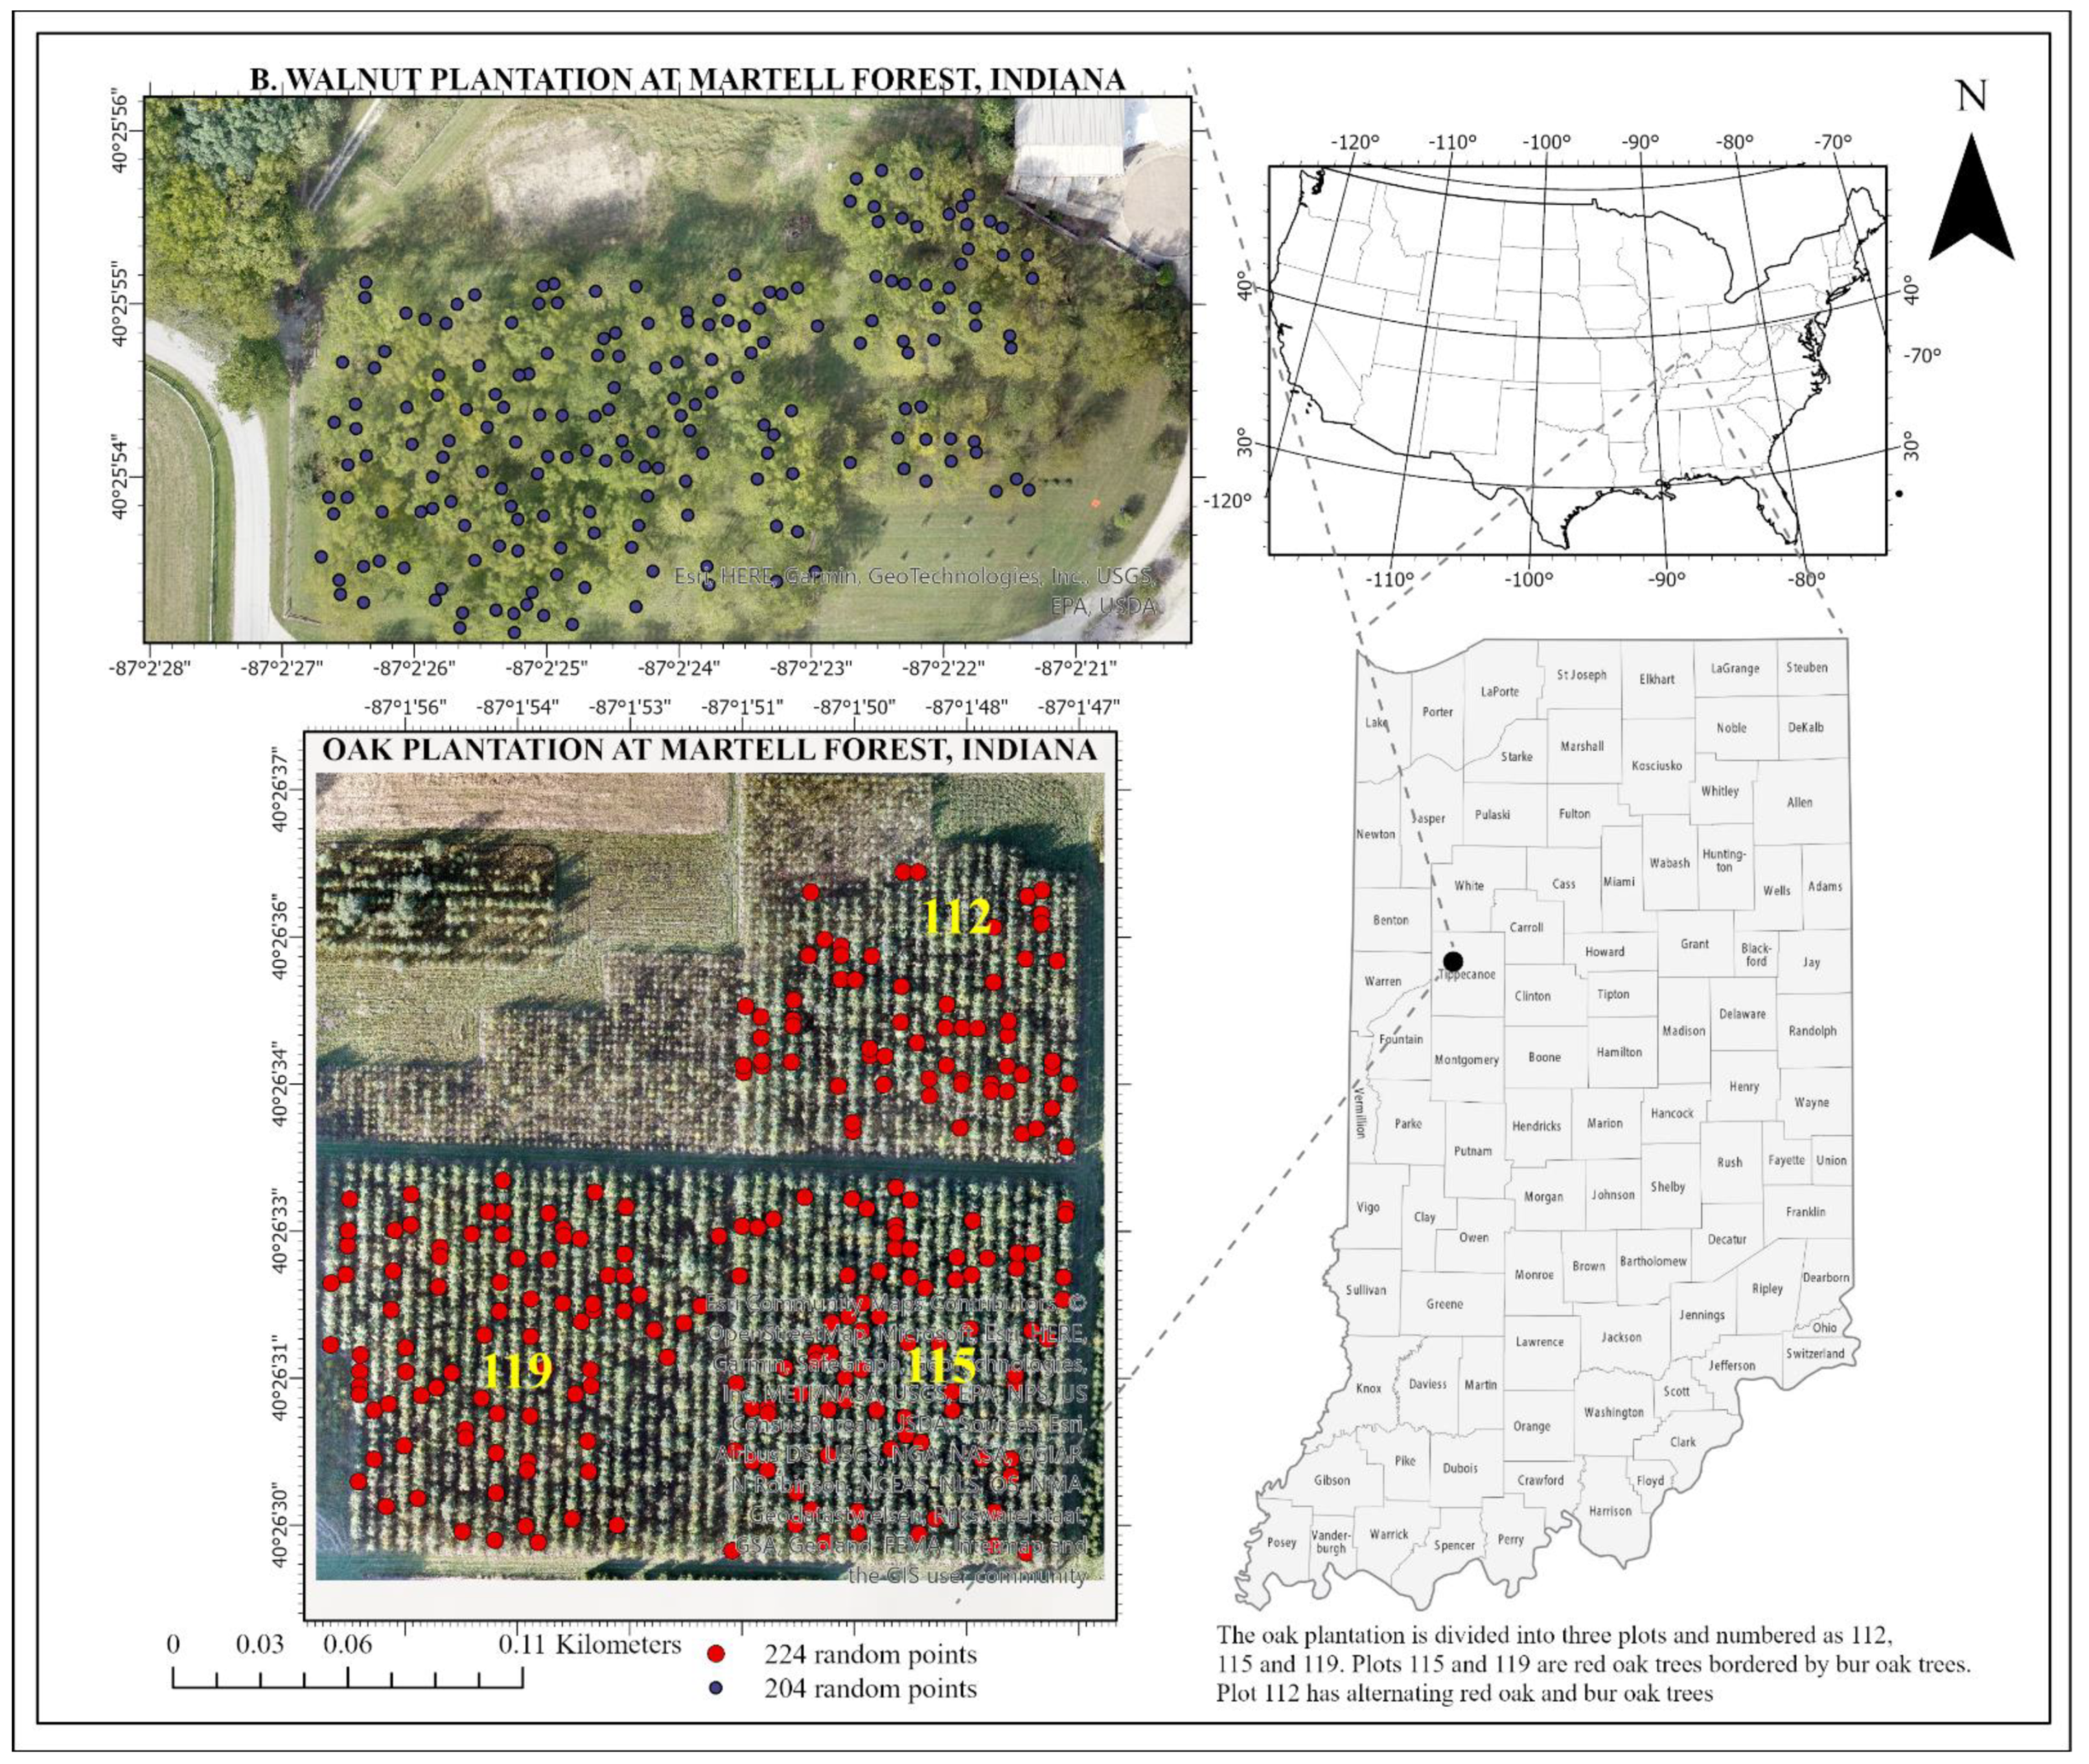
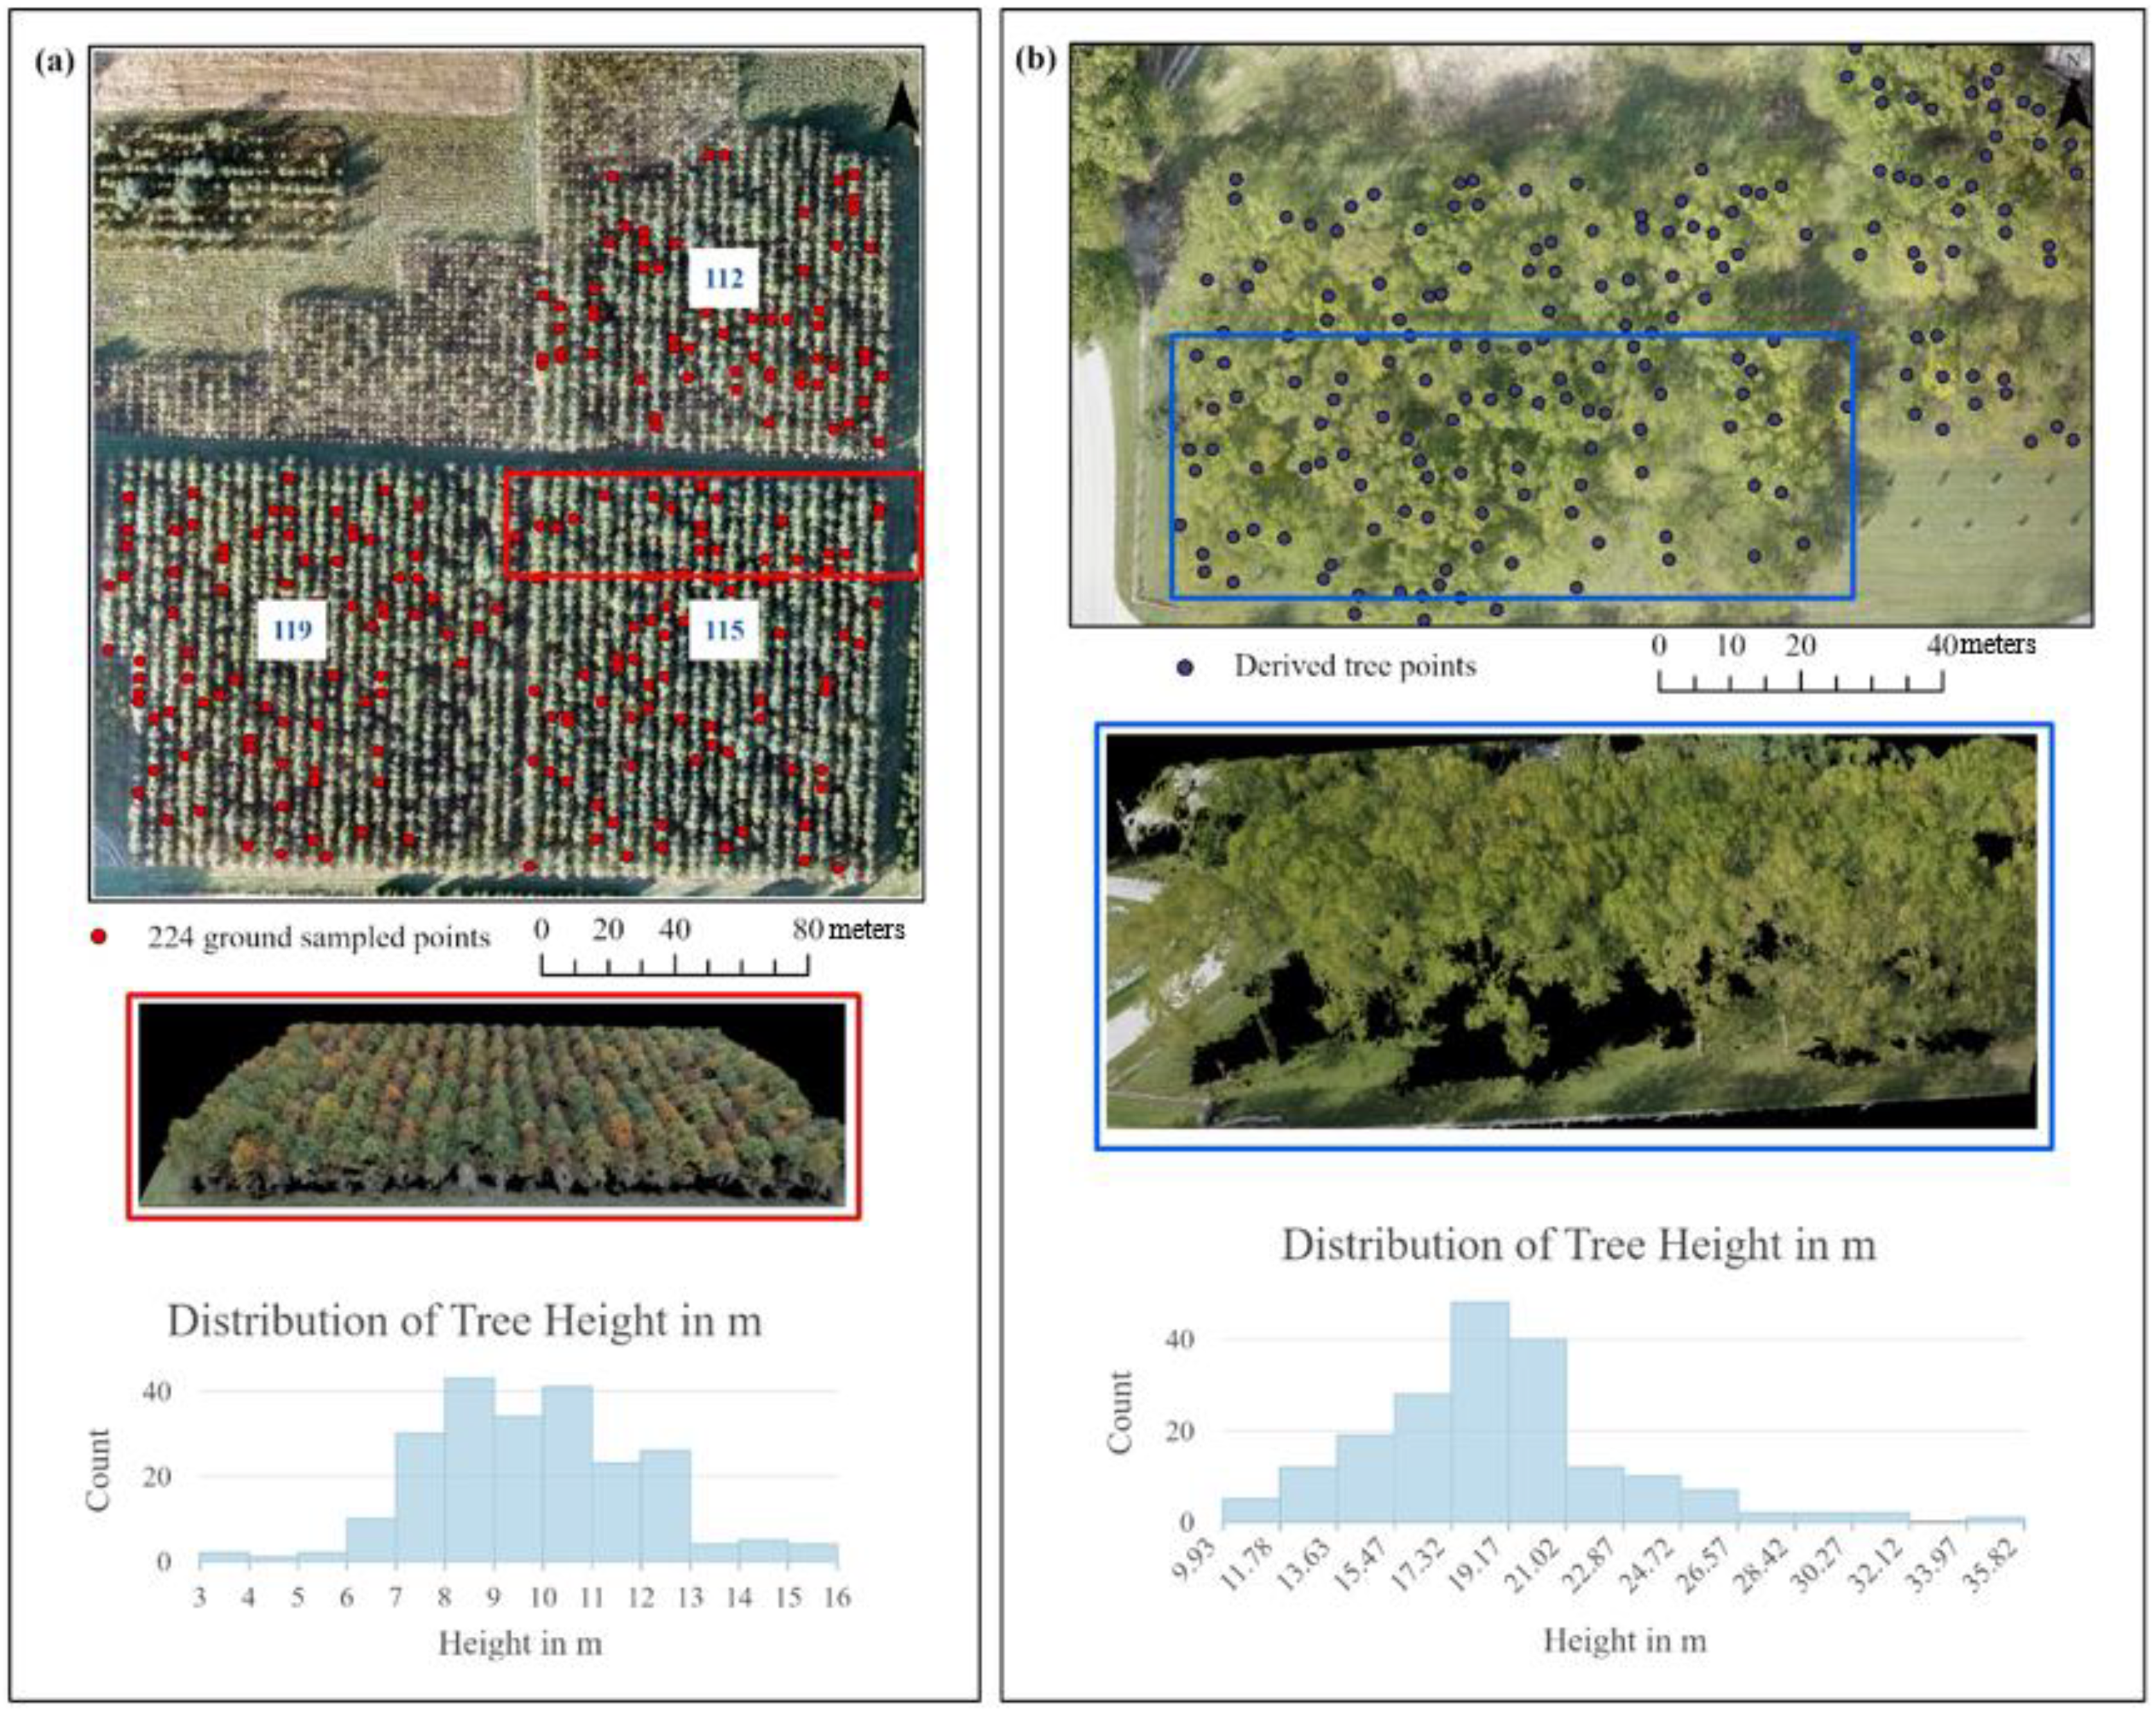
2.1. Study Area and UAS Image Acquisition
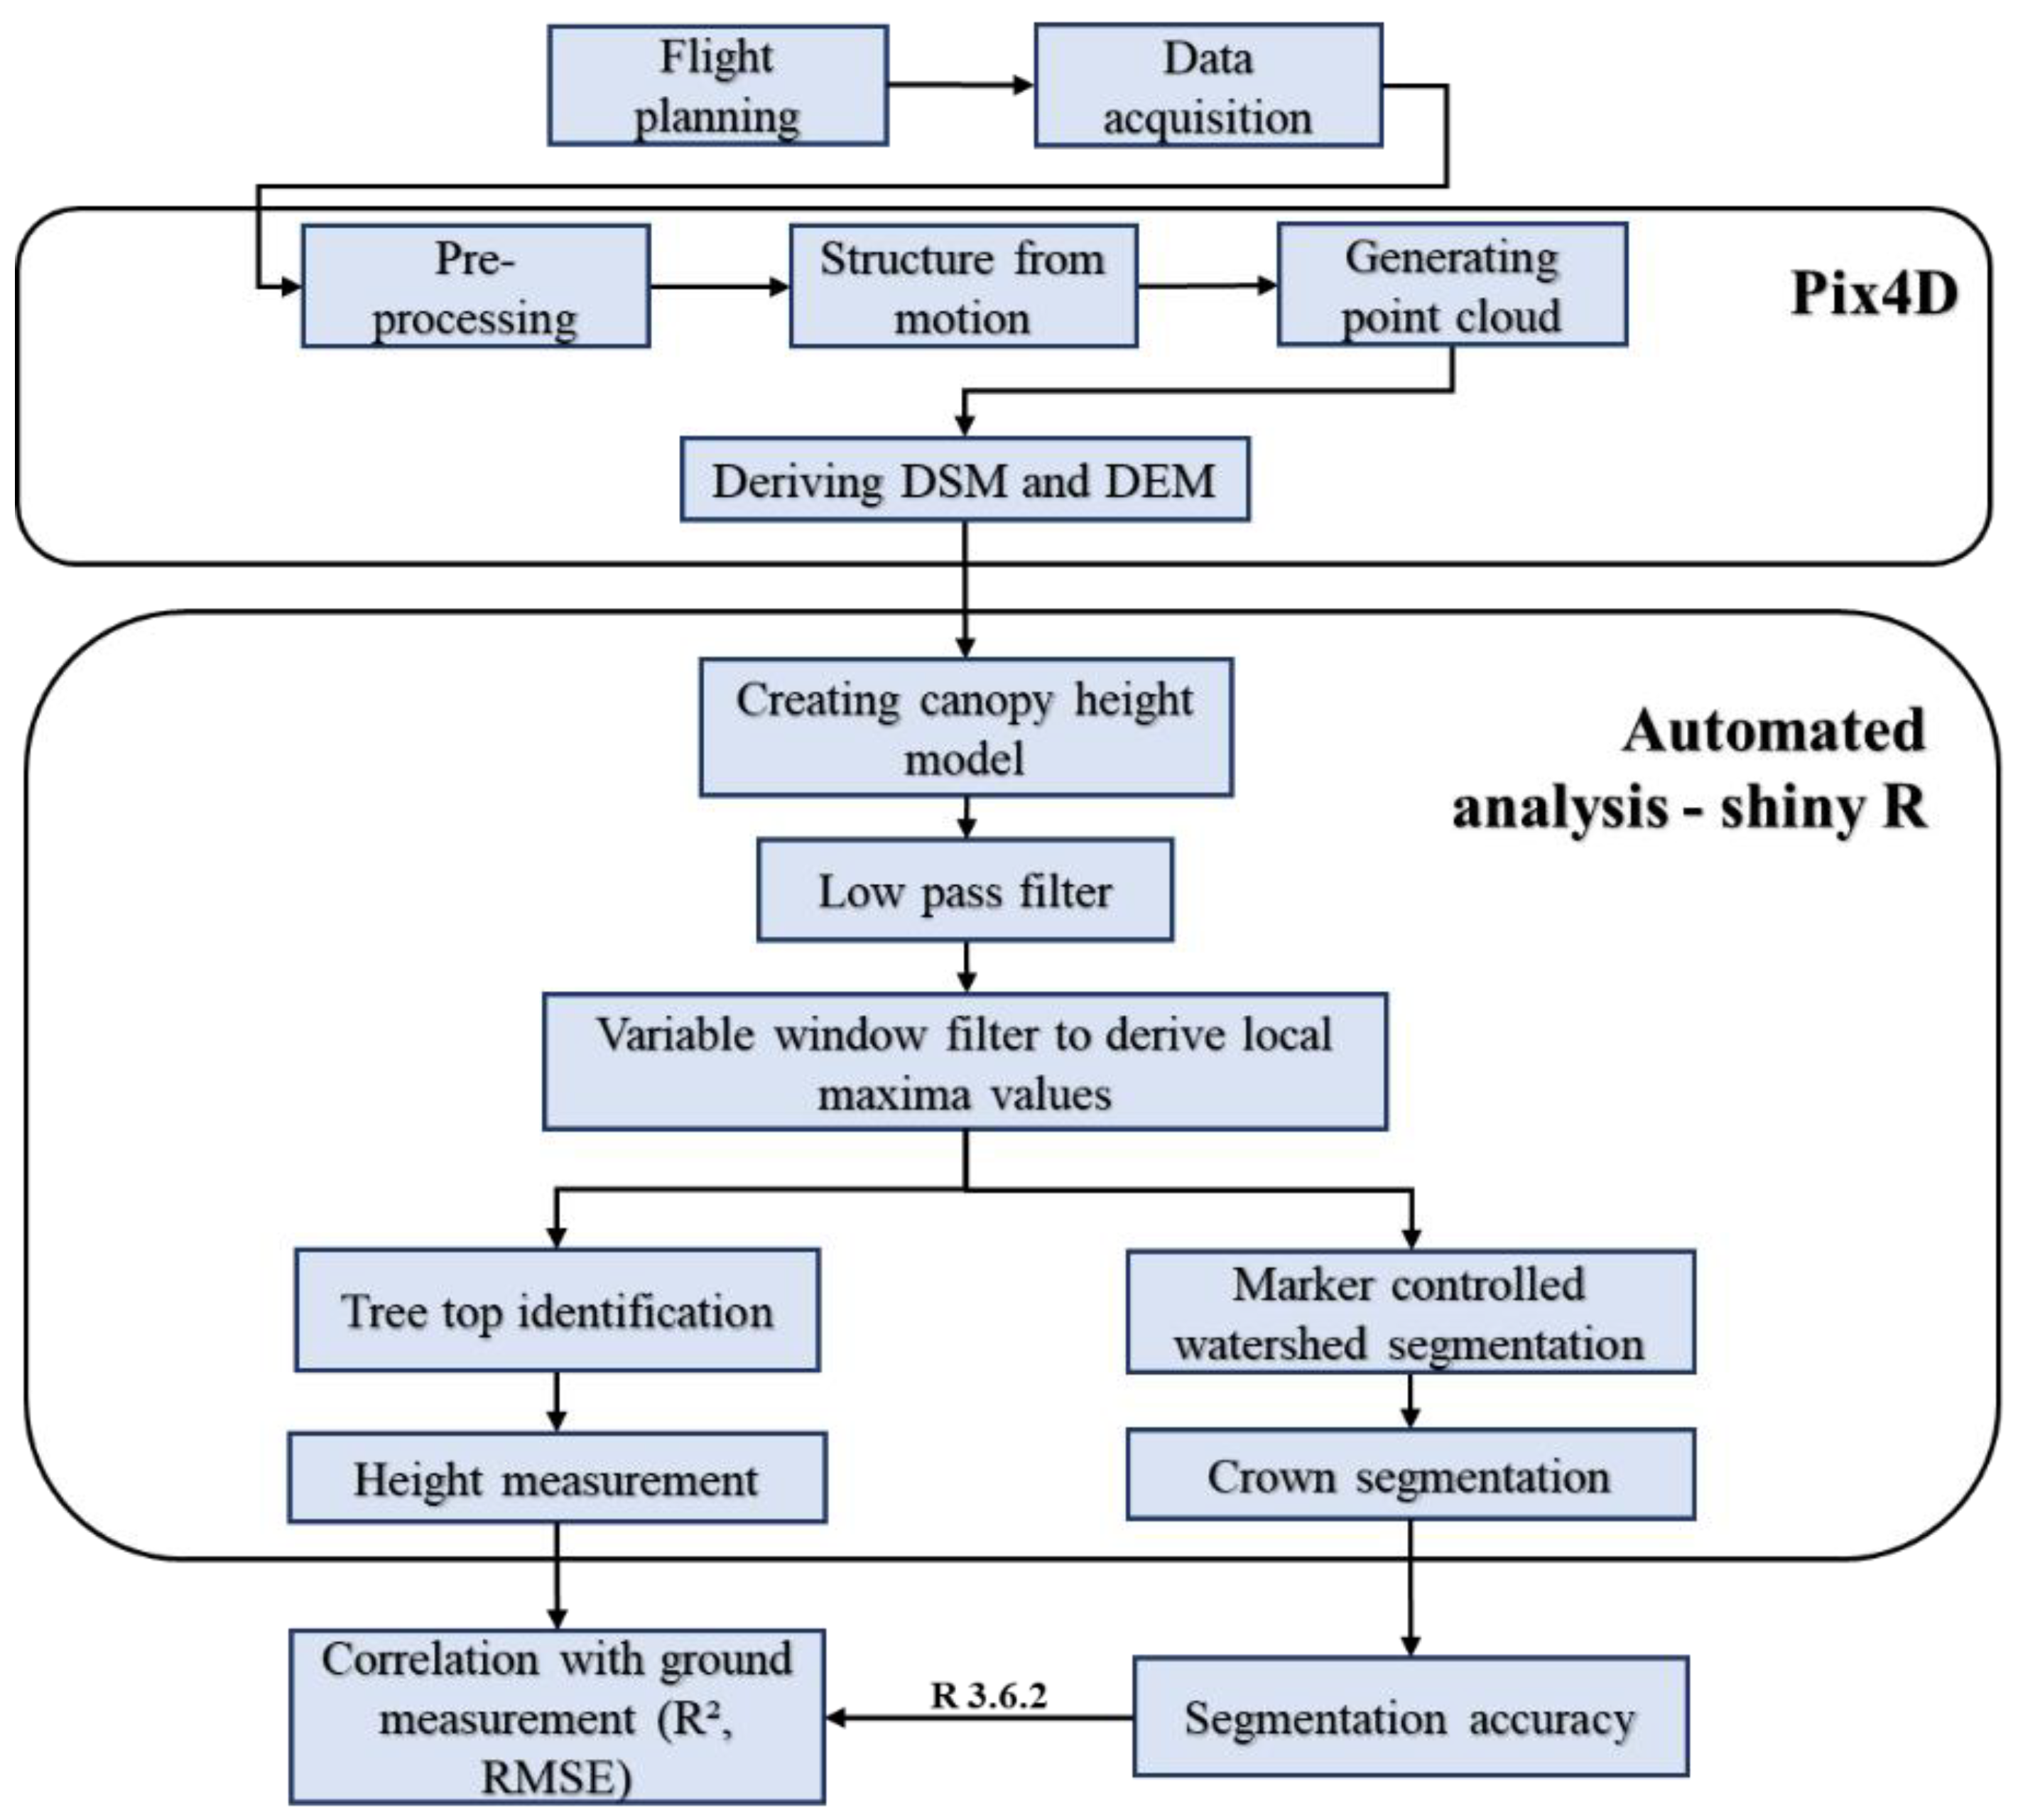
2.2. UAS Data Processing
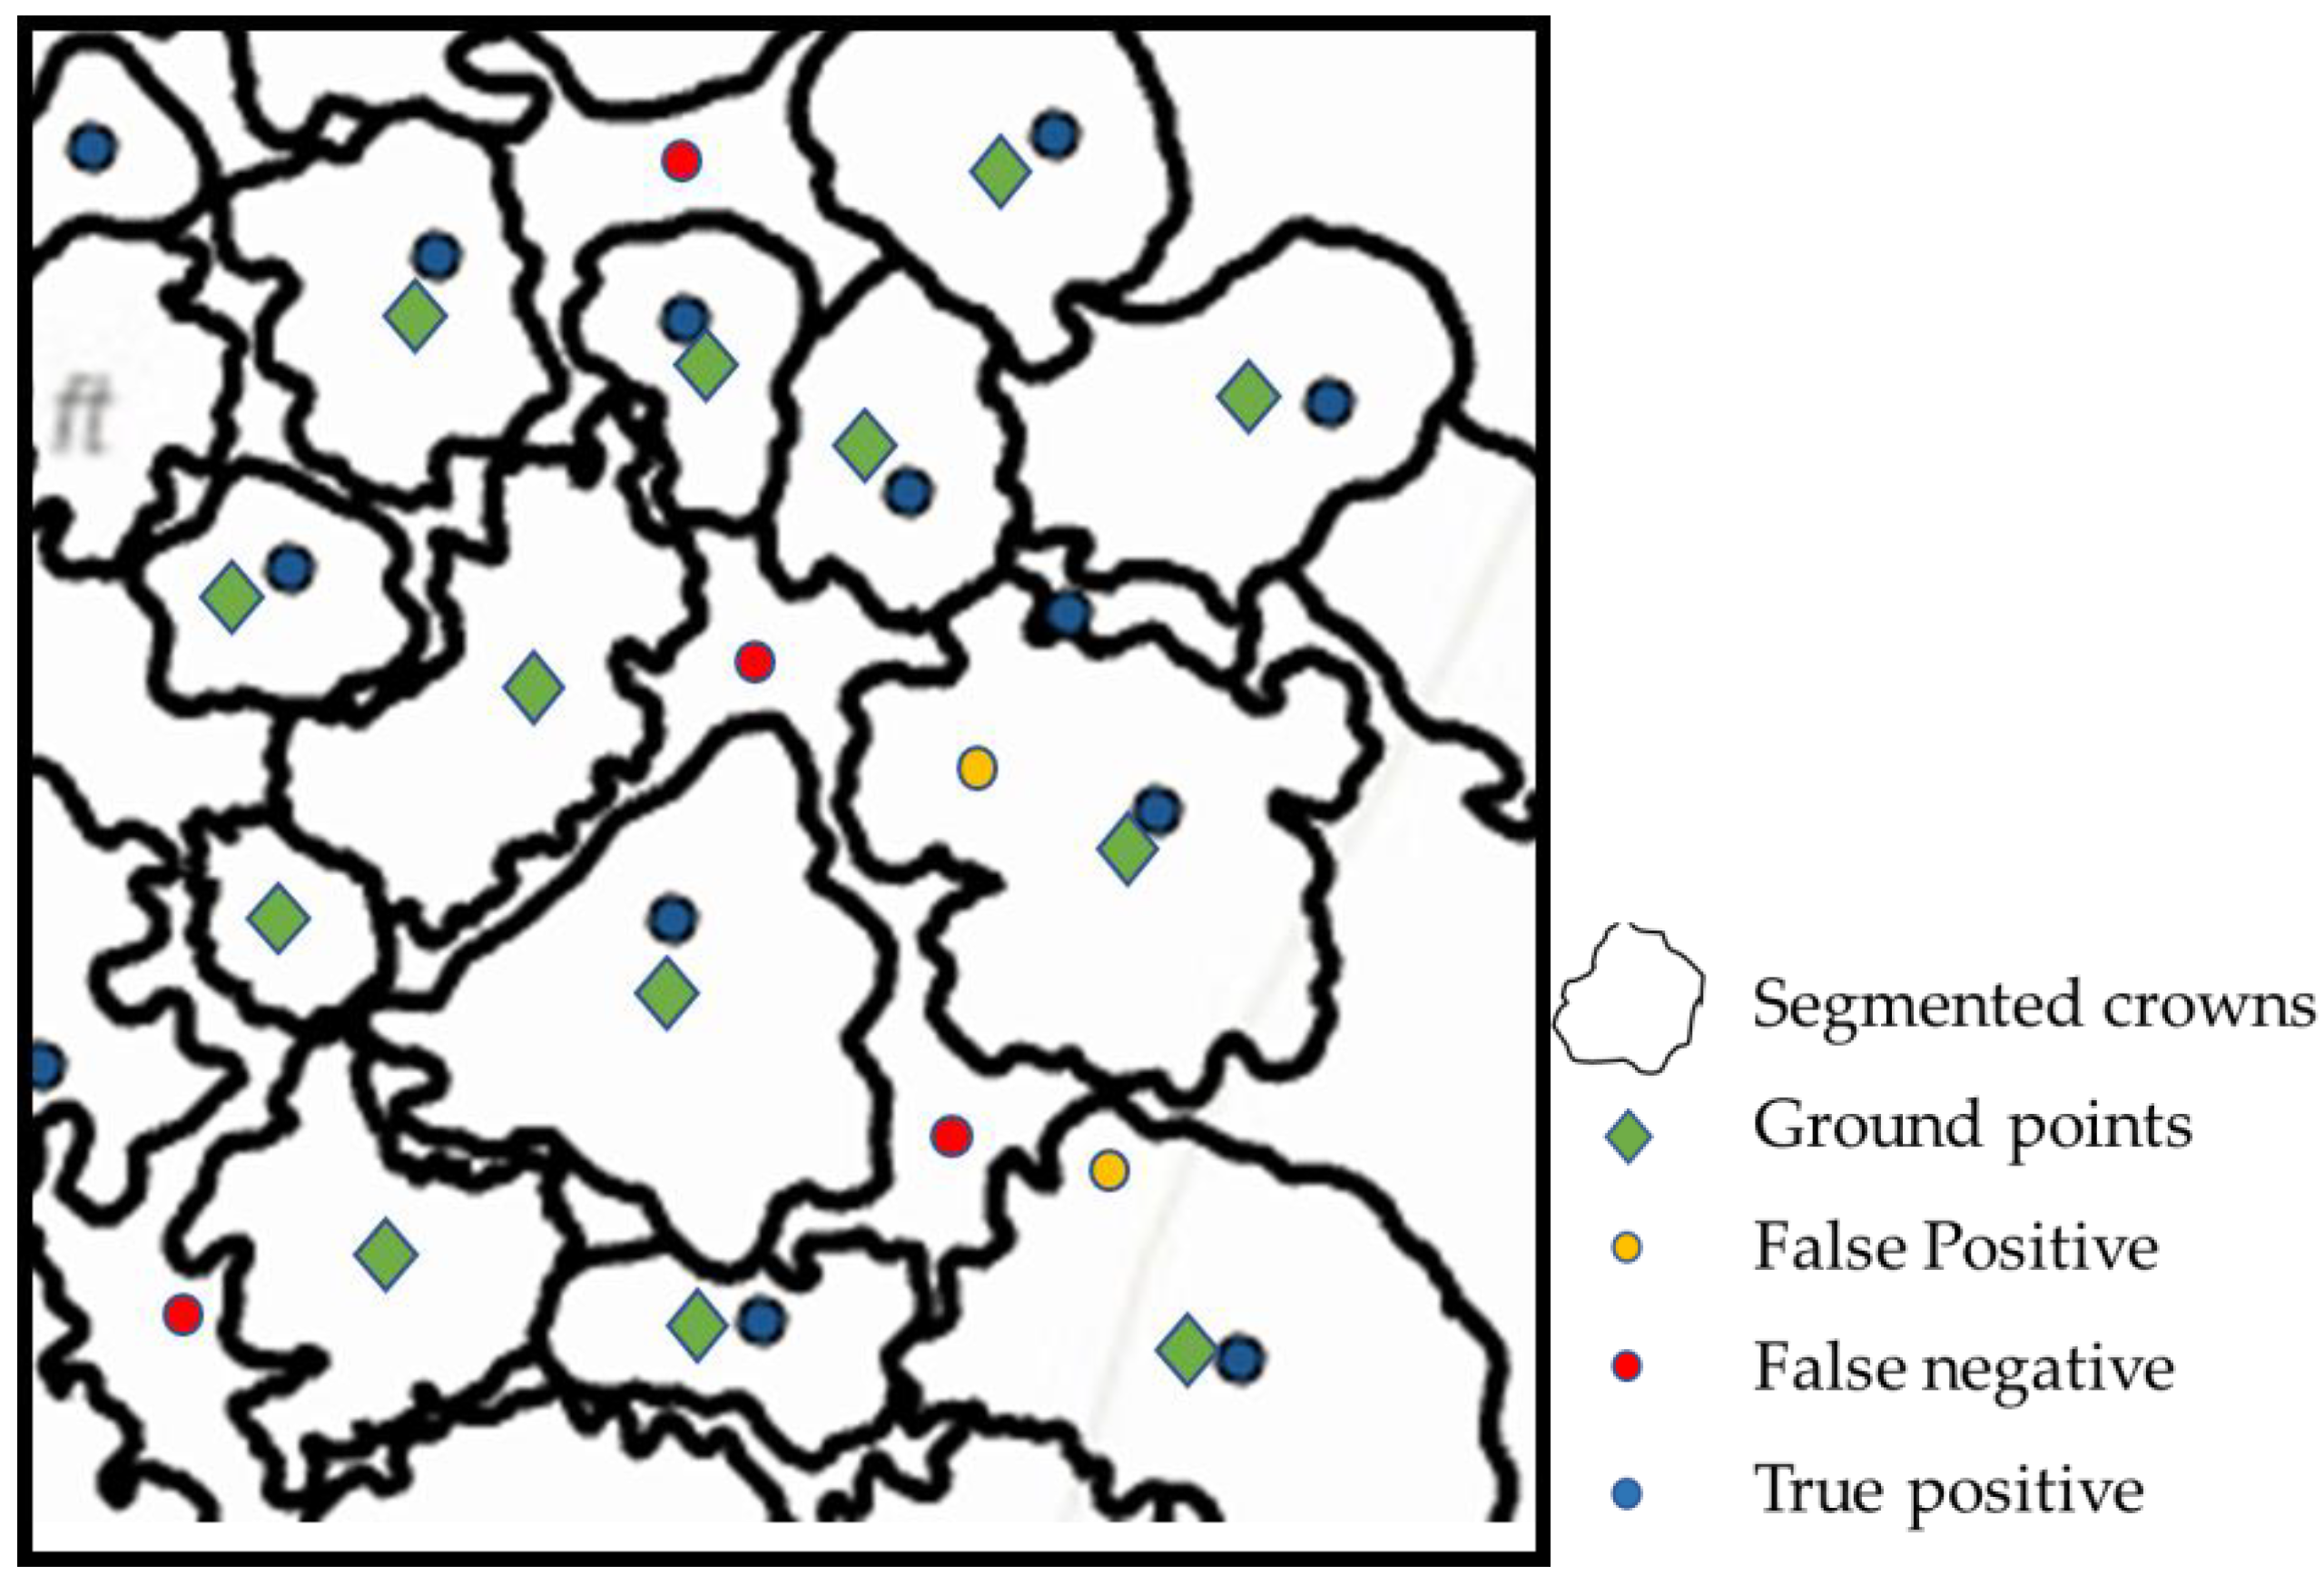
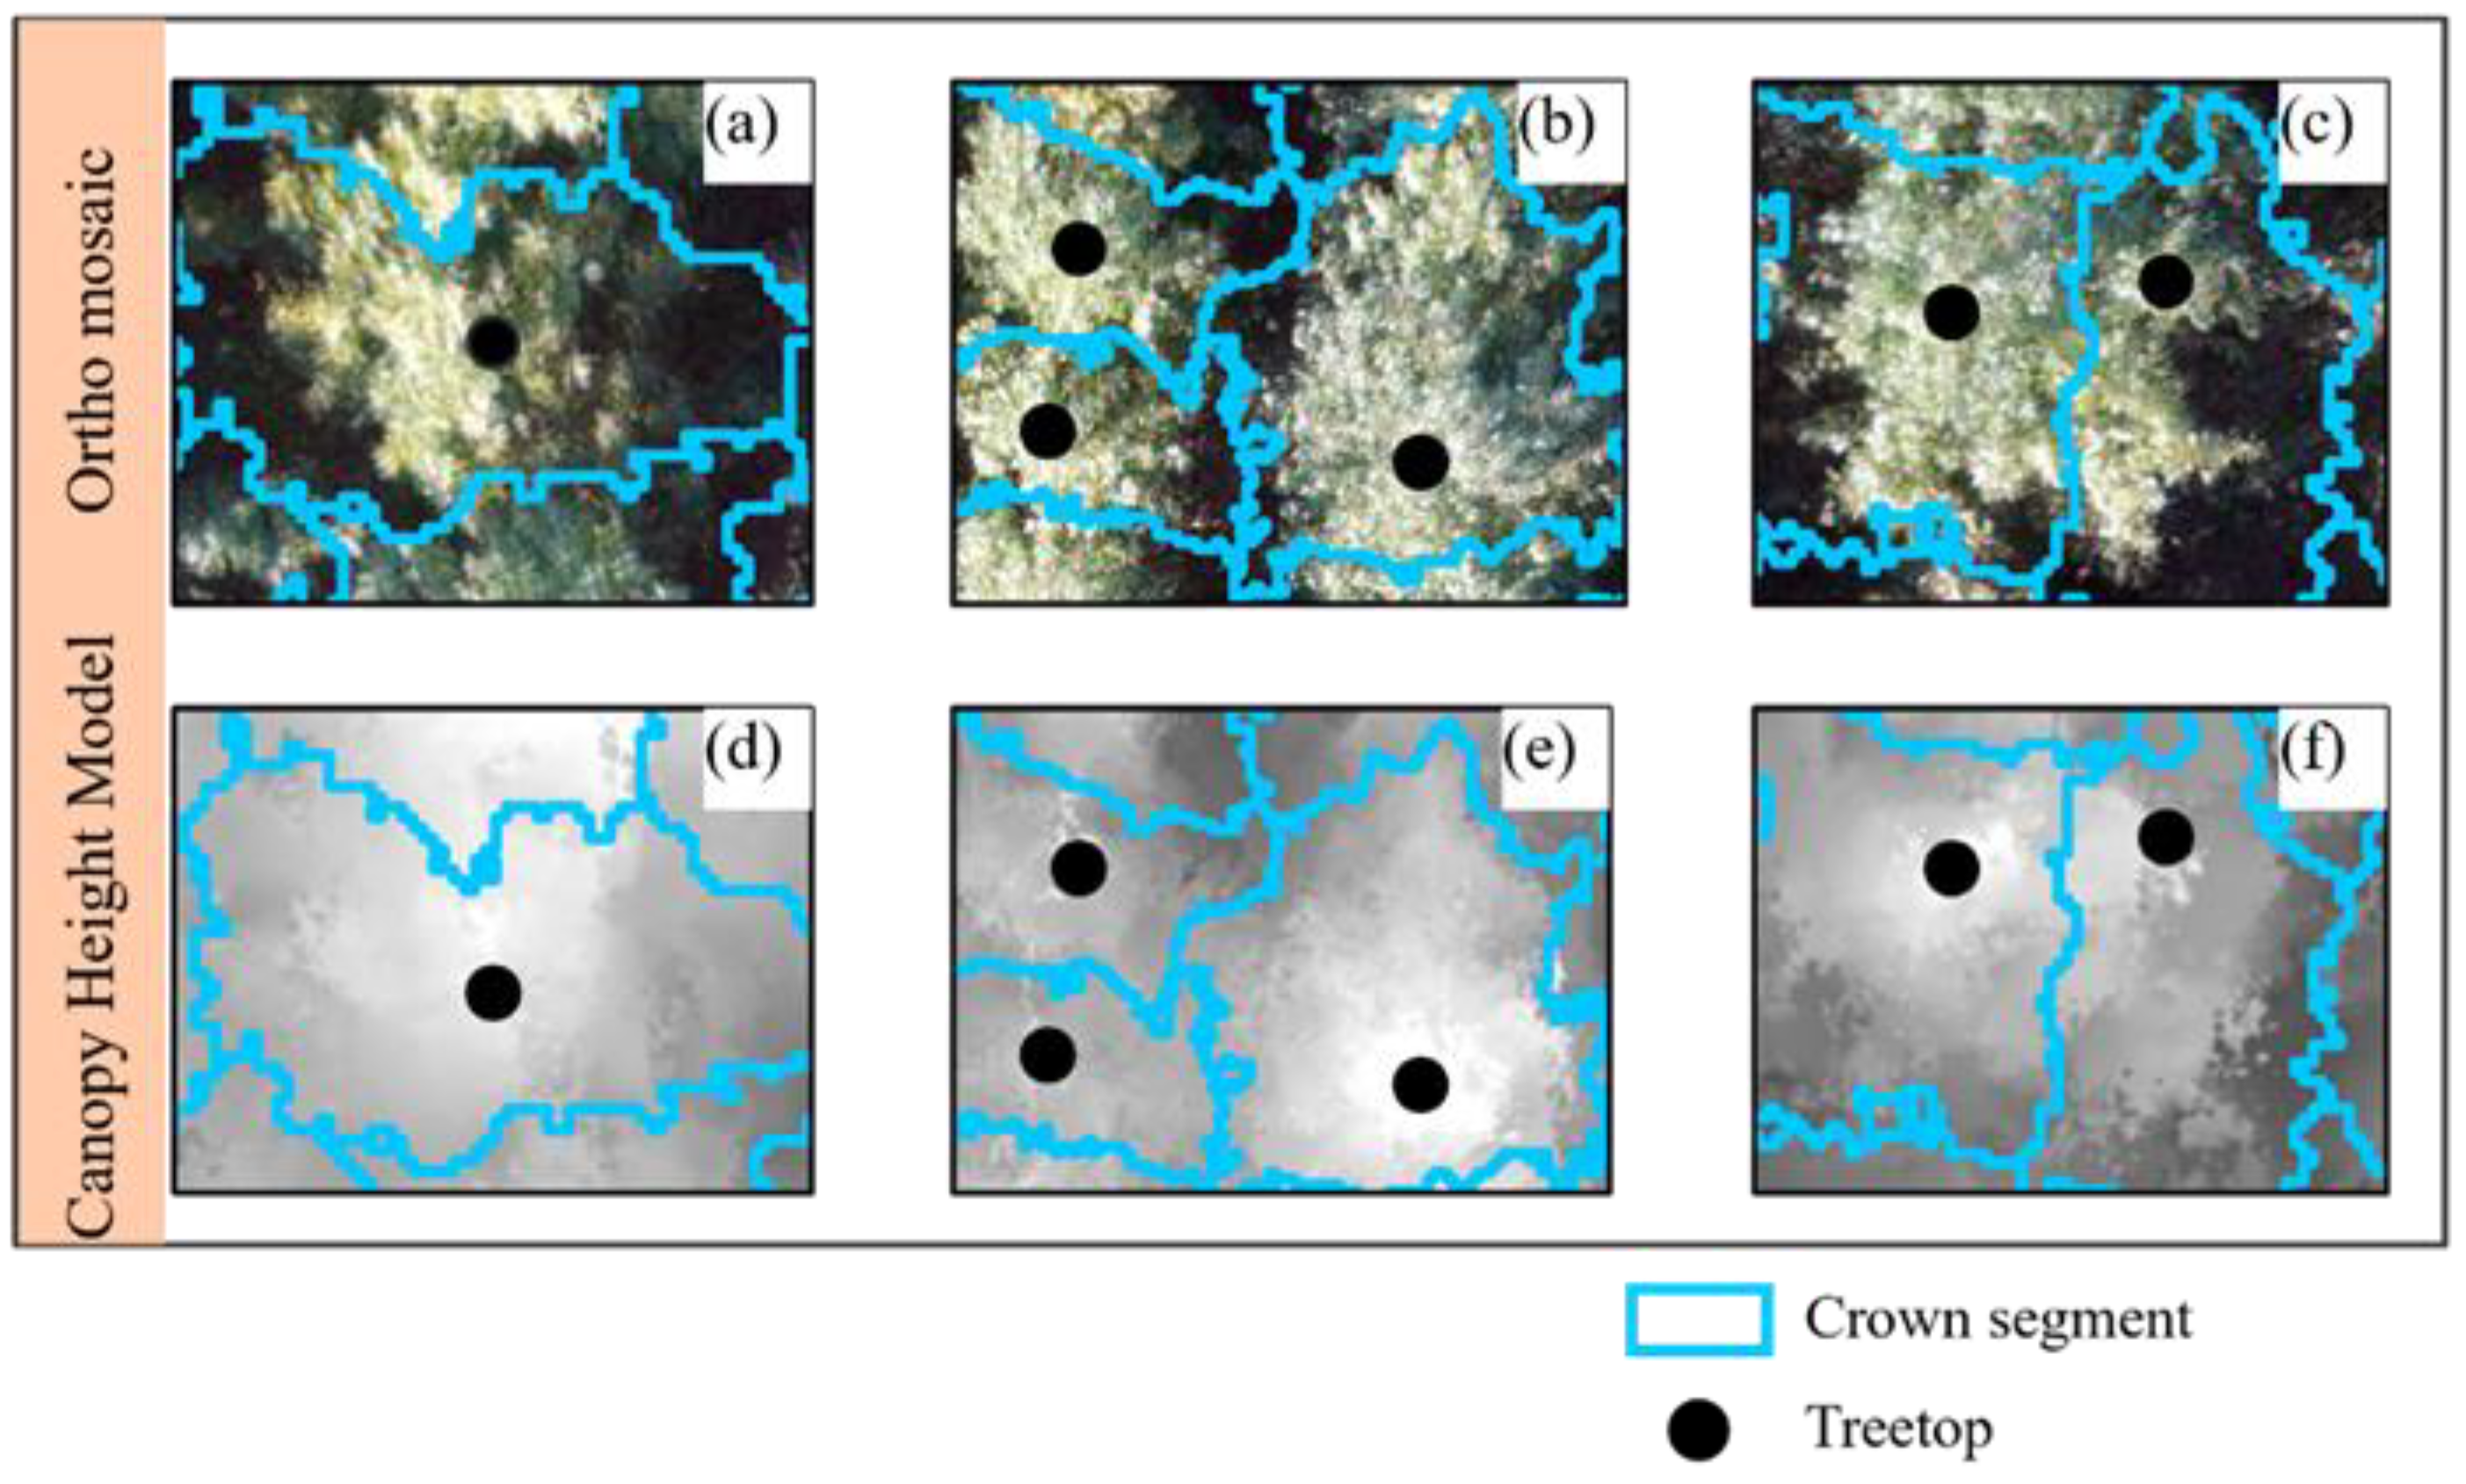
2.3. Individual Crown Detection and Height Measurement
2.4. Web-Based Automation
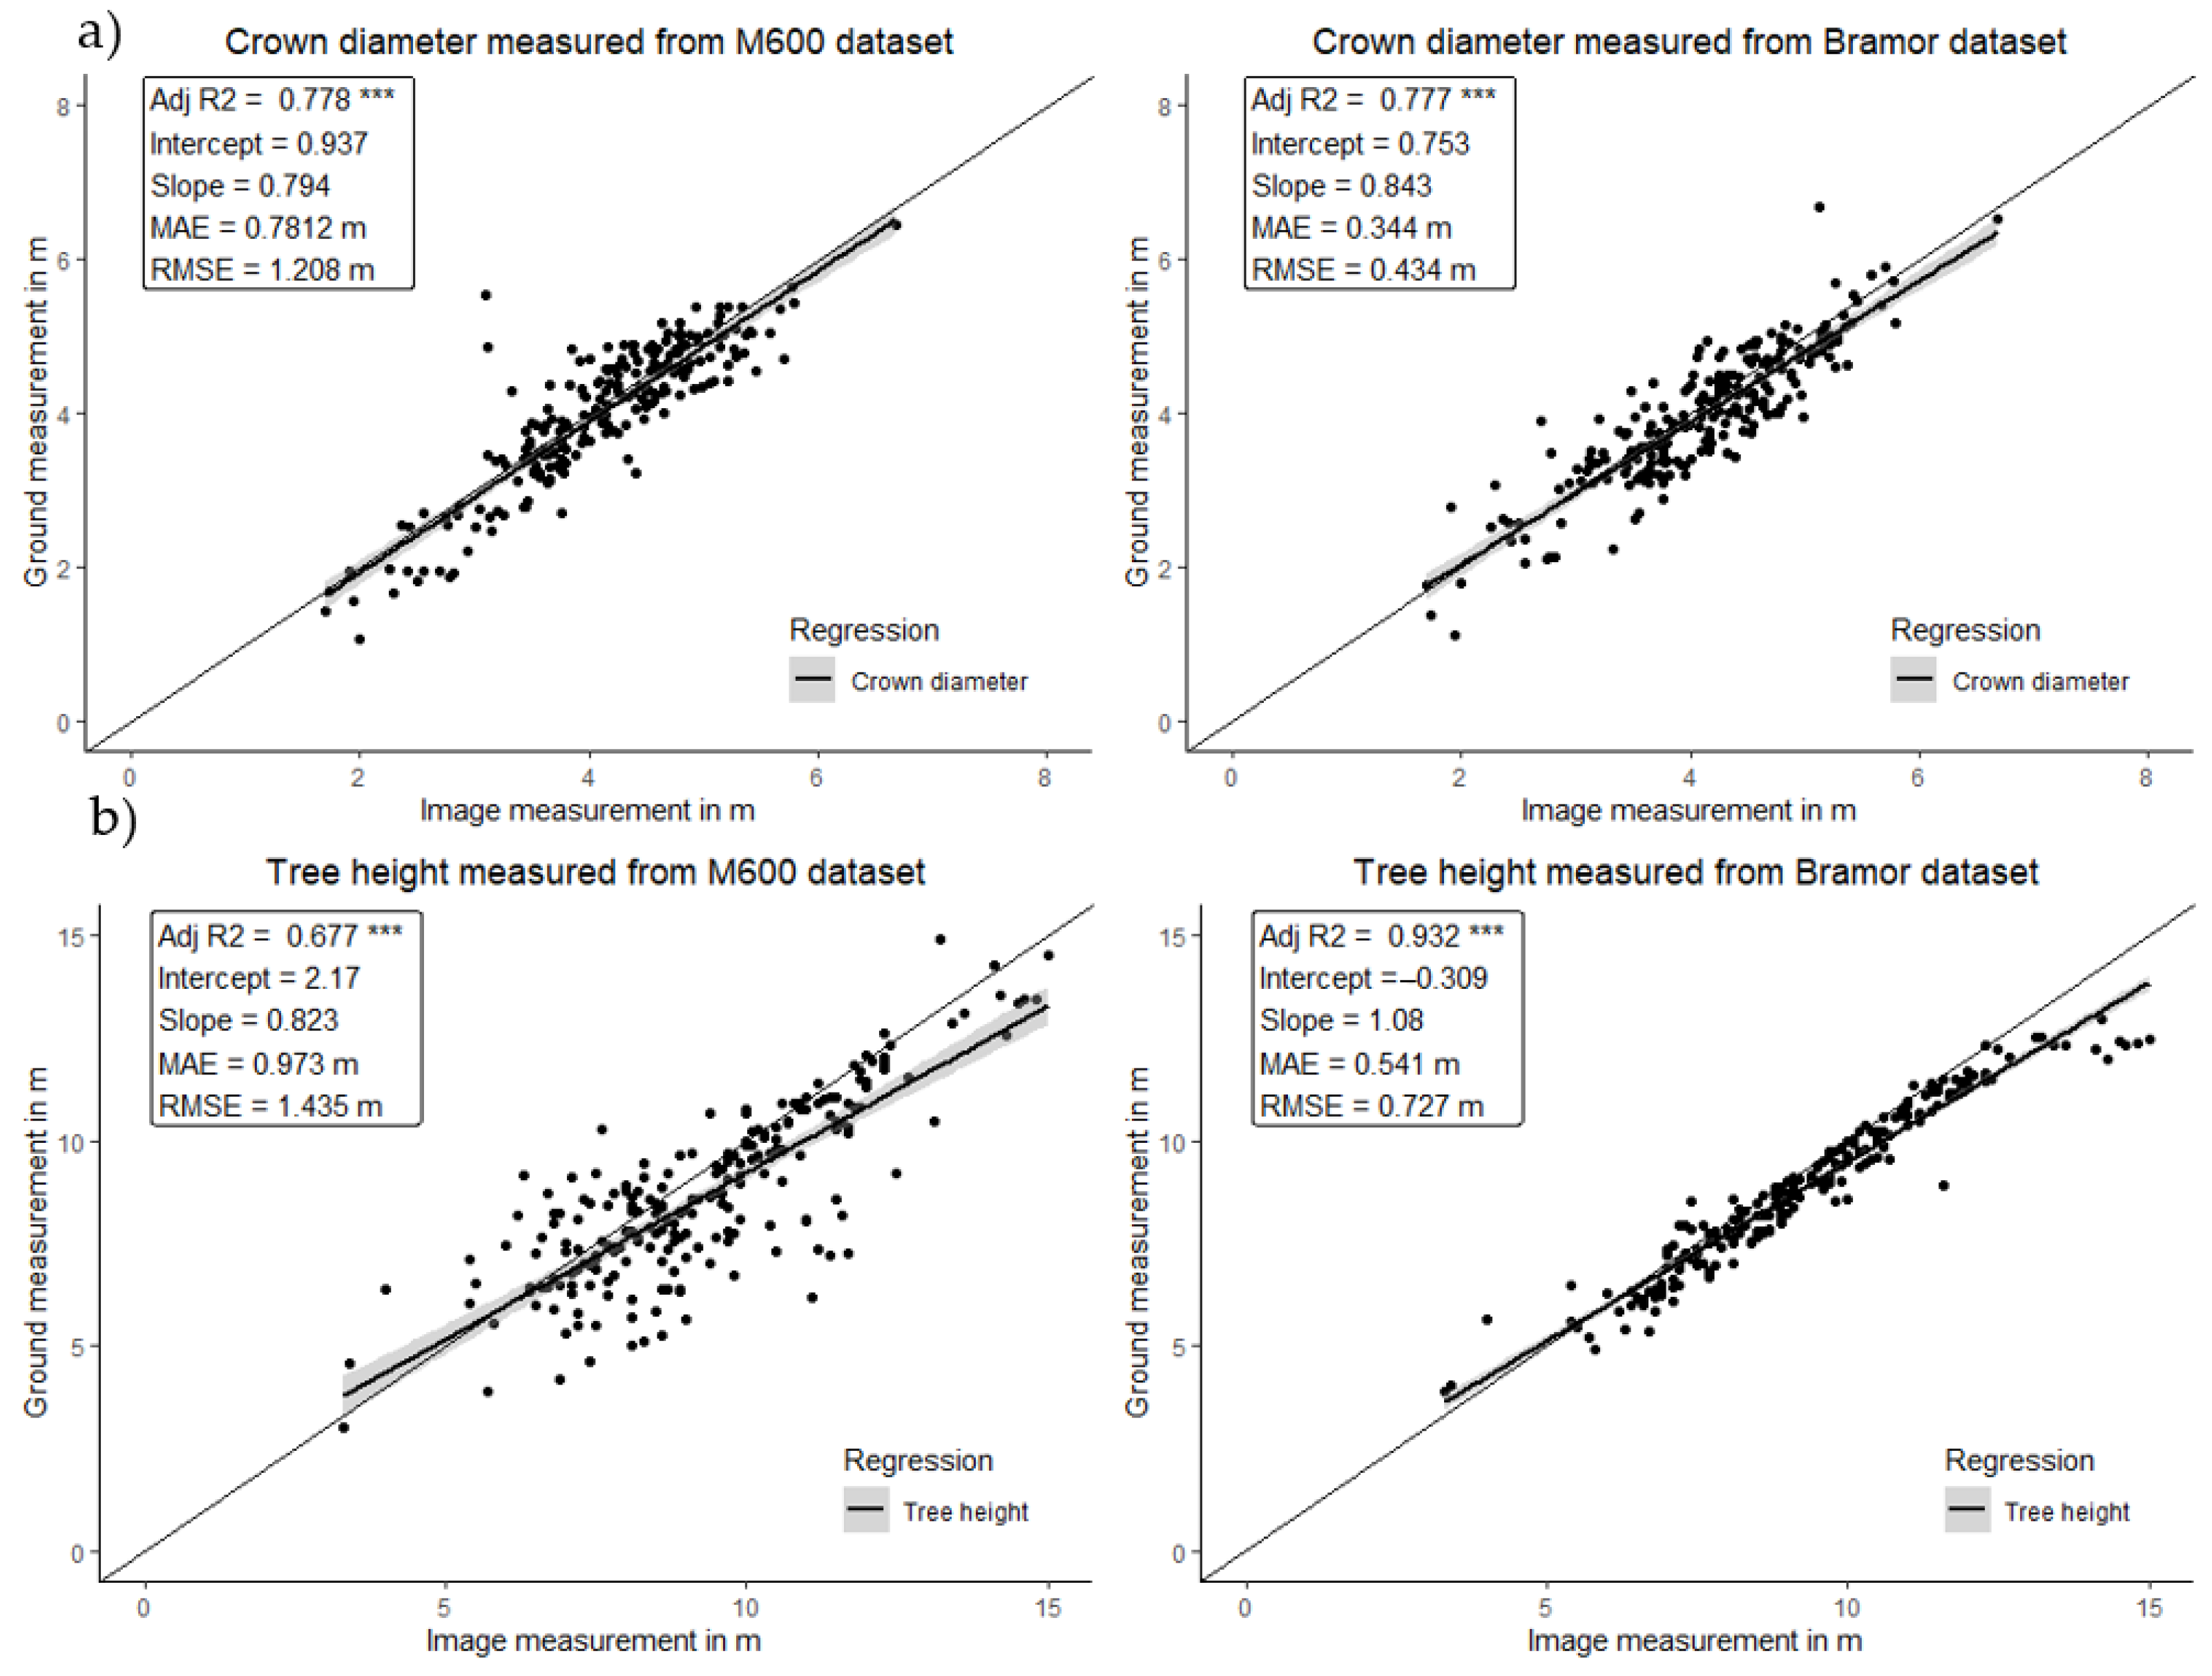
3. Results
4. Discussion
5. Conclusions
Author Contributions
Funding
Data Availability Statement
Acknowledgments
Conflicts of Interest
Appendix A

| Source | Application | UAS Model | UAS Platform | Software Used | Data Used and Steps | Automation Level | Assessment of Tree Height Measurement |
|---|---|---|---|---|---|---|---|
| [39] | Tree crown delineation; mixed forest | senseFly eBee | Fixed-wing | Agisoft | UAV-SfM-Region growing | Automated | Segment accuracy-0.85–0.88 |
| [3] | Tree delineation and measurement- conifer stands | Phantom 4 Pro | Multi-rotor | Agisoft | UAV-SfM | Semi-automated | RMSE: 0.62 m |
| [11] | Forest structure; Subtropical dry forest | Phantom 4 Pro | Multi-rotor | Agisoft | UAV-SfM | Semi-automated | r: 0.94 RMSE: 2.15 m |
| [13] | Tree height; coniferous trees | SenseFly eBee | Fixed-wing | Pix4D-GCP | DSM point clouds and LMF | Semi-Automated | R2: 0.94 RMSE: 28 cm |
| [17] | Tree detection; coniferous stands | Gatewing X100 | Fixed-wing | Micmac | DSM point clouds and LMF | Semi-Automated | R2: 0.83 * RMSE: 1.39 m |
| [14] | Tree segmentation; deciduous forest | * DJI P3 | Multi-rotor | Pix4D | LiDAR Point cloud | Manual | R2: 0.82 RMSE: 0.106 m |
| [28] | Tree height growth; temperate mixed forest | * DJI P3 Pro | Multi-rotor | Agisoft | Orthoimage | Manual | - |
| [38] | Tree detection; mixed conifer forest | * DJI P3 Quadcopter | Multi-rotor | Agisoft | Point cloud to generate CHM | Semi-automated | Overall tree detection accuracy–0.85 |
| [50] | Tree height: Scots pine | OctoXLOctocopter | Multi-rotor | Pix4D | Point clouds and orthomosaic–LMF | Semi-automated | R2: 0.971 RMSE: 0.34 m |
| [15] | Tree height; pine trees | 3D Robotics Solo | Multi-rotor | Agisoft | LiDAR point clouds and UAS imagery- LMF | Semi-automated | R2: 0.82 RMSE: 2.92 m |
| [22] | Tree height; Douglas fir | Gyrocopter | Multi-rotor | SURE Aerial | LiDAR and UAV point clouds | Semi-automated | RMSE: 1.09 m |
Appendix B
| Initial Processing | User Settings |
|---|---|
| Input image coordinate system | WGS84 EGM Geoid |
| Output image coordinate system | WGS84/ UTM zone 16N (EGM 96 Geoid) |
| Key point image scale | Full, Image scale = 0.5 |
| Matching image pairs | Aerial grid or corridor |
| Key point extraction: Targeted number of key points | Automatic |
| Calibration method | Standard |
| Internal parameters optimization | All |
| External parameters optimization | All |
| Point Cloud Optimization | |
| Image scale | 1/2 image size; multiscale |
| Point density | Optimal |
| Minimum number of matches | 3 |
| 3D Textured mesh resolution | Medium resolution (default) |
| DSM, Orthomosaic and Index | |
| DSM and orthomosaic resolution | 1 × GSD |
| Noise filtering | Yes |
| Surface smoothing | Yes; type: sharp |
| Raster DSM generation method | Triangulation |
| Orthomosaic | Generate, merge tiles and Geotiff without transparency |
Appendix C
Appendix D


References
- Němec, P. Comparison of Modern Forest Inventory Method with the Common Method for Management of Tropical Rainforest in the Peruvian Amazon. J. Trop. For. Sci. 2015, 27, 80–91. [Google Scholar]
- Gougeon, F.A.; Leckie, D.G. The Individual Tree Crown Approach Applied to Ikonos Images of a Coniferous Plantation Area. Photogramm. Eng. Remote Sens. 2006, 72, 1287–1297. [Google Scholar] [CrossRef]
- Creasy, M.B.; Tinkham, W.T.; Hoffman, C.M.; Vogeler, J.C. Potential for Individual Tree Monitoring in Ponderosa Pine Dominated Forests Using Unmanned Aerial System Structure from Motion Point Clouds. Can. J. For. Res. 2021, 51, 1093–1105. [Google Scholar] [CrossRef]
- Stoffels, J.; Mader, S.; Hill, J.; Werner, W.; Ontrup, G. Satellite-Based Stand-Wise Forest Cover Type Mapping Using a Spatially Adaptive Classification Approach. Eur. J. For. Res. 2012, 131, 1071–1089. [Google Scholar] [CrossRef]
- Marchetti, F.; Arbelo, M.; Moreno-Ruíz, J.A.; Hernández-Leal, P.A.; Alonso-Benito, A. Multitemporal WorldView Satellites Imagery for Mapping Chestnut Trees. In Proceedings of the SPIE—The International Society for Optical Engineering, Warsaw, Poland, 11–14 September 2017; Volume 10421. [Google Scholar] [CrossRef]
- Scheer, L.; Sltko, R. Assessment of Some Forest Characteristics Employing IKONOS Satellite Data. J. For. Sci. 2007, 53, 345–351. [Google Scholar] [CrossRef] [Green Version]
- Filewod, B.; Kant, S. Identifying Economically Relevant Forest Types from Global Satellite Data. For. Policy Econ. 2021, 127, 102452. [Google Scholar] [CrossRef]
- North, E.A.; D’Amato, A.W.; Russell, M.B. Performance Metrics for Street and Park Trees in Urban Forests. J. For. 2018, 116, 547–554. [Google Scholar] [CrossRef] [Green Version]
- Goodbody, T.R.H.; Coops, N.C.; Marshall, P.L.; Tompalski, P.; Crawford, P. Unmanned Aerial Systems for Precision Forest Inventory Purposes: A Review and Case Study. For. Chron. 2017, 93, 71–81. [Google Scholar] [CrossRef] [Green Version]
- Frayer, W.E.; Furnival, G.M. Forest Survey Sampling Designs: A History. J. For. 1999, 97, 4–10. [Google Scholar] [CrossRef]
- Gobbi, B.; van Rompaey, A.; Loto, D.; Gasparri, I.; Vanacker, V. Comparing Forest Structural Attributes Derived from UAV-Based Point Clouds with Conventional Forest Inventories in the Dry Chaco. Remote Sens. 2020, 12, 4005. [Google Scholar] [CrossRef]
- Tang, L.; Shao, G. Drone Remote Sensing for Forestry Research and Practices. J. For. Res. 2015, 26, 791–797. [Google Scholar] [CrossRef]
- Birdal, A.C.; Avdan, U.; Türk, T. Estimating Tree Heights with Images from an Unmanned Aerial Vehicle. Geomat. Nat. Hazards Risk 2017, 8, 1144–1156. [Google Scholar] [CrossRef] [Green Version]
- Carr, J.C.; Slyder, J.B. Individual Tree Segmentation from a Leaf-off Photogrammetric Point Cloud. Int. J. Remote Sens. 2018, 39, 5195–5210. [Google Scholar] [CrossRef]
- Fankhauser, K.E.; Strigul, N.S.; Gatziolis, D. Augmentation of Traditional Forest Inventory and Airborne Laser Scanning with Unmanned Aerial Systems and Photogrammetry for Forest Monitoring. Remote Sens. 2018, 10, 1562. [Google Scholar] [CrossRef] [Green Version]
- Caruso, G.; Zarco-Tejada, P.J.; González-Dugo, V.; Moriondo, M.; Tozzini, L.; Palai, G.; Rallo, G.; Hornero, A.; Primicerio, J.; Gucci, R. High-Resolution Imagery Acquired from an Unmanned Platform to Estimate Biophysical and Geometrical Parameters of Olive Trees under Different Irrigation Regimes. PLoS ONE 2019, 14, e0210804. [Google Scholar] [CrossRef] [Green Version]
- Bonnet, S.; Lisein, J.; Lejeune, P. Comparison of UAS Photogrammetric Products for Tree Detection and Characterization of Coniferous Stands. Int. J. Remote Sens. 2017, 38, 5310–5337. [Google Scholar] [CrossRef]
- Cromwell, C.; Giampaolo, J.; Hupy, J.; Miller, Z.; Chandrasekaran, A. A Systematic Review of Best Practices for UAS Data Collection in Forestry-Related Applications. Forests 2021, 12, 957. [Google Scholar] [CrossRef]
- Kuželka, K.; Surový, P. Mapping Forest Structure Using UAS inside Flight Capabilities. Sensors 2018, 18, 2245. [Google Scholar] [CrossRef] [Green Version]
- Guimarães, N.; Pádua, L.; Marques, P.; Silva, N.; Peres, E.; Sousa, J.J. Forestry Remote Sensing from Unmanned Aerial Vehicles: A Review Focusing on the Data, Processing and Potentialities. Remote Sens. 2020, 12, 1046. [Google Scholar] [CrossRef] [Green Version]
- Torresan, C.; Berton, A.; Carotenuto, F.; di Gennaro, S.F.; Gioli, B.; Matese, A.; Miglietta, F.; Vagnoli, C.; Zaldei, A.; Wallace, L. Forestry Applications of UAVs in Europe: A Review. Int. J. Remote Sens. 2017, 38, 2427–2447. [Google Scholar] [CrossRef]
- Ganz, S.; Käber, Y.; Adler, P. Measuring Tree Height with Remote Sensing—A Comparison of Photogrammetric and LiDAR Data with Different Field Measurements. Forests 2019, 10, 694. [Google Scholar] [CrossRef] [Green Version]
- Pasher, J.; King, D.J. Mapping Dead Wood Distribution in a Temperate Hardwood Forest Using High Resolution Airborne Imagery. For. Ecol. Manag. 2009, 258, 1536–1548. [Google Scholar] [CrossRef]
- Dorigo, W.; Lucieer, A.; Podobnikar, T.; Carni, A. Mapping Invasive Fallopia Japonica by Combined Spectral, Spatial, and Temporal Analysis of Digital Orthophotos. Int. J. Appl. Earth Obs. Geoinf. 2012, 19, 185–195. [Google Scholar] [CrossRef]
- Dash, J.P.; Watt, M.S.; Paul, T.S.H.; Morgenroth, J.; Pearse, G.D. Early Detection of Invasive Exotic Trees Using UAV and Manned Aircraft Multispectral and LiDAR Data. Remote Sens. 2019, 11, 1812. [Google Scholar] [CrossRef] [Green Version]
- Shin, J.; Seo, W.; Kim, T.; Park, J.; Woo, C. Using UAV Multispectral Images for Classification of Forest Burn Severity—A Case Study of the 2019 Gangneung Forest Fire. Forests 2019, 10, 1025. [Google Scholar] [CrossRef] [Green Version]
- Meng, R.; Wu, J.; Zhao, F.; Cook, B.D.; Hanavan, R.P.; Serbin, S.P. Measuring Short-Term Post-Fire Forest Recovery across a Burn Severity Gradient in a Mixed Pine-Oak Forest Using Multi-Sensor Remote Sensing Techniques. Remote Sens. Environ. 2018, 210, 282–296. [Google Scholar] [CrossRef]
- Dempewolf, J.; Nagol, J.; Hein, S.; Thiel, C.; Zimmermann, R. Measurement of Within-Season Tree Height Growth in a Mixed Forest Stand Using UAV Imagery. Forests 2017, 8, 231. [Google Scholar] [CrossRef] [Green Version]
- Panagiotidis, D.; Abdollahnejad, A.; Surový, P.; Chiteculo, V. Determining Tree Height and Crown Diameter from High-Resolution UAV Imagery. Int. J. Remote Sens. 2017, 38, 2392–2410. [Google Scholar] [CrossRef]
- Kachamba, J.D.; Ørka, O.H.; Gobakken, T.; Eid, T.; Mwase, W. Biomass Estimation Using 3D Data from Unmanned Aerial Vehicle Imagery in a Tropical Woodland. Remote Sens. 2016, 8, 968. [Google Scholar] [CrossRef] [Green Version]
- Jones, A.R.; Raja Segaran, R.; Clarke, K.D.; Waycott, M.; Goh, W.S.H.; Gillanders, B.M. Estimating Mangrove Tree Biomass and Carbon Content: A Comparison of Forest Inventory Techniques and Drone Imagery. Front. Mar. Sci. 2020, 6, 784. [Google Scholar] [CrossRef] [Green Version]
- Guerra-Hernández, J.; González-Ferreiro, E.; Monleón, V.J.; Faias, S.P.; Tomé, M.; Díaz-Varela, R.A. Use of Multi-Temporal UAV-Derived Imagery for Estimating Individual Tree Growth in Pinus Pinea Stands. Forests 2017, 8, 300. [Google Scholar] [CrossRef]
- Iizuka, K.; Yonehara, T.; Itoh, M.; Kosugi, Y. Estimating Tree Height and Diameter at Breast Height (DBH) from Digital Surface Models and Orthophotos Obtained with an Unmanned Aerial System for a Japanese Cypress (Chamaecyparis Obtusa) Forest. Remote Sens. 2018, 10, 13. [Google Scholar] [CrossRef] [Green Version]
- Piermattei, L.; Karel, W.; Wang, D.; Wieser, M.; Mokroš, M.; Surový, P.; Koreň, M.; Tomaštík, J.; Pfeifer, N.; Hollaus, M. Terrestrial Structure from Motion Photogrammetry for Deriving Forest Inventory Data. Remote Sens. 2019, 11, 950. [Google Scholar] [CrossRef] [Green Version]
- Novotný, J.; Hanuš, J.; Lukeš, P.; Kaplan, V. Individual Tree Crowns Delineation Using Local Maxima Approach and Seeded Region Growing Technique. In Proceedings of the Symposium GIS Ostrava, Ostrava, Czech Republic, 24–26 January 2011; pp. 23–26. [Google Scholar]
- Korpela, I.; Anttila, P.; Pitkänen, J. The Performance of a Local Maxima Method for Detecting Individual Tree Tops in Aerial Photographs. Int. J. Remote Sens. 2006, 27, 1159–1175. [Google Scholar] [CrossRef]
- Monnet, J.-M.; Mermin, E.; Chanussot, J.; Berger, F. Tree Top Detection Using Local Maxima Filtering: A Parameter Sensitivity Analysis. In Proceedings of the 10th International Conference on LiDAR Applications for Assessing Forest Ecosystems (Silvilaser 2010), Freivurg, Germany, 14–17 September 2010. [Google Scholar]
- Mohan, M.; Silva, A.C.; Klauberg, C.; Jat, P.; Catts, G.; Cardil, A.; Hudak, T.A.; Dia, M. Individual Tree Detection from Unmanned Aerial Vehicle (UAV) Derived Canopy Height Model in an Open Canopy Mixed Conifer Forest. Forests 2017, 8, 340. [Google Scholar] [CrossRef] [Green Version]
- Gu, J.; Congalton, R.G. Individual Tree Crown Delineation from UAS Imagery Based on Region Growing by Over-Segments With a Competitive Mechanism. IEEE Trans. Geosci. Remote Sens. 2022, 60, 1–11. [Google Scholar] [CrossRef]
- Gougeon, F.A. A Crown-Following Approach to the Automatic Delineation of Individual Tree Crowns in High Spatial Resolution Aerial Images. Can. J. Remote Sens. 1995, 21, 274–284. [Google Scholar] [CrossRef]
- Pirotti, F. Assessing a Template Matching Approach for Tree Height and Position Extraction from Lidar-Derived Canopy Height Models of Pinus Pinaster Stands. Forests 2010, 1, 194–208. [Google Scholar] [CrossRef]
- Wang, L.; Gong, P.; Biging, G.S. Individual Tree-Crown Delineation and Treetop Detection in High-Spatial-Resolution Aerial Imagery. Photogramm. Eng. Remote Sens. 2004, 70, 351–357. [Google Scholar] [CrossRef] [Green Version]
- Jaskierniak, D.; Lucieer, A.; Kuczera, G.; Turner, D.; Lane, P.N.J.; Benyon, R.G.; Haydon, S. Individual Tree Detection and Crown Delineation from Unmanned Aircraft System (UAS) LiDAR in Structurally Complex Mixed Species Eucalypt Forests. ISPRS J. Photogramm. Remote Sens. 2021, 171, 171–187. [Google Scholar] [CrossRef]
- Parvati, K.; Prakasa Rao, B.S.; Mariya Das, M. Image Segmentation Using Gray-Scale Morphology and Marker-Controlled Watershed Transformation. Discret. Dyn. Nat. Soc. 2008, 2008, 384346. [Google Scholar] [CrossRef] [Green Version]
- Li, B.; Pan, M.; Wu, Z. An Improved Segmentation of High Spatial Resolution Remote Sensing Image Using Marker-Based Watershed Algorithm. In Proceedings of the 2012 20th International Conference on Geoinformatics, Hong Kong, China, 15–17 June 2012; pp. 1–5. [Google Scholar] [CrossRef]
- Yin, D.; Wang, L. Individual Mangrove Tree Measurement Using UAV-Based LiDAR Data: Possibilities and Challenges. Remote Sens. Environ. 2019, 223, 34–49. [Google Scholar] [CrossRef]
- Nuijten, R.J.G.; Coops, N.C.; Goodbody, T.R.H.; Pelletier, G. Examining the Multi-Seasonal Consistency of Individual Tree Segmentation on Deciduous Stands Using Digital Aerial Photogrammetry (DAP) and Unmanned Aerial Systems (UAS). Remote Sens. 2019, 11, 739. [Google Scholar] [CrossRef] [Green Version]
- Zhen, Z.; Quackenbush, L.J.; Zhang, L. Impact of Tree-Oriented Growth Order in Marker-Controlled Region Growing for Individual Tree Crown Delineation Using Airborne Laser Scanner (ALS) Data. Remote Sens. 2014, 6, 555–579. [Google Scholar] [CrossRef] [Green Version]
- Amiri, N. Assessment of Marker-Controlled Watershed Segmentation Algorithm for Individual Tree Top Detection and Crown Delineation. Ph.D. Thesis, University of Twente Faculty of Geo-Information and Earth Observation (ITC), Enschede, The Netherlands, 2014. [Google Scholar]
- Krause, S.; Sanders, G.M.T.; Mund, J.-P.; Greve, K. UAV-Based Photogrammetric Tree Height Measurement for Intensive Forest Monitoring. Remote Sens. 2019, 11, 758. [Google Scholar] [CrossRef] [Green Version]
- R core Team. R: A Language and Environment for Statistical Computing. 2014. Available online: https://www.r-project.org/ (accessed on 15 December 2021).
- ESRI. ArcGIS Pro Desktop. Redlands, CA: Environmental Systems Research Institute. 2011. Available online: https://www.esri.com/en-us/arcgis/products/arcgis-pro/ (accessed on 15 December 2021).
- Miller, Z.M.; Hupy, J.; Chandrasekaran, A.; Shao, G.; Fei, S. Application of Postprocessing Kinematic Methods with UAS Remote Sensing in Forest Ecosystems. J. For. 2021, 119, 454–466. [Google Scholar] [CrossRef]
- Iglhaut, J.; Cabo, C.; Puliti, S.; Piermattei, L.; O′Connor, J.; Rosette, J. Structure from Motion Photogrammetry in Forestry: A Review. Curr. For. Rep. 2019, 5, 155–168. [Google Scholar] [CrossRef] [Green Version]
- Pirotti, F.; Kobal, M.; Roussel, J. A Comparison of Tree Segmentation Methods Using very High Density Airborne Laser Scanner Data. ISPRS—Int. Arch. Photogramm. Remote Sens. Spat. Inf. Sci. 2017, 42, 285–290. [Google Scholar] [CrossRef] [Green Version]
- Wang, D.; Vallotton, P. Improved Marker-Controlled Watershed Segmentation with Local Boundary Priors. In Proceedings of the 2010 25th International Conference of Image and Vision Computing New Zealand, Queenstown, New Zealand, 8–9 November 2010; pp. 1–6. [Google Scholar] [CrossRef]
- Plowright, A.; Plowright, M.A. Package ‘ForestTools’. CRAN. 2018. Available online: https://github.com (accessed on 20 July 2020).
- Goutte, C.; Gaussier, E. A Probabilistic Interpretation of Precision, Recall and F-Score, with Implication for Evaluation. In European Conference on Information Retrieval; Springer: Berlin/Heidelberg, Germany, 2005; Volume 3408. [Google Scholar] [CrossRef]
- Sokolova, M.; Japkowicz, N.; Szpakowicz, S. Beyond Accuracy, F-Score and ROC: A Family of Discriminant Measures for Performance Evaluation BT-AI 2006: Advances in Artificial Intelligence; Sattar, A., Kang, B., Eds.; Springer: Berlin/Heidelberg, Germany, 2006; pp. 1015–1021. [Google Scholar]
- Chang, W.; Cheng, J.; Allaire, J.; Xie, Y.; McPherson, J. Shiny: Web Application Framework for R. R Package Version 2017, 1, 2017. [Google Scholar]
- Mao, P.; Qin, L.; Hao, M.; Zhao, W.; Luo, J.; Qiu, X.; Xu, L.; Xiong, Y.; Ran, Y.; Yan, C.; et al. An Improved Approach to Estimate Above-Ground Volume and Biomass of Desert Shrub Communities Based on UAV RGB Images. Ecol. Indic. 2021, 125, 107494. [Google Scholar] [CrossRef]
- Moe, T.K.; Owari, T.; Furuya, N.; Hiroshima, T. Comparing Individual Tree Height Information Derived from Field Surveys, LiDAR and UAV-DAP for High-Value Timber Species in Northern Japan. Forests 2020, 11, 223. [Google Scholar] [CrossRef] [Green Version]
- Luoma, V.; Saarinen, N.; Wulder, M.A.; White, J.C.; Vastaranta, M.; Holopainen, M.; Hyyppä, J. Assessing Precision in Conventional Field Measurements of Individual Tree Attributes. Forests 2017, 8, 38. [Google Scholar] [CrossRef] [Green Version]
- Sullivan, F.B.; Ducey, M.J.; Orwig, D.A.; Cook, B.; Palace, M.W. Comparison of Lidar- and Allometry-Derived Canopy Height Models in an Eastern Deciduous Forest. For. Ecol. Manag. 2017, 406, 83–94. [Google Scholar] [CrossRef]
- Strîmbu, V.F.; Strîmbu, B.M. A Graph-Based Segmentation Algorithm for Tree Crown Extraction Using Airborne LiDAR Data. ISPRS J. Photogramm. Remote Sens. 2015, 104, 30–43. [Google Scholar] [CrossRef] [Green Version]
- OpenDroneMap. WebODM: Drone Mapping Software (Version 1.1.0). Available online: https://www.opendronemap.org/webodm/ (accessed on 1 August 2021).
- Wu, C. VisualSFM: A Visual Structure from Motion System. Available online: http://ccwu.me/vsfm/ (accessed on 15 December 2021).
- Berra, E.F. Individual Tree Crown Detection and Delineation across a Woodland Using Leaf-on and Leaf-off Imagery from a UAV Consumer-Grade Camera. J. Appl. Remote Sens. 2020, 14, 34501. [Google Scholar] [CrossRef]
| Field Characteristics | Data | Method of Ground Measurement | |
|---|---|---|---|
| Top left Coordinates | 40°26′36″ N, −87°1′51″ W | 42°25′55″ N, −87°2′27″ W | - |
| Species | Red oak | Black walnut | Visual recognition on the ground |
| Tree count | 4668 | 213 | Manual count from orthomosaic and on ground |
| Height (m) | 3.3–15.6 * | - | Vortex IV hypsometer on ground |
| Crown size (m) | 1.7–6.7 * | - | Measuring tape on the ground |
| Specifications | C-Astral Bramor PPX | DJI M600 | |
|---|---|---|---|
| Flight properties | Platform | Fixed-wing  | Hex-rotor |
| Altitude (m) | 122 | 120 | |
| Maximum payload (kg) | 4 | 6 | |
| * Area covered in (square m) | 1,331,905.24 | 207,290 | |
| Flight time (min) | 25 | 24 | |
| Camera and sensor properties | Sensor | Sony RXI RII | Sony A6000 |
| Resolution (MP) | 42.4 | 24.2 | |
| Shutter speed (s) | 1/1600 | 1/1600 | |
| Focal length (mm) | 35 | 21 | |
| Aperture | F 4.5 | F 3.5 | |
| Image characteristics | Photo overlap (%) | 80 | 80 |
| Images captured | 1124 | 343 | |
| Images calibrated | 1113 | 341 | |
| Time | Flight | 00:25:00 | 00:24:00 |
| Processing | 16:02:58 | 03:48:59 | |
| Output | Coordinate system | WGS 84/UTM zone 16N | WGS 84/UTM zone 16N |
| Average point density (per m2) | 508 | 255 | |
| Number of 3D points | 282,244,973 | 51,100,953 | |
| Ground sampling distance (cm) | 1.67 | 2.14 | |
| DSM accuracy (m) | RMSEx | 0.0503 | 0.002 |
| RMSEy | 0.0149 | 0.0017 | |
| RMSEz | 0.133 | 0.0126 |
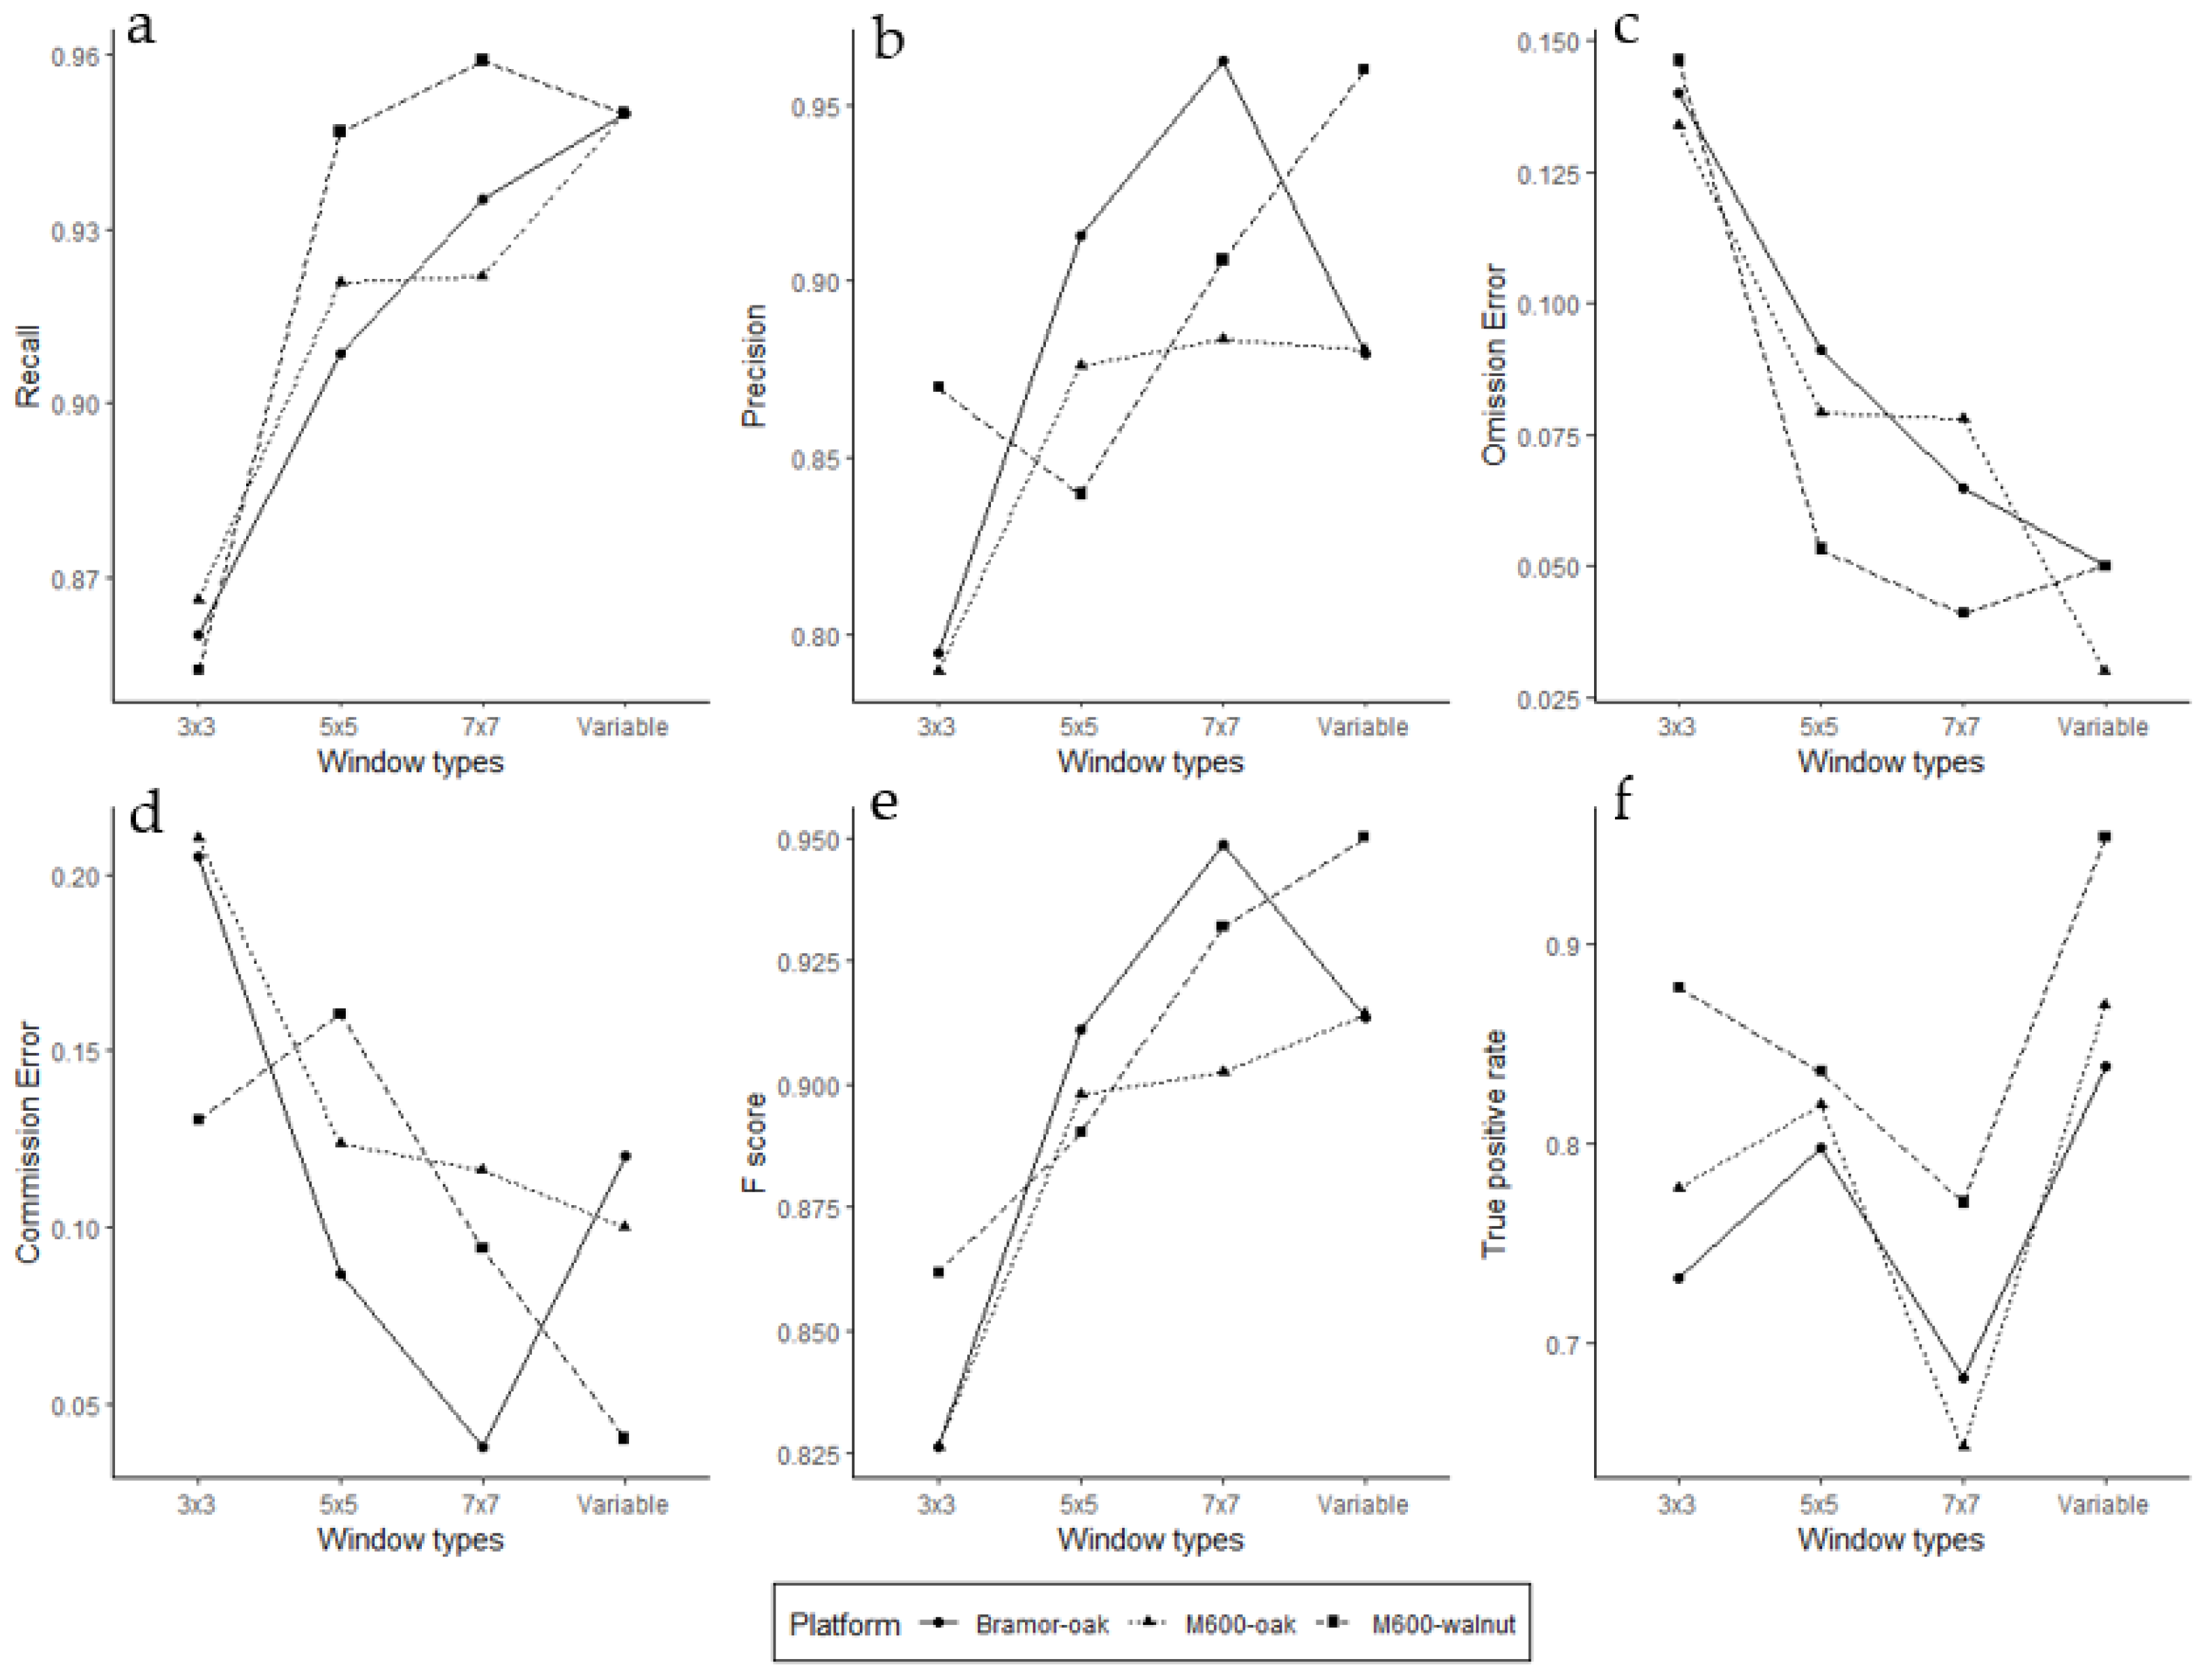
| Window Types | Recall (rc) | Precision (pr) | TP | FP | FN | 1 Omission Error | 2 Commission Error | F-Score | 3 Trees Detected | |
|---|---|---|---|---|---|---|---|---|---|---|
| Bramor-oak | 3 × 3 | 0.860 | 0.683 | 3416 | 1589 | 556 | 0.140 | 0.317 | 0.761 | 0.851 |
| 5 × 5 | 0.940 | 0.875 | 3954 | 564 | 253 | 0.060 | 0.125 | 0.906 | 0.968 | |
| 7 × 7 | 0.598 | 0.884 | 2467 | 324 | 1658 | 0.402 | 0.116 | 0.713 | 0.598 | |
| Variable | 0.950 | 0.883 | 3913 | 421 | 219 | 0.050 | 0.117 | 0.916 | 0.953 | |
| M600-oak | 3 × 3 | 0.895 | 0.724 | 3627 | 1382 | 425 | 0.105 | 0.276 | 0.801 | 0.868 |
| 5 × 5 | 0.947 | 0.908 | 4012 | 407 | 225 | 0.053 | 0.092 | 0.927 | 0.947 | |
| 7 × 7 | 0.794 | 0.812 | 2983 | 690 | 776 | 0.206 | 0.188 | 0.803 | 0.787 | |
| Variable | 0.950 | 0.901 | 4057 | 549 | 53 | 0.030 | 0.100 | 0.934 | 0.987 | |
| M600-walnut | 3 × 3 | 0.751 | 0.607 | 145 | 94 | 48 | 0.249 | 0.393 | 0.671 | 1.122 |
| 5 × 5 | 0.928 | 0.928 | 128 | 10 | 10 | 0.072 | 0.072 | 0.928 | 0.648 | |
| 7 × 7 | 0.880 | 0.863 | 176 | 28 | 24 | 0.120 | 0.137 | 0.871 | 0.958 | |
| Variable | 0.950 | 0.960 | 203 | 7 | 10 | 0.050 | 0.040 | 0.950 | 0.958 |
Publisher’s Note: MDPI stays neutral with regard to jurisdictional claims in published maps and institutional affiliations. |
© 2022 by the authors. Licensee MDPI, Basel, Switzerland. This article is an open access article distributed under the terms and conditions of the Creative Commons Attribution (CC BY) license (https://creativecommons.org/licenses/by/4.0/).
Share and Cite
Chandrasekaran, A.; Shao, G.; Fei, S.; Miller, Z.; Hupy, J. Automated Inventory of Broadleaf Tree Plantations with UAS Imagery. Remote Sens. 2022, 14, 1931. https://doi.org/10.3390/rs14081931
Chandrasekaran A, Shao G, Fei S, Miller Z, Hupy J. Automated Inventory of Broadleaf Tree Plantations with UAS Imagery. Remote Sensing. 2022; 14(8):1931. https://doi.org/10.3390/rs14081931
Chicago/Turabian StyleChandrasekaran, Aishwarya, Guofan Shao, Songlin Fei, Zachary Miller, and Joseph Hupy. 2022. "Automated Inventory of Broadleaf Tree Plantations with UAS Imagery" Remote Sensing 14, no. 8: 1931. https://doi.org/10.3390/rs14081931