Article

Method for Identifying Litchi Picking Position Based on YOLOv5 and PSPNet

1
School of Mechanical and Aerospace Engineering, Jilin University, Changchun 130025, China
2
School of Agricultural Engineering and Food Science, Shandong University of Technology, Zibo 255000, China
*
Author to whom correspondence should be addressed.
Remote Sens. 2022, 14(9), 2004; https://doi.org/10.3390/rs14092004
Submission received: 28 February 2022 / Revised: 8 April 2022 / Accepted: 19 April 2022 / Published: 21 April 2022
(This article belongs to the Special Issue UAVs in Sustainable Agriculture)

Abstract

:
China has the largest output of litchi in the world. However, at present, litchi is mainly picked manually, fruit farmers have high labor intensity and low efficiency. This means the intelligent unmanned picking system has broad prospects. The precise location of the main stem picking point of litchi is very important for the path planning of an unmanned system. Some researchers have identified the fruit and branches of litchi; however, there is relatively little research on the location of the main stem picking point of litchi. So, this paper presents a new open-access workflow for detecting accurate picking locations on the main stems and presents data used in the case study. At the same time, this paper also compares several different network architectures for main stem detection and segmentation and selects YOLOv5 and PSPNet as the most promising models for main stem detection and segmentation tasks, respectively. The workflow combines deep learning and traditional image processing algorithms to calculate the accurate location information of litchi main stem picking points in the litchi image. This workflow takes YOLOv5 as the target detection model to detect the litchi main stem in the litchi image, then extracts the detected region of interest (ROI) of the litchi main stem, uses PSPNet semantic segmentation model to semantically segment the ROI image of the main stem, carries out image post-processing operation on the ROI image of the main stem after semantic segmentation, and obtains the pixel coordinates of picking points in the ROI image of the main stem. After coordinate conversion, the pixel coordinates of the main stem picking points of the original litchi image are obtained, and the picking points are drawn on the litchi image. At present, the workflow can obtain the accurate position information of the main stem picking point in the litchi image. The recall and precision of this method were 76.29% and 92.50%, respectively, which lays a foundation for the subsequent work of obtaining the three-dimensional coordinates of the main stem picking point according to the image depth information, even though we have not done this work in this paper.

Graphical Abstract

1. Introduction

In 2017, China’s litchi planting area was about 5500 km2 and the output reached more than 2.3 million tons, making it the country with the largest litchi planting area and output in the world [1]. The picking period of litchi is short. If the mature litchi is not picked in time, the water content of litchi will gradually decrease and the epidermis will brown. Therefore, the timely, nondestructive, and efficient picking of mature litchi is very important and has a direct impact on the subsequent refrigeration, transportation, processing, and sales of litchi [2]. At present, the picking method of litchi is mainly manual, with low picking efficiency, high labor intensity of fruit farmers, and poor timeliness. Therefore, in order to improve the picking efficiency and reduce the picking time, it is necessary to develop an automatic fruit picking device [3]. As is well known, fruit picking robots can pick single fruits such as apples, pears, and oranges directly, but to pick cluster fruits such as litchis, tomatoes, and grapes the robots need to identify the main stem of each string of mature fruit, and then locate the picking point on the main stem [4]. The fruit-picking robot controls the end of the execution to cut or shear the main stem at the picking point; therefore, to realize cluster fruit picking, the accurate identification, and positioning of the picking points on the main stems of cluster fruits are crucial to pick cluster fruits successfully by fruit picking robot [5]. In the natural environment, the main factors that make it difficult to accurately obtain the main stem picking points of litchi are as follows: (1) bright or dim light in the main stems area of litchi clusters will affect the accurate identification and location of the picking points. (2) The occlusion of litchi leaves and other branches to the main stems of litchi clusters will also affect the identification and positioning of the picking points seriously. (3) The interference of non-main stems will also affect the identification and positioning of picking points [6].
At present, the target detection methods can be roughly divided into two categories. One is the traditional target detection method based on the characteristics of the color, shape, and contour of the detected objects; the other class is an object detection method based on combining machine vision and deep learning. For example, in the localization of picking points of litchi clusters in a dynamically disturbed environment, Xiong et al. [7] in the case of litchi clusters under different interference, used an improved fuzzy C-means clustering method for image segmentation, so as to separate litchi fruits and main stems of litchi clusters. Then, the binocular stereo matching algorithm is used to calculate the picking points. The results of the visual localization tests in the orchards are shown: the maximum depth error was 5.8 cm, and the minimum depth error was 0.4 cm. In the night environment, detection of litchi clusters and calculation of picking points on the main stem of litchi clusters, Xiong et al. [8] adopted the improved fuzzy clustering algorithm (FCM) to remove the background of the nighttime litchi clusters images first, then the fruits and the main stems of litchi clusters were segmented by using the Otsu algorithm. Finally, the picking points were obtained using the Harris corner points. The experimental results using this algorithm are shown: the night recognition accuracy of litchi clusters was 93.75%, and the average identification time was 0.516 s. Deng et al. [9] used the Cr component of the YCbCr color model to extract the foreground area of litchi clusters images, then litchi fruits were extracted by the K-means clustering algorithm. Finally, the main stems of litchi clusters were extracted by a litchi fruit images subtraction operation and morphological processing operation. The experimental results show that the success rate of the main stem extraction is 80%. Wang et al. [10] identified litchi by using the wavelet transform combined with the K-means clustering algorithm. Zhuang et al. [11] used the Retinex algorithm to segment the main stems of the litchi clusters, then used the Harris corners to obtain the picking points on the main stems, the accuracy of using this algorithm to locate the picking points of the litchi main stem is 83%. The above research methods mainly use traditional image processing methods. These methods are simple and have high positioning accuracy for picking points, but their robustness may not be very good.
With the rapid development of machine learning, deep learning has gained extensive applications in agriculture [12]. Fruit detection algorithms based on deep learning have higher accuracy and better robustness compared to traditional fruit detection algorithms. Apolo et al. [13] adopted Faster R-CNN [14] to detect citrus in the citrus images taken by the UAV, thus, to realize the evaluation of citrus yield in citrus orchards, the results show that the average standard error of the number of citrus fruits detected with the number of citrus fruits counted manually was 6.59%. Koirala et al. [15] developed a new architecture called “Mango YOLO” based on the features of YOLOv3 [16] and YOLOv2 (tiny) [17], the F1 score of mango detection using the Mango YOLO model was 0.968 with an average accuracy of 0.983. Xiong et al. [18] adopted the YOLOv2 model to detect mangoes in mango images taken by UAV, the detection accuracy of the algorithm was 96.1% with a recall of 89.0%, the number of mangoes assessed using this algorithm was compared to the manually counted number of mangoes with an evaluation error of 1.1%. Liu et al. [19] used color information of images under the RGB and HSI color space to train the BP neural network model, then used the trained BP neural network model to segment the apple. Sa et al. [20] adopted the Faster R-CNN object detection model and combined it with the multimodal image information fusion method to improve the sweet pepper detection recall from 0.807 to 0.838.
Recently, some researchers have begun to study the division of fruit stems and fruits. Guo et al. [21] marked the color litchi image to be grayed based on the Cr channel of YCbCr color space and proposed an image segmentation method based on the secondary threshold to segment the litchi fruits and the main stems, the recognition rates of litchi fruits and main stems were 91.67% and 86.67%, respectively. Liang et al. [6] adopted the YOLOV3 model to detect litchi fruits in the nighttime natural environment, then the regions of interest (ROI) of the litchi main stems were extracted according to the detection boxes of the main stems of litchi. Finally, the main stems ROI images were segmented by using U-Net [22] network. The average accuracy of litchi fruits detection was 96%, and the accuracy of litchi main stems segmentation was 95%. The above method only divided the litchi main stems, but the picking points of the main stems of litchi clusters were not further calculated, while the litchi-picking robot can only pick the identified litchi clusters after obtaining the three-dimensional coordinates of picking points of the main stems. There are few related studies on the calculation of picking points of the main stems. Zhong et al. [23] adopted the YOLACT [24] algorithm to make instant segmentation of the main stems of litchi clusters, then the skeleton of the main stems were extracted and the least square fitting was carried out to obtain the angle of the main stems and the position information of the picking points. The accuracy of picking points obtained by this algorithm was 89.7%, and the F1 score was 83.8%. Inspired by the above traditional image processing methods and deep learning methods, we consider combining the two methods and propose a new workflow to obtain the location information of the main stem picking point of litchi, which should have a better performance. At present, according to this workflow, we have obtained the accurate pixel coordinates of the main stem picking point in the litchi image, which will lay a foundation for our subsequent work to obtain the three-dimensional spatial information of the main stem picking point according to the depth information of the picking point obtained by the depth camera, although we have not done this work in this paper yet. The main contributions of this study are as follows: (1) presenting a new open-access workflow for detecting accurate picking locations on the main stems of litchi and presenting data used in the study. (2) Comparing several different network architectures for main stem detection and segmentation and selecting YOLOv5 and PSPNet as the most promising models for main stem detection and segmentation tasks, respectively.

2. Materials and Methods

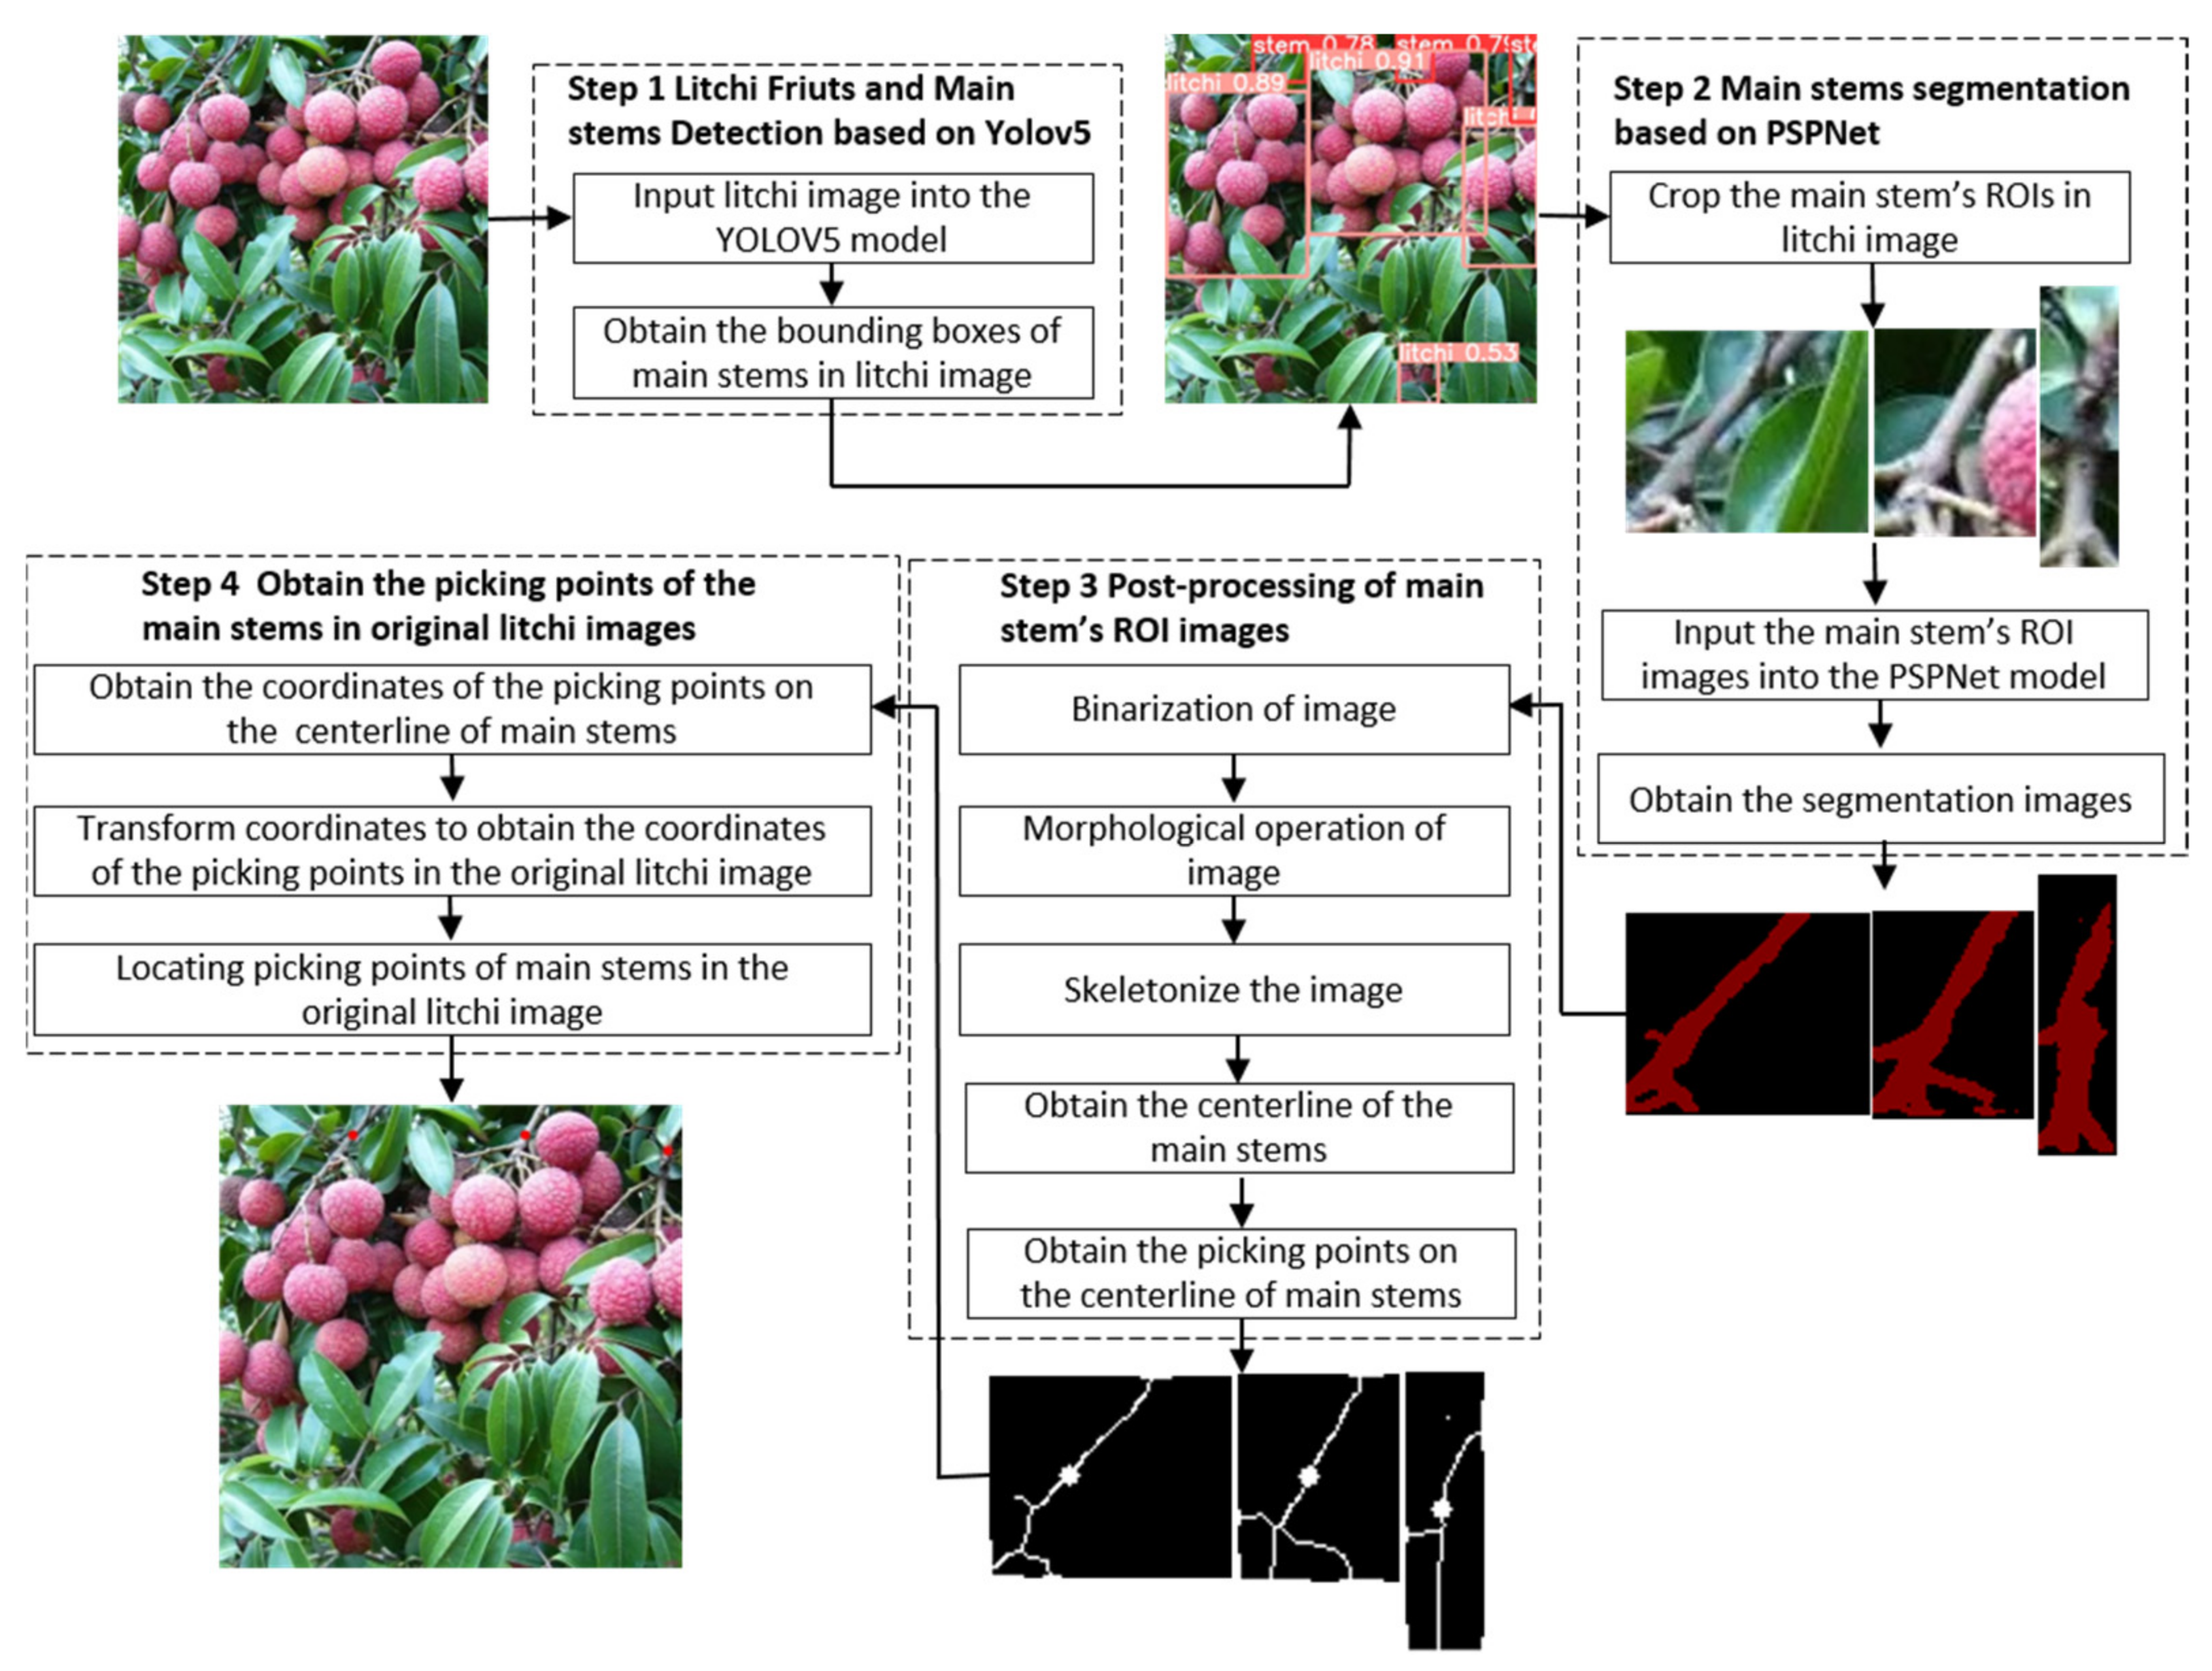
2.1. Overview of Acquisition Process of Picking Points of the Litchi Clusters

The flow chart of the algorithm for locating the main stem picking point of litchi proposed in this paper is shown in Figure 1. The location process of the main stem picking point of litchi can be roughly divided into the following four steps.
(1)
Step 1: Import the collected litchi image into the trained YOLOv5 model to detect the litchi fruits and main stems in the litchi image.
(2)
Step 2: According to the location information file of the litchi main stem detection boxes, extract the litchi main stem ROI images from the litchi image, and then import the extracted main stem ROI images into the trained PSPNet [25] semantic segmentation model, and perform semantic segmentation on the main stem ROI images.
(3)
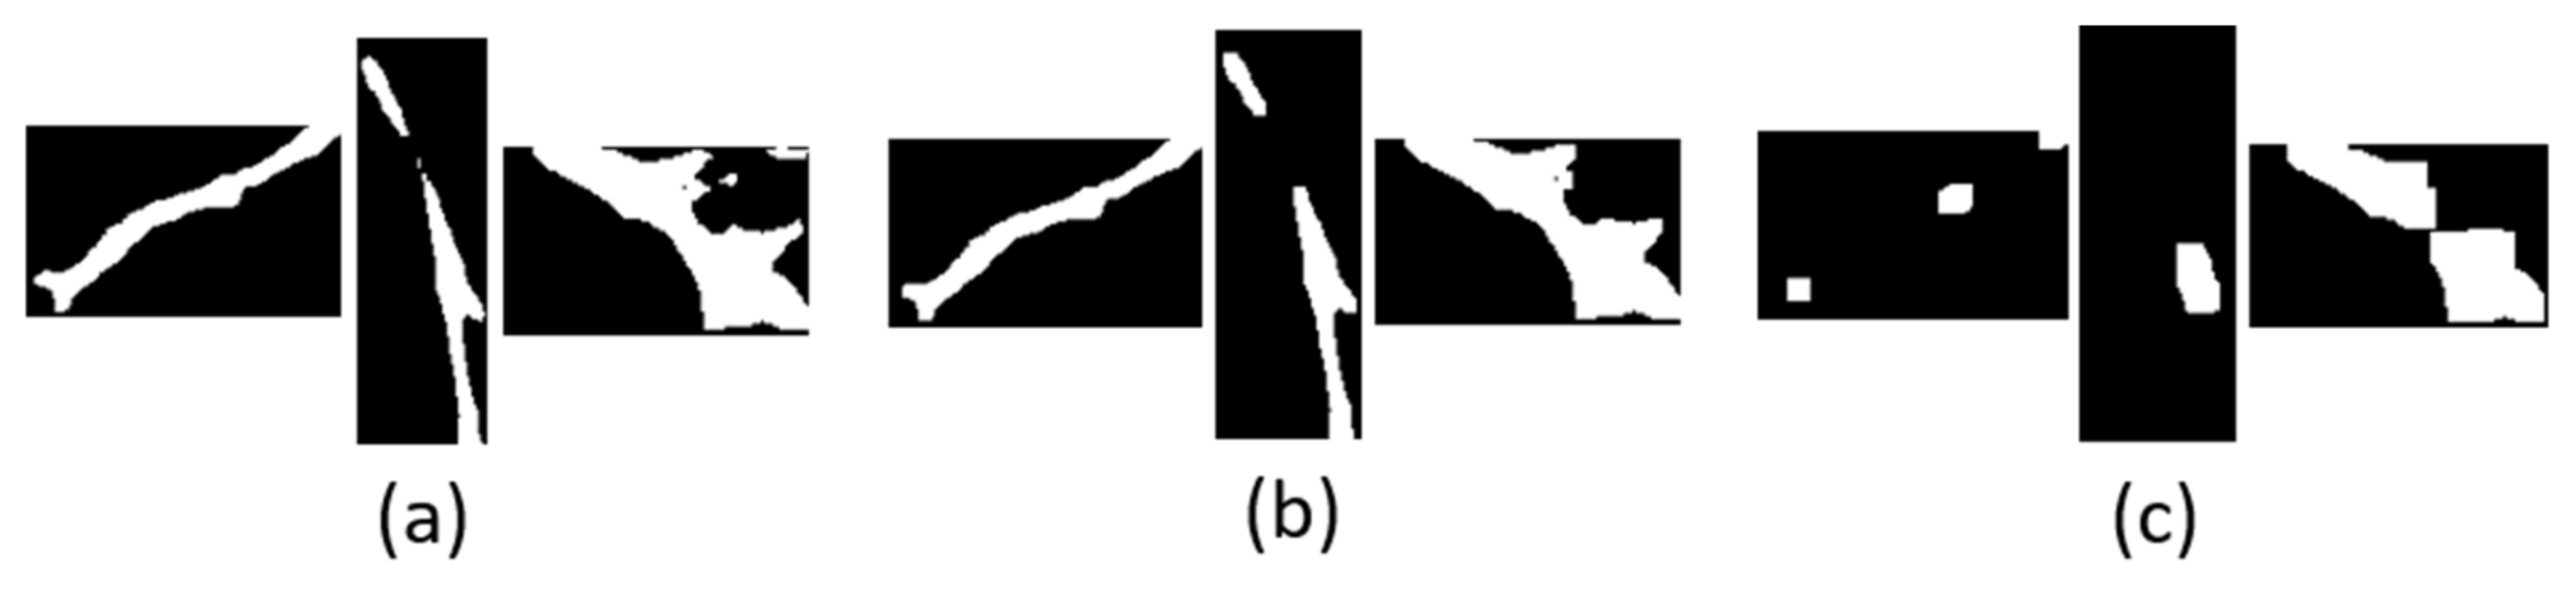
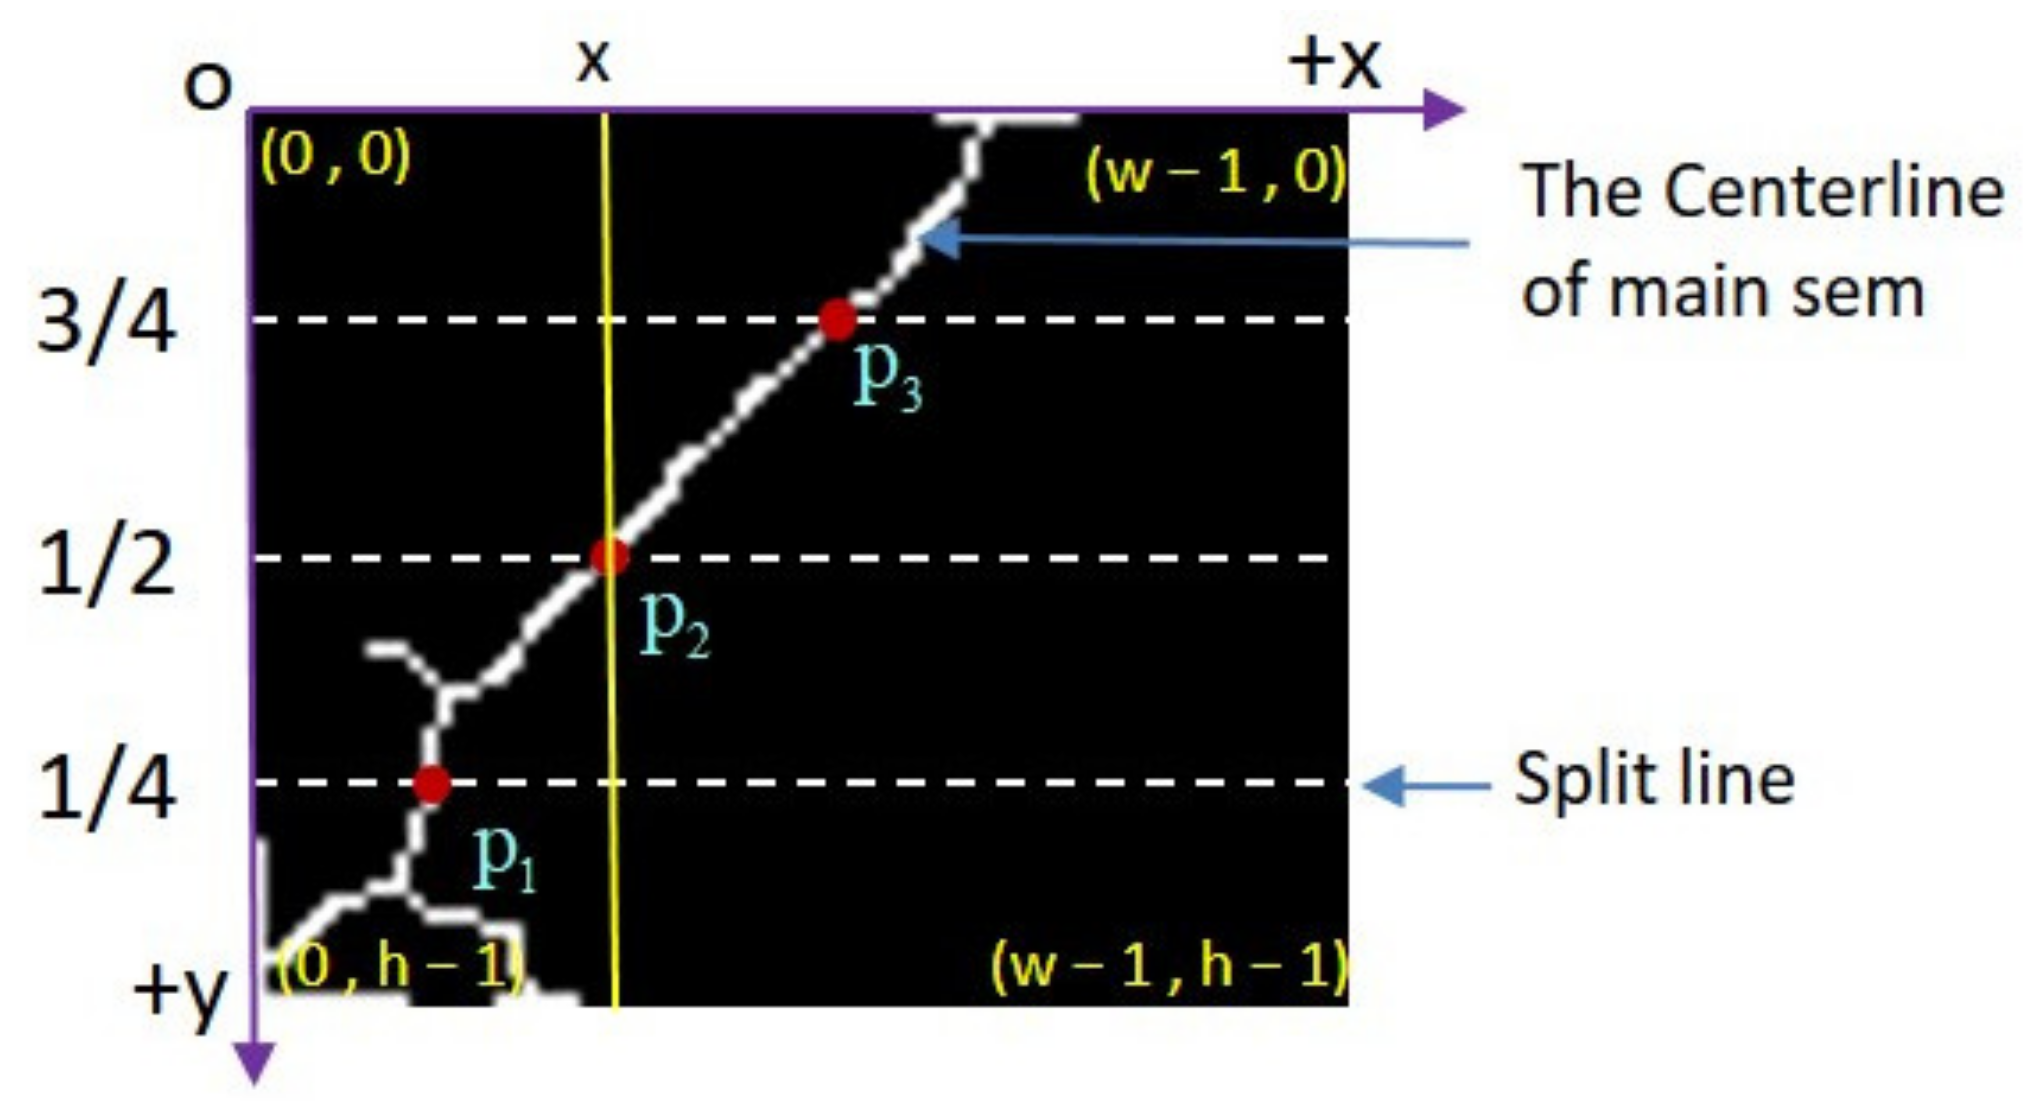
Step 3: Binarize the segmented ROI image of the main stem, convert the ROI color image of the main stem into a binary image, and carry out a morphological opening operation on the binary image of the main stem, so as to eliminate the holes in the main stem, remove isolated small patches and smooth the surface of the main stem, and then skeletonize the main stem to extract the centerline of the main stem, Then select the picking point on the centerline of the main stem.
(4)
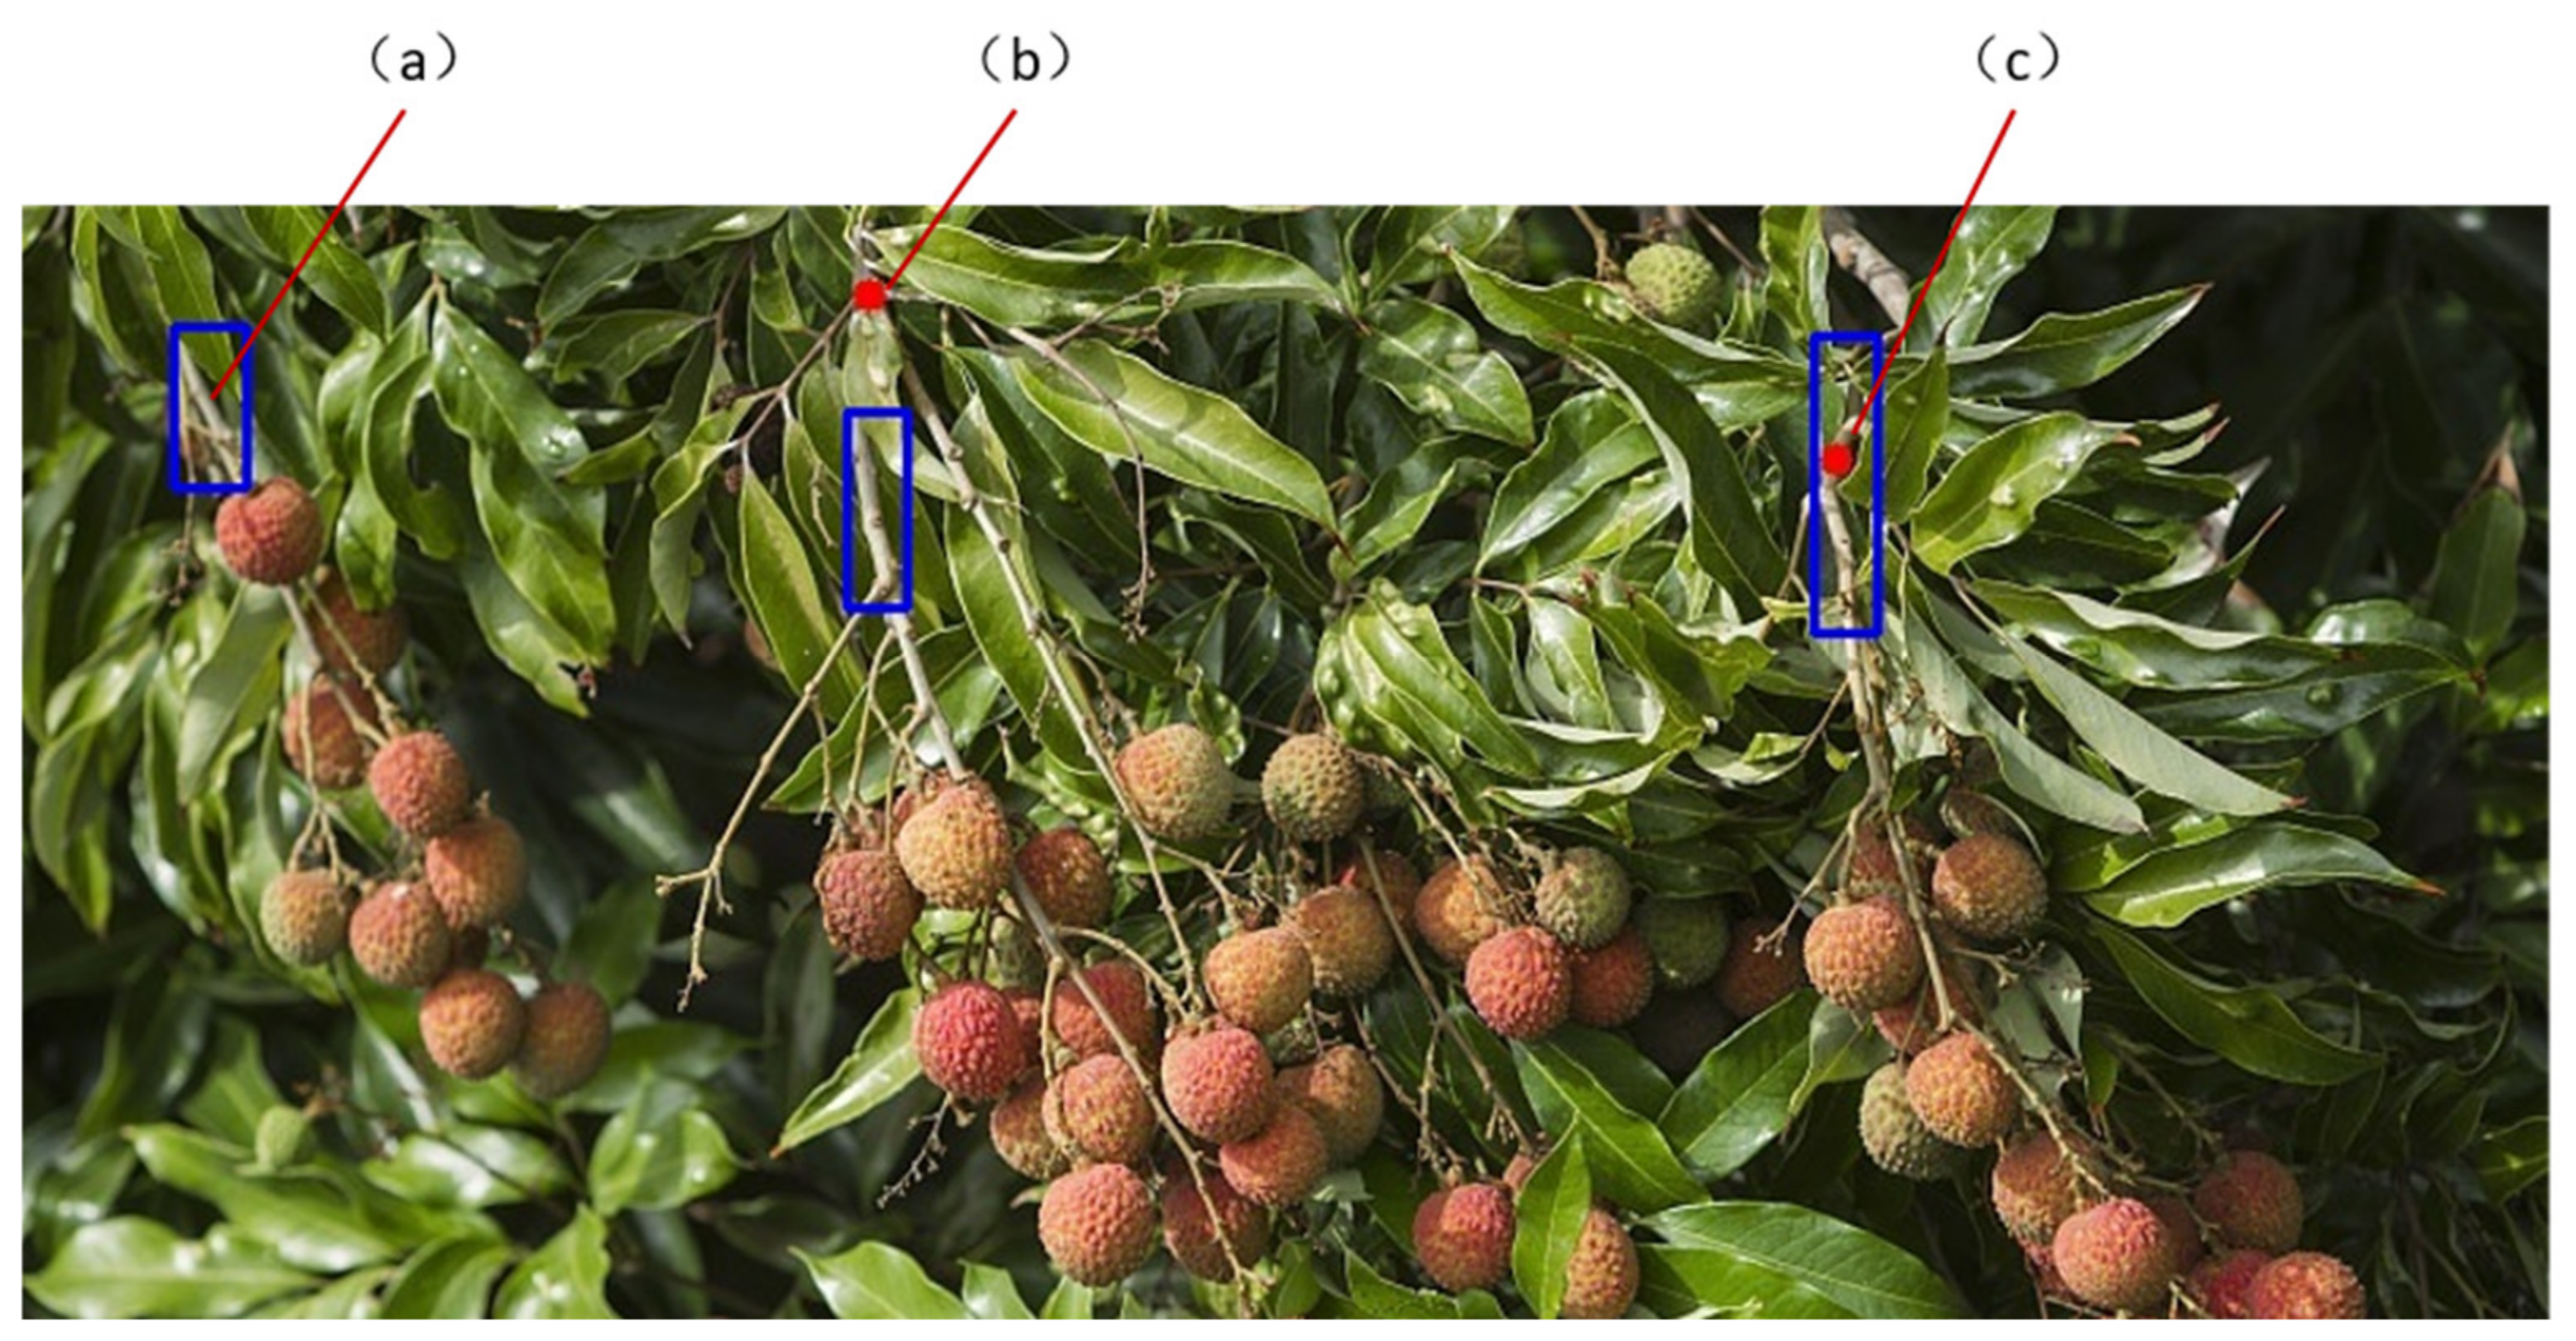
Step 4: Obtain the pixel coordinates of the picking point in the main stem ROI image, and convert the coordinates to obtain the pixel coordinates of the corresponding picking point in the original litchi string image. Then the specific position of the picking point in the original litchi image can be located according to the pixel coordinates of the picking point.
The results of detection of the main stem and fruit of litchi and the location of the picking point are shown in Figure 2.

2.2. Image Acquisition

The litchi images used in this study are collected from the Internet. In order to approach the real situation of litchi images detected by the litchi picking robot as much as possible, the diversity of litchi images collected is increased to improve the robustness of the algorithm, and we randomly collected 200 litchi cluster images. These images include litchi images with weak light, normal light, and high exposure, as well as a single cluster and multiple cluster litchi images. The specific number of images is shown in Table 1.
The dataset link: https://doi.org/10.6084/m9.figshare.19530988. (accessed on 8 April 2022).

2.3. Experimental Environment

The running environment of this experiment is a desktop computer with Intel (R) Core (TM) i7-10700 16 core CPU processor, the GPU is NVIDIA GeForce GTX 1650, the operating system is 64-bit win 10 operating system, the python version is 3.8.12 (Source: Python Software Foundation. URL: https://www.python.org/psf/, accessed on 8 April 2022), CUDA version is 11.3.1 (Company: NVIDIA Corporation. Address: Santa Clara, CA, USA) and CUDNN version is 7.6.5 (Company: NVIDIA Corporation. Address: Santa Clara, CA, USA). OpenCV-Python, Numpy, and Matplotlib were used for traditional image processing in this paper. The OpenCV-Python version is 4.1.2.30 (Source: Python Package Index. URL: https://pypi.org/project/opencv-python/4.1.2.30/, accessed on 8 April 2022), the Numpy version is 1.22.3 (The developer: CharlesHarris. URL: https://github.com/numpy/numpy/tree/v1.22.3), and the Matplotlib version is 3.5.1 (The developer: Elliott Sales de Andrade. URL: https://github.com/matplotlib/matplotlib/tree/v3.5.1, accessed on 8 April 2022).

2.4. Algorithm for Detecting Litchi Cluster Fruit and Main Stem

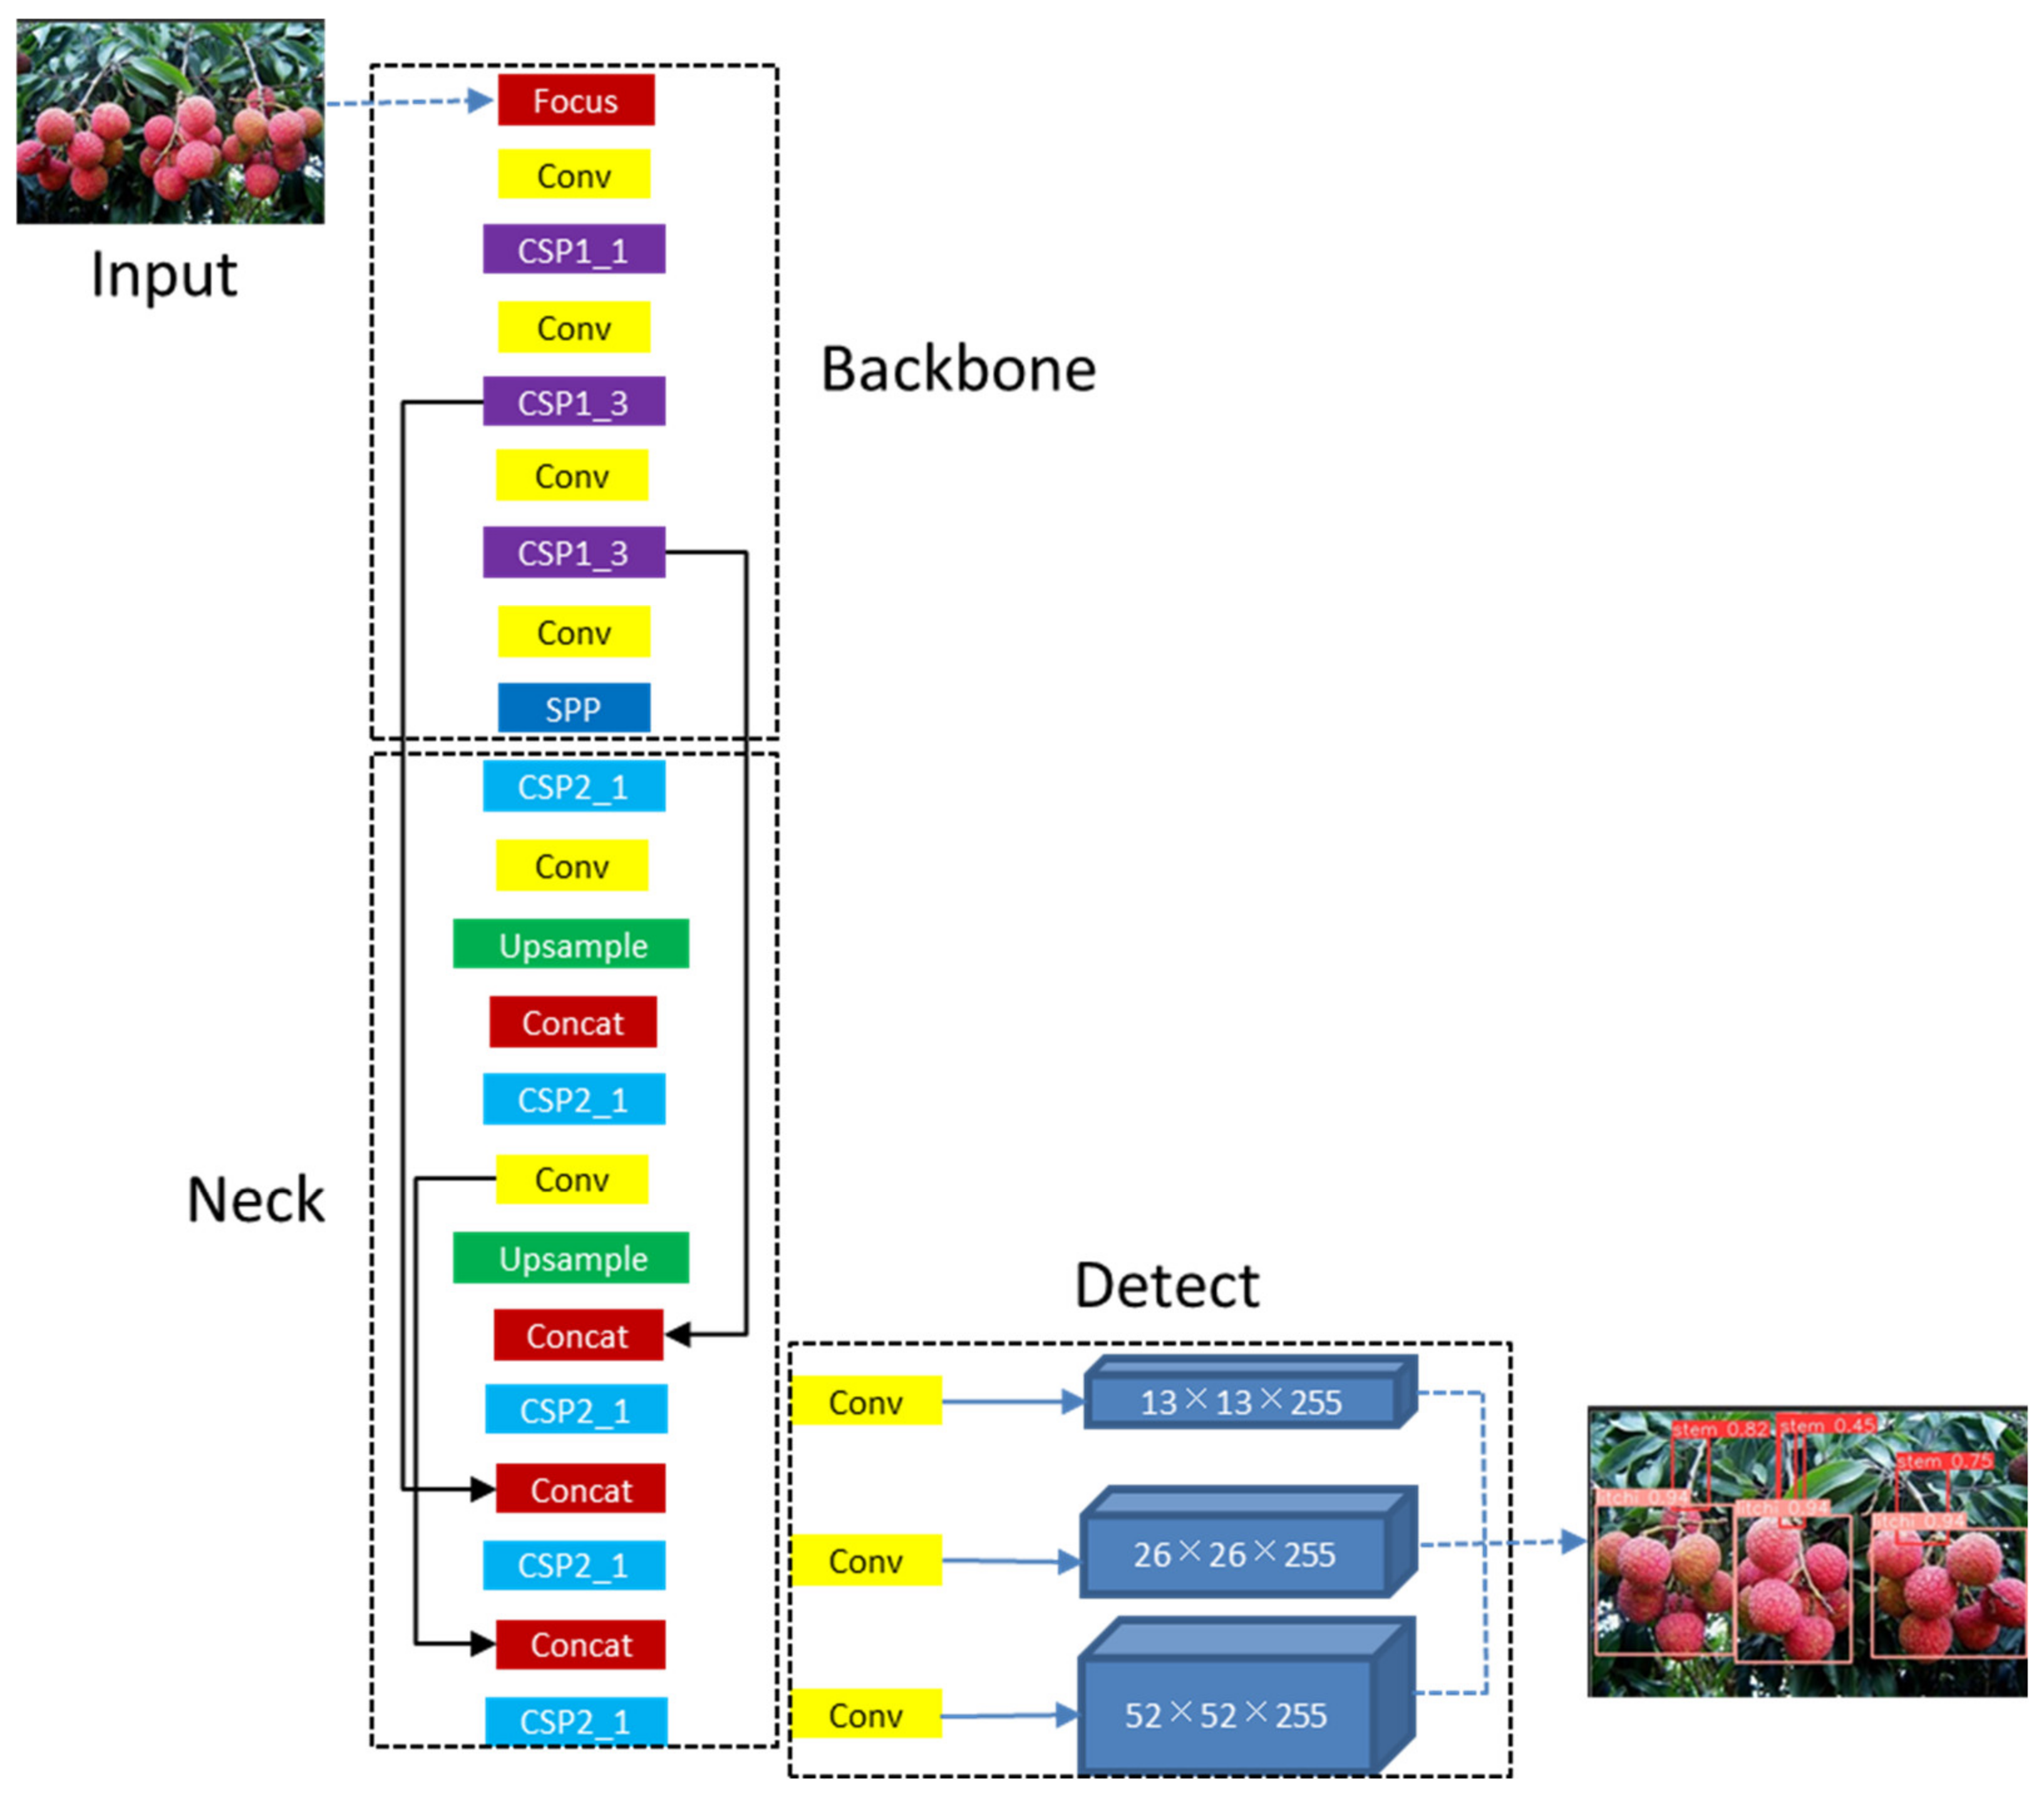
2.4.1. Network Structure of YOLOv5

YOLOv5 (You Only Look Once) is a single-stage target detection algorithm released by Uitralytics LLC on 9 June 2020. Compared with YOLOv4 [26], YOLOv5 has the characteristics of a smaller mean weight file, shorter training time, and faster reasoning speed on the basis of less reduction in average detection accuracy. The network structure of YOLOv5 is shown in Figure 3, which is mainly composed of Input, Backbone, Neck, and Prediction. Among them, input adopts the mosaic data enhancement method, which can splice four images in the way of random scaling, random reduction, and random arrangement, which can greatly improve the background complexity of the input image and improve the generalization ability and robustness of the model. At the same time, YOLOv5 adopts the adaptive image-scaling module in input, so that in the process of scaling the original image, the least black edge can be added adaptively according to the length–width ratio of the original image, so as to scale the original image to the standard size. Compared with the previous image scaling method of the YOLO algorithm, this module reduces the image filling, so it reduces the amount of calculation, so as to improve the speed of target detection. Backbone uses the Focus structure as the benchmark structure and uses the CSPDarknet53 [26] structure as the backbone feature extraction network. Compared with the Darknet53 [16] network structure of the YOLOv3 algorithm, the CSPDarknet53 structure enhances the learning ability of the network, reduces the amount of calculation, reduces the memory, and maintains the accuracy of network feature extraction. Neck adopts the structure of FPN + PAN, in which the FPN layer extracts strong semantic features and the PAN layer extracts strong positioning features. Through the feature fusion of the two, it can predict the targets of three different scales. At the same time, the CSP2 structure is adopted in the Neck to strengthen the feature fusion ability and further improve the network feature extraction ability. Prediction adopts CIoU_Loss as the loss function of the bounding box to improve the speed and accuracy of the regression prediction box.

2.4.2. Evaluation Index of Object Detection Model

The main indicators to evaluate the performance of the object detection model are: Recall, Precision, AP, F1 score, and mAP. AP is the area under the Precision–Recall curve. The higher the AP, the higher the accuracy of the model. The higher the Recall, the lower the missed detection rate of the model. Generally speaking, the higher the F1 score, the more stable the model and the higher the robustness. The formulas for Recall, Precision, F1 score, and AP are as follows:
Recall = TP TP + FN ,
Precision = TP TP + FP ,
F 1 = 2 × Recall × Precision Recall + Precision ,
TP is the number of true positives, FP is the number of false positives, and FN is the number of false negatives. IoU is the ratio of the intersection and union of the prediction box and the ground truth. The AP value in this paper is calculated when the threshold IoU is 0.5, so it is recorded as AP50. Similarly, mAP is also calculated when the threshold IoU is 0.5, so it is recorded as mAP50 [27].

2.4.3. Training of Litchi Fruit and Main Stem Detection Model

Through comparative experimental analysis, this paper selects YOLOv5 as the detection model of the litchi cluster fruit and main stem and selects 200 litchi cluster images with different environments and litchi varieties, of which 140 images are used as the training set, including 31 single cluster litchi images and 109 multi-cluster litchi images; 60 images are used as the test set, including 25 single string litchi images and 35 multi-cluster litchi images. Labeling software is used to label 236 main stems and 455 strings of litchi fruits in 140 images of the training set, and the corresponding label files in Pascal VOC data format are generated. Each label file contains the name and size of the corresponding image and the coordinates of the upper left corner and lower right corner of the label box of litchi fruit and main stems.
In this paper, the training cycle epochs of the YOLOv5 model are 200, the batch size is 3, the workers are 8, the initial learning rate is 0.01, the learning step is 0.1, the weight decay coefficient is 0.0005, and the momentum is set to 0.8. In order to speed up the convergence speed of model training and improve the effect of model training, YOLOv5x.pt is selected as a pre-training weight. The training process of the YOLOv5 target detection model can be divided into the following steps: (1) the CSPDarknet53 backbone feature extraction network is used to extract the feature maps of the litchi cluster images; (2) each grid cell in the feature maps contains 9 anchors with different dimensions and each anchor is represented by the coordinates of the anchor’s center point, width, height, and confidence, namely (tx, ty, tw, th, tc). However, the network only selects the grid cell where the central point of the ground truth is located and the two grid cells closest to the central point to detect the main stem and fruit of litchi. (3) The network will select one anchor with the highest confidence and an IOU of more than 0.5 for the ground truth from the corresponding three grids. (4) Locating the selected anchor through logistic regression and forming the final bounding box. (5) The network parameters are updated through the backpropagation of the loss value between the bounding box and the ground truth.

2.5. Semantic Segmentation Algorithm of Litchi Main Stem

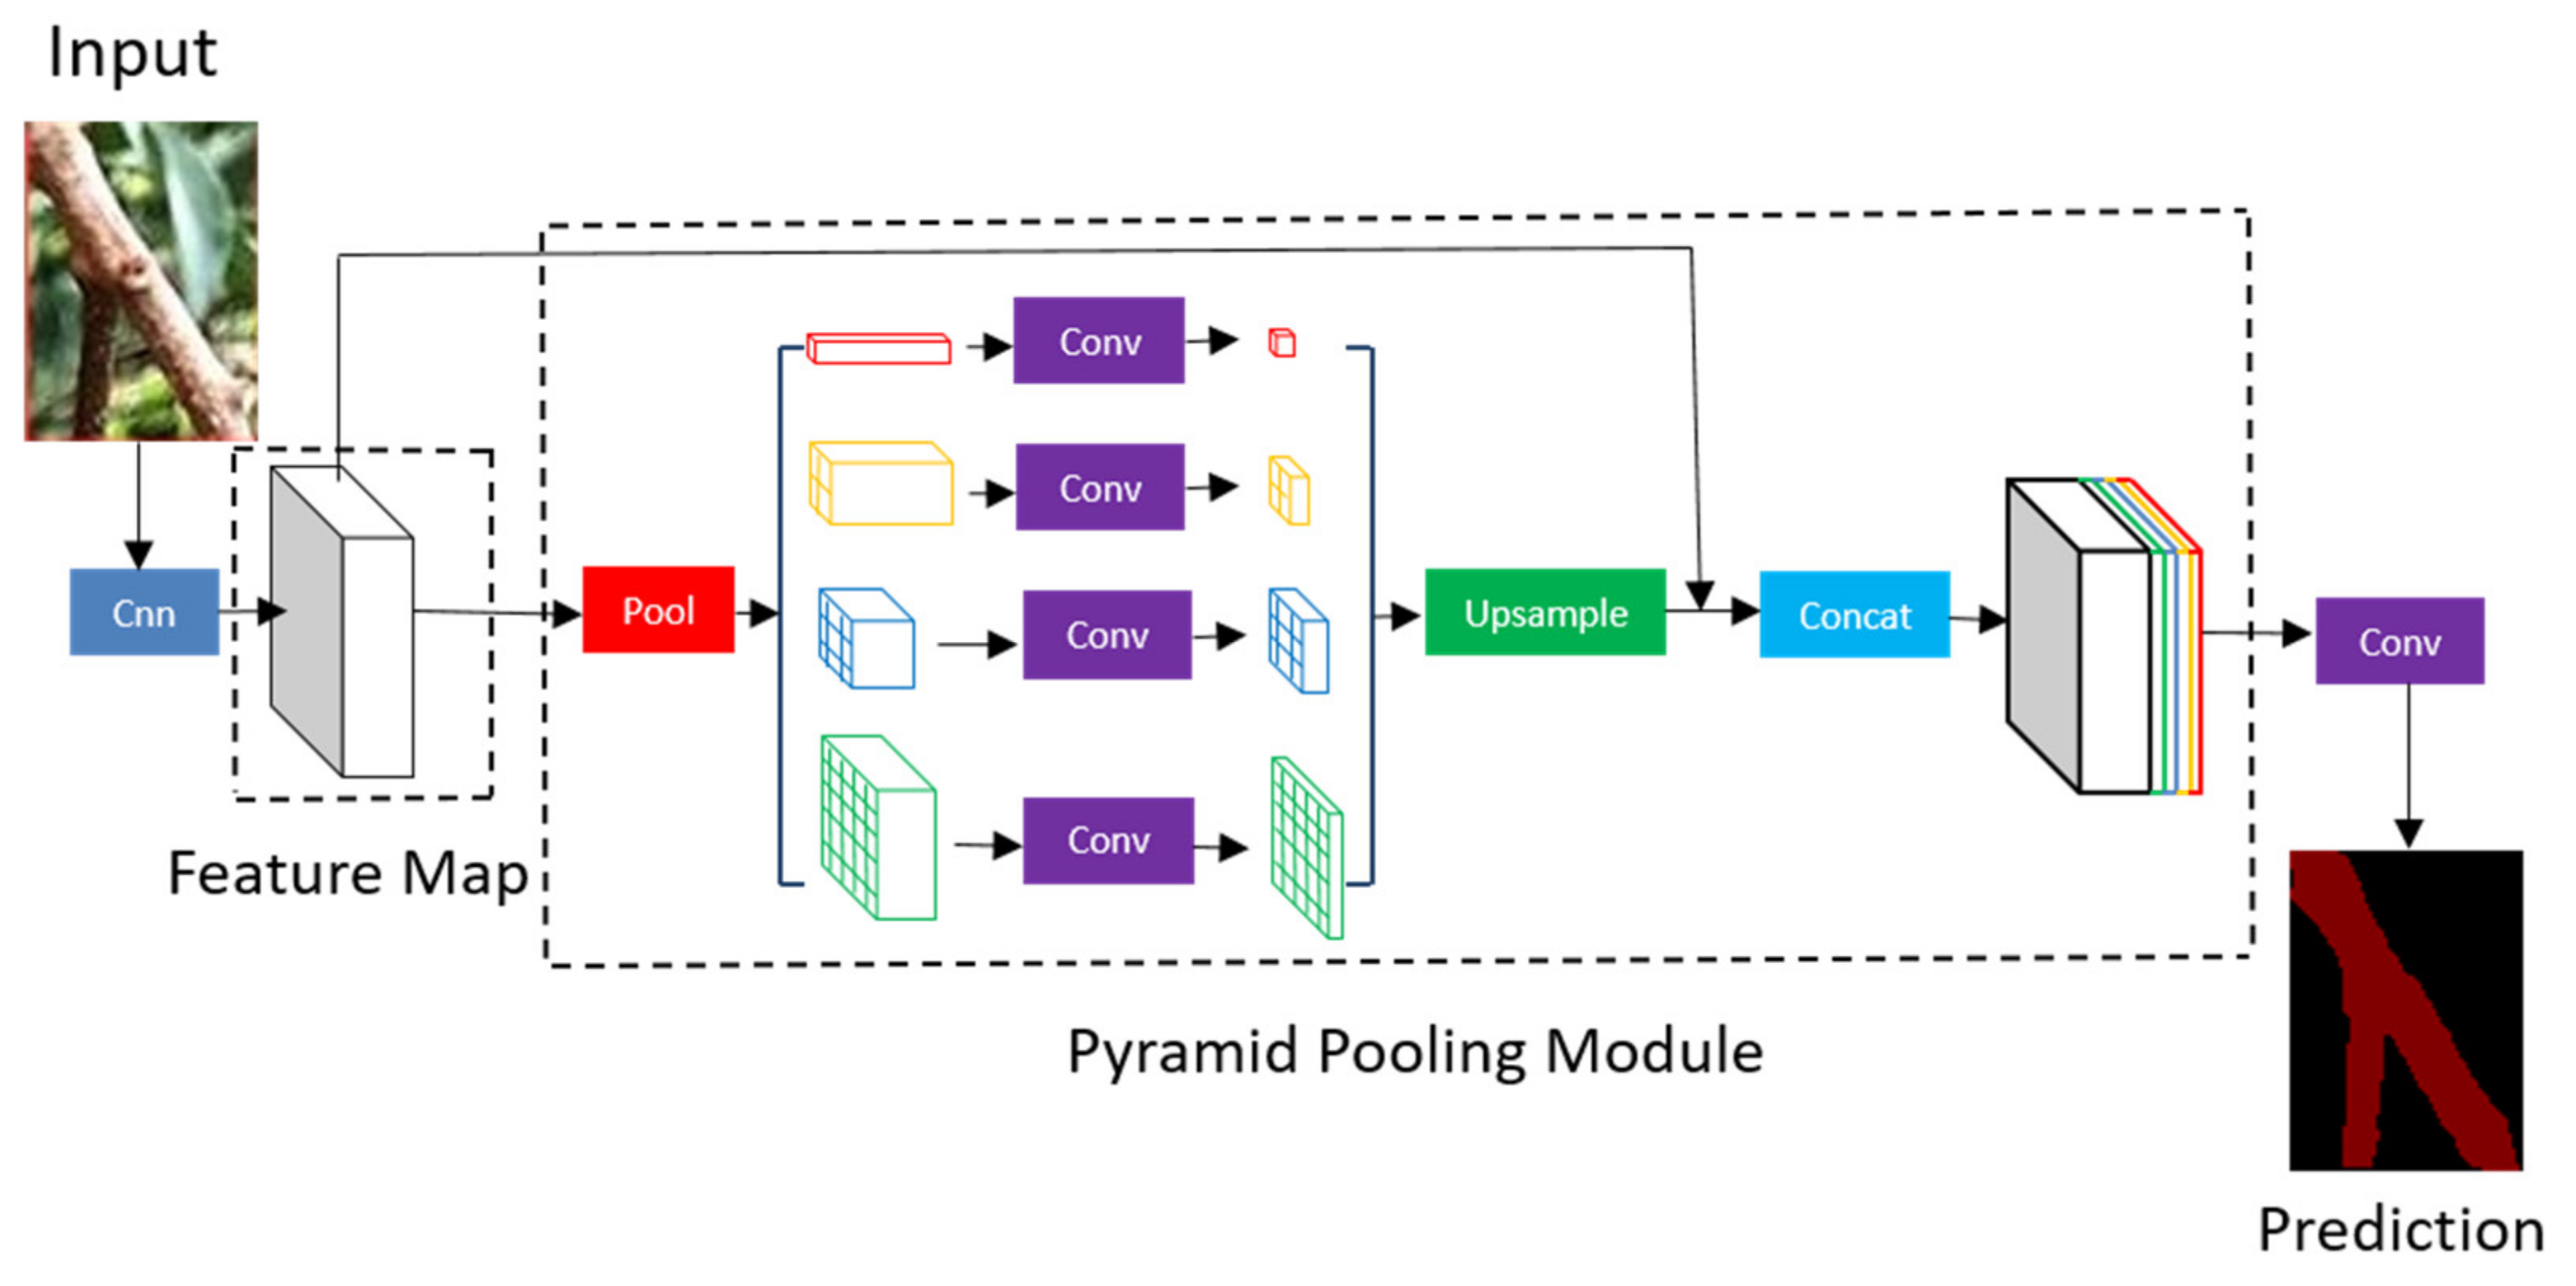
2.5.1. Network Structure of PSPNet

The core contribution of the PSPNet model is to propose a global pyramid pooling module (a pooling module with different scales) that can integrate context information of different scales, improve the ability to obtain global feature information so that each pixel in the image can be classified more accurately, and can help to segment the ROI map of the main stem with complex background. The model shows superior segmentation performance on various datasets. It came first in the ImageNet scene parsing challenge 2016 [28], Cityscapes benchmark [29] and PASCAL VOC 2012 benchmark [30]. Particularly, in PASCAL VOC 2012 benchmark, the MIoU is 85.4%.
The network structure of PSPNet is shown in Figure 4. The main process of image semantic segmentation by PSPNet is as follows: After inputting the image into PSPNet, the feature map of the image will be extracted through the pre-trained ResNet [31] model, and then the feature map obtained by the last convolution will be transmitted to the pyramid pooling module, which will divide the incoming feature layer into 6 × 6, 3 × 3, 2 × 2 and 1 × 1 regions, and then average pooling is carried out within each region to collect the feature information of different sub-regions, and upsample is carried out. The feature information extracted by ResNet and the feature information of different sub-regions is fused through Concat to form a feature layer containing local and global context information. Finally, the feature layer is classified by convolution kernel softmax; thus, the prediction result of each pixel in the image is obtained.

2.5.2. Evaluation Index of Semantic Segmentation Model

The indexes commonly used to evaluate the segmentation performance of semantic segmentation models are Precision, PA, IoU, and MIoU. The precision is used to evaluate the overall segmentation accuracy of the images, the PA is the pixel accuracy of semantic segmentation, the IoU is used to evaluate the average segmentation accuracy in one category, and the MIoU is used to evaluate the average segmentation accuracy of all categories. The formulas for PA, IoU, and MIoU are as follows:
PA = TP i + TN i TP i + FP i + FN i + TN i
IoU = TP i TP i + FP i + FN i
MIoU = 1 k + 1 i = 0 k TP i TP i + FP i + FN i
TPi is the number of true positives, TNi is the number of true negatives, FPi is the number of false positives, FNi is the number of false negatives when predicting the i-th category, and k represents the k categories predicted.

2.5.3. Training of Semantic Segmentation Model of Main Stem ROI Image

Through comparative experimental analysis, this paper uses PSPNet as the semantic segmentation model of the litchi cluster main stem. According to the annotation files of the training sets of the litchi cluster fruit and main stem detection model, 236 ROI images of the litchi cluster main stem are extracted. In order to construct the main stem ROI image dataset, we use Labelme software (The developer: Kentaro Wada. URL: https://github.com/wkentaro/labelme, accessed on 8 April 2022) to calibrate the main stem in 140 litchi cluster images in the training sets, and then Labelme software generates 140 main stem label files. According to the position information of the main stem in the litchi image in the label file, 236 ROI images are intercepted from 140 litchi images. Due to the different sizes of 140 litchi images in the training sets, some ROI images are too small and the resolution is too low, which will reduce the training effect of the model, so these images are eliminated. A total of 144 high-resolution ROI images of the main stem are selected from 236 ROI images as the dataset of the semantic segmentation model. The ROI image dataset includes training sets and test sets. Because the dataset is too small, the training set and test set are divided by 7:3, so there are 103 ROI images in training sets and 41 ROI images in test sets. Then, the main stem in the training sets image is marked by Labelme software, and the generated JSON file is converted into a label file for the training of the model.
In this paper, ResNet50 [32] is used as the backbone feature extraction network when training PSPNet, and the weight of the pre-trained ResNet50 classification model is used to initialize the parameters of the backbone feature extraction network, so as to speed up the convergence of the model, reduce the amount of model data and prevent the gradient from disappearing. Based on the idea of transfer learning [33], this training is divided into the freezing stage and the thawing stage. In the freezing stage, the backbone of the model is frozen, and the feature extraction network does not change, only fine-tunes the network so as to speed up the training efficiency and prevent weight damage. In the thawing stage, the backbone of the model is not frozen, the feature extraction network will change and the weight parameters in the network will be updated to optimize the network model.

2.6. Semantic Segmentation Image Post-Processing Algorithm

The flow chart of the post-processing algorithm of semantic segmentation image of litchi main stem ROI is shown in Figure 5. The algorithm mainly includes binarization of the semantic segmentation image of the main stem ROI, morphological opening operation processing, skeletonization processing, and selecting the picking points on the main stem bone line (centerline). Among them, the main stem ROI image after semantic segmentation is binarized, that is, the main stem pixels are set to 255 and the background pixels are set to 0. The purpose is to carry out a subsequent morphological opening operation on the semantic segmentation image of the main stem ROI. The purpose of a morphological open operation on the binary map of ROI of the main stem is to shrink the holes in the main stem, remove isolated small patches and smooth the contour of the main stem. The purpose of skeletonization is to extract the centerline of the main stem, so as to easily and accurately obtain the pixel coordinates of the picking points on the ROI image of the main stem. The picking points on the main stem bone line are selected to obtain the pixel coordinates of the picking points on the main stem bone line. Picking points, skeletonizing and semantic segmentation will be discussed in detail subsequently.

2.6.1. Morphological Open Operation Processing of Binary Graph of Main Stem ROI Image

In this paper, ten groups of convolution kernels from 1 × 1 to 10 × 10 with an interval of 1 × 1 were selected to perform a morphological opening operation on the binary map of the main stem ROI image, respectively. Through the comparison of the processing results, it was found that, as shown in Figure 6b, when the convolution kernel was taken as 5 × 5, the processing effect of the morphological opening operation on the binary image of main stem ROI is better, and can not only remove the small patches in the image but also will not lose a lot of useful main stem information.

2.6.2. Skeletonization of Main Stem

In this paper, Zhang–Suen’s [34] thinning algorithm is used to skeletonize the main stem. Figure 7b shows the naming of nine pixels in the 3 × 3 region in the image to be processed, and (i, j) represents the pixel coordinate of P1. The algorithm will be implemented if it satisfies the following conditions:
2 B ( P 1 ) 6
A ( P 1 ) = 1
P 2 × P 4 × P 6 = 0
P 4 × P 6 × P 8 = 0
P 2 × P 4 × P 8 = 0
P 2 × P 6 × P 8 = 0
The whole iterative process of the algorithm is divided into two steps: Step 1: Cycle all foreground pixels, and mark the pixels that meet the four conditions of (7), (8), (9), and (10) and as deleted. Step 2: Cycle all foreground pixels, and mark the pixels that meet the four conditions of (7), (8), (11), and (12) and as deleted. Cycle the above two steps until no pixels are marked for deletion, and the output image is the thinned image.

2.6.3. Location of the Picking Point of the Main Stem

A schematic diagram of the acquisition method of pixel coordinates of picking points in the main stem ROI image proposed in this paper is shown in Figure 8 (h is the height of the main stem ROI image, w is the width of the main stem ROI image). From the bottom of the skeletonized image of the main stem, taking 1/4 division line, 1/2 division line, and 3/4 division line of the image height in turn, and the intersection with the skeleton line of the main stem is recorded as P1, P2, and P3 in turn. Both Xiong et al. [8] and Zhong et al. [23] selected the midpoint of the main stem of litchi as the picking point, and the P2 point is close to the midpoint of the main stem, taking P2 as the picking point can not only make the litchi picking robot not damage the fruit in the picking process, but also make the picked litchi fruit leave a short main stem, which is convenient for transportation and storage. Therefore, if P2 exists, P2 is preferred as the pickup point and its pixel coordinates in the main stem ROI image are obtained. It should be noted that some main stem bone lines may be incomplete. In these cases, P2 points may not exist, but P1 and P3 points may exist. If P1 and P3 points are also used as the selection object of picking points, the Recall of picking points can be improved. Therefore, if P2 does not exist, P3 can be selected as the picking point. If P3 does not exist, P1 can be selected as the picking point.
According to the pixel coordinates of the picking point in the ROI image, the pixel coordinates of the picking point in the original litchi cluster image are calculated through coordinate transformation. So, the specific location of the picking point in the litchi cluster image can be located according to the pixel coordinates of the picking point in the litchi cluster image.

3. Results

Through comparative experiments, this paper compares the detection performance of five classical target detection models on litchi cluster fruit and main stem under the same experimental conditions and compares the semantic segmentation performance of three classical semantic segmentation models on litchi cluster main stem ROI image under the same experimental conditions.

3.1. Detection Results of Litchi Fruit and Main Stem with Different Detection Models

Using the litchi cluster image dataset in Table 1 of Section 2.2 and under the experimental environment described in Section 2.3, the same experimental parameters were set to train and test YOLOv5, YOLOv4, YOLOv3, SSD [35], and Fast R-CNN (FRCN), respectively. The test results are shown in Table 2. According to the evaluation indexes of the target detection model described in Section 2.4.2, the target detection model with the best detection performance is obtained by comparing and analyzing the detection results.
From the results of litchi main stem detection by different target detection models in Table 2, under the indexes of Precision, Recall, AP50, mAP50, and F1, the values of other indexes of the YOLOv5 model are higher than those of the other four target detection models, except that the values of the Precision index are slightly lower than those of the SSD model. Therefore, considered comprehensively, the detection performance of the YOLOv5 model on the litchi main stem is much better than the other four models, because accurate detection of the litchi main stem is the premise to obtain the picking point of the litchi cluster. Therefore, in this paper, YOLOv5 is selected as the target detection model of the litchi fruit and main stem.

3.2. Results of Semantic Segmentation of Main Stem ROI Image

Using the ROI image dataset of the litchi main stem in Section 2.5.3, under the experimental environment described in Section 2.3, the same experimental parameters were set to PSPNet, U-Net, and DeepLab_v3+ [36], respectively, were trained and tested. The test results are shown in Table 3. According to the evaluation indexes of the semantic segmentation model described in Section 2.5.2, the test results are compared and analyzed to obtain the model with the best segmentation performance for the ROI image of the main stem.
It can be seen from the results in Table 3 that during the semantic segmentation of the ROI image of the main stem of litchi, for the recognition of the main stem pixels, except that the Precision index value of the PSPNet segmentation model is lower than that of the U-Net model, the other index values are higher than the other two models, while the Precision value of the main stem pixels segmented by the PSPNet model is 80.64%. It is only lower than the U-Net model. The index values of PA, IoU, and MIoU will affect the effect of the post-processing of the semantic segmented image. The higher their index values are, the better the image segmentation effect of the model is, the better the post-processing effect of the semantic segmented image is, and the higher the calculation accuracy of picking points is. The three index values of the PSPNet segmentation model are higher than the other two models. Therefore, PSPNet is selected as the semantic segmentation model of the ROI image of the litchi main stem in this paper.

3.3. Performance Evaluation of the Proposed Algorithm for Locating Litchi Picking Points

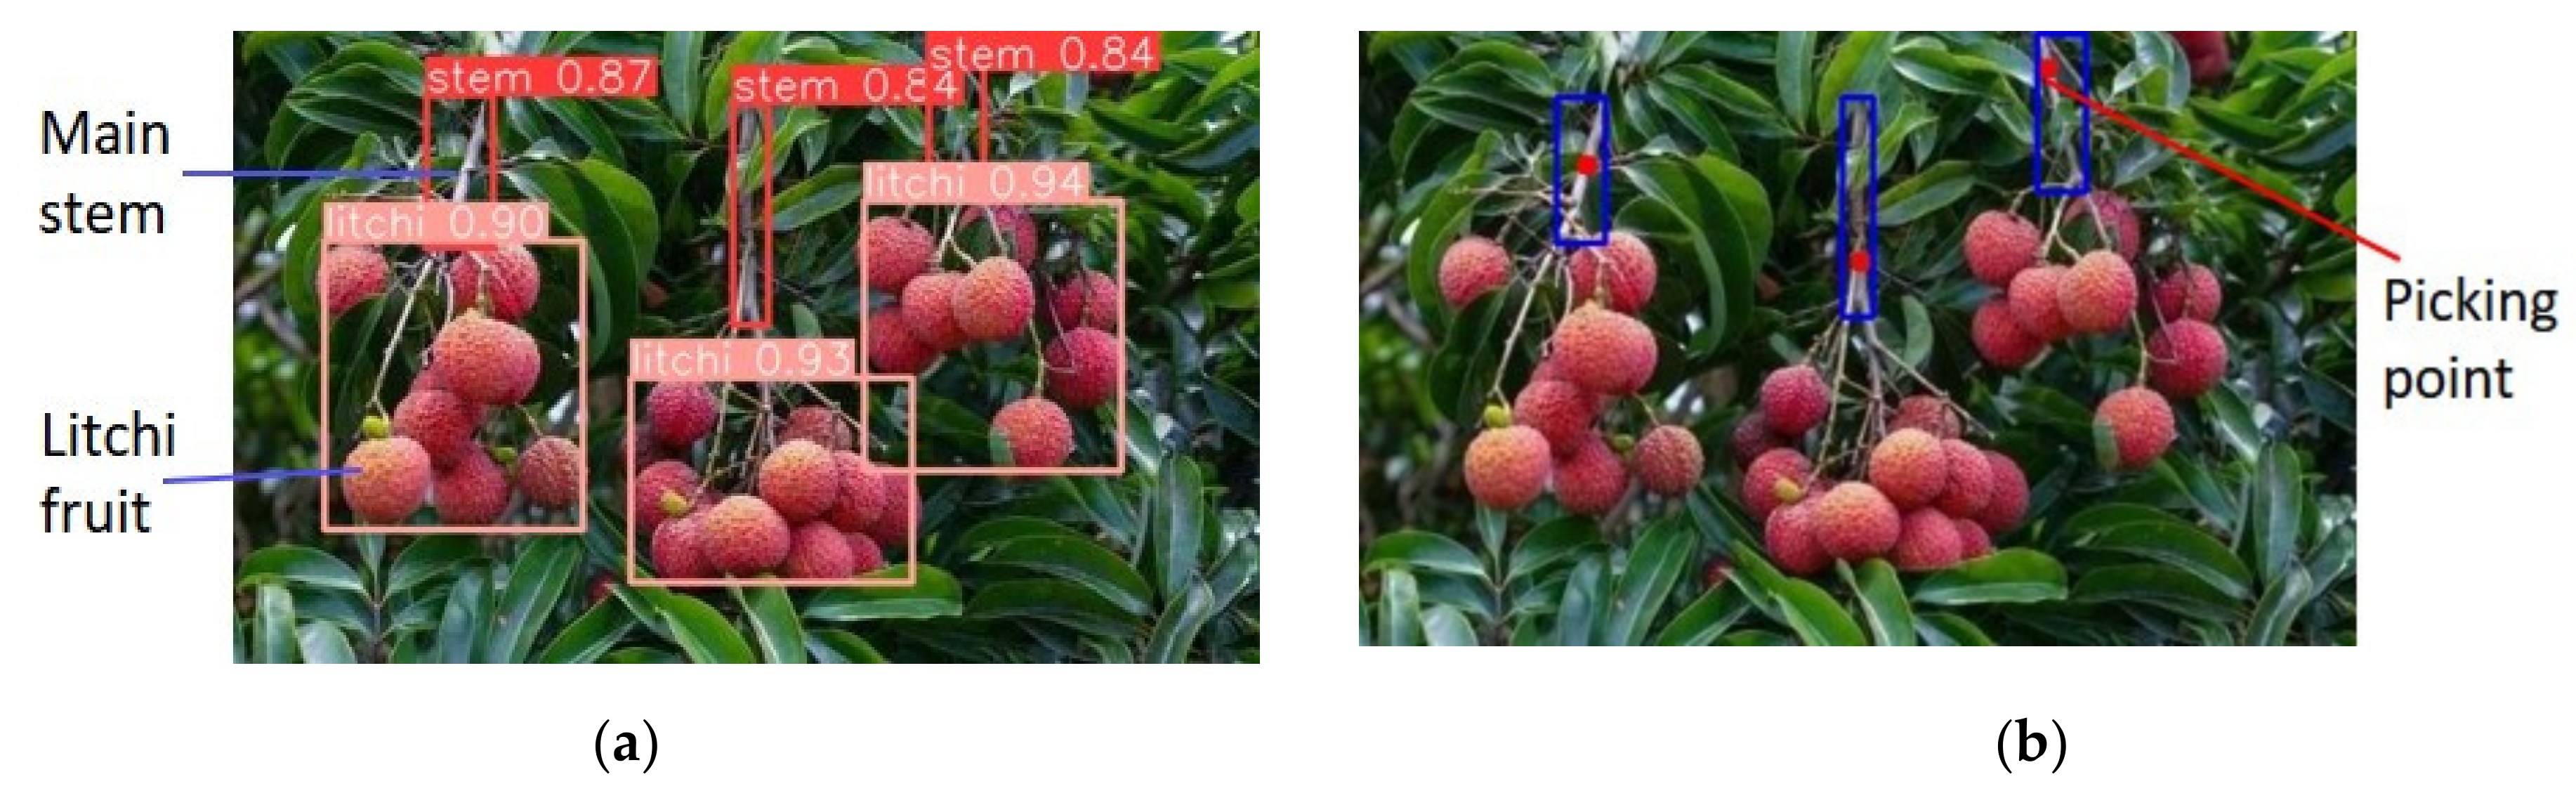
3.3.1. Location Results of Picking Points on the Main Stem of Litchi Cluster

In order to test the performance of the method proposed in this paper, Recall and Precision are used as evaluation indexes to evaluate the performance of the proposed algorithm. A total of 60 litchi images from the test sets in Section 2.2 are selected to test the performance of the proposed algorithm, and the picking points on the main stem in the 60 litchi images are located by the algorithm. According to the test results, the value of TP is 74, FP is 6 and FN is 63 calculated by the manual counting method. According to formula (1) and formula (2), the value of recall is 76.29% and the value of precision is 92.5%, indicating that the algorithm for locating picking points proposed in this paper has excellent performance. As shown in Figure 9, Figure 9a is the case that the picking point is not located, Figure 9b is the case that the picking point is located incorrectly, and Figure 9c is the case that the picking point is located correctly.

3.3.2. Description of Manually Counting Picking Points

As shown in Figure 10, in Figure 10a, although the marked red dot is not on the main stem of the marking box, it is next to the main stem, which meets the requirements of being a picking point. Therefore, such points are included in TP; in Figure 10b, although the marked red dot is on the main stem in the marking box, it is too close to the litchi fruit, so the litchi robot is easy to damage the litchi fruit in the picking process. This kind of dot is not taken as the picking point, so it is included in FP; in Figure 10d, although the marked red point is outside the marking box, it is still on the main stem in the marking box. Therefore, such points can still be regarded as picking points and included in TP; in Figure 10c, there are two marked red points on the main stem in the marking box. This situation occurs because the main stem is repeatedly detected in the target detection stage, as shown in Figure 11, but these two marked points meet the requirements of picking points. The picking robot can choose any point as the picking point, so the two points in this situation are included in TP as one picking point.

4. Discussion

4.1. Discussion on Detection Method of Picking Point

This paper compares our method with the picking point recognition method based on deep learning proposed in Zhong et al. [23] and the classical picking point recognition method based on traditional image processing proposed in Zhuang et al. [11], shown in Table 4. It can be found that only F1 of the first picking point recognition method is slightly higher than our method, but the accuracy of our method is much higher than the other two methods. The middle point of the main stem mask was taken as the picking point in the method proposed by Zhong et al. [23]. In our method, the picking point is obtained on the main stem bone line, and not only at the midpoint of the main stem bone line. At the same time, the main stem bone line is smaller than the main stem mask area, so the picking point obtained on the main stem bone line is easier on the main stem. Therefore, the accuracy of our method to identify the picking point should be higher. Zhuang et al. [11] used the Retinex algorithm to segment the main stems of the litchi clusters and adopted illumination compensation to improve the litchi region extraction accuracy for weakly illuminated input images. Although different from the shallow features extracted by the method, our method uses the advanced abstract features extracted by the deep convolution network to enable the model to process more complex data, with better accuracy.

4.2. Some Limitations in Our Whole Work Should Be Discussed and Reduced

(1) The data sample is very small in the whole work. It will not only affect the detection performance of the YOLOv5 model on the main stem of litchi but will also affect the segmentation performance of the PSPNet model on the ROI image of the main stem. Finally, it will also affect the recall and accuracy of picking points. Data enhancement or trying to collect more data samples is an effective way to reduce this limitation.
(2) When determining the main stem picking point in Section 2.6.3, the main stem skeleton line is not fitted. For litchi clusters with incomplete main stem skeleton line but complete main stem, the picking points on the main stem of such litchi clusters may not be obtained, which reduces the recall rate of the algorithm. Spline fitting or PCA for incomplete main stem skeleton lines should be an effective method to improve the recall rate of the algorithm.

5. Conclusions

This paper presents a new method to accurately identify the main stem picking points in litchi images based on the combination of deep learning and traditional image processing.
In this study, the main stem detection model based on the YOLOv5 network structure is trained, and the advanced features of the main stem are extracted through the deep convolution network, which breaks the limitation of the traditional image processing algorithm. The Precision, Recall, and AP50 of the litchi main stem detected by the YOLOv5 model were 84.44%, 75.25%, and 72.52%, respectively. Compared with the main stem detection model based on YOLOv4, YOLOv3, and Fast R-CNN, it has higher accuracy and recall, so YOLOv5 is the most promising network model of main stem detection.
In order to reduce the influence of the background of the main stem ROI image on the detection of picking points, this paper uses the semantic segmentation model based on the PSPNet network structure to segment the main stem ROI image. The Precision, PA, and IoU of litchi main stem segmented by the PSPNnet model were 80.64%, 69.80%, and 59.78%, respectively. Compared with the main stem segmentation model based on U-Net and DeepLab_v3+, it has higher segmentation accuracy; therefore, PSPNet is the most promising network model of main stem detection segmentation.
In this paper, the ROI image of the main stem after semantic segmentation is morphologically processed to smooth the contour of the main stem and fill the internal holes of the main stem, and then the processed image is binarized and skeletonized to extract the centerline of the main stem. Locating the picking point on the centerline of the main stem limits the positioning range of the picking point and further improves the positioning accuracy of the picking point.
The pixel coordinates of the picking point in the ROI image are converted into the pixel coordinates in the litchi cluster image through coordinate conversion, so as to accurately locate the picking point in the litchi cluster image. At present, the precision and recall of detecting picking points in litchi images proposed in this paper are 92.5% and 76.29%, respectively.
The picking point detection method based on depth learning and the traditional image proposed in this paper has high accuracy, which lays a foundation for our follow-up work to obtain the three-dimensional coordinates of picking points by combining the image depth information obtained by the depth camera. It should be pointed out that this work has not been done in this paper. At the same time, the method proposed in this paper can also provide a reference for other relevant researchers to accurately calculate the picking point.

Author Contributions

Conceptualization, H.Z. and X.Q.; methodology, X.Q.; software, X.Q.; validation, H.Z., X.Q. and J.D.; formal analysis, H.Z.; investigation, Y.L.; resources, J.D.; data curation, Y.L.; writing—original draft preparation, X.Q.; writing—review and editing, X.Q. and Y.L.; visualization, J.D.; supervision, J.D.; project administration, Y.L.; funding acquisition, Y.L. All authors have read and agreed to the published version of the manuscript.

Funding

Top Talents Program for One Case One Discussion of Shandong Province (2018-27), Shandong Province.

Data Availability Statement

The dataset used in this study is publicly available on Figshare. The dataset link: https://doi.org/10.6084/m9.figshare.19530988 (accessed on 8 April 2022).

Conflicts of Interest

The authors declare no conflict of interest.

Computer Code

The code related to this study is publicly available on GitHub. The relevant codes link: https://github.com/Hope-Diamond/Litchi_picking_points (accessed on 8 April 2022).

References

  1. Huang, Y. 2018 China litchi Summit. World Trop. Agric. Inf. 2018, 56, 34. [Google Scholar]
  2. Zhu, Q.; Lu, R.; Lu, J.; Li, F. Research status and development trend of litchi picking machinery. For. Mach. Woodwork. Equip. 2021, 49, 11–19. [Google Scholar]
  3. Davidson, J.R.; Hohimer, C.J.; Mo, C.; Karkee, M. Dual robot coordination for apple harvesting. In Proceedings of the 2017 ASABE Annual International Meeting, Spokane, WA, USA, 16–19 June 2017. [Google Scholar]
  4. Liu, J.; Yuan, Y.; Gao, Y.; Tang, S.; Li, Z. Virtual model of grip-and-cut picking for simulation of vibration and falling of grape clusters. Trans. ASABE 2019, 62, 603–614. [Google Scholar] [CrossRef]
  5. Dai, N.; Xie, H.; Yang, X.; Zhan, K.; Liu, J. Recognition of cutting region for pomelo picking robot based on machine vision. In Proceedings of the 2019 ASABE Annual International Meeting, Boston, MA, USA, 7–10 June 2019. [Google Scholar] [CrossRef]
  6. Liang, C.; Xiong, J.; Zheng, Z.; Zhong, Z.; Li, Z.; Chen, S.; Yang, Z. A visual detection method for nighttime litchi fruits and fruiting stems. Comput. Electron. Agric. 2020, 169, 105192. [Google Scholar] [CrossRef]
  7. Xiong, J.; He, Z.; Lin, R.; Liu, Z.; Bu, R.; Yang, Z.; Peng, H.; Zou, X. Visual positioning technology of picking robots for dynamic litchi clusters with disturbance. Comput. Electron. Agric. 2018, 151, 226–237. [Google Scholar] [CrossRef]
  8. Xiong, J.; Lin, R.; Liu, Z.; He, Z.; Tang, L.; Yang, Z.; Zou, X. The recognition of litchi clusters and the calculation of picking point in a nocturnal natural environment. Biosyst. Eng. 2018, 166, 44–57. [Google Scholar] [CrossRef]
  9. Deng, J.; Li, J.; Zou, X. Extraction of litchi stem based on computer vision under natural scene. In Proceedings of the 2011 International Conference on Computer Distributed Control and Intelligent Environmental Monitoring, Changsha, China, 19–20 February 2011; pp. 832–835. [Google Scholar]
  10. Wang, C.; Zou, X.; Tang, Y.; Luo, L.; Feng, W. Localisation of litchi in an unstructured environment using binocular stereo vision. Biosyst. Eng. 2016, 145, 39–51. [Google Scholar] [CrossRef]
  11. Zhuang, J.; Hou, C.; Tang, Y.; He, Y.; Guo, Q.; Zhong, Z.; Luo, S. Computer vision-based localisation of picking points for automatic litchi harvesting applications towards natural scenarios. Biosyst. Eng. 2019, 187, 1–20. [Google Scholar] [CrossRef]
  12. Kamilaris, A.; Prenafeta-Boldú, F.X. Deep learning in agriculture: A survey. Comput. Electron. Agric. 2018, 147, 70–90. [Google Scholar] [CrossRef] [Green Version]
  13. Apolo-Apolo, O.; Martínez-Guanter, J.; Egea, G.; Raja, P.; Pérez-Ruiz, M. Deep learning techniques for estimation of the yield and size of citrus fruits using a UAV. Eur. J. Agron. 2020, 115, 126030. [Google Scholar] [CrossRef]
  14. Ren, S.; He, K.; Girshick, R.; Sun, J. Faster R-CNN: Towards real-time object detection with region proposal networks. IEEE Trans. Pattern Anal. Mach. Intell. 2017, 39, 1137–1149. [Google Scholar] [CrossRef] [Green Version]
  15. Koirala, A.; Walsh, K.; Wang, Z.; McCarthy, C. Deep learning for real-time fruit detection and orchard fruit load estimation: Benchmarking of ‘MangoYOLO’. Precis. Agric. 2019, 20, 1107–1135. [Google Scholar] [CrossRef]
  16. Redmon, J.; Farhadi, A. Yolov3: An incremental improvement. arXiv 2018, arXiv:1804.02767. [Google Scholar]
  17. Redmon, J.; Farhadi, A. YOLO9000: Better, faster, stronger. In Proceedings of the IEEE Conference on Computer Vision and Pattern Recognition, Honolulu, HI, USA, 21–26 July 2017; pp. 7263–7271. [Google Scholar]
  18. Xiong, J.; Liu, Z.; Chen, S.; Liu, B.; Zheng, Z.; Zhong, Z.; Yang, Z.; Peng, H. Visual detection of green mangoes by an unmanned aerial vehicle in orchards based on a deep learning method. Biosyst. Eng. 2020, 194, 261–272. [Google Scholar] [CrossRef]
  19. Liu, X.; Zhao, D.; Jia, W.; Ruan, C.; Tang, S.; Shen, T. A method of segmenting apples at night based on color and position information. Comput. Electron. Agric. 2016, 122, 118–123. [Google Scholar] [CrossRef]
  20. Sa, I.; Ge, Z.; Dayoub, F.; Upcroft, B.; Perez, T.; McCool, C. Deepfruits: A fruit detection system using deep neural networks. Sensors 2016, 16, 1222. [Google Scholar] [CrossRef] [Green Version]
  21. Guo, A.; Zou, X.; Zou, H. Recognition on image of lychee fruits and their main fruit bearing based on twin-threshold method. Comput. Eng. Des. 2014, 35, 557–561. [Google Scholar]
  22. Ronneberger, O.; Fischer, P.; Brox, T. U-net: Convolutional networks for biomedical image segmentation. In Proceedings of the International Conference on Medical Image Computing and Computer-Assisted Intervention, Munich, Germany, 5–9 October 2015; pp. 234–241. [Google Scholar]
  23. Zhong, Z.; Xiong, J.; Zheng, Z.; Liu, B.; Liao, S.; Huo, Z.; Yang, Z. A method for litchi picking points calculation in natural environment based on main fruit bearing branch detection. Comput. Electron. Agric. 2021, 189, 106398. [Google Scholar] [CrossRef]
  24. Bolya, D.; Zhou, C.; Xiao, F.; Lee, Y.J. YOLACT: Real-time instance segmentation. In Proceedings of the IEEE/CVF International Conference on Computer Vision, Seoul, Korea, 27–28 October 2019; pp. 9157–9166. [Google Scholar]
  25. Zhao, H.; Shi, J.; Qi, X.; Wang, X.; Jia, J. Pyramid scene parsing network. In Proceedings of the IEEE Conference on Computer Vision and Pattern Recognition, Honolulu, HI, USA, 21–26 July 2017; pp. 2881–2890. [Google Scholar]
  26. Bochkovskiy, A.; Wang, C.-Y.; Liao, H.-Y.M. Yolov4: Optimal speed and accuracy of object detection. arXiv 2020, arXiv:2004.10934. [Google Scholar]
  27. Padilla, R.; Netto, S.L.; Da Silva, E.A. A survey on performance metrics for object-detection algorithms. In Proceedings of the 2020 International Conference on Systems, Signals and Image Processing (IWSSIP), Niteroi, Brazil, 1–3 July 2020; pp. 237–242. [Google Scholar]
  28. Zhou, B.; Zhao, H.; Puig, X.; Xiao, T.; Fidler, S.; Barriuso, A.; Torralba, A. Semantic understanding of scenes through the ade20k dataset. Int. J. Comput. Vis. 2019, 127, 302–321. [Google Scholar] [CrossRef] [Green Version]
  29. Cordts, M.; Omran, M.; Ramos, S.; Rehfeld, T.; Enzweiler, M.; Benenson, R.; Franke, U.; Roth, S.; Schiele, B. The cityscapes dataset for semantic urban scene understanding. In Proceedings of the IEEE Conference on Computer Vision and Pattern Recognition, Las Vegas, NV, USA, 27–30 June 2016; pp. 3213–3223. [Google Scholar]
  30. Everingham, M.; Van Gool, L.; Williams, C.K.; Winn, J.; Zisserman, A. The pascal visual object classes (voc) challenge. Int. J. Comput. Vis. 2010, 88, 303–338. [Google Scholar] [CrossRef] [Green Version]
  31. He, K.; Zhang, X.; Ren, S.; Sun, J. Deep residual learning for image recognition. In Proceedings of the IEEE Conference on Computer Vision and Pattern Recognition; Las Vegas, NV, USA, 27–30 June 2016, pp. 770–778.
  32. Theckedath, D.; Sedamkar, R. Detecting affect states using VGG16, ResNet50 and SE-ResNet50 networks. SN Comput. Sci. 2020, 1, 79. [Google Scholar] [CrossRef] [Green Version]
  33. Torrey, L.; Shavlik, J. Transfer learning. In Handbook of Research on Machine Learning Applications and Trends: Algorithms, Methods, and Techniques; IGI Global: Hershey, PA, USA, 2010; pp. 242–264. [Google Scholar]
  34. Zhang, T.Y.; Suen, C.Y. A fast parallel algorithm for thinning digital patterns. Commun. ACM 1984, 27, 236–239. [Google Scholar] [CrossRef]
  35. Liu, W.; Anguelov, D.; Erhan, D.; Szegedy, C.; Reed, S.; Fu, C.-Y.; Berg, A.C. Ssd: Single shot multibox detector. In Proceedings of the European Conference on Computer Vision, Amsterdam, The Netherlands, 8–16 October 2016; pp. 21–37. [Google Scholar]
  36. Chen, L.-C.; Zhu, Y.; Papandreou, G.; Schroff, F.; Adam, H. Encoder-decoder with atrous separable convolution for semantic image segmentation. In Proceedings of the European Conference on Computer Vision (ECCV), Munich, Germany, 8–14 September 2018; pp. 801–818. [Google Scholar]
Figure 1. The proposed flow chart for identifying picking points.
Remotesensing 14 02004 g001
Figure 2. Detection results of main stem and fruit of litchi and location results of picking point. (a) Detection results of main stem and fruit of litchi; (b) location results of picking point.
Remotesensing 14 02004 g002
Figure 3. The network structure of YOLOv5s.
Remotesensing 14 02004 g003
Figure 4. Structure diagram of PSPNet.
Remotesensing 14 02004 g004
Figure 5. Post-processing algorithm of semantic segmentation image of litchi main stem ROI.
Remotesensing 14 02004 g005
Figure 6. Processing results using convolution kernels of different sizes. (a) The processing results of morphological opening operation when convolution kernel is 1 × 1; (b) the processing results of morphological opening operation when convolution kernel is 5 × 5; (c) the processing results of morphological opening operation when convolution kernel is 10 × 10.
Remotesensing 14 02004 g006
Figure 7. The naming of 9 pixels in 3 × 3 regions. (a) original image; (b) the naming of 9 pixels in 3 × 3 regions in the original image.
Remotesensing 14 02004 g007
Figure 8. Schematic diagram of acquisition method of pixel coordinates of picking points in main stem ROI image. p1, p2 and p3 are the selection objects of the picking point.
Remotesensing 14 02004 g008
Figure 9. Example of picking points positioning. The blue box is the marking result of the main stem of litchi. The red dot is the picking point. Case (a) belongs to FN, case (b) belongs to FP, and case (c) belongs to TP.
Remotesensing 14 02004 g009
Figure 10. Detection performance of different picking points. (a) Although the picking point is not on the main stem, it is next to the main stem; (b) The picking point is on the main stem, but it is too close to the litchi fruit; (c) Two picking points satisfying the conditions were obtained on the same main stem; (d) Although the picking point obtained is not in the main stem detection box, it is still on the main stem.
Remotesensing 14 02004 g010
Figure 11. Example of case (d) in Figure 10. (a) Location of picking points; (b) Detection of litchi fruits and main stems.
Remotesensing 14 02004 g011
Table 1. Number of images in the dataset.
Litchi ClusterNumber of Training SetsNumber of Test Sets Total Number
Single cluster312556
Multiple cluster10935144
Table 2. The detection performances of litchi main stems under different models.
ModelsPrecisionRecallAP501 mAP50F1
YOLOV584.44%75.25%72.52%79.60%0.80
YOLOV478.43%39.60%49.85%66.22%0.53
YOLOV375.32%57.43%65.55%75.30%0.65
SSD92.86%25.74%54.32%70.26%0.40
FRCN43.66%61.39%57.75%70.30%0.51
1 mAP50 is the average value of AP of detected main stems and detected litchi fruits.
Table 3. The segmentation performance of main stems under different models.
ModelsPrecisionPAIoU1 MIoU
PSPNet80.64%69.80%59.78%74.08%
U-Net83.58%64.22%57.02%72.61%
DeepLab_v3+76.11%67.82%55.92%71.38%
1 MIoU is the average value of IoU of segmented main stem and segmented background.
Table 4. The comparison results of three methods.
MethodsPrecisionF1
Zhong et al. [23]89.70%83.80%
Zhuang et al. [11]83.00%-
The proposed method92.50%83.62%
Publisher’s Note: MDPI stays neutral with regard to jurisdictional claims in published maps and institutional affiliations.

