1. Introduction
Forest inventory surveys are critical for monitoring and managing forest resources [
1]. Surveys are usually performed on a subset of plots, and those results are statistically scaled up to the entire forest level [
2]. However, the measurement of the parameters, especially those that describe individual trees, is still a laborious task in the sample-based survey [
3]. Diameter at Breast Height (DBH) is the most basic and important parameter of which automatic and accurate measurement would significantly increase the efficiency of the forest inventory surveys [
4].
In conventional forest resources surveys, the acquisition of DBH relies on manual measurement, using tools such as calipers or tapes [
5]. This is not only highly time-consuming and labor-intensive, but also consists of errors produced by inexperienced investigators, all of which drive people to seek alternative automatic measurement methods of estimating DBH. One promising technology is estimating DBH from forest reconstruction models provided by remote sensing technologies [
6,
7]. Remote sensing measurement methods for DBH could be roughly divided into two categories: methods based on light detection and ranging (LiDAR) and methods based on structure from motion (SfM) photogrammetry.
LiDAR is a widely used technique in forest inventory that obtains forest structure by capturing echoes of previously emitted laser beams [
8]. Compared to LiDAR on other platforms, airborne laser scanning (ALS) has excellent coverage capabilities. However, it is inapposite for estimating individual tree parameters (such as DBH) because of the sparsity of tree stems point cloud [
9,
10]. Terrestrial laser scanning (TLS) could present tree stems with dense point clouds with millimeter accuracy [
11]. While TLS with the single-scan mode is susceptible to occlusion, multiple scans are necessary to get better coverage but with more time and resources for the data acquisition and processing [
12]. Unmanned aerial vehicle (UAV) laser scanning (ULS) and mobile laser scanning (MLS), combined with simultaneous localization and mapping (SLAM), could achieve more flexible and efficient data collection, but the estimation accuracy of forest inventory parameters is sacrificed [
13,
14,
15]. Except for the respective features above, LiDAR is a mature technique with a high degree of accuracy overall. However, expensive equipment and the expertise required are barriers to its application in forest surveys.
Combining the dense matching technique called multi-view-stereo (MVS) [
16], SfM can rebuild a model from overlapping images taken from different views around an object or a scene. The only equipment needed is a consumer camera or a camera phone in the data collection stage. The most expensive expenditure would be commercial software in the data processing stage, which can be saved if open-sourced SfM such as Colmap is used. Therefore, SfM photogrammetry is a relatively economical technique compared to LiDAR [
17,
18,
19].
Because of the advantages of low cost and low operation, SfM photogrammetry becomes promising in forest inventory. The studies of measuring metrics (DBH, height, crown spread, and volume) of the individual trees through SfM prove the feasibility of applying SfM to the forest inventory [
7,
20]. Because of photography’s inability to penetrate the forest canopy, SfM photogrammetry on the aerial platform is unsuitable for measuring metrics such as DBH compared with terrestrial SfM photogrammetry [
21]. The research on the error behavior of SfM photogrammetry proves that terrestrial SfM photogrammetry can achieve fairly accurate DBH measurement of forests because the 3D points close to the ground have minor errors [
22]. The comparison of forest inventory data derived from terrestrial SfM and TLS within a plot also supports this [
23].
However, there are some limitations to the existing studies. Firstly, commercial software other than free open-source software was used for SfM reconstruction in previous research. This cost more and could not be integrated with self-developed measurement methods. Secondly, few studies focused on the automatic DBH estimation based on SfM. Based on the authors’ knowledge, no one has carried out the work of packaging SfM photogrammetry and automatic DBH estimation into one software and applied it to forest inventory. From the sense of labor-saving and application, the automation of estimation is significant. The last problem is the overlong time cost of data acquisition. In SfM, many images with sufficient overlapping should be taken from various angles to completely reconstruct objects such as trees. To do that, Liang et al. [
24] took images along two paths inside and outside the plot. Images were taken towards the center or outside the plot in stop and go mode. Piermattei et al. [
23] implemented similar photographing but supplemented different paths according to the complexity of the forest. The problem was that the redundant images would consume considerable time on image collection and reconstruction. Long data acquisition time would not just affect survey efficiency. It would also increase the risk of illumination variation affecting the SfM reconstruction, so reducing the image numbers and thus reducing the image acquisition time turned out to be a key problem.
In this context, this research aims to realize accurate and efficient automatic DBH measurement based on SfM photogrammetry and increase image acquisition efficiency. For this purpose, four plots with different species were selected. The following work has been carried out: (1) a data collection method optimized for image acquisition speed and DBH estimation was adopted, and models were reconstructed from the collected images of the forest; (2) terrain and trees were detected and separated using random sample consensus (RANSAC) [
25], and DBHs were estimated by cylinder fitting; (3) Auto-DBH, an automatic DBH measurement software that integrated with SfM-MVS reconstruction, was developed; (4) the accuracy of measured DBHs was analyzed.
2. Materials and Methods
2.1. Study Site and Data Collection
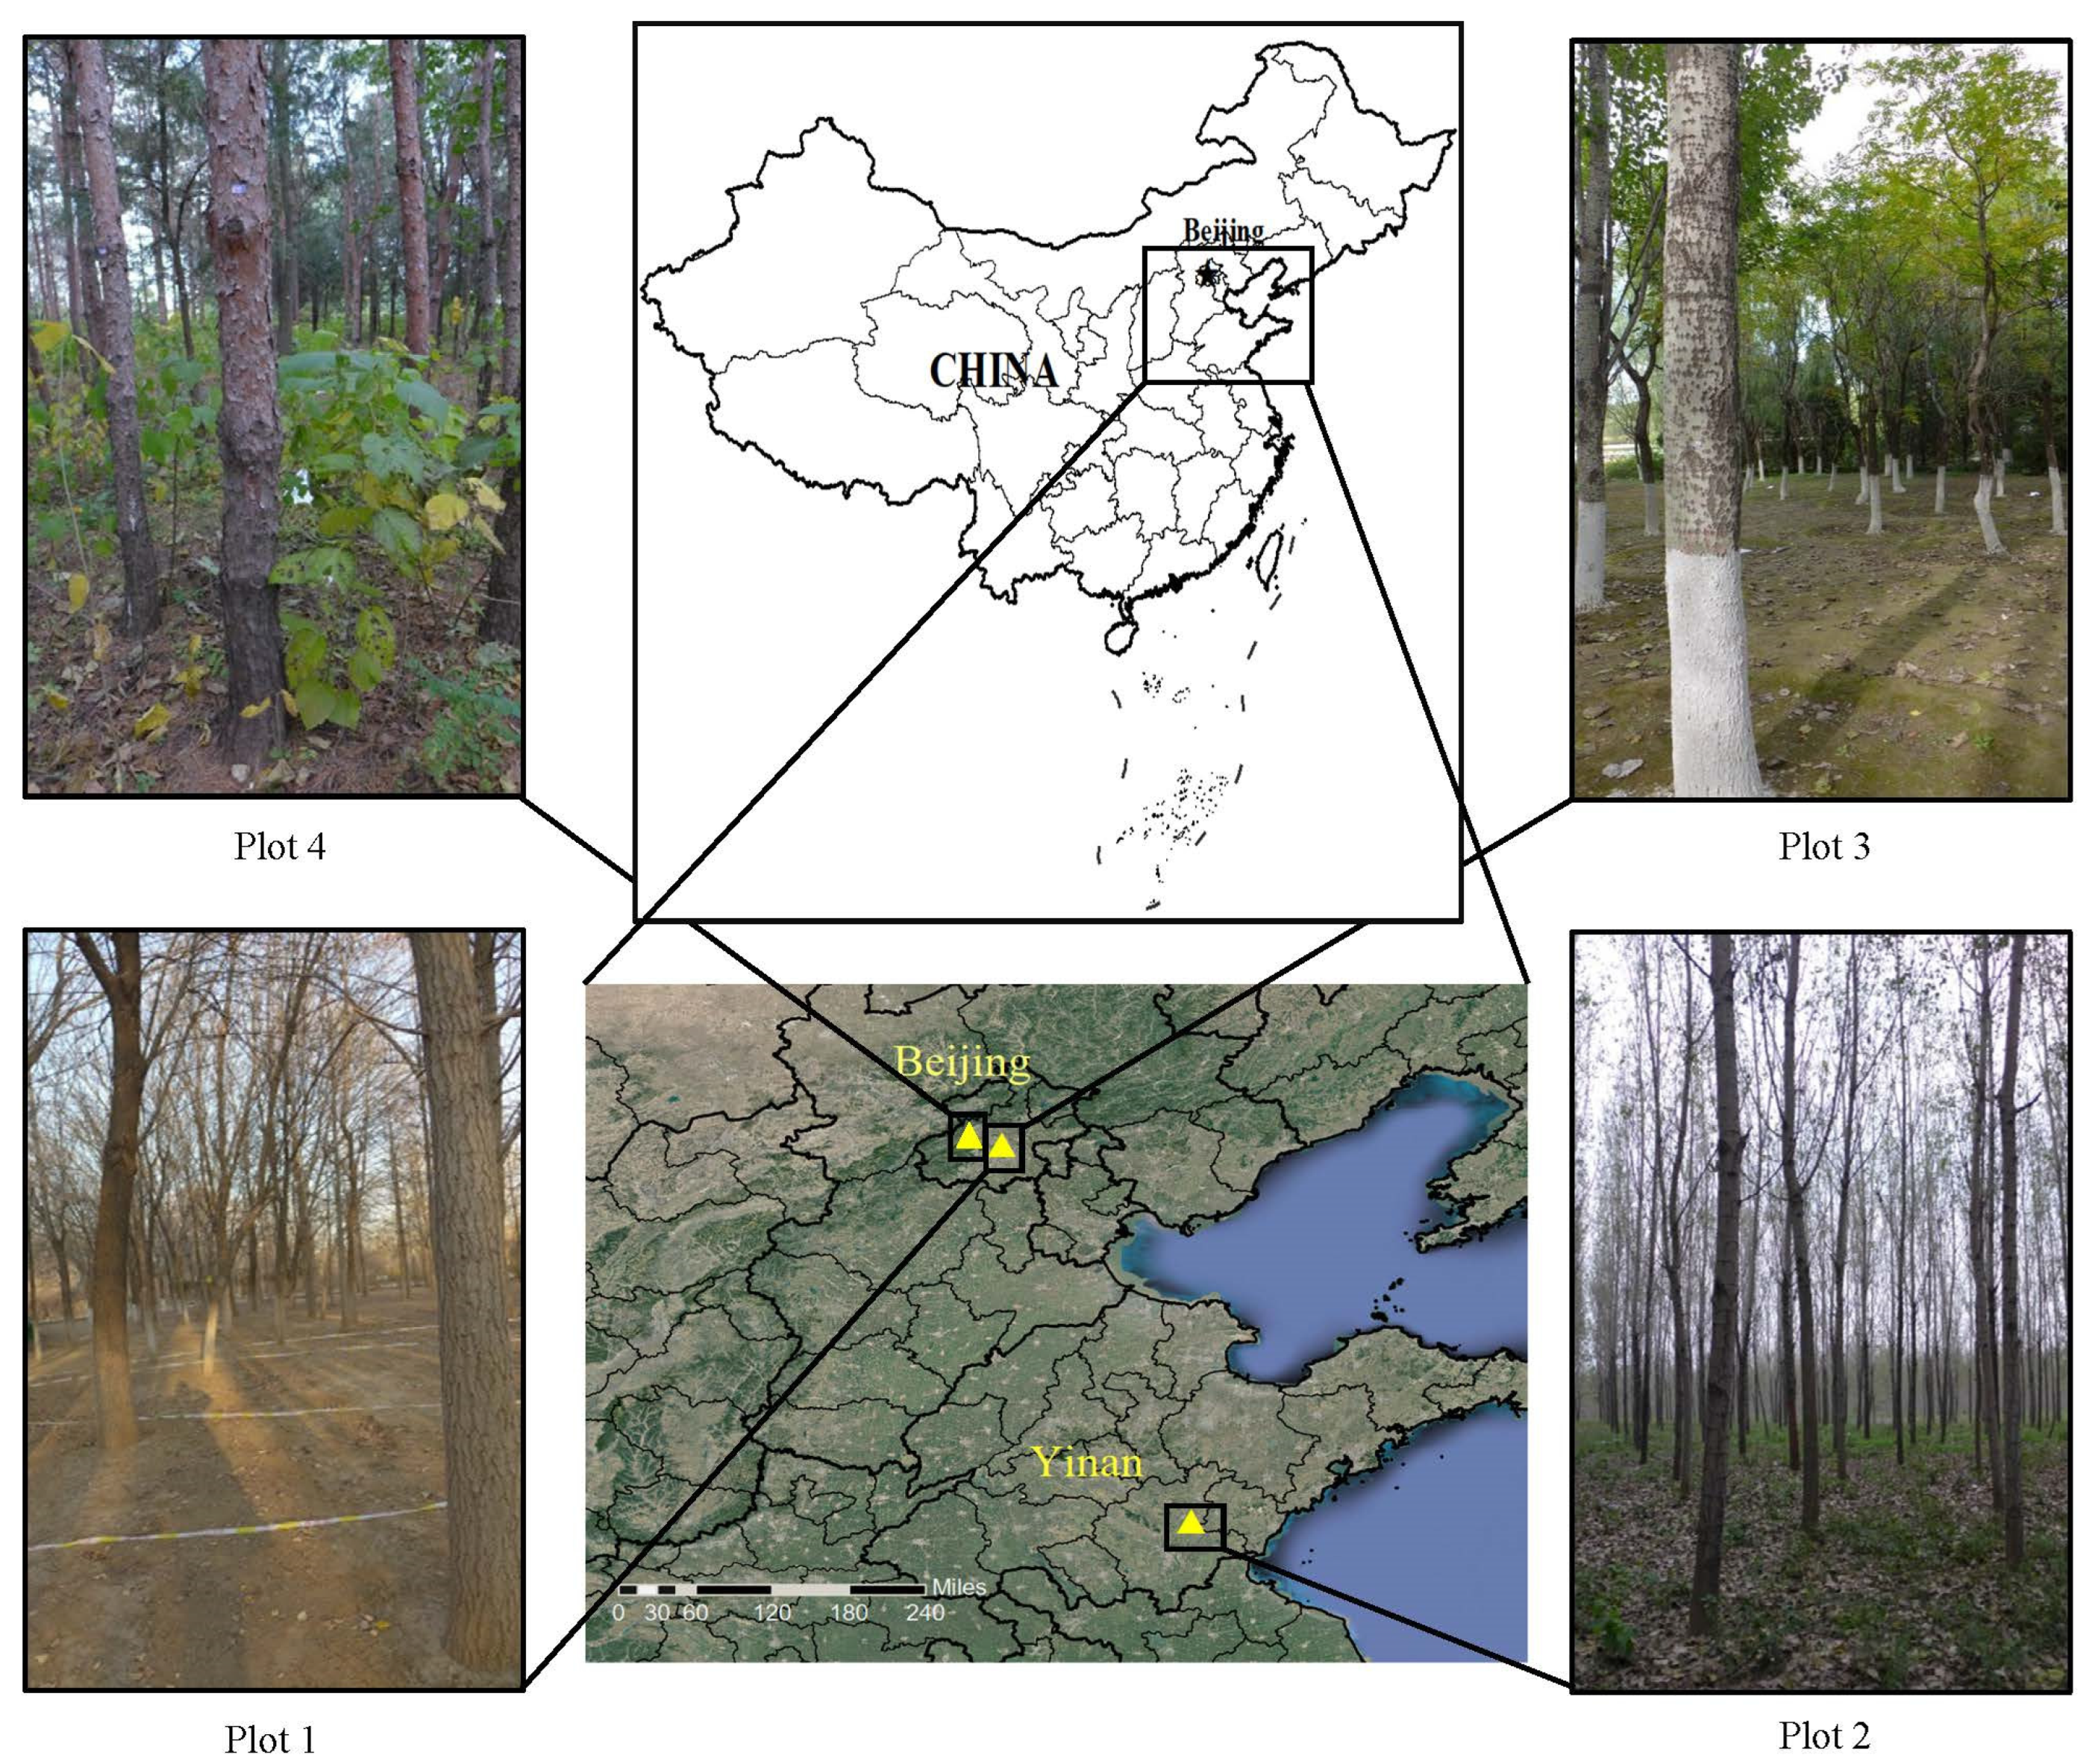
Four forest plots were sampled (
Figure 1,
Table 1). Plot 1 and plot 3 were located at the Olympic forest park of Beijing (116°23′N, 40°01′E). Plot 2 was located in Yinan County, Shandong Province, China (118°33′N, 35°28′E). Plot 4 was sampled from Jiufeng Forest Park in Beijing (116°5′N, 40°3′E). Plot 1 was a circular plot with a diameter of 25 m. In plot 1, the trees were mainly Ginkgo biloba (
Ginkgo biloba L.), of which DBH values ranged from 2.9 to 29.1 cm, with a mean value of 20.1 cm and a standard deviation of 4.5 cm. Plot 2, plot 3, and plot 4 had a rectangular shape of size 25 by 20 m, 30 by 20 m, and 20 by 15 m, respectively. The main tree species were Black poplar (
Populus nigra Linn.) on plot 2, Golden rain (
Koelreuteria paniculata Laxm.), Chinese white poplar (
Populus tomentosa Carr.) on plot 3, and Pinus tabulaeformis (
Pinus tabuliformis Carr.), Oriental arborvitae (
Platycladus orientalis (L.) Franco) on plot 4. The DBHs ranged from 9.4 to 21.3 cm (with a mean value of 16.7 cm and a standard deviation of 2.8 cm) on plot 2 and from 3.7 to 40.1 cm (with a mean value of 21.2 cm and a standard deviation of 7.2 cm) on plot 3. Plot 4 had relatively small tree diameters, which ranged from 5.3 to 20.7 cm, with a mean value of 11.8 cm and a standard deviation of 3.2 cm. The terrain of the four sampling sites was relatively flat, with a maximum slope of four degrees.
The level of difficulty of SfM reconstruction and automatic DBH measuring varied depending on the complexity of the environment. We determined the difficulty level of automatic DBH estimation based on factors such as terrain, vegetation, and tree conditions. Plot 1 was “easy” for its flat, clear terrain and trees with complete, straight, and vertical trunks. Plot 2 was similar to plot 1, but with some shrubs on the ground, which could influence the location of the ground and DBH, so the difficulty level was “medium”. Plot 3, where some trunks of golden rain had been damaged and the roundness of the white poplar trees was generally low (
Figure 2), was labeled as “difficult”. Plot 4 was also “difficult” for the damaged trunk, low tree spacing, and high shrubs (
Figure 1) that were prone to occlude the trunks and thus decrease the reconstruction completeness of the trees and ground.
We respectively collected 238, 220, 275, and 334 images on the four plots in portrait format, which is more suitable for trunks than landscape format. All the images were taken by Panasonic DCM-LX7 camera in automatic mode held by hand. The Panasonic DMC-LX7 is a portable digital still camera using a 1/1.7-inch 10.1-megapixel CMOS sensor and a Leica certified DC VARIO-SUMMILUX lens with an equivalent focal length of 24–90 mm and a maximum aperture of F1.4–F2.3. The maximum resolution is 3648 × 2736, and the resolution of 2232 × 3968 is adopted for the images. We used the minimum focal length to take these images.
For efficient image acquisition, we proposed a new method that reduced the number of images that needed to be collected and so shortened the time needed for assessments. Because of the symmetrical characteristic of the trunk, DBH could be successfully estimated when only one side of the tree had been reconstructed. In other words, we just needed a few images taken for the same side of the tree for the DBH measurement. If all the images were taken in the same direction, the matching of feature points on the trunk would be ensured because the photographed sides of the trees were similar. Therefore, to ensure enough stable matching feature points and larger baselines for the accuracy and completeness of SfM, all images were taken in the same direction, and some images were taken from different heights in our study. Unlike the circular photographic paths used in [
23], the route we designed to get a sequence of overlapping images was composed of lines in the plot, shown in
Figure 3a.
Five images were taken from five positions (left, middle, top, bottom, and right) around a tree before another five images were taken for the next tree along the route at a distance of about 1.5 m from the tree (
Figure 3b). The middle image was taken at a height of 1.5 m. The same part of the target trees’ trunk was contained in the five images. It should be noted that the baselines between the five images must be large enough. In this paper, the baselines were about 25 to 50 cm. One way to ensure this is to make sure the trunk is in different parts (right, middle, bottom, top, and left) of the five images when you photograph it in the same direction. The entire data collection program would be similar to scanning the whole forest tree by tree using a camera. Although portrait images have a drawback on horizontal coverage, it could be offset by the left and right images in the group.
Ground truth values of DBHs were also gathered by manually measuring the diameter at breast height (1.3 m) using diameter tape.
Because SfM can only provide the relative size in the reconstructed model, the relative scale parameter between the space of the model and the real world must be known to obtain exact DBHs from the 3D model [
26]. The spatial scale could be determined if any real size or length value of the model is known. It is better to be on something well-marked. Our marks were two red wires tied on a trunk between which the distance was one meter, while some were connected with a straight wire to show the exact position of the one meter (
Figure 4). They were located near the center of the plot out of concern for error propagation. A one-meter distance is appropriate because it could be captured in one image and be reconstructed and observed in the points cloud.
2.2. Reconstruction of the 3D Model of Forest from Images
To get models of the forest, we processed the taken images with a reconstruction algorithm.
The reconstruction pipeline is composed of two main procedures: SfM and MVS (
Figure 5).
In the process of SfM, sparse point cloud and camera parameters, including pose and focal length of every taken image, would be derived after correspondence search and incremental reconstruction [
27]. The goal of correspondence search is to generate a scene graph. It describes the matching relationship between feature points in every image generated by feature point detection and matching based on scale-invariant feature transformation (SIFT) [
28] and geometric verification [
29]. The incremental reconstruction is mainly utilized to calculate the camera pose with the scene graph and then derive the 3D coordinates of feature points with triangulation. The incremental reconstruction is performed on each image in a certain order. A nonlinear optimization algorithm called bundle adjustment must also be performed timely to get more accurate results in the process. To make the algorithm more robust to interference, the RANSAC was applied framework in geometry verification, pose calculation, and triangulation.
It is noted that there is an inherent conflict between feature point matching and triangulation in SfM about the baseline. For SIFT, the feature points are expected to be shot from similar angles, in which case the feature points are matched easily, and the baselines are short. On the other hand, for the triangulation algorithm, the length of baselines must be large enough to reduce the uncertain calculation errors [
30]. The conflict is more apparent when it comes to the nonplanar surface such as the tree trunk, so the length of baselines must be appropriate. It is the theoretical basis of our data collection method described in the previous section, which was proposed by the rule of photographing the similar sides of the trees with enough baselines.
Then, MVS [
31] can be executed according to the intrinsic and extrinsic parameters gained from SfM. MVS calculates many 3D points via finding the projections on relative images of the same 3D points by comparing the similarity of the patches around the assumed projected pixels. For faster convergence, the sparse point cloud can be introduced to initialize MVS. Depth, normal, and occlusion factors of every pixel on images can be estimated with the help of the hidden Markov random field and the generalized expectation maximization (GEM) algorithm [
32] after initialization. The following filtering process removes pixels that are not consistent in photometry and geometry, resulting in more stable depths and normals. Finally, the fusion of depth maps can be performed to produce resolution controllable dense 3D point clouds with color and normal information.
2.3. Automatic DBH Extraction
The DBH extraction pipeline comprises five procedures: scale factor determination, terrain extraction, single tree segmentation, DBH points (3D points at breast height) segmentation, and cylinder fitting (
Figure 6).
The Dense points cloud was used for the DBH estimation. The normal information that dense point clouds provide offers additional flexibility for point cloud processing.
Before the processing, the scale factor was first determined. The scale factor could be easily derived in our software with interactive operation by manually selecting two points and inputting the actual distance.
For the location of 3D points at trees’ breast heights (1.3 m), the ground part of the points should be first identified and separated. The terrains of our study sites were relatively flat, which meant their geometric features were close to the plane, so the problem was solved by finding the largest plane by RANSAC. RANSAC is an efficient fitting algorithm with strong robustness to the outliers. We also used it to rapidly separate every tree from the point clouds by modeling trees as lines that were approximately perpendicular to the plane of the ground. More accurately, the angles between the directions of these lines and the normal of the plane were limited to less than 30 degrees, and only the trees which were supported by enough points were accepted. Then, we extracted points near the breast height (1.275–1.325 m) as the DBH point cloud for final estimation.
The method of projecting the DBH point cloud onto a plane and estimating DBH using the circle model or elliptical model is the general way to extract DBH [
9,
22,
23,
33,
34]. The limitation is that the direction of the projection is not accurate because it is estimated from the overall direction of the tree other than the direction of the part at breast height. Therefore, we directly estimated DBH based on the cylinder model, taking advantage of the normals produced by MVS. The least Median of Squares (LMedS) algorithm instead of RANSAC was applied for the cylinder fitting. LMedS is a RANSAC-like model-fitting algorithm, but it uses the lower median of all point-model distances as the evaluation of a model and thus has more tolerance for outliers without requiring thresholds. In the calculation of point-model distances, normals took a lower weight than the position of a point for reliability. After the fitting, only diameters with sufficient inliers were taken as the DBH of the tree.
In general, at least five 3D points are needed to calculate a set of parameters of a cylinder because there are five independent parameters in the cylinder model [
35]. The number should be reduced to two if the normal information of the point cloud is already known. LMedS needs to sample enough times for reliability. The sampling times are determined by parameters, including the size of the sample subset and the rate of inliers. Three more sampled points mean that execution time multiplies because the number of iterations multiplies significantly when the rate of inliers is pretty low in the total dataset. Therefore, the extra information on normals increased the efficiency of DBH measurement in our study. Besides, our fitting would also have worked in case the height of the cylinder was larger than its diameter, while the general cylinder fitting method, which first performs the principal component analysis (PCA) for estimating cylinder orientation and then performs circle fitting to derive other parameters [
35,
36], would fail in the situation. Compared to the geometric least-squares fitting cylinder [
37], LMedS naturally has more strong robustness, which can tolerate up to 50% outliers.
We estimated DBH three times to deal with the trunks with low roundness and took the average as the final result. Because the inlier threshold of LMedS would affect the result, we roughly pre-estimated DBH value and used it to determine the threshold of the rest estimations. We used the following formula to determine the distance threshold of the final estimation:
where pre_dbh is the pre-estimated DBH in meters obtained from LMedS with a distance threshold of 0.03 m.
Then, three estimations were performed, and the support points were abstracted. Support points were defined as the number of support points that would determine whether it was a good estimation. Only good estimations would be used to calculate the final DBH. If the sum of these support points was below 15 percent of the whole DBH points, the result would be counted as an unreliable result and rejected.
Our other parameter settings were as follows. We set the distance threshold of RANSAC to 10 cm for extracting ground. Then the distance threshold was generally set to 50 cm for tree segregation, and trees of which the number of 3D points was more than one thousand were separated. However, due to the low tree spacing of plot 4, we reduced the distance threshold to 25 cm for the plot. The points with a height of 1.275 to 1.325 m were sliced as the DBH points for cylinder fitting.
Each procedure of the pipeline of DBH extraction has been automated except for scale factor determination, which needs a few interactive operations. All these procedures were developed based on PCL and were integrated into our Auto DBH.
2.4. Data Analyses
For each study plot, the efficiency of our image acquisition was quantified by calculating the average acquisition time per tree and the average number of acquired images per tree.
The number of registered images, the number of reconstructed trees, and the reconstruction rate, which was the ratio of registered images to all images, were calculated to assess the reconstruction completeness. The reconstruction time and vertices of dense point cloud were also provided.
For each plot, the detection rates, which were the percentage of trees whose diameters were successfully measured, were calculated to evaluate the completeness of DBH measurement.
For accuracy analyses, values were provided for bias: the difference between estimated and measured DBH; absolute bias, the absolute value of the difference between estimated and measured DBH; mean relative error, absolute bias as a percent of the tree diameter; root mean square error (RMSE) as a cm value and as a percent of the tree diameter (Relative RMSE), according to the following formula:
where
is the estimated DBH,
is the ground truth value of DBH measured by diameter tape, and n is the number of trees.
2.5. Auto-DBH Development
For the convenience of forest inventory, Auto-DBH, which is a graphic interface software for the automatic DBH estimation based on SfM photogrammetry, was developed in the C++ programming language. The software consists of two parts: reconstruction and DBH measurement, connected by the point cloud file in ply format. The ply files produced by SfM are the input of the DBH measurement. Two display windows for reconstruction and measurement are developed, and they are integrated with functions including SfM reconstruction, scale determination, and DBH estimation under Qt graphic framework (
Figure 7). The reconstruction functions, including feature extraction and matching, SfM, MVS, and the display of reconstruction results, were developed based on COLMAP [
27,
31]. We used Point Cloud Library (PCL) for DBH estimation and presentation and provided interactive scale factor determination and estimated DBH query (
Figure 7).
4. Discussion
The main objective of this study was to analyze the application of SfM photogrammetry on automatic DBH measurement in the forest. Based on the understanding of SfM photogrammetry, we improve the image acquisition efficiency, the efficiency, and accuracy of DBH measurement by reducing the number of collected images and using the RANSAC framework with normal information generated by reconstruction.
The basic principles of SfM, including feature extraction and matching, as well as triangulation, determine the essential condition for desired forest reconstruction. Feature extraction and matching algorithms such as SIFT would not identify and match features very well if the baseline was too long. However, a large baseline must be ensured for valid triangulation results with low errors for the triangulation algorithm. Taking as many redundant images from different viewpoints helps solve the conflict. However, it also leads to more computational resource consumption and excessive data acquisition time, which increases the risk of weather changes affecting the matching.
In that context, data acquisition efficiency is essential for forest surveys on the premise of ensuring reconstruction quality. Piermattei et al. [
23] took a collection program that balanced speed and quality, achieving a faster acquisition speed than TLS overall. We further optimized the acquisition scheme for tree trunks by reducing the image number per tree so that the time spent on each tree was reduced and higher acquisition efficiency was reached. The reduction was mainly due to the strategy of only reconstructing one side of the tree other than recovering all the parts of the trunks by the images taken densely around the tree. The other design of taking five images of a group for a tree was mainly to raise reconstruction quality. In SfM, low relative resolution and small triangulation angle would degenerate the reconstruction. For this reason, after reconstruction, the trees far from the photographing path would be presented by sparse point clouds of low quality that could not provide detailed information [
39]. Our method could avoid that, and the occlusion problem was also solved by taking images for every single tree.
In terms of reconstruction completeness, only nine percent of trees on plot 1 failed to be registered to the SfM. The failure was mainly caused by varying illumination and less overlapping images taken in a sparsely wooded area. Images taken in the portrait model may affect the completeness, but the observation that only the trees near the edge of our plots may fail to be reconstructed indicates that the density of the surrounding images had a more significant effect in our case. Supplementing some images circumstantially between trees may help, but the complete and high-quality reconstructions of the other three plots show that our image acquisition method could provide enough image overlapping for SfM.
In precision, the RMSEs of the first two plots could meet the accuracy requirement of DBH. The RMSE of plot 2 was even lower than the 1.21 cm of the best plot in [
23], which also studied the DBH measurement based on SfM photogrammetry but did not automate it. We spent less time on data acquisition and processing, and the accuracy of the two plots was slightly lower than the TLS based method in [
23] in terms of RMSE and relative RMSE. This means SfM photogrammetry can be as accurate as TLS in forest inventory. The data also shows that, besides efficiency, accuracy is also guaranteed using our collection scheme. If trees in a forest have relatively round trunks, DBH can be accurately estimated using images from one side of the tree, saving substantial time and effort, but the method is unsuitable for areas where tree trunks have a substantial deviation from roundness.
The DBH measuring time is really short and negligible compared to the time of SfM reconstruction, mainly due to the automated measure pipeline based on RANSAC. Normal information of the point cloud also has an effect on efficiency in our experiment. It certainly helps shorten the time by reducing the sample subset size of RANSAC utilizing normal information. More importantly, it provides the new possibility of the directly fitting cylinder under the RANSAC framework, hence robustness and efficiency are both ensured. Color information can also help data processing. Liang et al. [
39] pre-classified the point clouds according to color, and points with a high green value were removed. Therefore, many useless points were filtered, and the robustness and efficiency of estimation were enhanced. According to their research and our experiment, the estimation procedure could be optimized by utilizing the color and normal information provided by SfM in forest inventory. This is an advantage that LiDAR does not have.
Even though we took some measures to lower the total number of input images, the reconstruction time was still long. The long reconstruction time is the main drawback of SfM, so taking many images and building a detailed model of an oversize scene at one time by SfM–MVS is not practical. However, the DBH estimation workflow based on SfM photogrammetry is automated in Auto-DBH, so the drawback is acceptable for plot size forest inventory.
Auto-DBH helps improve measurement efficiency because the inefficient operation of using commercial software for reconstruction followed by point cloud processing software for manual measurements is avoided. The development of Auto-DBH is of great significance for the practical application of SfM based forest inventory. The simple operation of the automated functions and graphic interface makes Auto-DBH a convenient tool for DBH measurement in forest inventory based on SfM photogrammetry.
Although rapid collection and accurate and efficient automatic DBH estimation was achieved for trees with high roundness stems, the method still has some limitations. Firstly, our approach for image collection is specialized for low parts reconstruction, and if the parameter of the higher parts of trees is wanted, some adjustments are necessary. Secondly, our RANSAC-based measurement could not handle the forest of complex terrain because RANSAC-based segmentation is only available when the model can be described by a mathematical model of definite form. Similarly, our DBH estimation is not suitable for the trees with trunks that have a substantial deviation from roundness.
The following questions need to be solved in the future. An efficient image collection method for the accurate and complete reconstruction of the upper part of the tree should be explored so that metrics such as height and crown width can be estimated. An automated, robust, and effective measurement method that is suitable for the data of SfM and is generalized for all forest inventory parameters needs to be studied. How to realize rapid reconstruction of a large forest area using SfM is a problem as well. The DBH estimation method needs to be improved to apply to more species.
5. Conclusions
To meet the demand for economical, labor-saving, and time-saving DBH acquisition of the individual tree in forest inventory, we achieved automatic DBH measurement on a plot-level forest based on SfM photogrammetry and conducted experiments on four forest plots with different tree species.
In the paper, a new image collection method optimized for DBH estimate was proposed. The method performs well in efficiency, ensures the quality of forest reconstruction, and avoids the sparsity of trunks caused by long distances from the path. The high reconstruction completeness of the four plots indicates that our image acquisition method can also guarantee the complete reconstruction of forests. We also proposed an automatic DBH estimation pipeline and analyzed the estimation accuracy. The low RMSE and mean relative error of plots 1 and 2 show that we realized precise automatic DBH measurement for relatively round tree trunks and SfM photogrammetry can achieve accuracy close to TLS with a much lower cost. It also proves that structure information on one side of a tree is sufficient for the DBH estimation of forests with round trunks. The results of plot 3 show that our estimation method is unsuitable for species with large trunk deviations from roundness. Our RANSAC-based DBH measurement procedure is of excellent efficiency. It only takes an average of 2 s to estimate the DBH of a tree. The color and normal information of SfM is an advantage LiDAR does not have which should be made full use of for the development of better measurement methods based on SfM photogrammetry. In the paper, an automatic DBH software Auto-DBH integrated with SfM reconstruction is developed. It is of great significance for the practical application of SfM based forest inventory.
This study proposes an efficient image acquisition method, realizes and optimizes automatic DBH measurement based on SfM photogrammetry, and integrates it into Auto-DBH with SfM reconstruction. It provides a reference for future research to further improve the forest investigation methods based on SfM photogrammetry and promote its development in practical application.


