
Saltation Activity on Non-Dust Days in the Taklimakan Desert, China

 ,
,  , and
, and
Abstract
:
1. Introduction
2. Materials and Methods
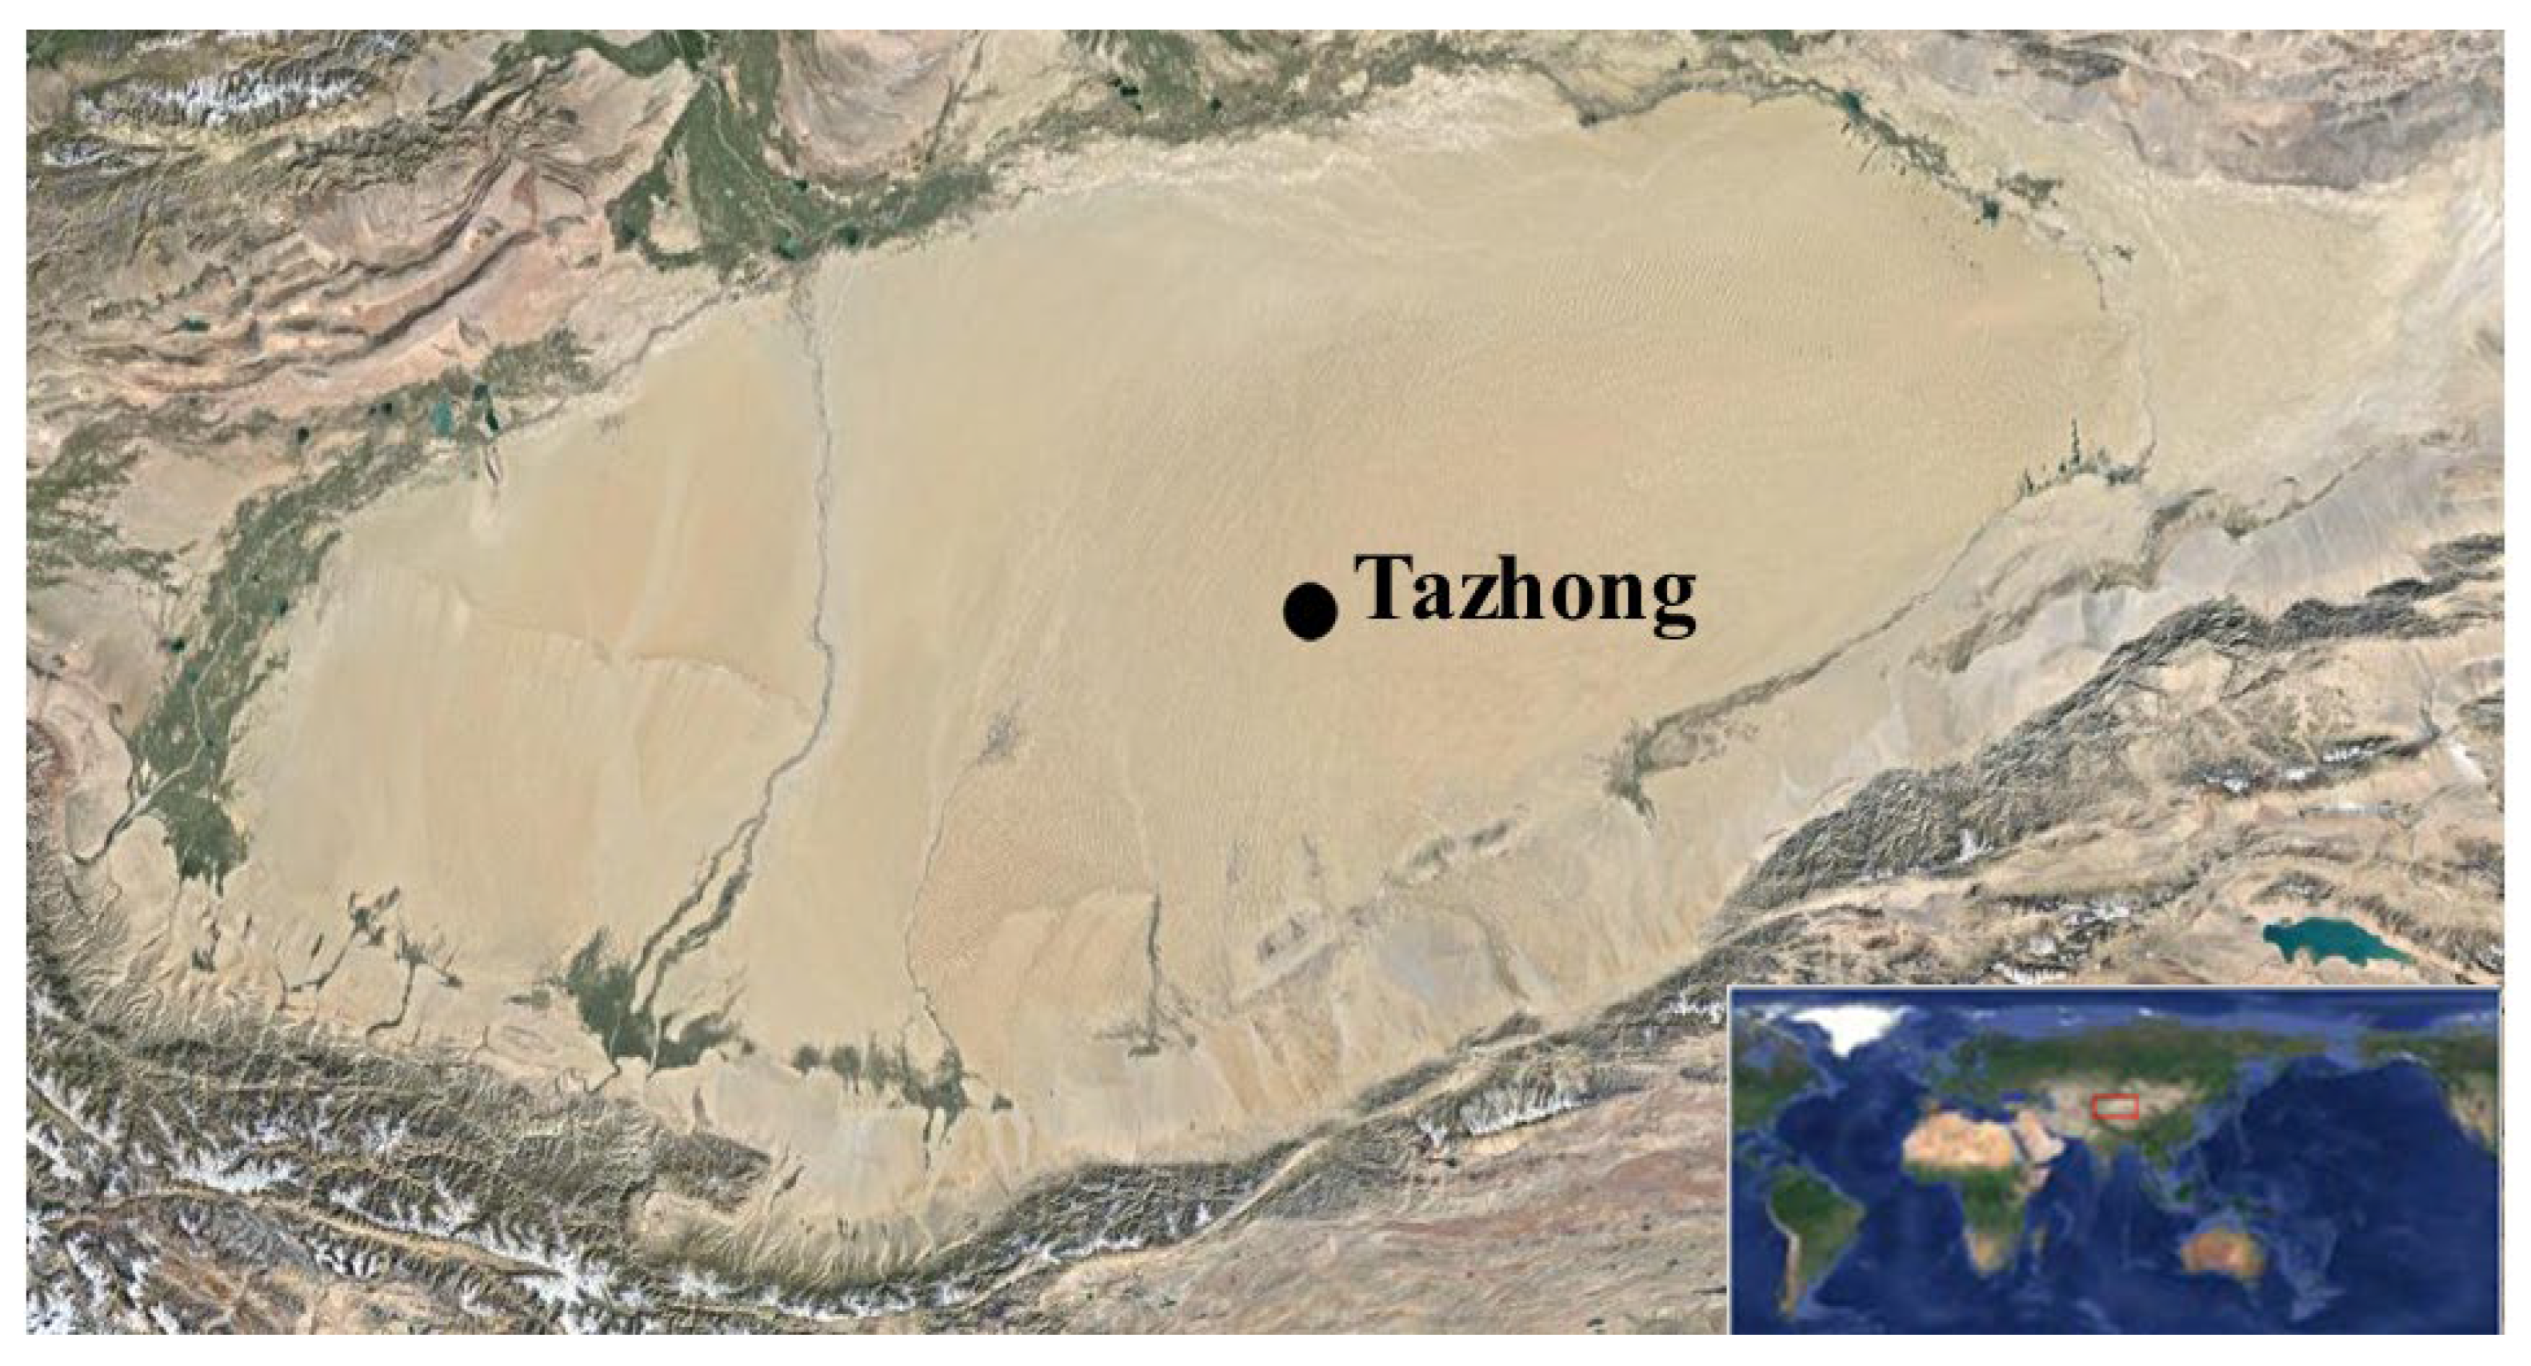
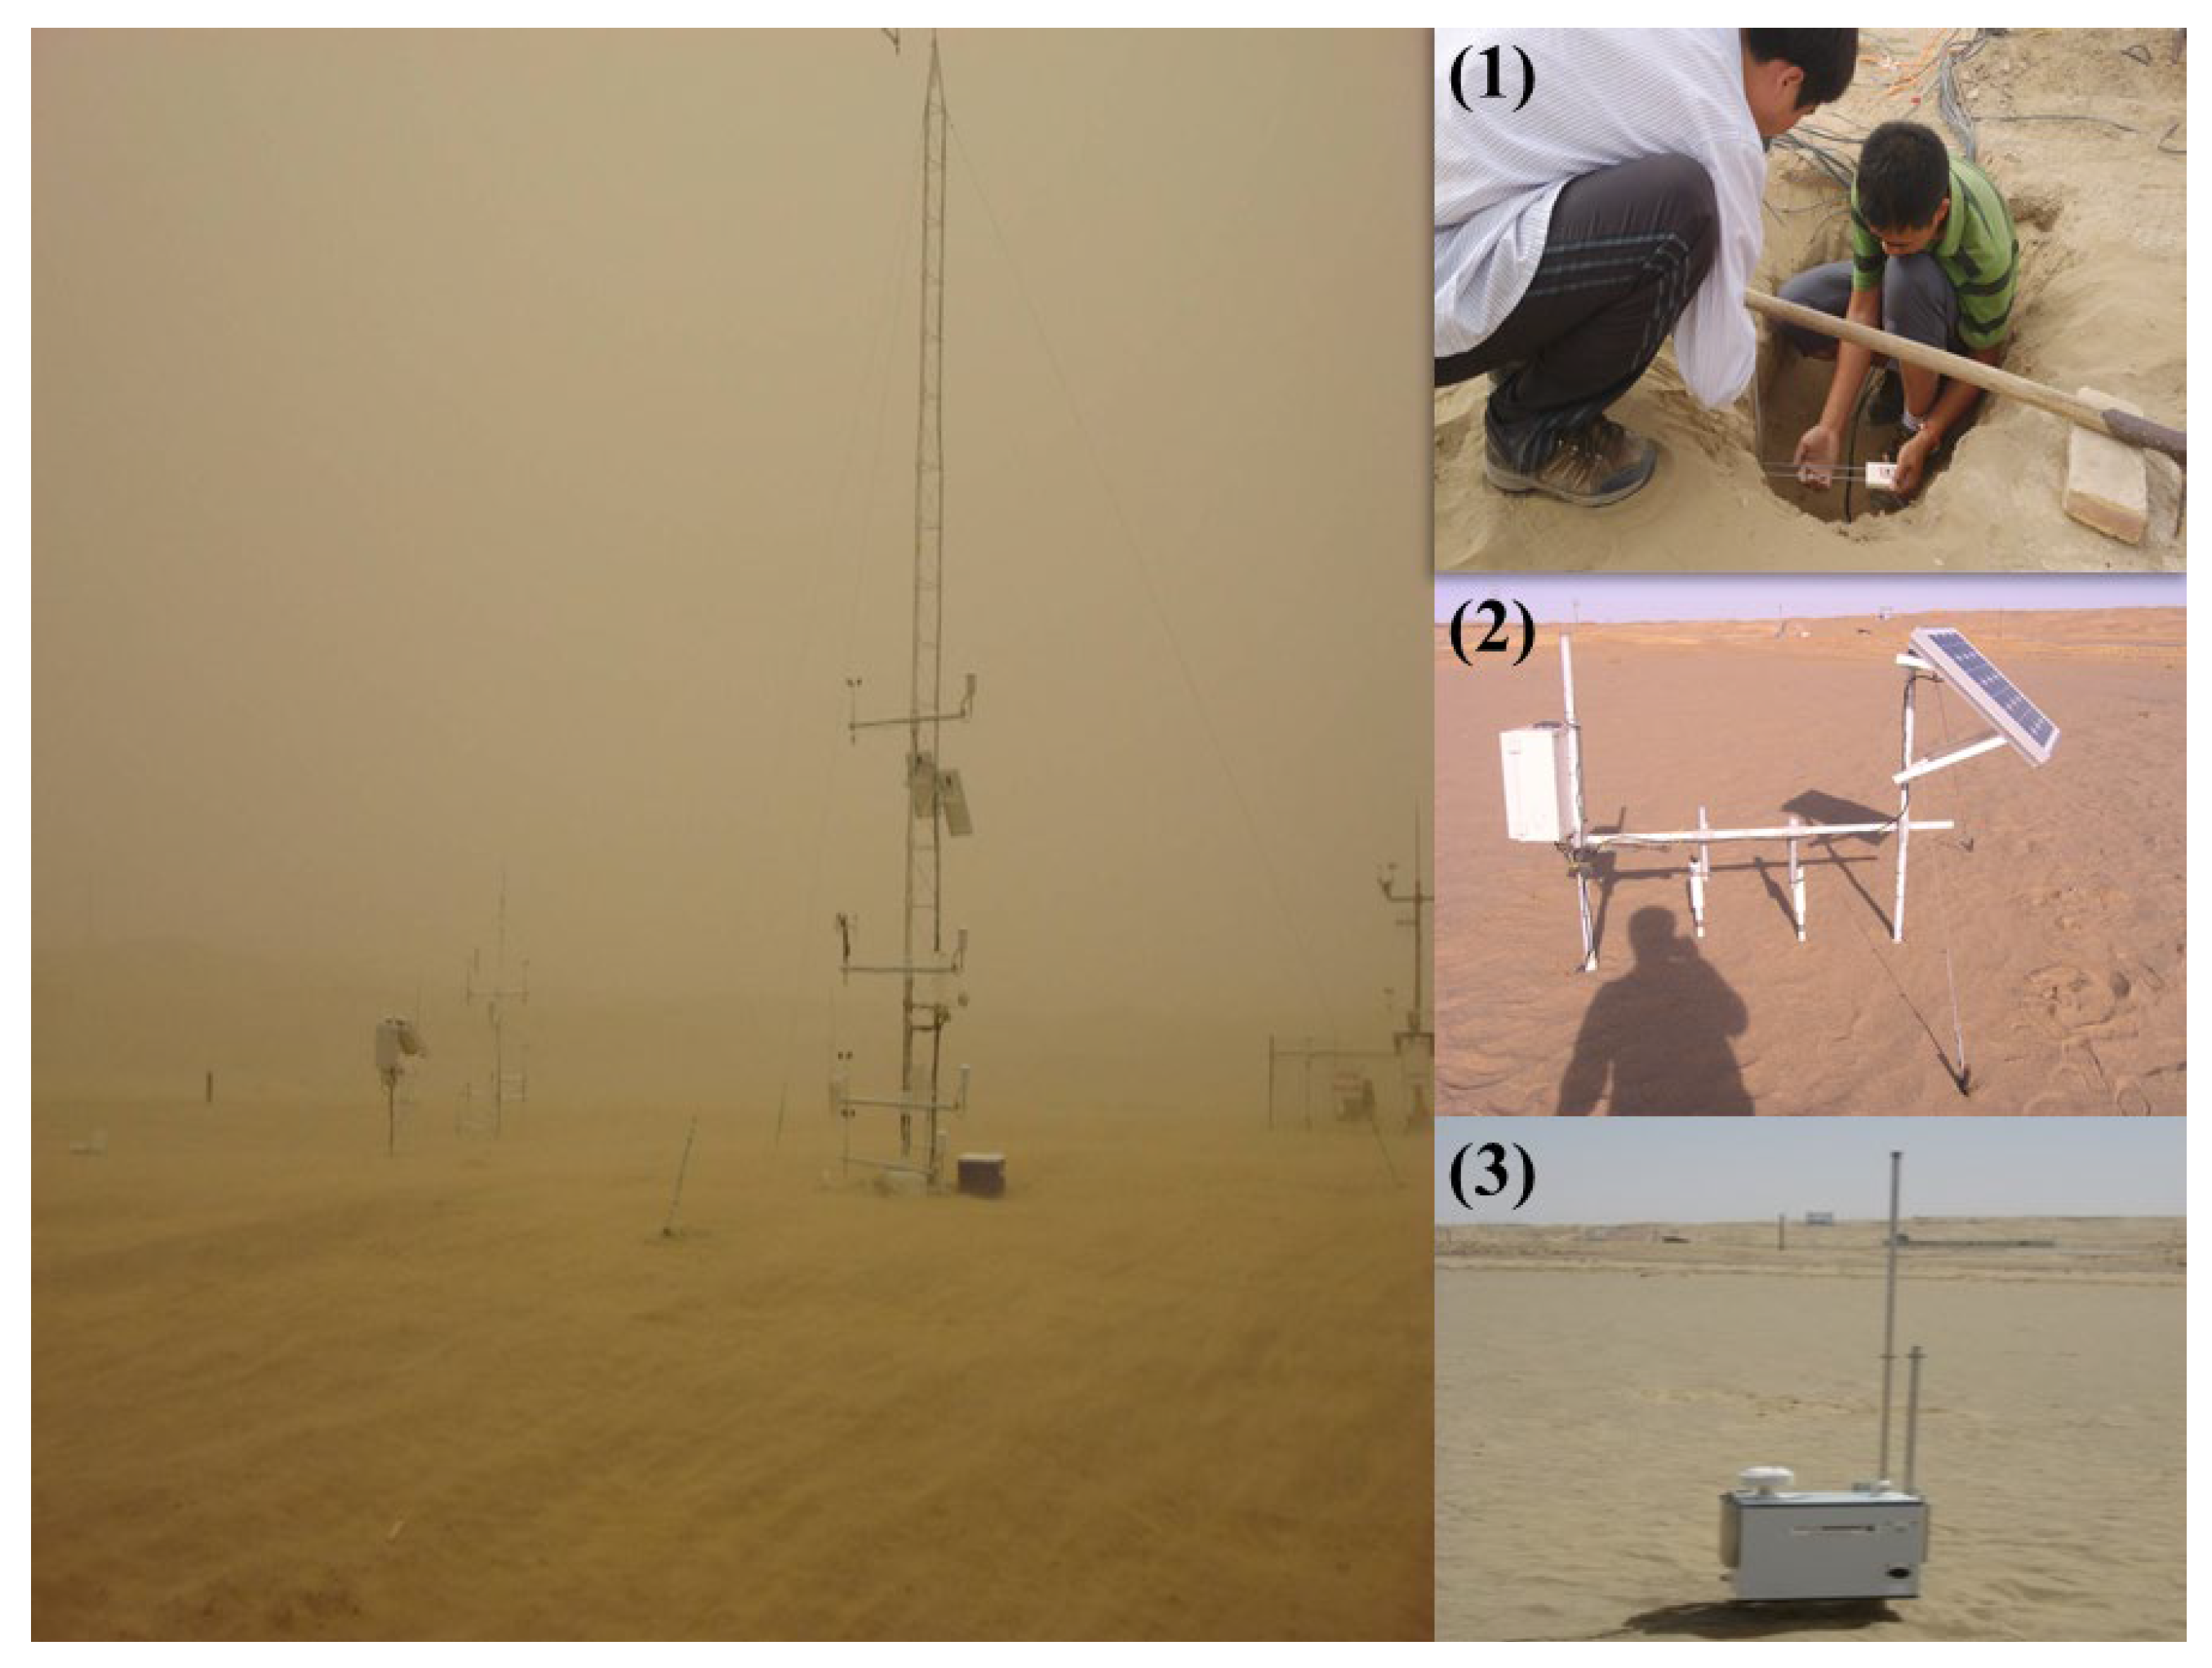
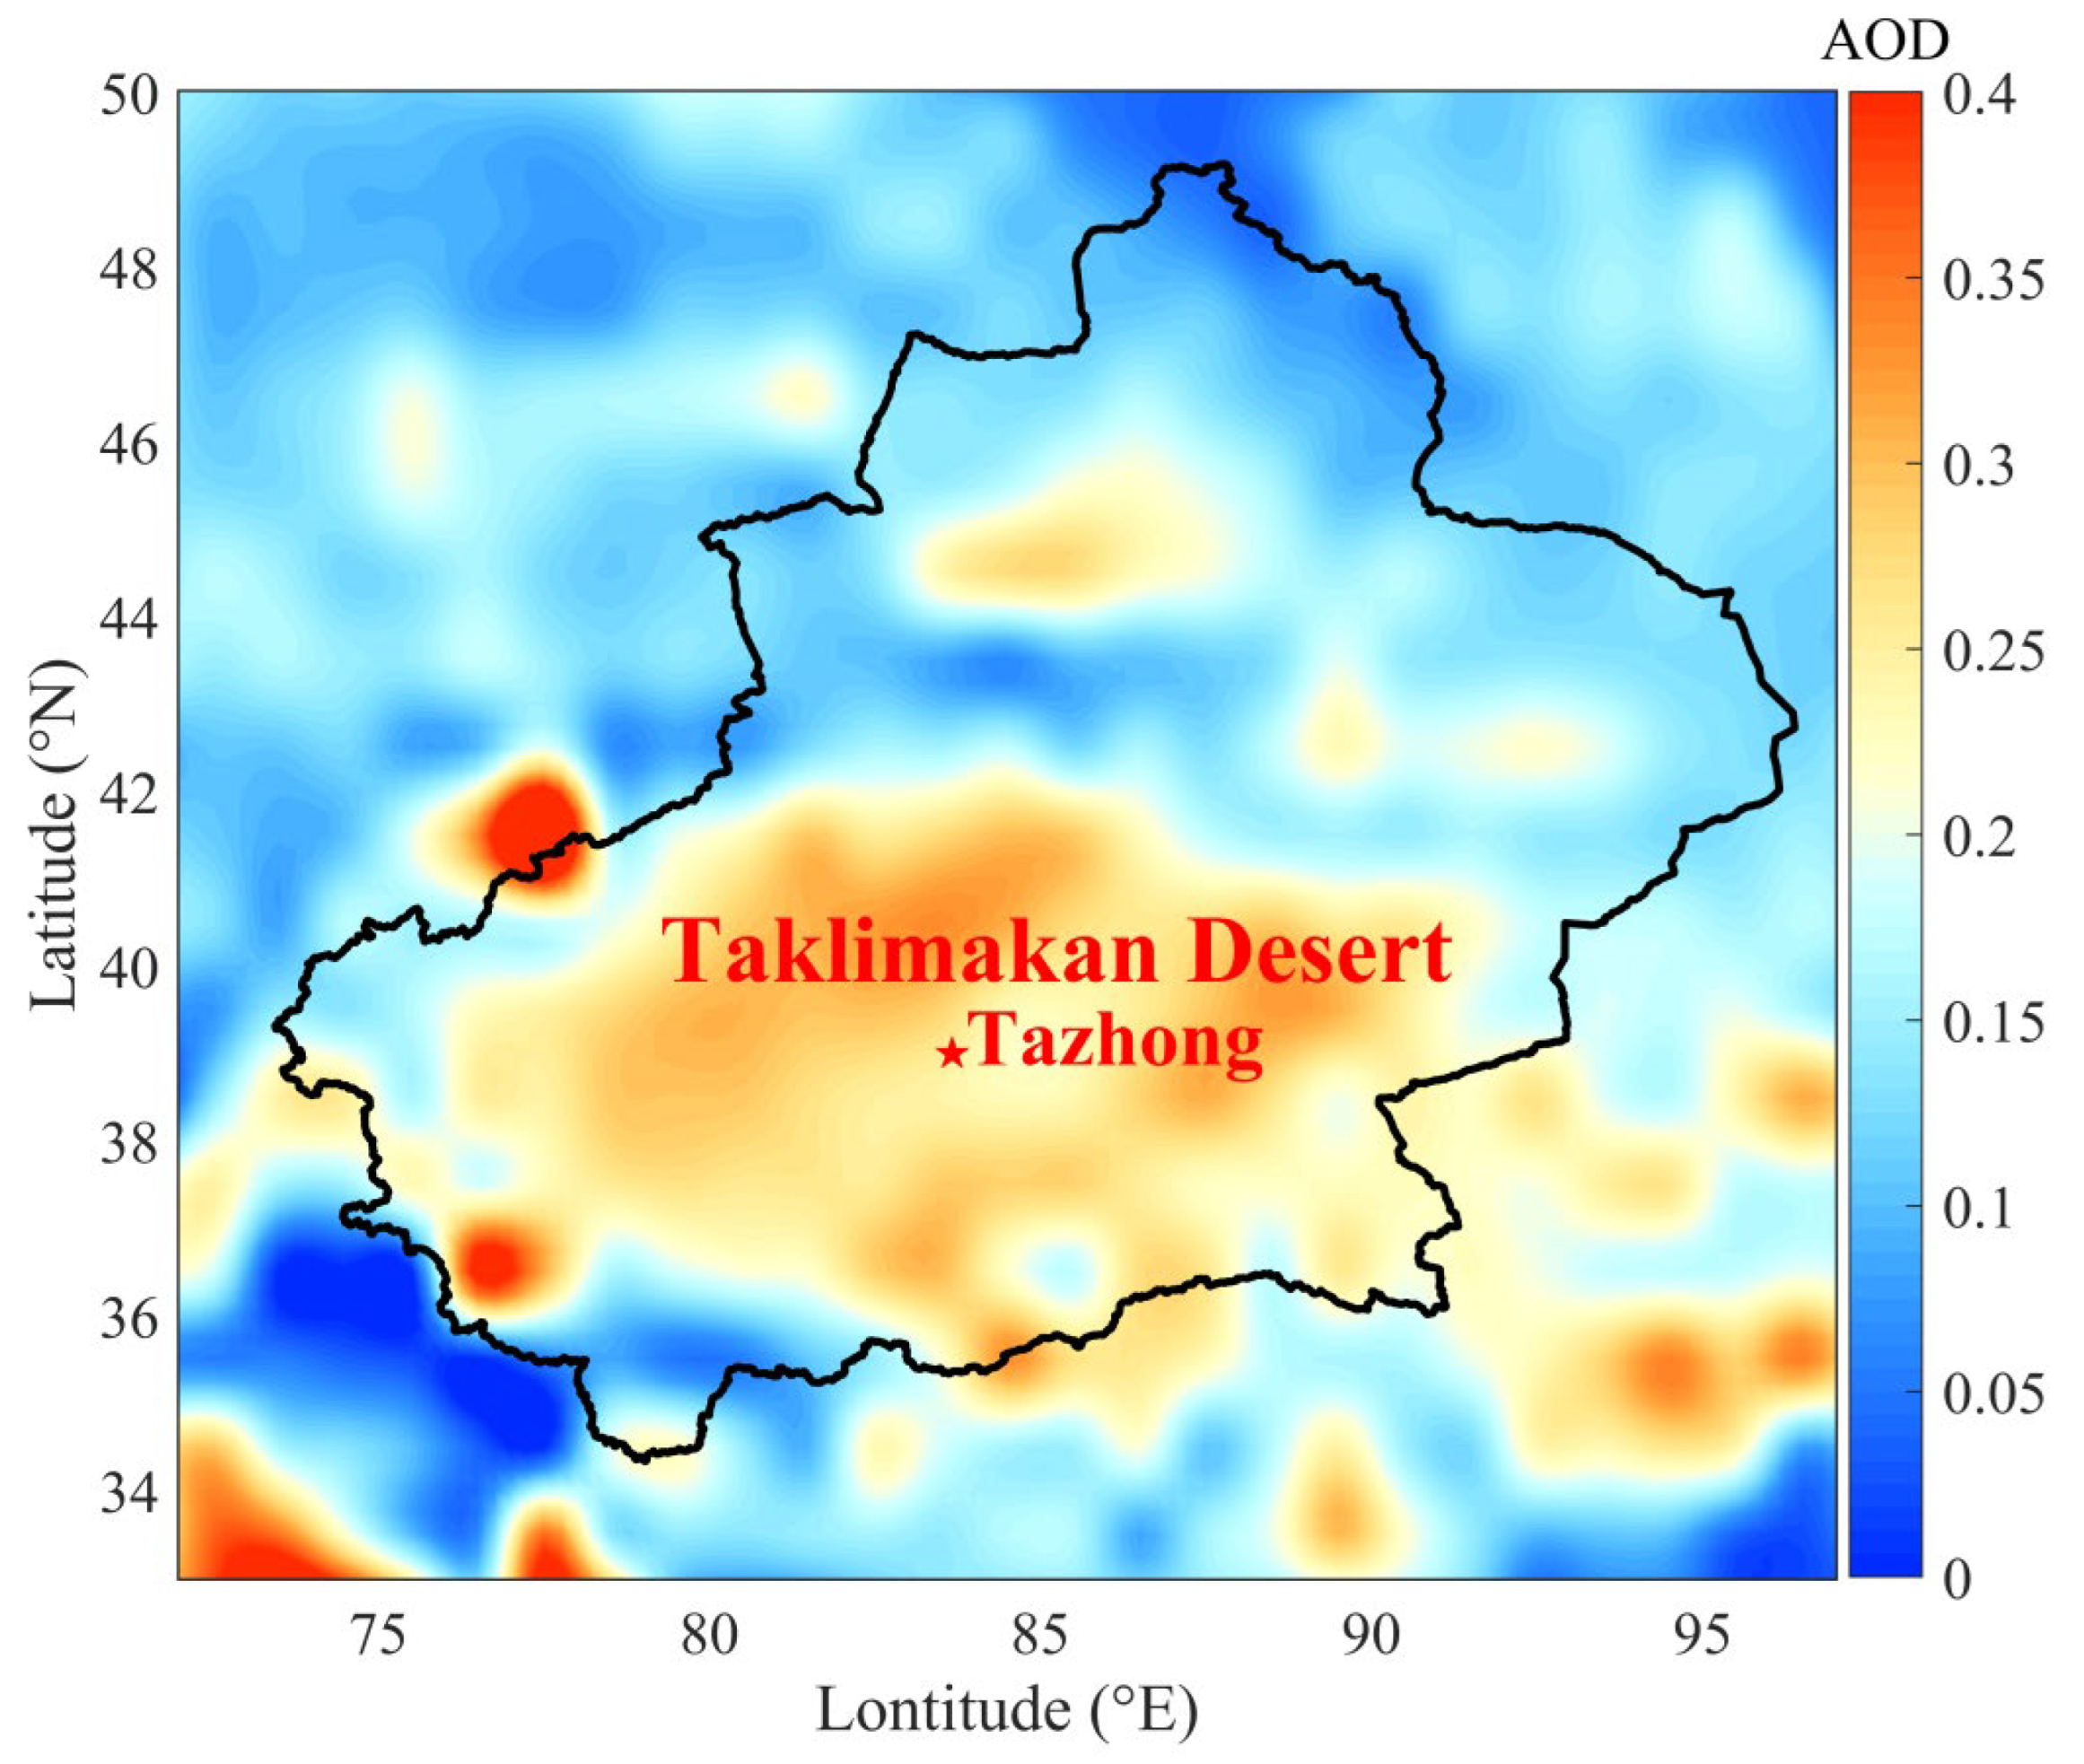
2.1. Experimental Site and Data
2.2. Threshold Velocity for Saltation Activity
3. Results
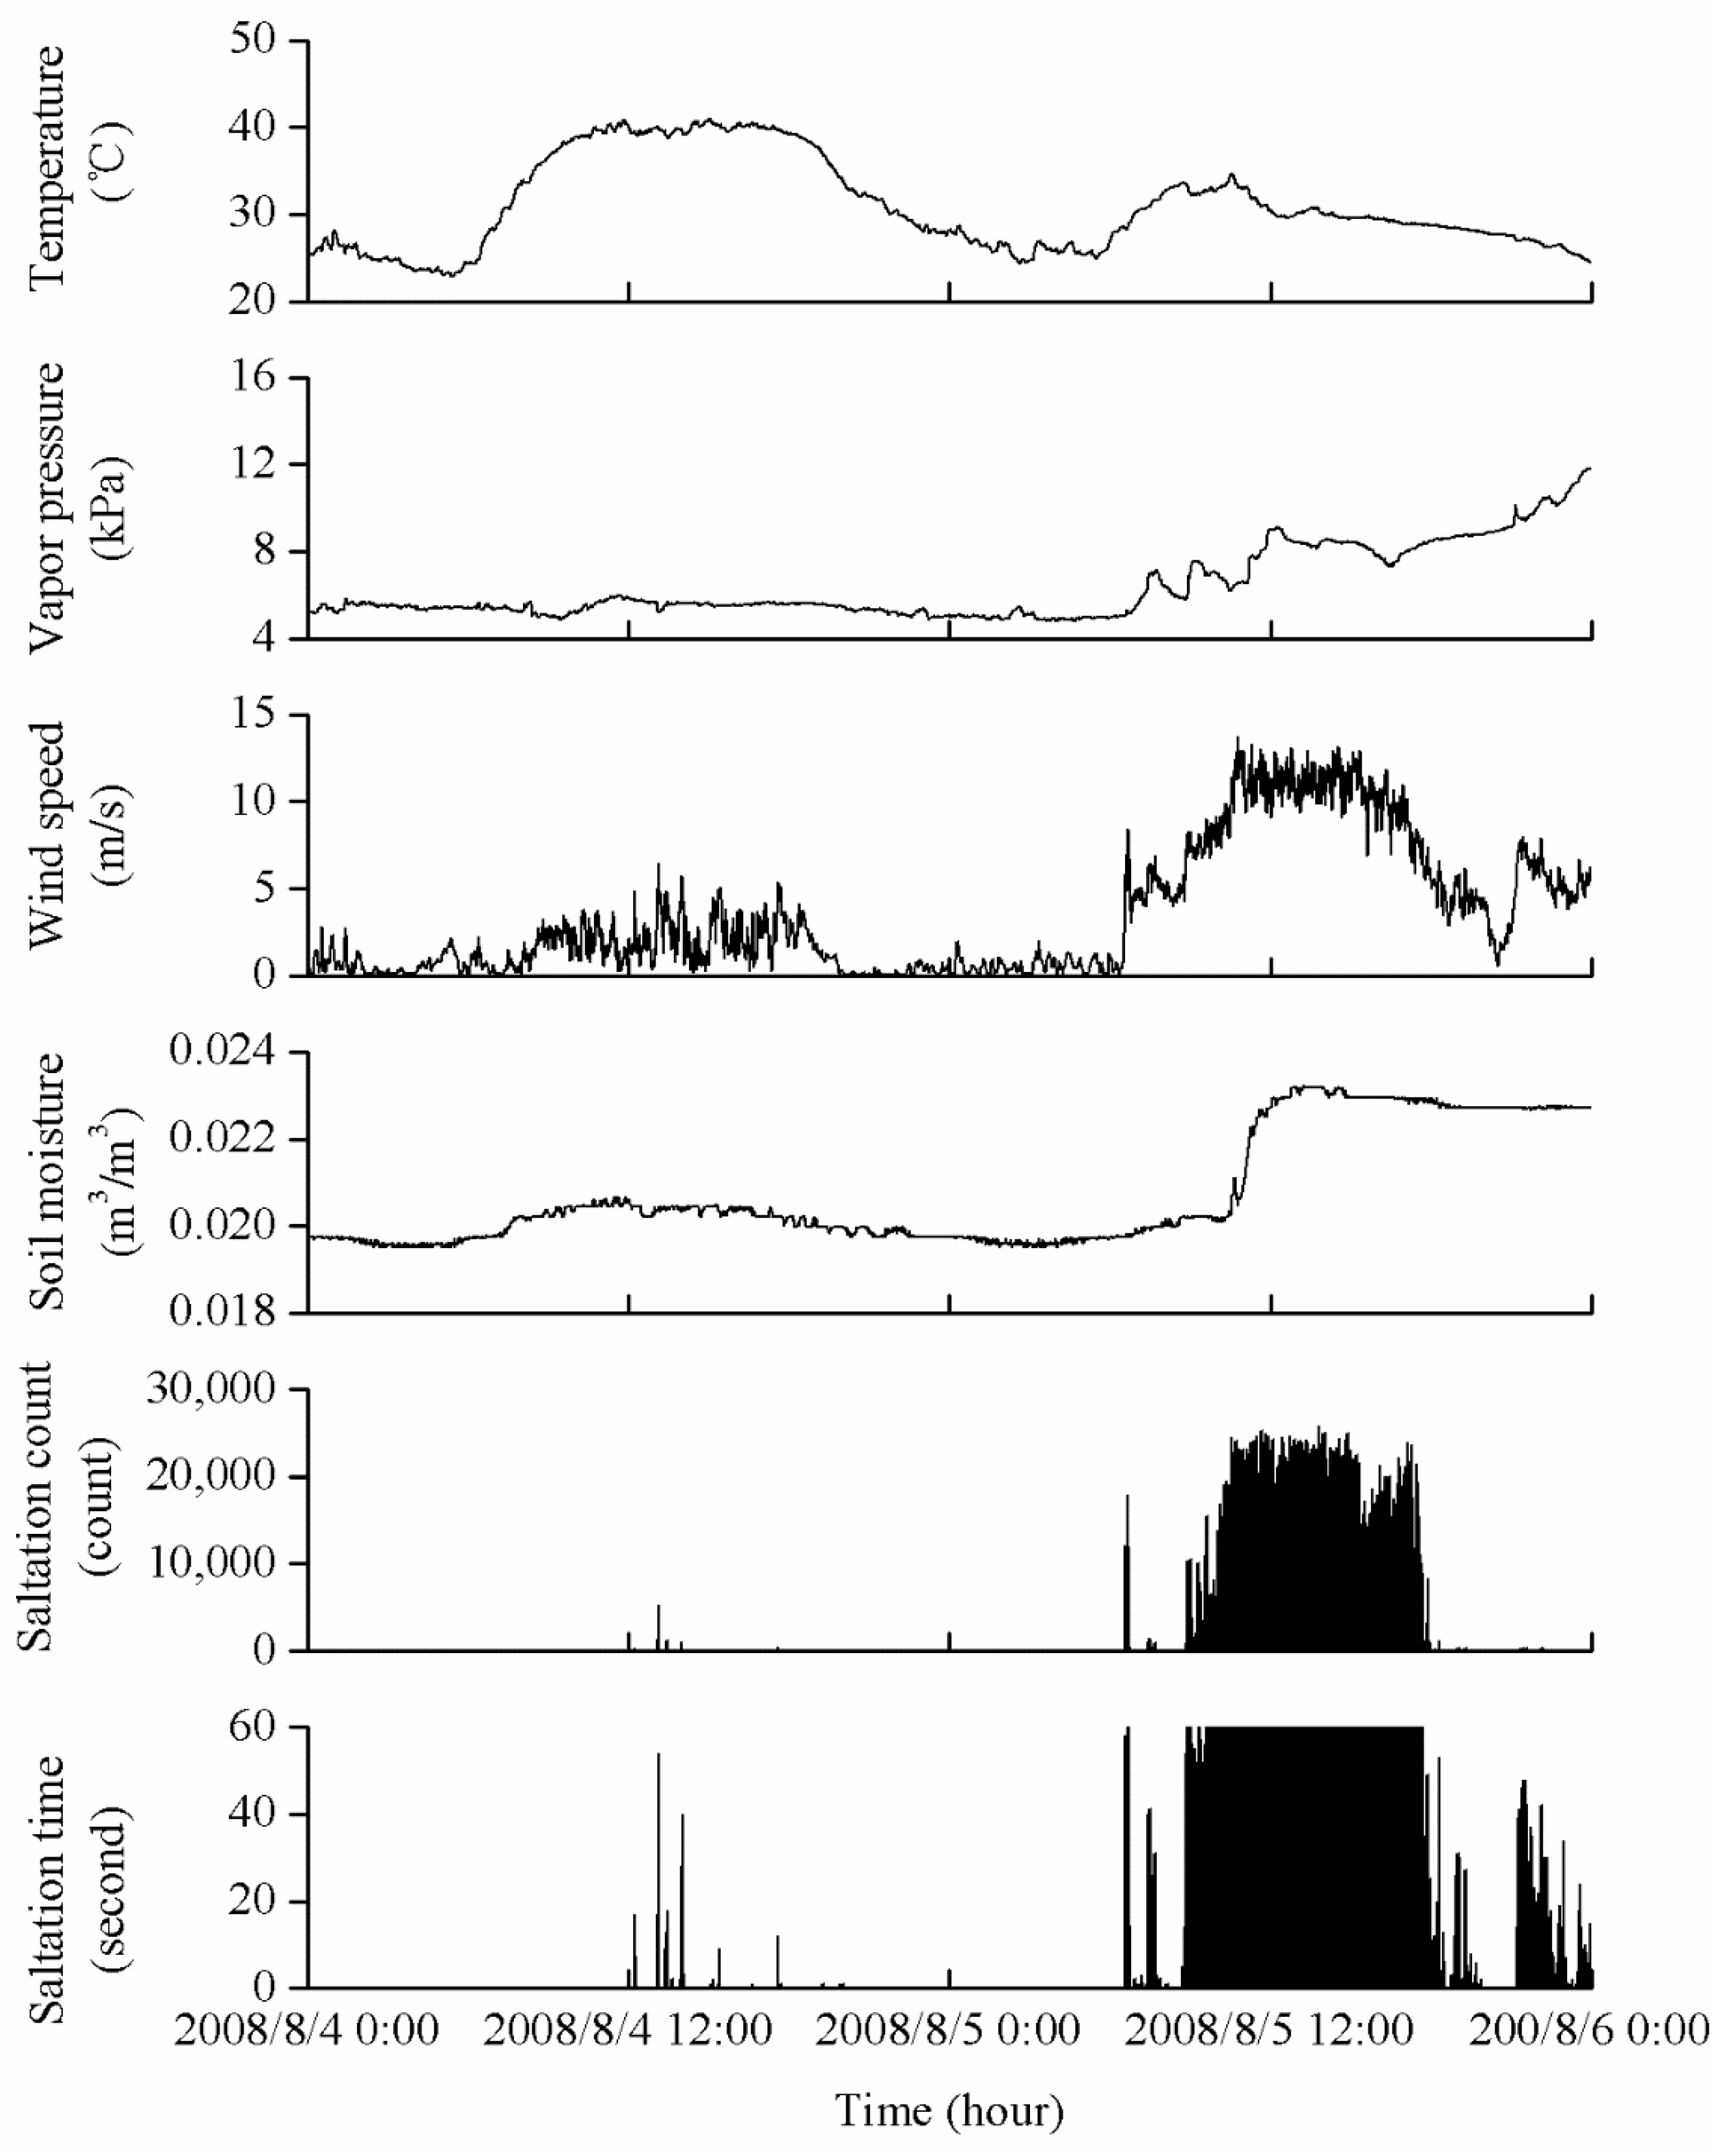
3.1. Daily Examples
3.2. Atmospheric and Soil Conditions on Non-Dust Days
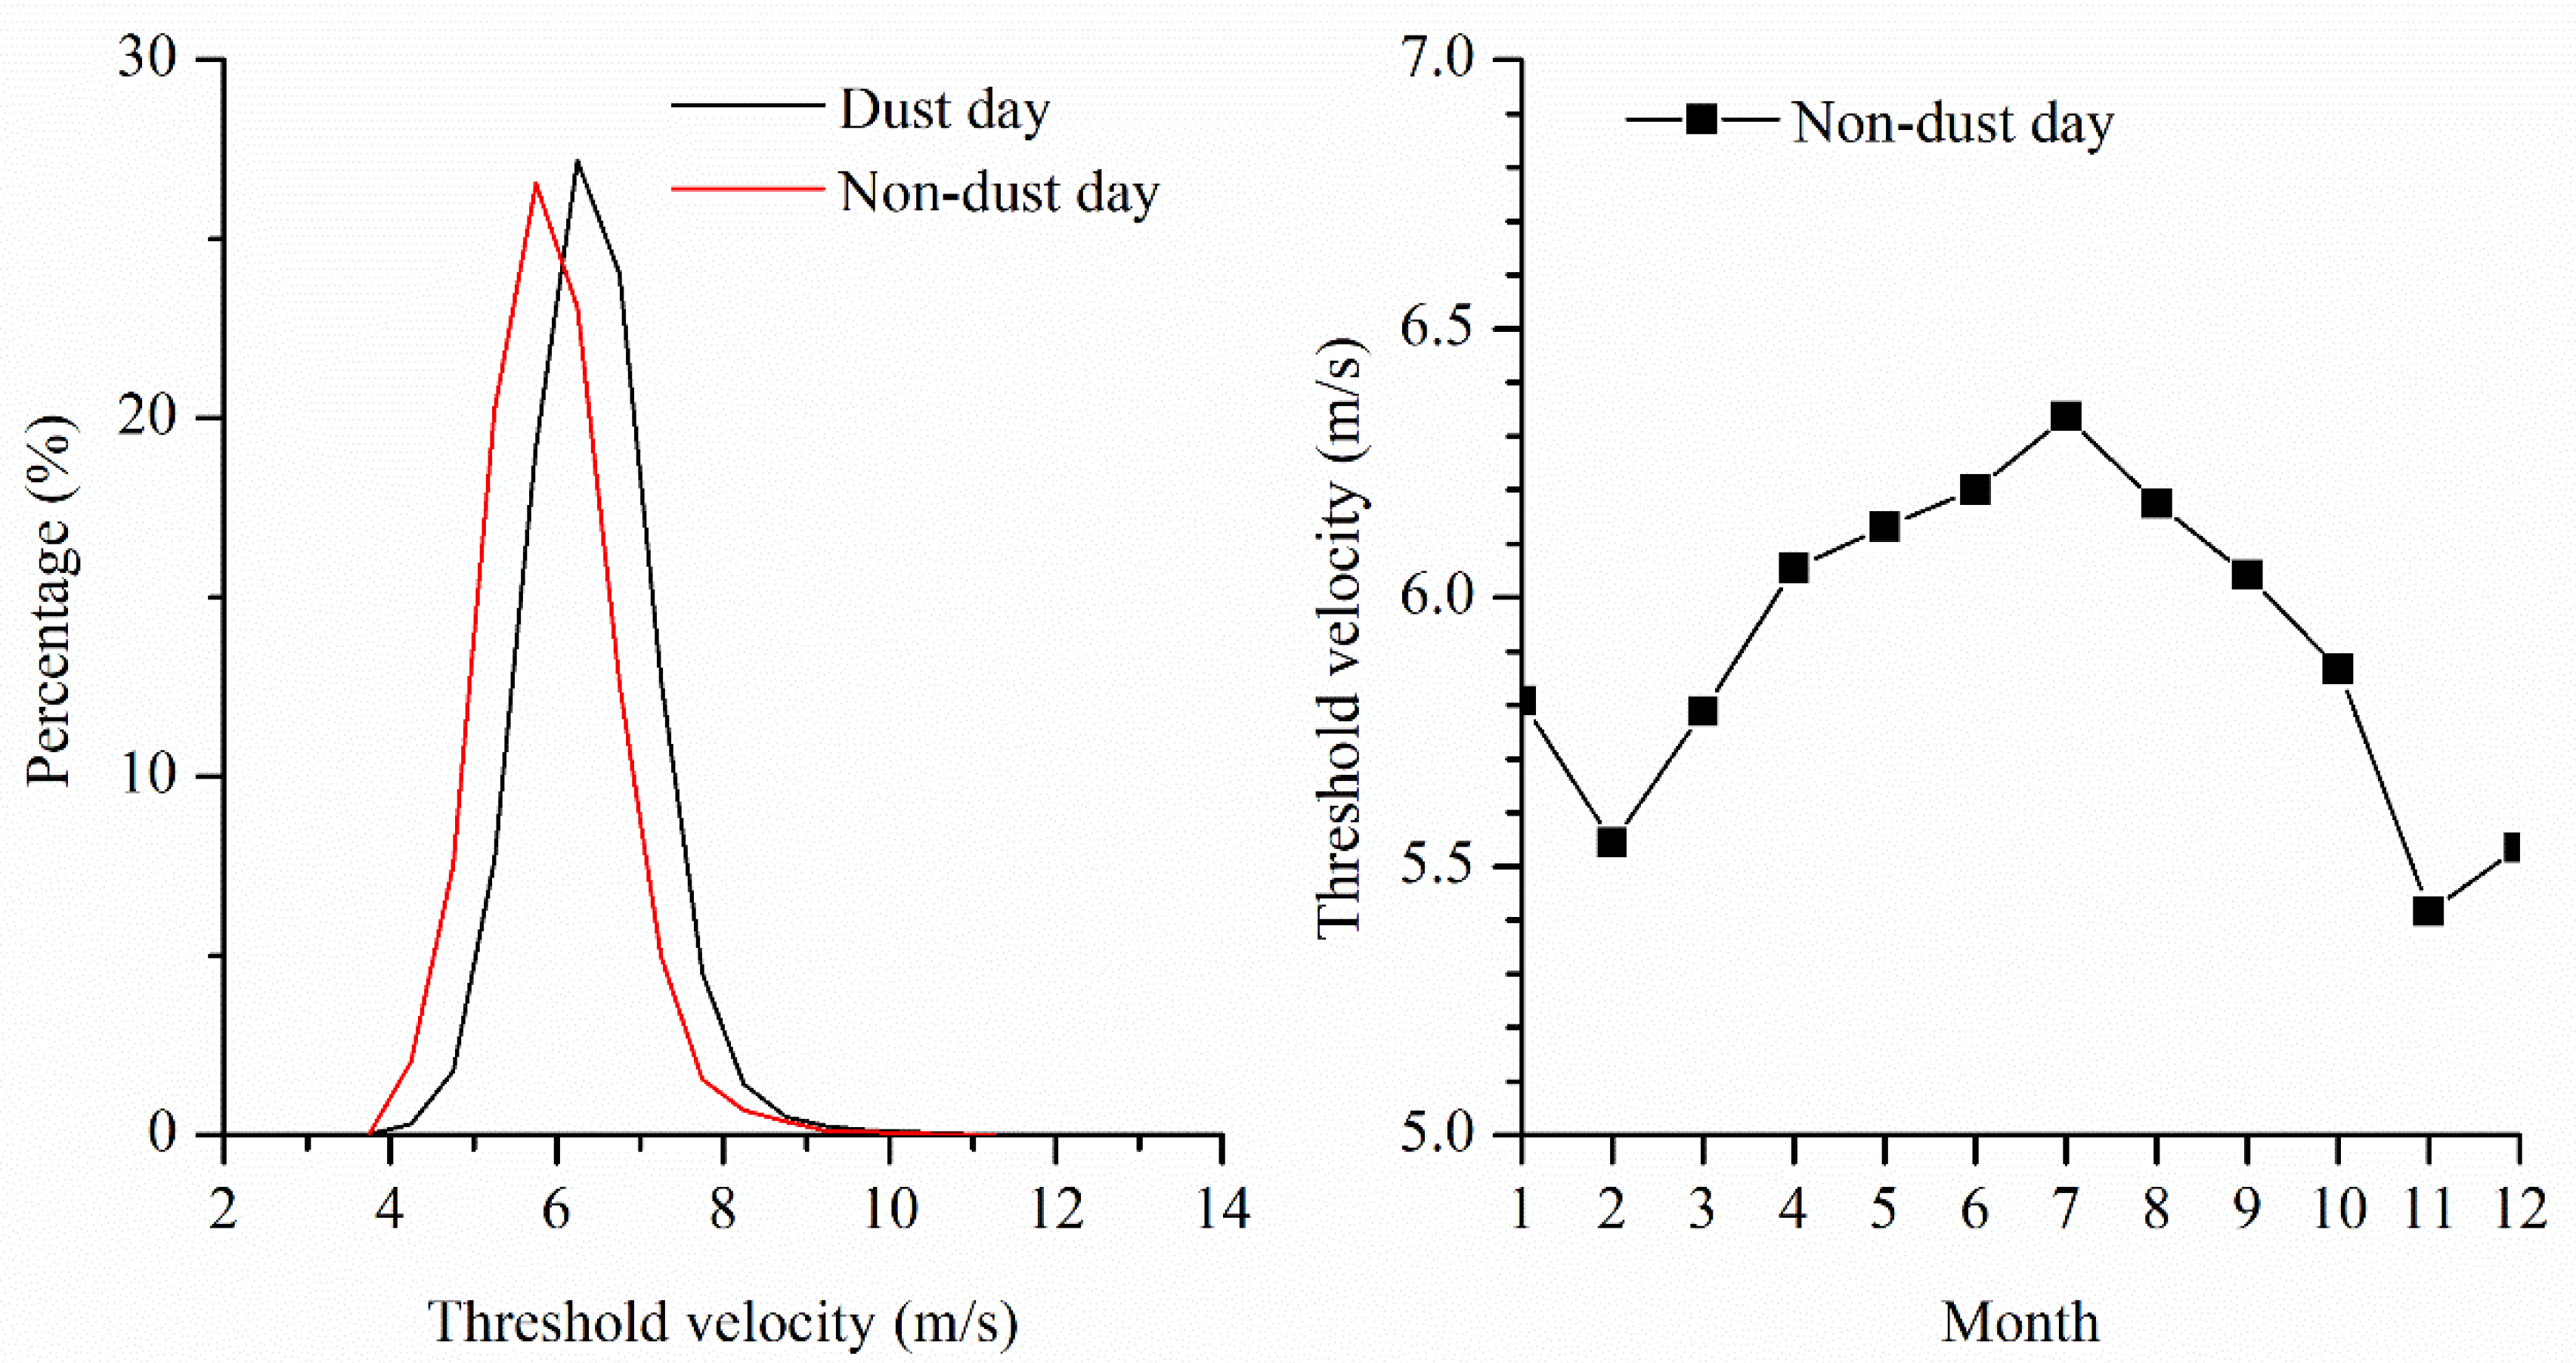
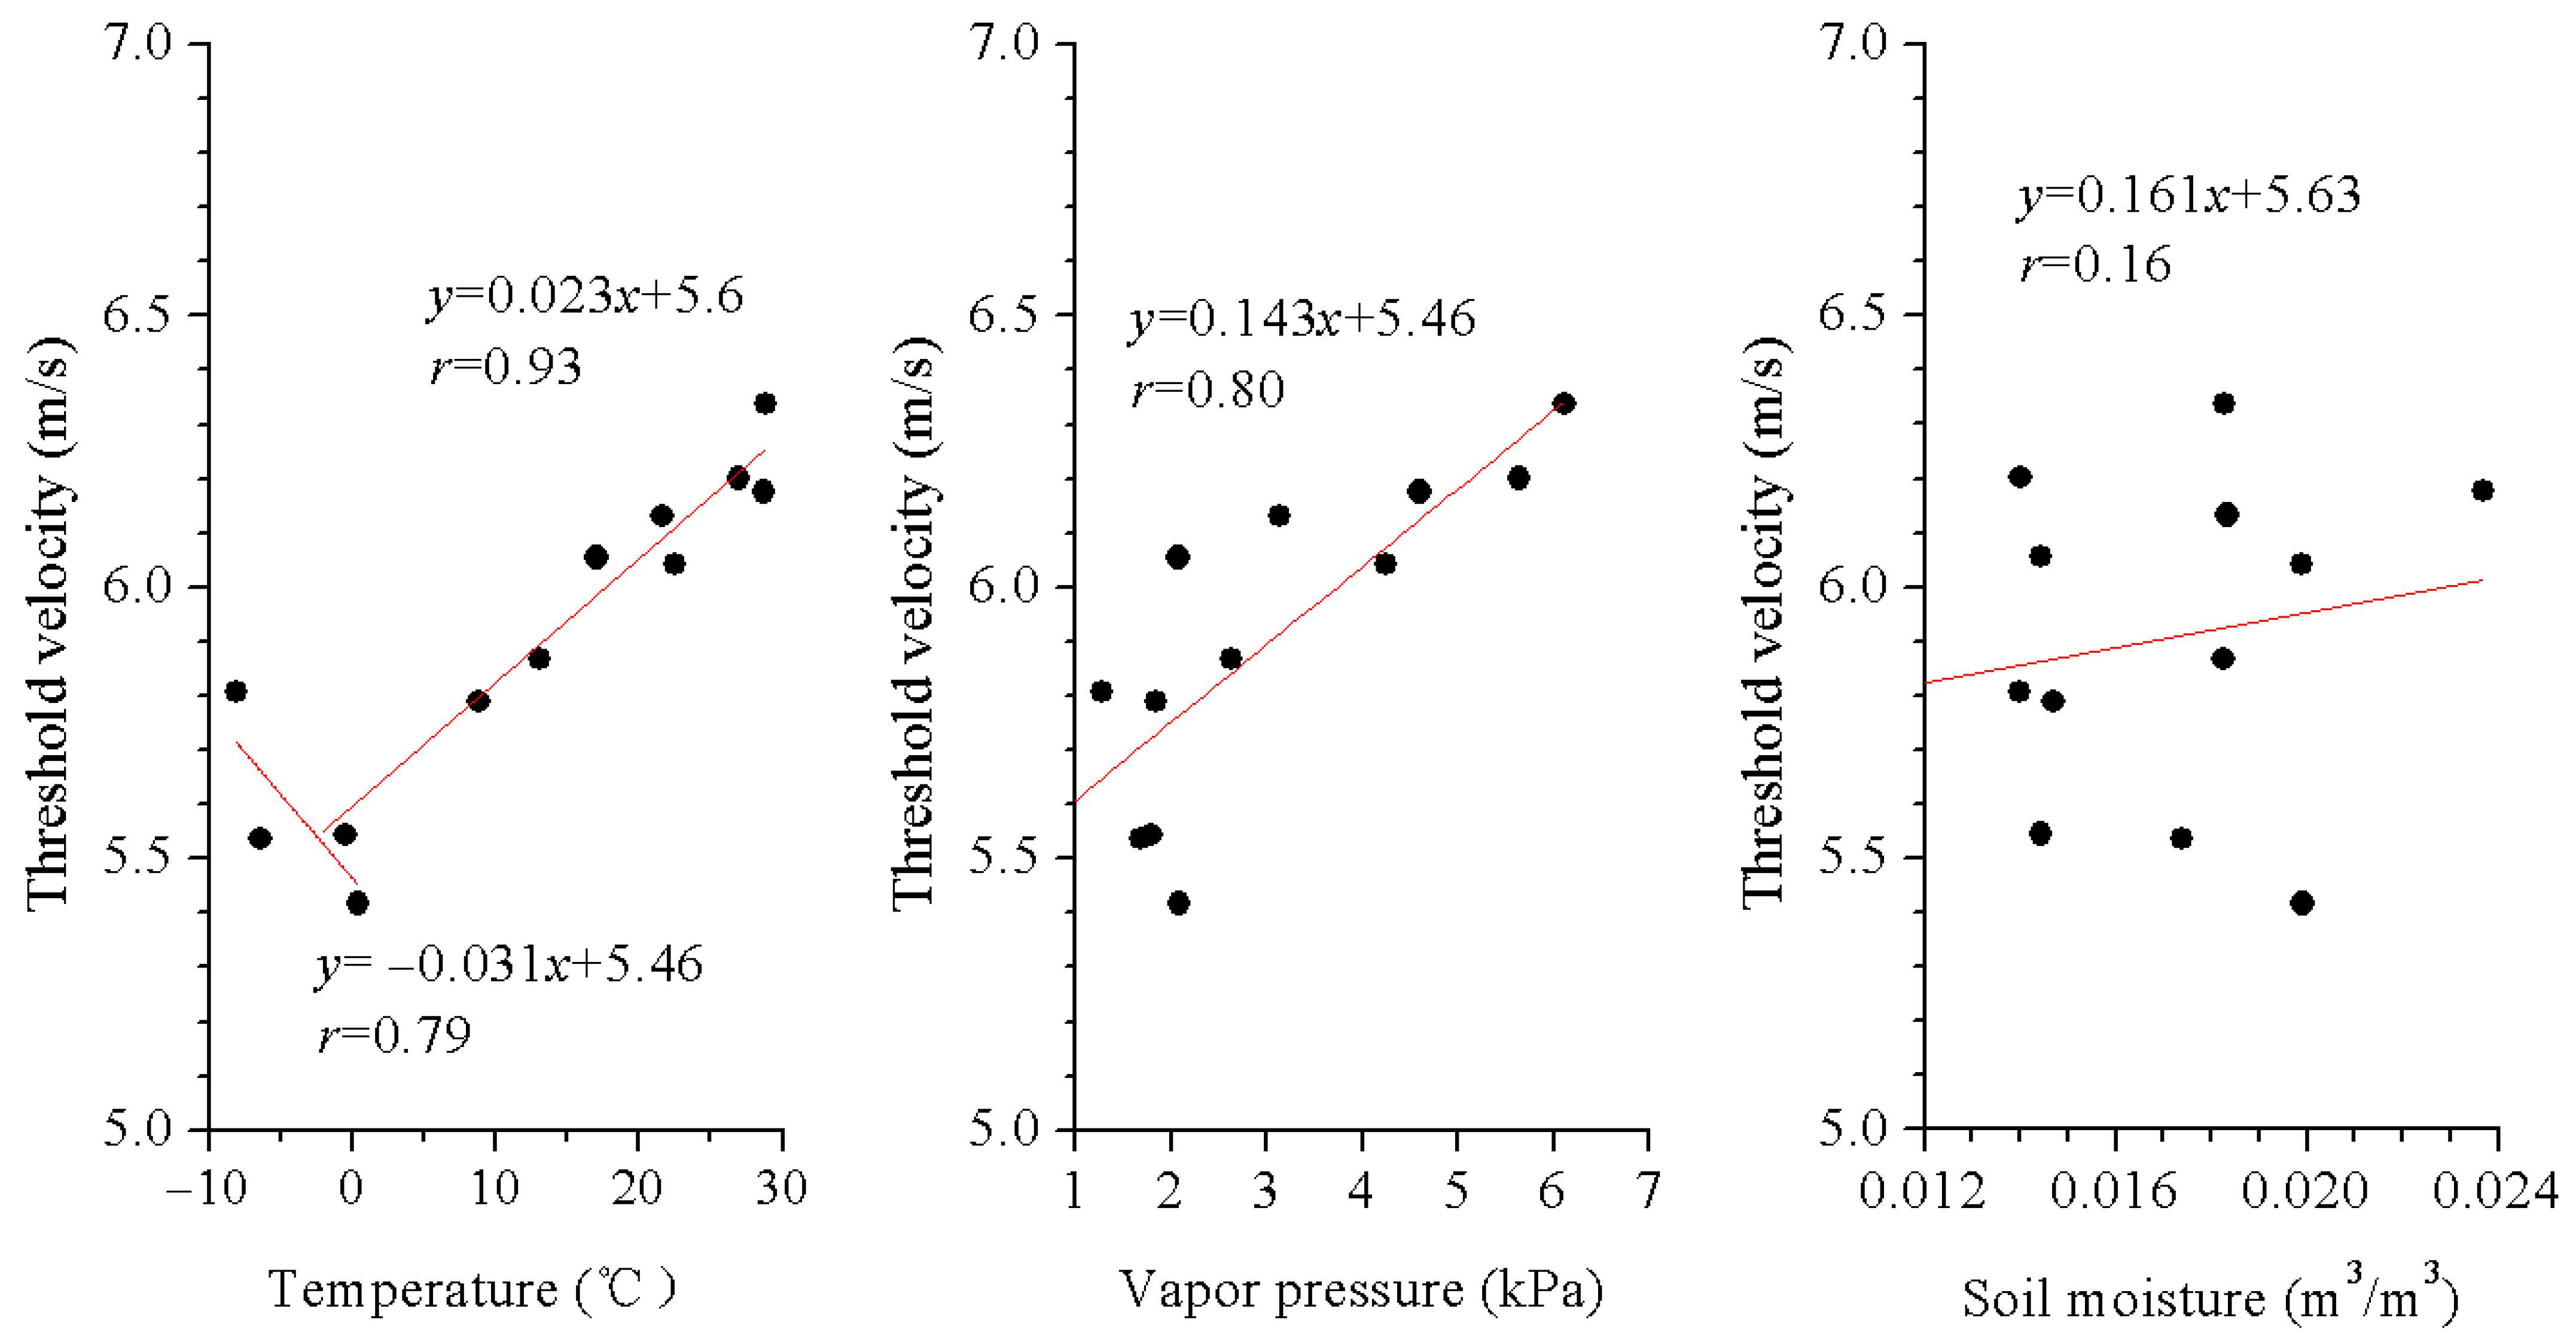
3.3. Threshold Velocity for Saltation Activity on Non-Dust Days
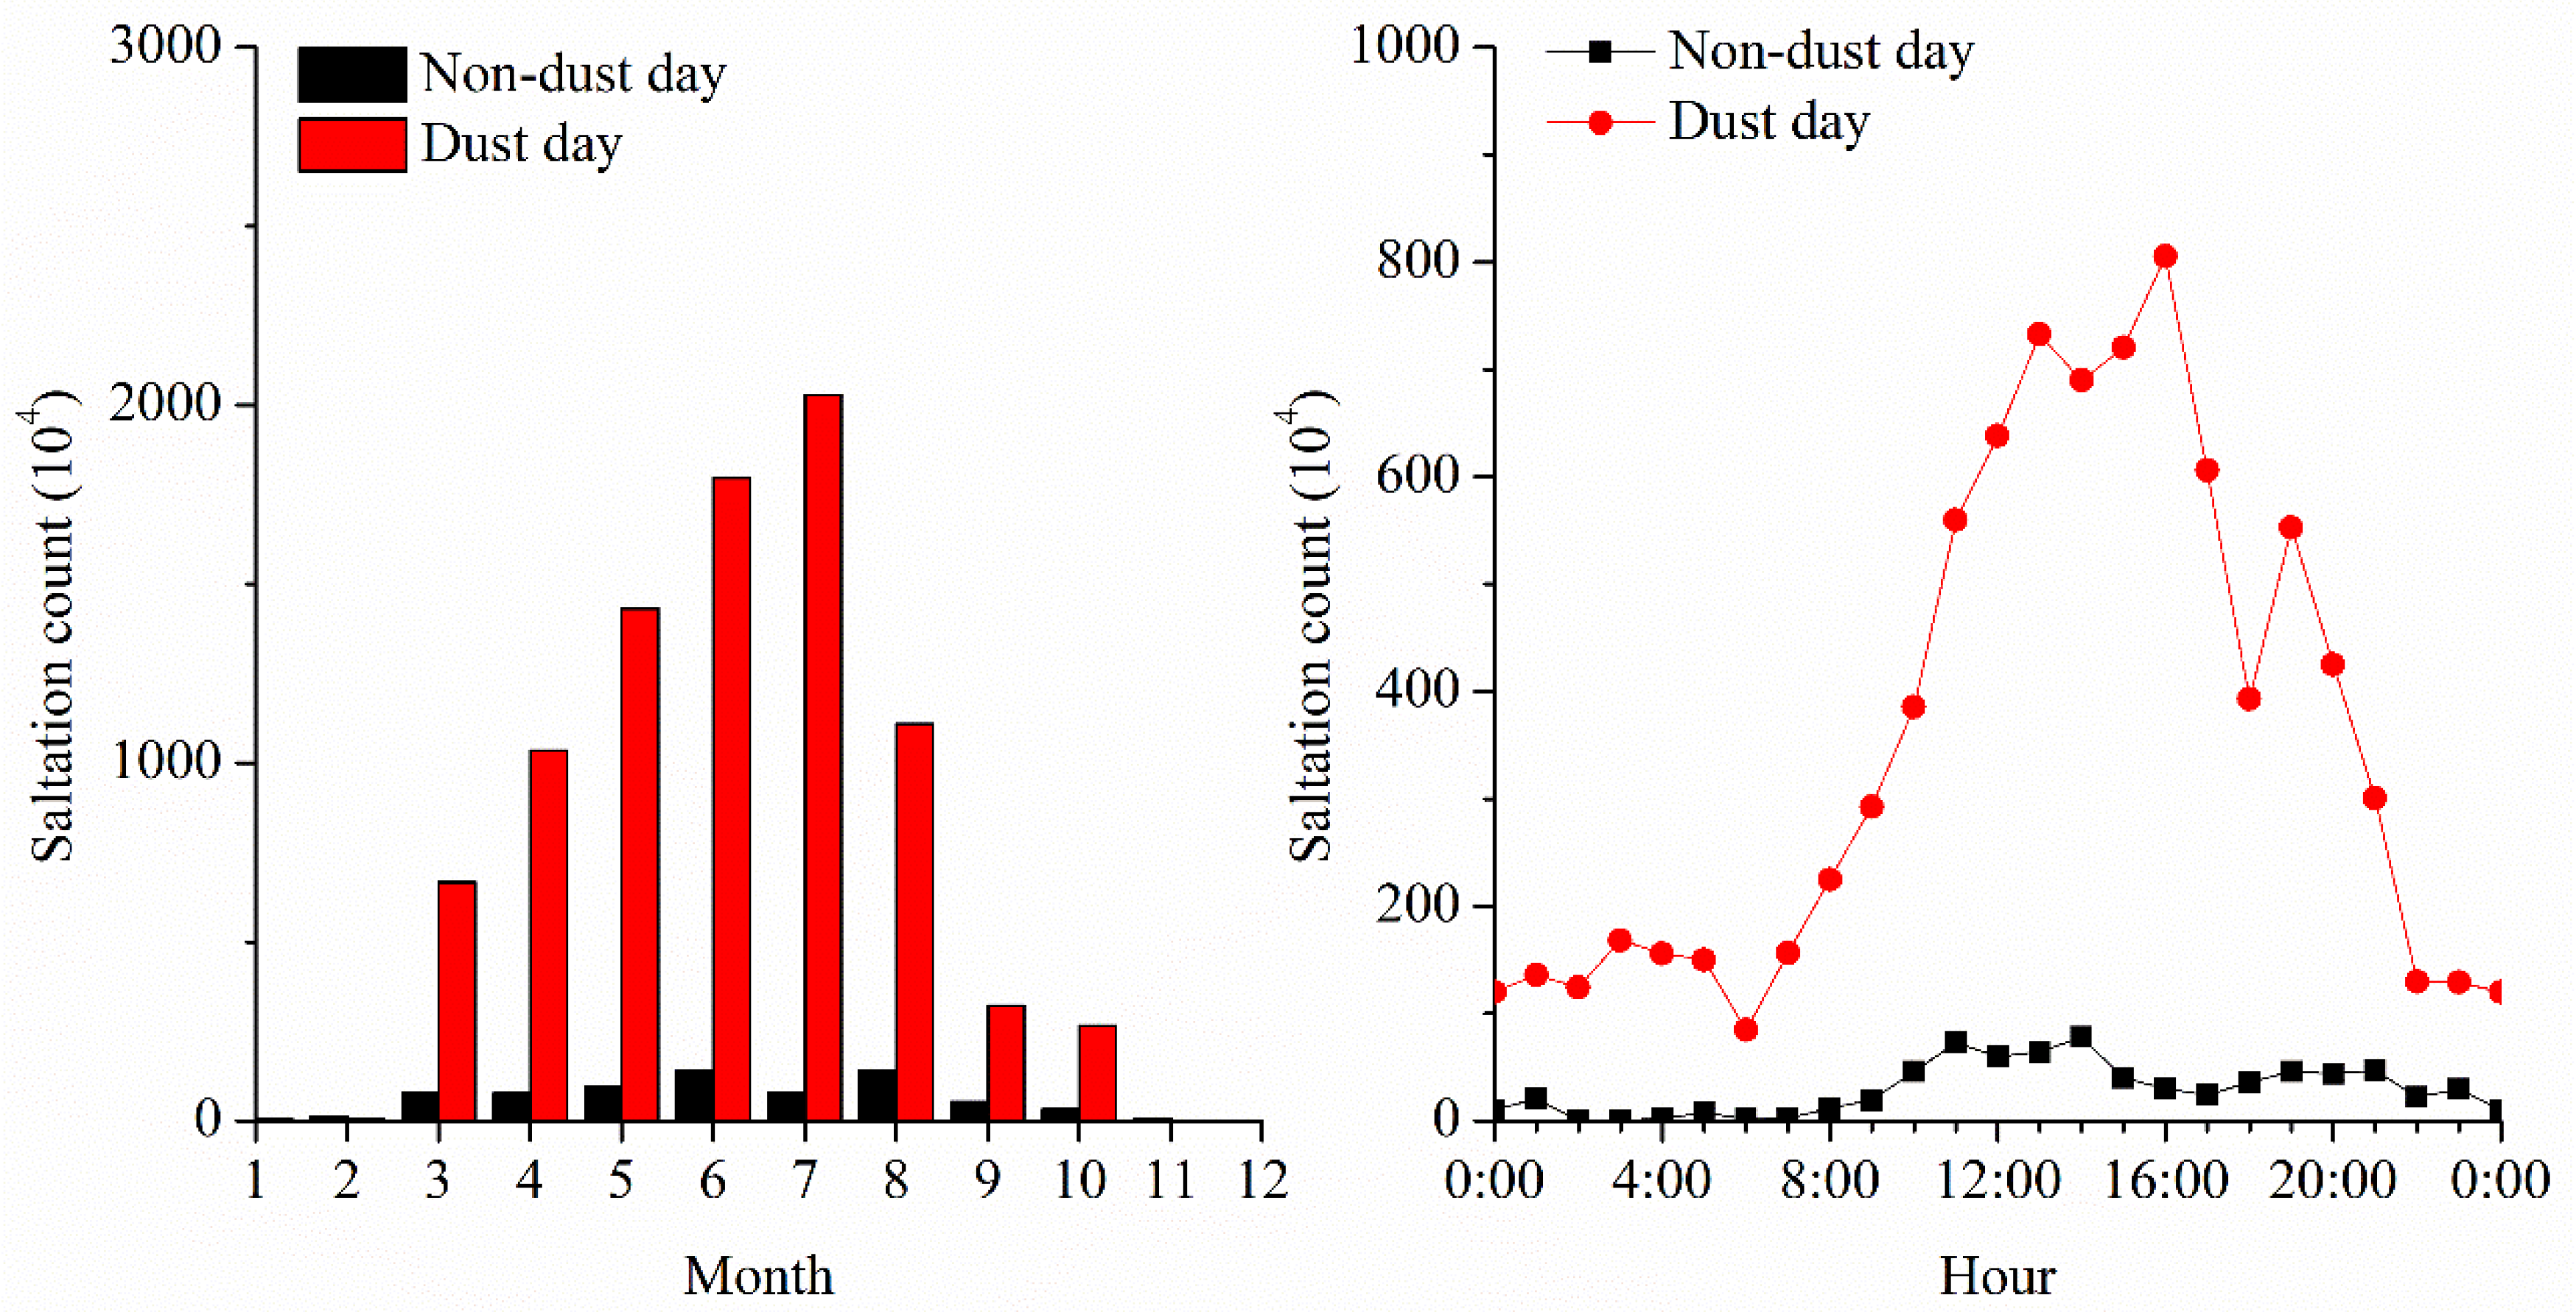
3.4. Saltation Time during Non-Dust Days
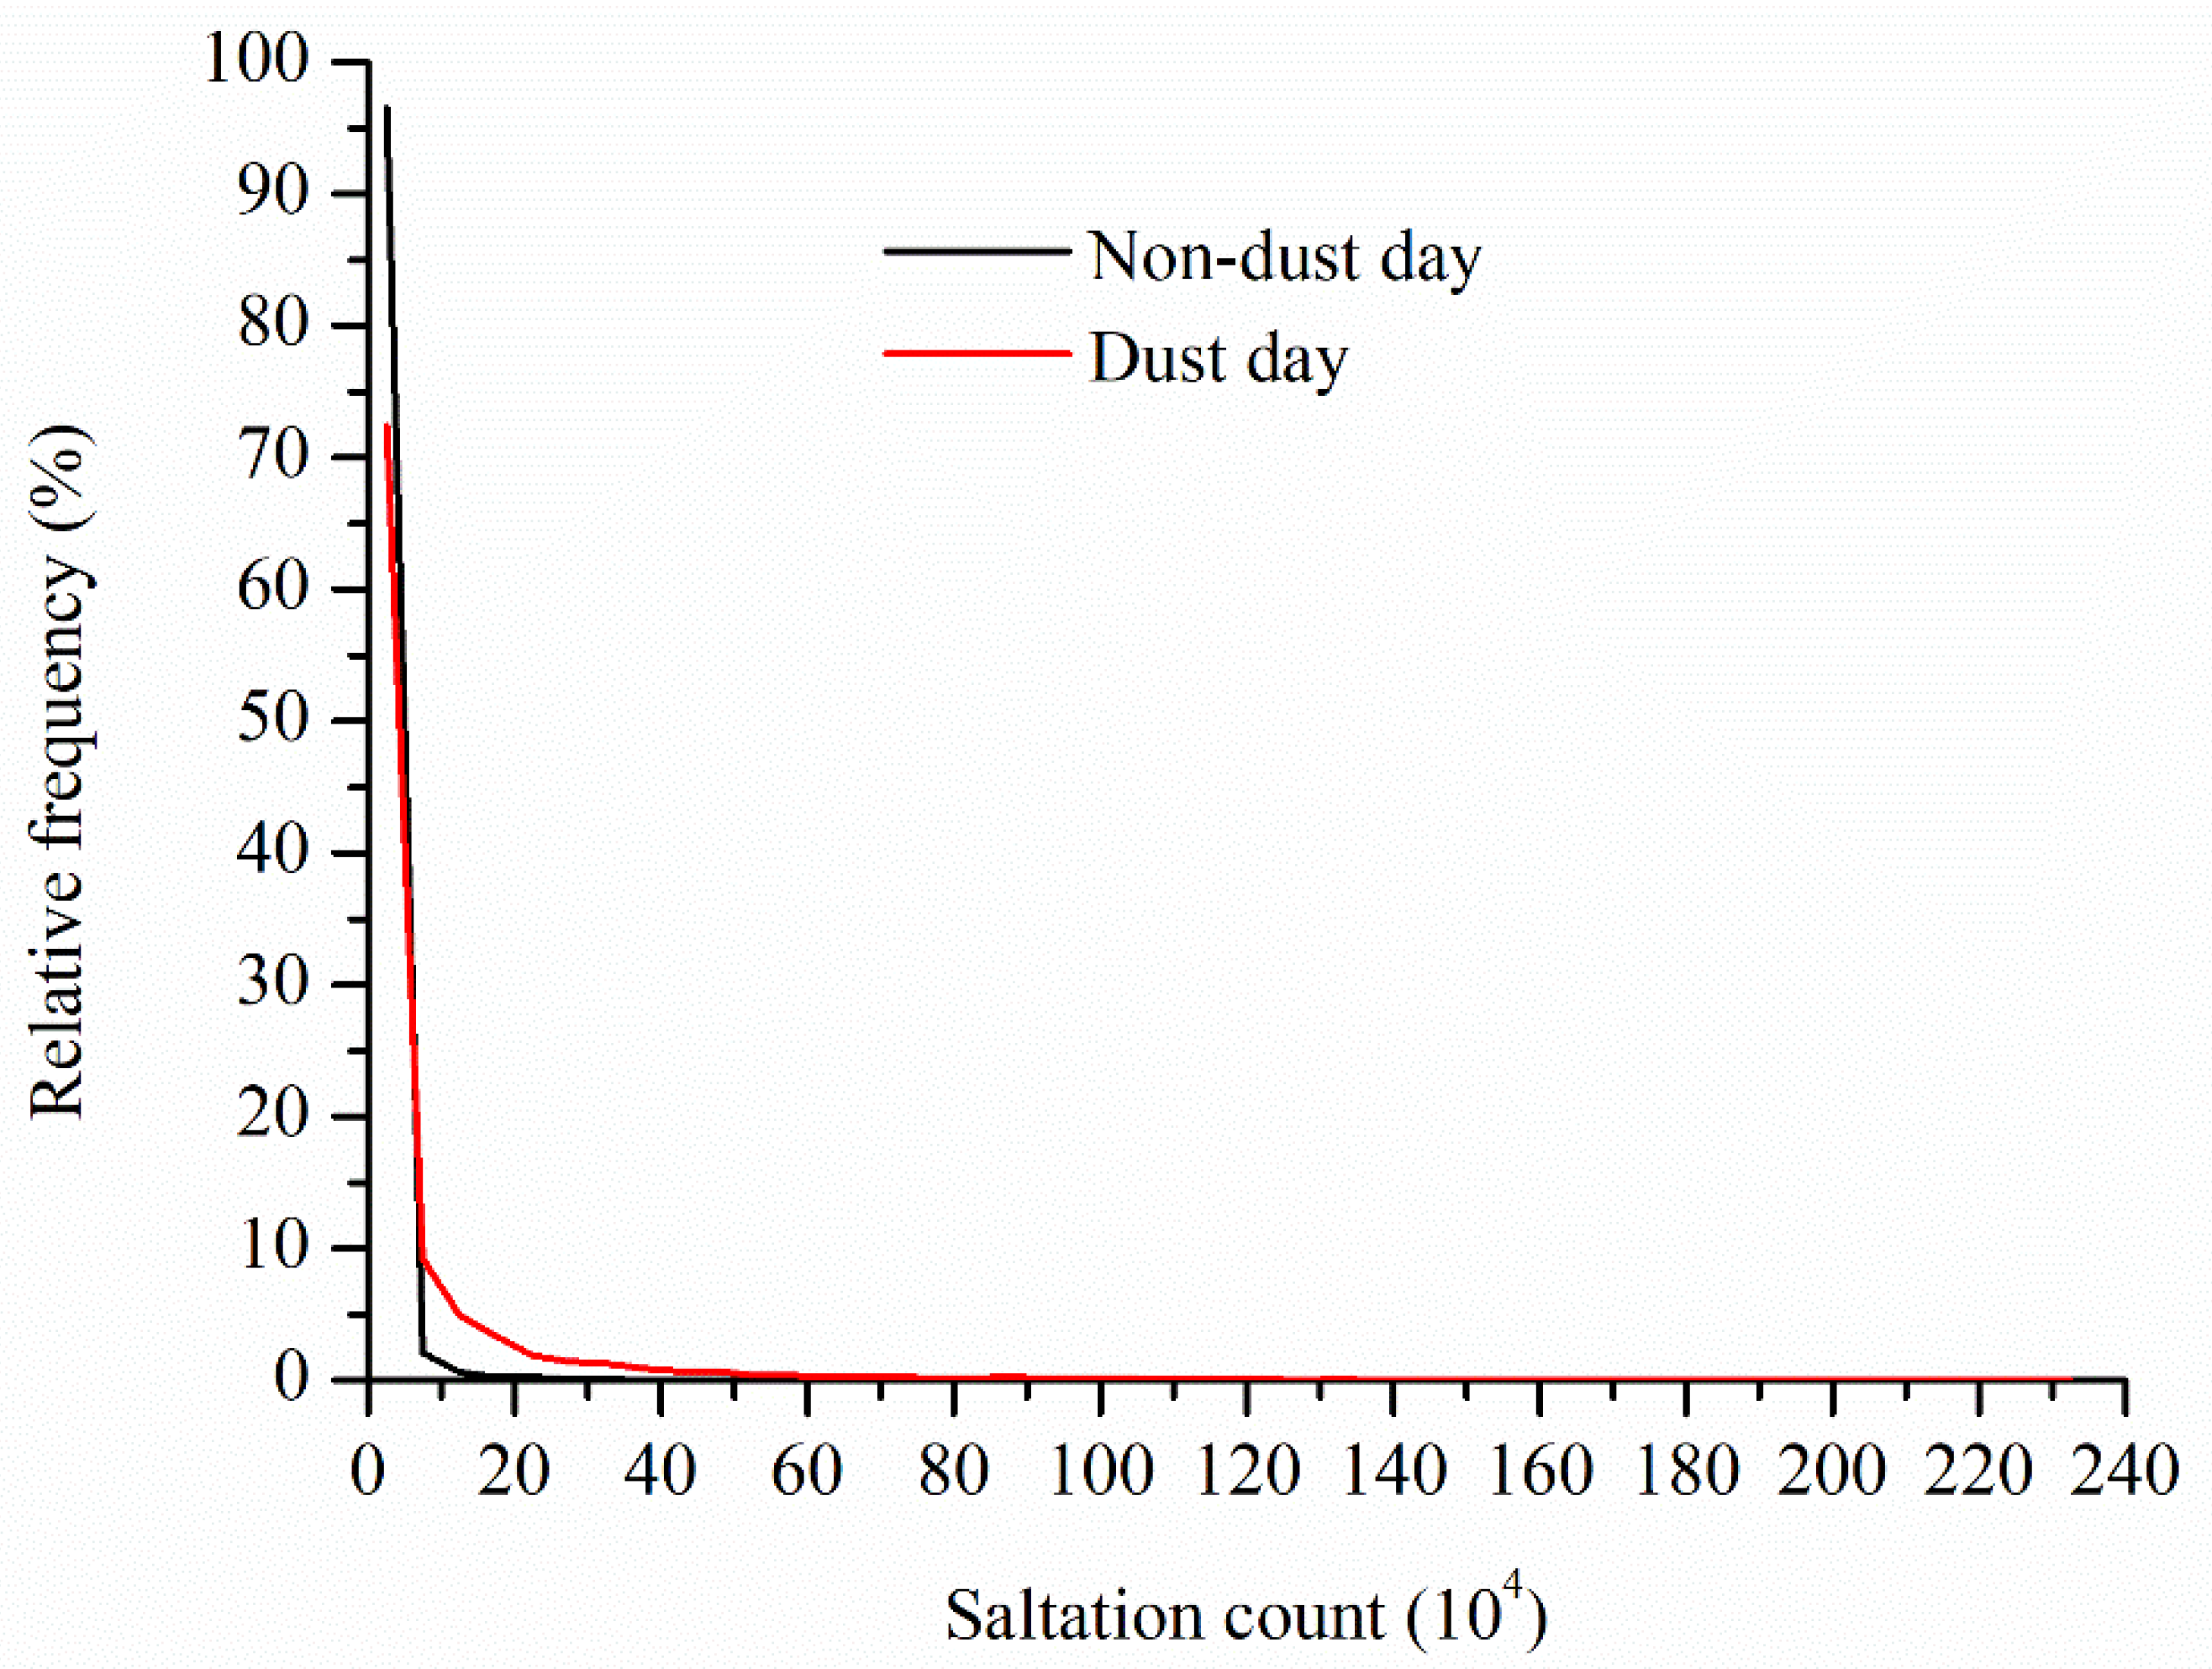
3.5. Saltation Count on Non-Dust Days
4. Discussions
4.1. Atmospheric/Soil Conditions and Threshold Velocities on Non-Dust Days
4.2. Wind Speed Conditions and Saltation Activity on Non-Dust Days
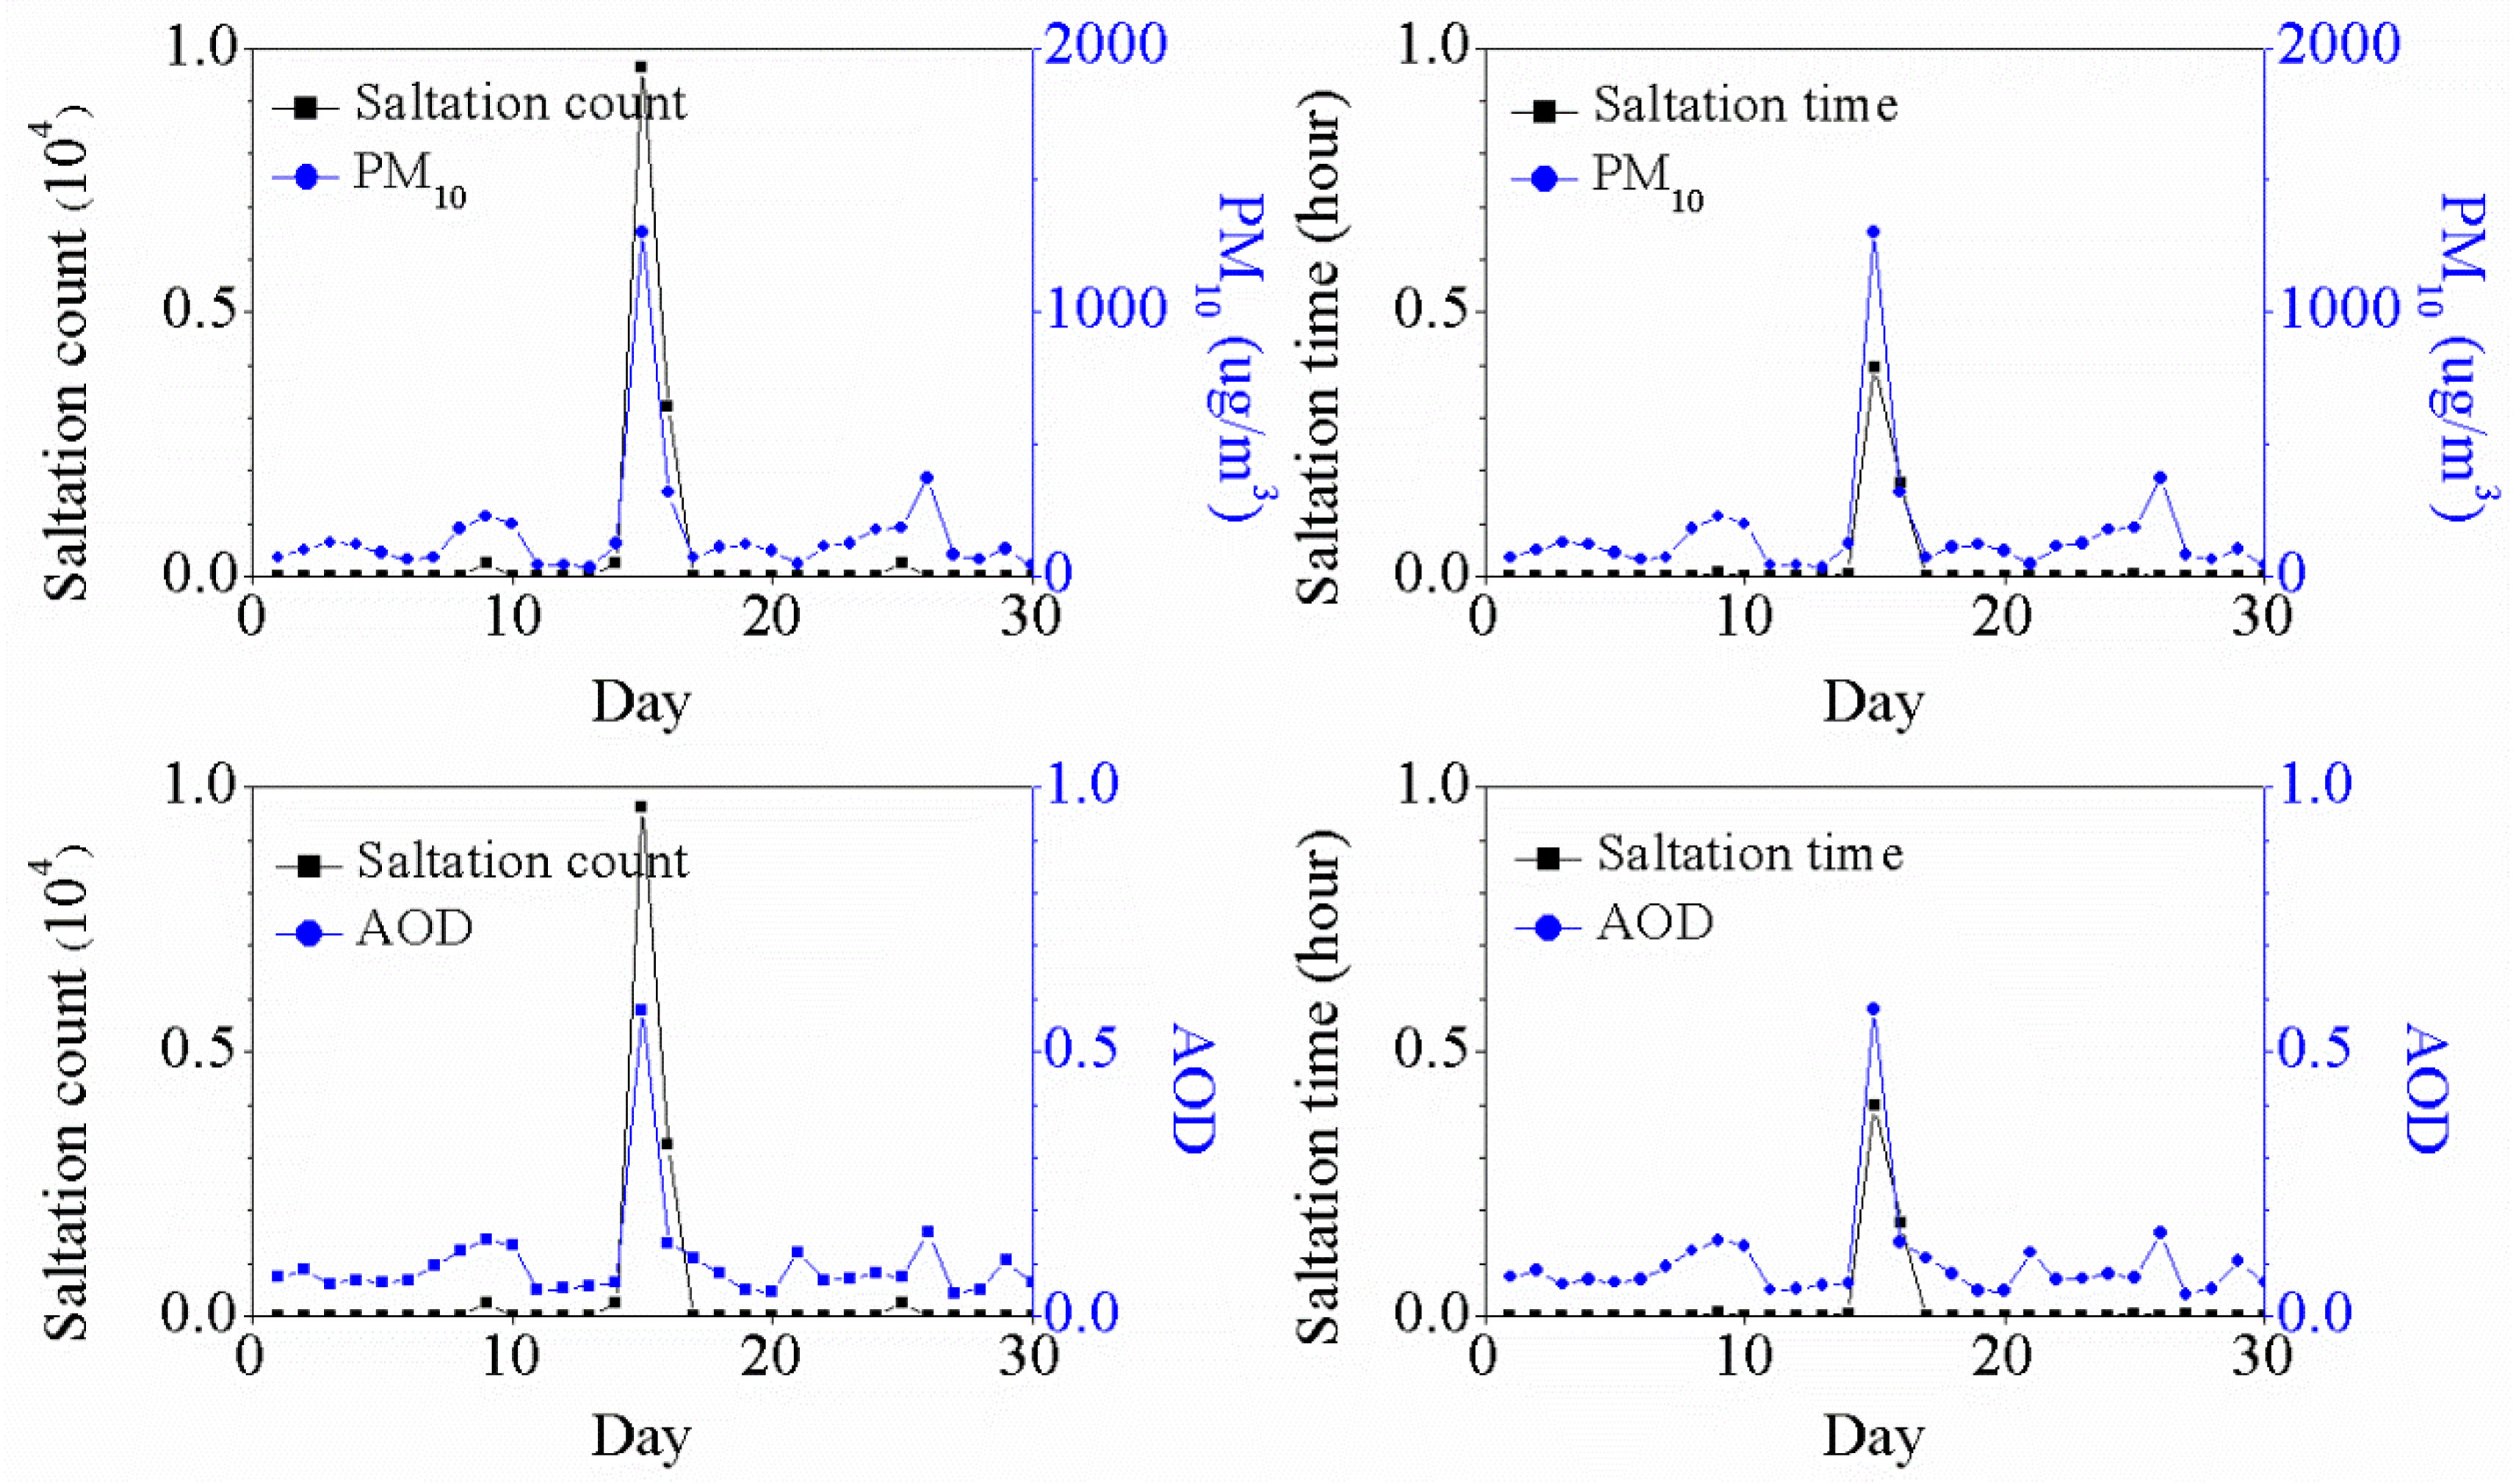
4.3. Saltation Activity and Dust Aerosols on Non-Dust Days
5. Conclusions
Author Contributions
Funding
Data Availability Statement
Acknowledgments
Conflicts of Interest
References
- Bagnold, R.A. The Physics of Blown Sand and Desert Dunes; William Morrow & Company: New York, NY, USA, 1941; pp. 1–26. [Google Scholar]
- Chepil, W.S. Dynamics of wind erosion: I. Nature of movement of soil by wind. Soil Sci. 1945, 60, 305–320. [Google Scholar] [CrossRef]
- Shao, Y.P. Physics and Modeling of Wind Erosion; Kluwer Academic Publishing: Dordrecht, The Netherlands, 2008; pp. 149–206. [Google Scholar]
- Nordstrom, K.F.; Hotta, S. Wind erosion from cropland in the USA: A review of problems, solutions and prospects. Geoderma 2004, 121, 157–167. [Google Scholar] [CrossRef]
- Lal, R. Soil degradation by erosion. Land Degrad. Dev. 2005, 12, 519–539. [Google Scholar] [CrossRef]
- Middleton, N.J. Desert dust hazards: A global review. Aeolian Res. 2017, 24, 53–63. [Google Scholar] [CrossRef]
- Du, H.Q.; Li, S.; Webb, N.P.; Zuo, X.A.; Liu, X.Y. Soil organic carbon (SOC) enrichment in aeolian sediments and SOC loss by dust emission in the desert steppe, China. Sci. Total Environ. 2021, 798, 149189. [Google Scholar] [CrossRef] [PubMed]
- Gillette, D.A. Fine particulate emissions due to wind erosion. Trans. ASAE 1977, 20, 890–897. [Google Scholar] [CrossRef]
- Gillette, D.A. Production of dust that may be carried great distances. Spec. Pap. Geol. Soc. Am. 1981, 186, 11–26. [Google Scholar]
- Shao, Y.P.; Raupach, M.R.; Findlater, P.A. The effect of saltation bombardment on the entrainment of dust by wind. J. Geophys. Res. 1993, 98, 12719–12726. [Google Scholar] [CrossRef] [Green Version]
- Mirzamostafa, N.; Hagen, L.J.; Stone, L.R.; Skidmore, E.L. Soil aggregate and texture effects on suspension components from wind erosion. Soil Sci. Soc. Am. J. 1998, 62, 1351–1361. [Google Scholar] [CrossRef]
- Shao, Y.P. A model for mineral dust emission. J. Geophys. Res. 2001, 106, 20239–20254. [Google Scholar] [CrossRef]
- Ju, T.T.; Li, X.L.; Zhang, H.S.; Cai, X.U.; Song, Y. Comparison of two different dust emission mechanisms over the Horqin Sandy Land area: Aerosols contribution and size distributions. Atmos. Environ. 2018, 176, 82–90. [Google Scholar] [CrossRef]
- Tatarko, J.; Kucharski, M.; Li, H.L.; Li, H.R. PM2.5 and PM10 emissions by breakage during saltation of agricultural soils. Soil Tillage Res. 2021, 208, 104902. [Google Scholar] [CrossRef]
- Goudie, A.S.; Middleton, N.J. Desert Dust in the Global System; Springer Verlag: Heidelberg, Germany, 2006; pp. 3–8. [Google Scholar]
- McTainsh, G.; Strong, C. The role of aeolian dust in ecosystems. Geomorphology 2007, 89, 39–54. [Google Scholar] [CrossRef]
- Gonzalez, M.C.; Teigell, P.N.; Valladares, B.; Griffin, G.W. The global dispersion of pathogenic microorganisms by dust storms and its relevance to agriculture. Adv. Agron. 2014, 127, 1–41. [Google Scholar]
- Goudie, A.S. Desert dust and human health disorders. Environ. Int. 2014, 63, 101–113. [Google Scholar] [CrossRef]
- Carmen, C.J.; Michael, S.; Maria, A.L.C.; Albert, A.; Adolfo, C.; Maria, P.Z.; Alejandro, R.G.; Constantino, M.P. Aerosol radiative impact during the summer 2019 heatwave produced partly by an inter-continental Saharan dust outbreak Part 1: Short-wave dust direct radiative effect. Atmos. Chem. Phys. 2021, 21, 6455–6479. [Google Scholar]
- Owen, R.P. Saltation of uniform grains in air. J. Fluid Mech. 1964, 20, 225–242. [Google Scholar] [CrossRef]
- White, B.R. Soil transport by winds on Mars. J. Geophys. Res.-Atmos. 1979, 84, 4643–4651. [Google Scholar] [CrossRef]
- Dong, Z.B.; Qian, G.Q.; Luo, W.Y.; Wang, H.T. Analysis of the mass flux profiles of an aeolian saltating cloud. J. Geophys. Res.-Atmos. 2006, 111, D16111. [Google Scholar] [CrossRef] [Green Version]
- Stockton, P.; Gillette, D. Field measurement of the sheltering effect of vegetation on erodible land surfaces. Land Degrad. Dev. 1990, 2, 77–85. [Google Scholar] [CrossRef]
- Stout, J.E.; Zobeck, T.M. Intermittent saltation. Sedimentology 1997, 44, 959–970. [Google Scholar] [CrossRef] [Green Version]
- Baas, A.C. Evaluation of saltation flux impact responders (Safires) for measuring instantaneous aeolian sand transport intensity. Geomorphology 2004, 59, 99–118. [Google Scholar] [CrossRef]
- Udo, K. New method for estimation of aeolian sand transport rate using ceramic sand flux sensor (UD-101). Sensors 2009, 9, 9058–9072. [Google Scholar] [CrossRef] [PubMed] [Green Version]
- Sherman, D.J.; Li, B.; Farrell, E.J.; Ellis, J.T.; Cox, W.D.; Maia, L.P.; Sousa, P.H. Measuring aeolian saltation: A comparison of sensors. J. Coast. Res. 2011, 59, 280–290. [Google Scholar] [CrossRef]
- Raygosa-Barahona, R.; Ruiz-Martinez, G.; Marino-Tapia, I.; Heyser-Ojeda, E. Design and initial testing of a piezoelectric sensor to quantify aeolian sand transport. Aeolian Res. 2016, 22, 127–134. [Google Scholar] [CrossRef]
- De Winter, W.; Van Dam, D.; Delbecque, N.; Verdoodt, A.; Ruessink, B.; Sterk, G. Measuring high spatiotemporal variability in saltation intensity using a low-cost Saltation Detection System: Wind tunnel and field experiments. Aeolian Res. 2018, 31, 72–81. [Google Scholar] [CrossRef]
- Spaan, W.; Vanden Abeele, G. Wind borne particle measurements with acoustic sensors. Soil Technol. 1991, 4, 51–63. [Google Scholar] [CrossRef]
- Ellis, J.T.; Sherman, D.J.; Farrell, E.J.; Li, B. Temporal and spatial variability of aeolian sand transport: Implications for field measurements. Aeolian Res. 2012, 3, 379–387. [Google Scholar] [CrossRef]
- Rezaei, M.; Goossens, D.; Riksen, M.J. Evaluating the SandFlow, an acoustic sediment transport sensor. Aeolian Res. 2020, 42, 100558. [Google Scholar] [CrossRef]
- Mikami, M.; Yamada, Y.; Ishizuka, M.; Ishimaru, T.; Gao, W.; Zeng, F.J. Measurement of saltation process over gobi and sand dunes in the Taklimakan desert, China, with newly developed sand particle counter. J. Geophys. Res.-Atmos. 2005, 110, D18S02. [Google Scholar] [CrossRef] [Green Version]
- Davidson-Arnott, R.; Bauer, B.; Walker, I.; Hesp, P.; Ollerhead, J.; Delgado-Fernandez, I. Instantaneous and mean aeolian sediment transport rate on beaches: An intercomparison of measurements from two sensor types. J. Coast. Res. 2009, 56, 297–301. [Google Scholar]
- Hugenholtz, C.H.; Barchyn, T.E. Laboratory and field performance of a laser particle counter for measuring aeolian sand transport. J. Geophys. Res.-Atmos. 2011, 116, F01010. [Google Scholar] [CrossRef] [Green Version]
- Chapman, C.; Walker, I.J.; Hesp, P.A.; Bauer, B.O.; Davidson-Arnott, R.G.; Ollerhead, J. Reynolds stress and sand transport over a foredune. Earth Surf. Processes Landf. 2013, 38, 1735–1747. [Google Scholar] [CrossRef]
- Martin, R.L.; Kok, J.F.; Hugenholtz, C.H.; Barchyn, T.E.; Chamecki, M.; Ellis, J.T. High-frequency measurements of aeolian saltation flux: Field-based methodology and applications. Aeolian Res. 2018, 30, 97–114. [Google Scholar] [CrossRef] [Green Version]
- Li, B.L.; Ning, Q.Q.; Yu, Y.S.; Ma, J.Y.; Meldaua, L.F.; Liu, J.H. A laser sheet sensor (LASS) for wind-blown sand flux measurement. Aeolian Res. 2021, 50, 100681. [Google Scholar] [CrossRef]
- Tan, L.H.; An, Z.S.; Zhang, K.C.; Qu, J.J.; Han, Q.J.; Wang, J.Z. Intermittent aeolian saltation over a Gobi surface: Threshold, saltation layer height, and high-frequency variability. J. Geophys. Res.-Eaerth Surf. 2020, 125, e2019JF005329. [Google Scholar] [CrossRef]
- Li, X.L.; Zhang, H.S. Soil moisture effects on sand saltation and dust emission observed over the Horqin Sandy land area in China. J. Meteorol. Res. 2014, 28, 444–452. [Google Scholar] [CrossRef]
- Deoro, L.A.; Buschiazzo, D.E. Threshold wind velocity as an index of soil susceptibility to wind erosion under variable climatic conditions. Land Degrad. Dev. 2009, 20, 14–21. [Google Scholar] [CrossRef]
- Barchyn, T.E.; Hugenholtz, C.H. Winter variability of aeolian sediment transport threshold on a cold-climate dune. Geomorphology 2012, 177–178, 38–50. [Google Scholar] [CrossRef]
- Yang, X.H.; Mamtimin, A.; He, Q.; Liu, X.C.; Huo, W. Observation of saltation activity at Tazhong area in Taklimakan Desert, China. J. Arid. Land 2013, 5, 32–41. [Google Scholar] [CrossRef] [Green Version]
- Stout, J.E. Detecting patterns of aeolian transport direction. J. Arid. Environ. 2014, 107, 18–25. [Google Scholar] [CrossRef] [Green Version]
- Yang, X.H.; Shen, S.H.; Yang, F.; He, Q.; Mamtimin, A.; Huo, W.; Liu, X.C. Spatial and temporal variations of blowing dust events in the Taklimakan Desert. Theor. Appl. Climatol. 2016, 125, 669–677. [Google Scholar] [CrossRef]
- Sensit Company. Technical Description for the New Model H11-LIN; Sensit Company: Readlands, CA, USA, 2007; pp. 13–14. [Google Scholar]
- Yang, X.H.; He, Q.; Mamtimin, A.; Huo, W.; Liu, X.H.; Trake, M. A field experiment on dust emission by wind erosion in the Taklimakan Desert. Acta Meteorol. Sin. 2012, 26, 241–249. [Google Scholar] [CrossRef]
- National Weather Bureau of China. Criterion of Surface Meteorological Observation; Meteorological Press: Beijing, China, 1979; pp. 33–34.
- Stout, J.E. A method for establishing the critical threshold for aeolian transport in the field. Earth Surf. Processes Landf. 2004, 29, 1195–1207. [Google Scholar] [CrossRef]
- Yang, X.H.; He, Q.; Mamtimin, A.; Yang, F.; Huo, W.; Liu, X.C.; Zhao, T.L.; Shen, S.H. Threshold velocity for saltation activity in the Taklimakan Desert. Pure Appl. Geophys. 2017, 174, 4459–4470. [Google Scholar] [CrossRef]
- Liu, B.L.; Wang, Z.Y.; Niu, B.C.; Qu, J.J. Large scale sand saltation over hard surface: A controlled experiment in still air. J. Arid. Land 2021, 13, 599–611. [Google Scholar] [CrossRef]
- Wang, Z.T.; Zhang, C.L.; Wang, H.T. Intermittency of aeolian saltation. Eur. Phys. J. 2014, 37, 126. [Google Scholar] [CrossRef]
- He, Q.; Zhao, J.F.; Nagashima, H. The distribution of sandstorms in the Taklimakan Desert. J. Arid. Land Study 1996, 1, 185–193. [Google Scholar]
- Yang, X.H. Observation and Parameterization on Dust Emission over the Taklimakan Desert. Ph.D. Thesis, Nanjing University of Information Science and Technology, Nanjing, China, 2019. [Google Scholar]
- Chen, W.N.; Dong, Z.B.; Yang, Z.T.; Han, Z.W.; Zhang, J.K.; Zhang, M.L. Threshold velocities of sand-driving wind in the Taklimakan Desert. Acta Geogr. Sin. 1995, 50, 360–367. [Google Scholar]
- Neuman, M.C. Effects of temperature and humidity upon the entrainment of sedimentary particles by wind. Bound.-Layer Meteorol. 2003, 108, 61–89. [Google Scholar] [CrossRef]
- Ravi, S.; Deoro, L.A. A field-scale analysis of the dependence of wind erosion threshold velocity on air humidity. Geophys. Res. Lett. 2005, 32, L21404. [Google Scholar] [CrossRef]
- Sankey, J.B.; Germino, M.J.; Glenn, N.F. Relationships of post-fire aeolian transport to soil and atmospheric conditions. Aeolian Res. 2009, 1, 75–85. [Google Scholar] [CrossRef]
- Yang, X.H.; Yang, F.; Zhou, C.L.; Mamtimin, A.; Huo, W.; He, Q. Improved parameterization for effect of soil moisture on threshold friction velocity for saltation activity based on observations in the Taklimakan Desert. Geoderma 2020, 369, 114322. [Google Scholar] [CrossRef]
- Meng, L.; Zhao, T.L.; He, Q.; Yang, X.H.; Mamtimin, A.; Yang, F.; Zhou, C.L.; Huo, W.; Wang, M.Z.; Pan, H.L.; et al. Climatic characteristics of floating dust and persistent floating dust over the Tarim basin in the recent 30 years. Acta Meteorol. Sin. 2022, 80, 1–12. [Google Scholar]
- Yuan, T.G.; Chen, S.Y.; Huang, J.P.; Wu, D.Y.; Lu, H.; Zhang, G.L.; Ma, X.J.; Chen, Z.Q.; Luo, Y.; Ma, X.H. Influence of dynamic and thermal forcing on the meridional transport of Taklimakan Desert dust in spring and summer. J. Clim. 2019, 32, 749–767. [Google Scholar] [CrossRef]


| Weather | Temperature (°C) | Vapor Pressure (kPa) | Wind Speed (m/s) | Soil Moisture (m3/m3) | Saltation Time (h) | Saltation Count (104) | |
|---|---|---|---|---|---|---|---|
| 08–09 | Dust days | 23.2 | 6.7 | 3.9 | 0.021 | 311.63 | 10,539.5 |
| Non-dust days | 10.3 | 3.3 | 1.4 | 0.019 | 79.88 | 858.3 | |
| 09–10 | Dust days | 19.4 | 4.7 | 3.1 | 0.020 | 270.61 | 6821.5 |
| Non-dust days | 9.4 | 3.1 | 1.5 | 0.018 | 53.68 | 574.8 |
| Saltation Time (h) | Saltation Count (104) | |
|---|---|---|
| Monthly wind speed (m/s) | 0.81 | 0.91 |
| Diurnal wind speed (m/s) | 0.94 | 0.74 |
Publisher’s Note: MDPI stays neutral with regard to jurisdictional claims in published maps and institutional affiliations. |
© 2022 by the authors. Licensee MDPI, Basel, Switzerland. This article is an open access article distributed under the terms and conditions of the Creative Commons Attribution (CC BY) license (https://creativecommons.org/licenses/by/4.0/).
Share and Cite
Yang, X.; Zhou, C.; Yang, F.; Meng, L.; Huo, W.; Mamtimin, A.; He, Q. Saltation Activity on Non-Dust Days in the Taklimakan Desert, China. Remote Sens. 2022, 14, 2099. https://doi.org/10.3390/rs14092099
Yang X, Zhou C, Yang F, Meng L, Huo W, Mamtimin A, He Q. Saltation Activity on Non-Dust Days in the Taklimakan Desert, China. Remote Sensing. 2022; 14(9):2099. https://doi.org/10.3390/rs14092099
Chicago/Turabian StyleYang, Xinghua, Chenglong Zhou, Fan Yang, Lu Meng, Wen Huo, Ali Mamtimin, and Qing He. 2022. "Saltation Activity on Non-Dust Days in the Taklimakan Desert, China" Remote Sensing 14, no. 9: 2099. https://doi.org/10.3390/rs14092099